1
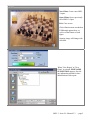
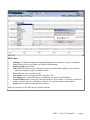
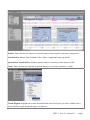
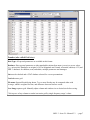
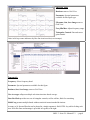
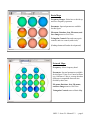
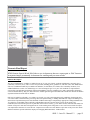
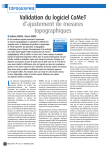
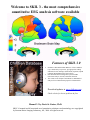
Welcome to SKIL 3 - the most comprehensive
quantitative EEG analysis software available
Features of SKIL 3.0
•
•
•
Normative adult and children databases of four conditions
(eyes closed and eyes open rest, age-appropriate reading
and math) for four montages (Referential, Laplacian, Hjorth
Laplacian & Brodmann source derivations).
Our advanced artifact management system includes
macrostate analysis, saccade, and motor detection.
The world’s most complete and exhaustive mathematical
analysis of local and network properties of human EEG.
Download updates at www.skiltopo.com
Check website for known problems & fixes
Manual 3.3 by David A. Kaiser, Ph.D.
SKIL 3.0 manual and all associated novel quantitative techniques and terminology are copyrighted
by Sterman-Kaiser Imaging Laboratory, Inc., 2008. All rights reserved.
INSTALLATION
Download and install
Microsoft's .Net (version 1.1) FIRST
then its Service Pack
then install current SKIL 3 beta.
Find URLs to .Net files and beta at skiltopo.com
Prior to beta installation, REMOVE the previous
SKIL3 beta using Control Panel;Add/Remove
Software.
SKIL 3 may not install under .Net 2.0. If you want to keep 2.0 on
your system, uninstall 2.0, (re)install 1.1 and service pack, install
SKIL 3 and then reinstall .Net 2.0. SKIL 3 can run in .Net 2.0, just
the installation is a problem.
BEFORE YOU ANALYZE EEG FILES, WE RECOMMEND:
Create a dedicated folder for SKIL Reports (e.g., C:\SKIL Reports) and a dedicated subfolder for each
client. Copy client EEG files into his or her own subfolder prior to running SKIL Analysis. When
prompted, save SKIL Report (.skr3) to the client’s subfolder along with figures & final clinical report.
SKIL 3 – beta 58 – Manual 3.3
- page 1
New Client: Create a new SKIL
3 report.
Open Client: Open a previously
saved SKIL 3 report.
Exit: Close screen
Clinic/clinician name encoded on
USB dongle appears here, as
well as on the bottom of each
figure.
Opening image will change with
each beta.
When "New Report" or "New
Client" is selected, FILE NAME
SUGGESTION appears. Provide
any information needed for later
identification of this report.
SKIL 3 – beta 58 – Manual 3.3
- page 2
1.
2.
3.
4.
5.
6.
7.
8.
.
9.
New Report: Ghosted - available when no report currently open.
Open Report: Opens previously saved SKR3 file.
Load EEG: Open EEG file (Lexicor or Neuronavigator file format).
… ASCII, Deymed, Grass-Comet file formats can also be opened
Save Report: Saves current work under .skr3 name set at opening. (see top line of Explorer).
Save Report As: Saves current work; allows new name via standard Windows dialog.
Review Figures: Open Figure Window (or double-click any figure listed in Explorer).
Generate Final Report: Saves client and recording and figures as HTML file. This file format can
be opened in Microsoft Word for editing and saving, emailing.
Exit: Closes program.
EEG files populate whenever data files are loaded into the explorer with the Open EEG Chart command.
To detach unneeded files, highlight and press Delete Selected Item. (This does not delete the actual file
from its subfolder but merely eliminates its link to the explorer.)
Figures populates when images of EEG charts or other figures are saved as images.
Spectral Results populate under designated condition labels once Fourier analysis is performed on EEG
selections (see below). There are 7 possible montages which can be analyzed and compared to normative
databases: Referential, Laplacian (weighted spherical harmonic expansion), Hjorth (local Laplacian), and
4 Brodmann montages (source derivations based on Laplacian analysis of functional brain area
heterogeneities). To the right of Spectral Results is information about the selected EEG data including
length of segment, tapering window used, time of recording, and comparison group. This information
prints out in Final Report. Comments can also be saved for the report.
SKIL 3 – beta 58 – Manual 3.3
- page 3
EEG Chart
1.
2.
3.
4.
.
5.
6.
7.
8.
.
9.
Montages: 18 different montages including Brodmann source solutions, average, and bipolars.
Gain in microvolts (or microamps for Laplacian & Brodmann).
Display Length up to 8 hours.
Select All selects entire record, marking all moments red. Red marks undergo Fourier analysis
unless also marked in purple to indicate artifact.
Clear All clears entire record of marks.
Save Marks stores red and purple marks in the DAT file.
Save Image stores current EEG chart, as configured, as a figure for Final Report.
Artifact buttons mark record using Chi-square analysis. Press Artifact 1 a few time to maximize
artifact capture. If this isn’t sufficient, try Artifact 2 or open the Artifacts menu (below).
Fourier runs all montages through fourier analysis.
Right click anywhere in the EEG chart to open Event menu.
SKIL 3 – beta 58 – Manual 3.3
- page 4
Manage Artifact
1.
Montage: Automatic artifact detection on Referential, Laplacian (SHE), or Hjorth Laplacian data.
2.
Blink Site: Electrode site used in detecting eye blinks (within Amplitudes grouping).
3.
Amplitudes Adjust values to tailor detection of blinks, saccades, motor, or spikes. Increase
sensitivity by lowering values (e.g., 100 to 70). Turn off by increasing value greatly (e.g., 100 to 1001).
Use saccade detection for Reading files only due to exponential sensitivity.
4.
Stationarity Compares each epoch to entire file on voltage distribution to detect unrepresentative
moments. Confidence level and tolerance (i.e., number of deviate channels allowed) are adjustable.
5.
Clear Marks: Amend (unchecked) or overwrite (checked) current marks.
6.
Deselect first: Mark as artifact the first XX seconds of all files to reduce state transitions.
7.
Mark Artifact runs all four amplitude detection schemes, stationarity, and deselection.
8.
Done closes window.
Restore saved marks
Marks are stored in auxiliary channels, typically X4. Select to restore marks (red, purple) to EEG Chart.
SKIL 3 – beta 58 – Manual 3.3
- page 5
Fourier: Data selections are subjected to spectral analysis and averaged for normative comparisons.
Send Selection: Indicate Task/Condition, Time of Day, Comparison Group (age-based).
Spectral Data Already Exists: Add new spectral results or overwrite previous spectral results.
Trend Data selections are subjected to spectral analysis to reveal time variation, i.e. trends
Create Figures Highlight one or more Spectral Results and select Figure you desire. (Double-click a
Spectral Result to open designated figure, see Options).
SKIL 3 – beta 58 – Manual 3.3
- page 6
Number (also called Grid view)
Data Type: All spectral parameters are available in this format.
Database: Show spectral parameter as either standard deviations from norm (z-score) or as raw values
(e.g., microvolts). Databases are original v2.05 for Magnitude and Comod, referential, adults (n=135) and
SKIL 3 databases for children, teens, and adults, multiple parameters and montages.
Stat must be checked and a STAT database selected for z-score presentations.
Vertical rotates grid.
File name: Spectral Result being shown. Two or more Results may be compared either with
Average, which is weighted for time, and difference between first two results.
.
Save Image captures grid. Manually adjust column and window size to desired size before saving.
Click top row of any column to reorder/sort entire grid by single frequency range’s values.
SKIL 3 – beta 58 – Manual 3.3
- page 7
Spectral Plots
Database same as Grid View.
Parameter: Spectral parameters
available for this figure type.
File name, Stat, Save Image same as
Grid View.
Freq Min/Max Adjust frequency range.
Triangular Controls Fine and coarse
gain controls.
Value in left top corner indicates sky-blue line in microvolts (or microamps).
Topometric
Frequency: Select frequency band.
Parameter: Spectral parameters available for this figure.
Database, Stat, Save Image, same as Grid View.
View Averages collapses multiple selections into time-based average.
Show Red Gain provides two sets of triangular controls, red for red line; black for remaining.
Multi-Freq presents multiple bands without statistical norms/standard deviations.
As many as 10 Spectral Results can be plotted in a single topometric. Hold CTRL key while clicking each
item. Each file name and montage is provided in Legend, to the right.
SKIL 3 – beta 58 – Manual 3.3
- page 8
Brain Maps
Frequency Ranges: Select how to divide up
and view frequency spectrum.
Parameter: Spectral parameters available
for this figure.
File name, Database, Stat, File name, and
Save Image same as Grid View.
Triangular Controls Fine and coarse gain
controls, and size control (with circle).
(Findings button still under development!)
Network Maps
Frequency: Select frequency band.
Parameter: Spectral parameters available
for this figure. Unity is to Comod as Phase
is to Coherence. Unity is, average absolute
difference in magnitude between sites
divided by their sum.
File name, Database, Stat, File name,
and Save Image same as Grid View.
Triangular Controls same as Brain Map.
SKIL 3 – beta 58 – Manual 3.3
- page 9
Figure Window
Remove Image: Deletes
item from list.
Move Up/Down: Moves
image in list.
Caption Provide
information about this
figure for Report.
Figures appear in Final
Report in order shown
here. Captions are saved
when Figure Window
closes.
OPTIONS Spectral Analysis
1.
2.
3.
4.
5.
6.
7.
8.
(closing Options saves changes)
Sampling Window: Use Blackman-Harris -92db for SKIL 3.0 database comparisons. Other windows provided for spectral export only.
Run Data Types: If checked, select Referential under Perform Fourier to run all montages.
Relative Magnitude: Indicate frequency range for Relative Magnitude and Spectral Entropy.
Window Tail Percent: Artifact parameter.
Epoch length Use 128 to be compatible with SKIL 3.0 databases.
Spectral Calculations Uncheck any parameters to eliminate and speed up processing.
Use Time of Day Databases Time of day ignored unless checked. (Currently TOD not available.)
Show BA 55 Display provides full Brodmann-55 head after BA Complete is run.
Figures
1.
2.
3.
4.
5.
6.
7.
8.
9.
10.
11.
12.
13.
Show Circles, Black circles, Increase Contrast, and Distance resolution are shown in image below.
Edit Band Select frequency Hz for Edit Band item on most figures here.
Topometric Select +/-2 or +/- 3 standard deviations around mean.
Grid View User Topometric value (2 or 3) and zeroes out all values between + or -.
Use Delta Prime Delta defaulted to 2-4 Hz; when checked, delta is 1-4 Hz
Show Noses/Ears on Brain and Network maps.
Nomenclature Use revised 10-20 labels wherever possible.
Brodmann Labels Provide labels to each Brodmann area.
Draw Optimal White Heads [deactivated currently]
Invert Curves Flip positivity/negativity of EEG charts.
Resize Data Grids Narrow columns for better image capture. This will slow Grid View.
Scale Images Set all Save Images to 800 pixel width.
Stermanize Bands Numerical intervals instead of Greek band labels (4-8 Hz instead of Theta).
EEG Weights Alters weights used in Laplacian & Brodmann computations. Spectral Adjustments Weights for spectral magnitude computation.
Artifact Mgmt
Min Space/Pre-Wave/Post-Wave Blink detection parameters Channel Failure Detects loss of single in channel. Use sparingly.
Save
1.
2.
3.
4.
5.
Global Field Power (GFP) Cut for (unadvised) seaming, with time for identifying GFP minima.
Seam Selection Instead of Clipping (i.e., leave as zeroes).
Save Marks Stores red and purple selections in one of five channels in .DAT file.
Show Name Suggestion Turn on or off.
Use Floating Point /Voltage Multiplier for ASCII import.
SKIL 3 – beta 58 – Manual 3.3
- page 10
Trends
Pre-sets Four pre-set site-groups.
Smooth Controls Smooth trend by moving
average.
Multi-Freq Selects multiple bands, one site
Small Gaps eliminates large empty spaces in
trends.
Data + 1 raise Comod trends so negative
values can be seen.
Save Image same as Grid View.
Freq. Select frequency band.
Site Five sites can be selected.
Triangular Controls Fine gain controls;
Maximum Value in top left corner.
Time in seconds on bottom
ADVANCED Options
Export provides ASCII export of all (Activity or Network) spectral parameters; or Notes.
Generators convert string of values to Maps for use in papers, presentations, etc.
Enable Advanced Options: Provide Advanced Menus such as Export and additional spectral
parameters in each figure. (Close and reopen Explorer for change to take effect.)
Label plus 19 values, comma delimited, creates SKIL brain or
Brodmann map.
Nineteen rows of label & 19 values for Network Map Generator
SKIL 3 – beta 58 – Manual 3.3
- page 11
Generate Final Report
HTML format. Open in Word, Edit Links to save in document, then save report again as .DOC format to
incorporate images permanently in document for emailing and your own records.
Database Description
The current adult database includes 135 adults from 20 to 75 years, 25% female; students and laboratory personnel (50%),
community volunteers (25%), and U.S. Air Force personnel, including pilots, ground crew, and staff (25%). One hundred and
fifteen (115) additional adults may be added to the database, for 250 adults (35% female, 40% community members). Two
childhood databases consist of 30 children ages 6-11 and 30 teenagers ages 12-19 years. All conditions are replicated and
averaged for each individual. Individuals completed a handedness inventory (Oldfield, 1971) and a questionnaire designed to
screen for medical history, drug use, and recent stress. Adults signed an approved institutional consent form. Parents of children
signed an informed consent form for children.
EEG was recorded for replicated 2- to 3-minute eyes closed, eyes open, and engagement (task) conditions. Engagement tasks
were either audio-visual information processing and visuo-spatial tracking, or reading and math tasks. Degree of challenge was
deemed more important than specific task demands. Children and teenagers completed age-appropriate reading and math tasks.
To control for circasemidian (about a half day) and ultradian (about 90-120 min) effects, 21time-of-day norms were
established, one-hour intervals spaced every half hour from 9 AM to 7 PM (e.g., 8:30 AM-9:30 AM, 9:00 AM-10:00 AM). The
number of subjects in each interval ranged from 20+ in the morning and evening hours to 40+ from noon to 5 PM. No subject
was sampled more than once in a time interval. Comparisons to either active task did not require time-of-day correction. Both
database and client spectral estimations employed overlapping Blackman-Harris -92db windows.
SKIL 3 – beta 58 – Manual 3.3
- page 12