1
6LPUDG (<
3RUWDEOH VFLHQWLILF HFKR VRXQGHU
,QVWUXFWLRQ PDQXDO
6HFWLRQV
7KLV ERRN LV WKH ,QVWUXFWLRQ PDQXDO IRU WKH %DVH YHUVLRQ (< ,W GHVFULEHV KRZ WR LQVWDOO
WKH YDULRXV XQLWV XVHG E\ WKH (< V\VWHP WR PDLQWDLQ WKHP DQG WR RSHUDWH WKH V\VWHP
VDIH DQG HIILFLHQWO\
6\VWHP IDPLOLDUL]DWLRQ
7KLV VHFWLRQ FRQWDLQV D GHVFULSWLRQ RI WKH YDULRXV V\VWHP PRGXOHV
,QVWDOODWLRQ DQG V\VWHP WHVW
7KLV VHFWLRQ GHVFULEHV KRZ WR LQVWDOO WKH V\VWHP KDUGZDUH DQG VRIWZDUH DQG KRZ WR
WHVW LW
2SHUDWLRQ
7KLV VHFWLRQ FRQWDLQV LQIRUPDWLRQ DERXW WKH LQWHUDFWLYH PHQX V\VWHP WKH HFKRJUDP
OD\RXW RQ WKH GLVSOD\ DQG SULQWHU WKH ILOH V\VWHP RSHUDWLRQ H[DPSOHV DQG GHVFULSWLRQ
RI HDFK PHQX
7KHRU\ RI RSHUDWLRQ
7KLV VHFWLRQ GHVFULEHV VRPH RI WKH WKHRU\ EHKLQG WKH PHDVXUHPHQWV SHUIRUPHG E\ WKH
(< ERWWRP GHWHFWLRQ HFKRJUDP JHQHUDWLRQ HFKR LQWHJUDWLRQ DQG WDUJHW VWUHQJWK
7HOHJUDPV DQG UHPRWH FRQWURO
7KLV VHFWLRQ GHVFULEHV WKH WHOHJUDP W\SHV XVHG E\ WKH V\VWHP WR FRPPXQLFDWH ZLWK RWKHU
FRPSXWHUV RU QHWZRUNV
&DOLEUDWLRQ
7KLV VHFWLRQ FRQWDLQV FDOLEUDWLRQ SURFHGXUHV SURFHGXUHV WR GHWHUPLQH WKH EHDP
FRPSHQVDWLRQ LQ D VSOLW EHDP V\VWHP DQG SURFHGXUHV IRU QRLVH PHDVXUHPHQWV DW VHD
0DLQWHQDQFH
7KLV VHFWLRQ GHVFULEHV KRZ WR SHUIRUP WKH SHULRGLF SUHYHQWLYH DQG FRUUHFWLYH
PDLQWHQDQFH
'UDZLQJV
$SSHQGL[ 6+2: &RQYHUW %LQDU\ (< WHOHJUDPV WR
$6&,,
*
,
6LPUDG (< %DVH YHUVLRQ
5HPDUNV
5HIHUHQFHV
1RQH
7KH UHDGHU
7KLV RSHUDWRU PDQXDO LV LQWHQGHG WR EH XVHG E\ WKH V\VWHP RSHUDWRU +HVKH VKRXOG EH
H[SHULHQFHG LQ WKH RSHUDWLRQ RI SRVLWLRQLQJ V\VWHPV RU VKRXOG KDYH DWWHQGHG D WUDLQLQJ
FRXUVH
1RWH
7KLV PDQXDO LQFOXGHV VHFWLRQV WKDW PD\ EH UHYLVHG LQGLYLGXDOO\ ,Q WKH HYHQW RI D UHYLVLRQ
WR DQ\ SDUW RI WKLV PDQXDO WKLV ´&RYHU DQG &RQWHQWVµ VHFWLRQ ZLOO EH UHSODFHG
,,
*
,QVWUXFWLRQ PDQXDO
'RFXPHQW UHYLVLRQV
5HY
'DWH
:ULWWHQ E\
&KHFNHG E\
$SSURYHG E\
$
&/
(6W
+6
%
&/
5/1
+6
&
&/
+6
5%
'
&/
+6
5%
(
&/
+6
5/1
)
&/
+6
5/1
*
&/
*+0
(67
7KH RULJLQDO VLJQDWXUHV DUH UHFRUGHG LQ WKH FRPSDQ\·V ORJLVWLF GDWDEDVH
7R DVVLVW XV LQ PDNLQJ LPSURYHPHQWV WR WKH SURGXFW DQG WR WKLV PDQXDO ZH ZRXOG
ZHOFRPH FRPPHQWV DQG FRQVWUXFWLYH FULWLFLVP 3OHDVH VHQG DOO VXFK LQ ZULWLQJ RU E\
(PDLO WR
6LPUDG $6
'RFXPHQWDWLRQ 'HSDUWPHQW
32%R[ 1 +RUWHQ
1RUZD\
RU (PDLO
GRNDYG#VLPUDGQR
*
,,,
6LPUDG (< %DVH YHUVLRQ
5HIHUHQFHV
7KH LQIRUPDWLRQ RQ WKLV SDJH LV LQWHQGHG IRU LQWHUQDO XVH
'RFXPHQWV
6HFW
7LWOH
/RF
)LOH
3QR5HY
&RYHU DQG FRQWHQWV
$$
*
6\VWHP IDPLOLDUL]DWLRQ
$$
%
,QVWDOODWLRQ DQG V\VWHP WHVW
$$
&
2SHUDWLRQ
$$
&
7KHRU\ RI RSHUDWLRQ
$$
$
7HOHJUDPV DQG UHPRWH FRQWURO
$$
$
0DLQWHQDQFH
$$
%
&DOLEUDWLRQ
$$
(
'UDZLQJV
$$
%
$SSHQGL[ 6+2: &RQYHUW ELQDU\ WHOHJUDPV
$$
$
WR $6&,,
'RFXPHQW KLVWRU\
5HY $
)LUVW HGLWLRQ FRQWDLQLQJ RQO\ VHFWLRQ ´2SHUDWLRQµ DQG VHFWLRQ ´,Q
VWDOODWLRQ V\VWHP WHVW DQG FDOLEUDWLRQµ 6HFWLRQ RQO\ FRQWDLQV WKH
FKDSWHU RQ VRIWZDUH LQVWDOODWLRQ
5HY %
&RPSOHWH PDQXDO EDVHG RQ VRIWZDUH YHUVLRQ 5HY &
6RIWZDUH YHUVLRQ S &KDQJHV LQ VHFWLRQV ´6\VWHP IDPLOLDUL]DWLRQµ
´2SHUDWLRQµ ´'HVFULSWLRQ RI WHOHJUDPV DQG UHPRWH FRQWUROµ DQG DSSHQ
GL[ ´(. (< OREH FDOLEUDWLRQ SURJUDPµ
5HY '
6RIWZDUH YHUVLRQ +HDGHUV DQG IRRWHUV KDYH EHHQ FKDQJHG DFFRUG
LQJ WR WKH QHZ GRFXPHQWDWLRQ VWDQGDUG (DFK VHFWLRQ KDV EHHQ JLYHQ D
QHZ 3QXPEHU DQG UHJLVWUDWLRQ QXPEHU
5HY (
6RIWZDUH YHUVLRQ &KDQJHV LQ WKH FDOLEUDWLRQ SURFHGXUHV ZKLFK
KDYH EHHQ PRYHG IURP WKH ´,QVWDOODWLRQµ VHFWLRQ WR LWV RZQ VHFWLRQ
7KLV VHFWLRQ LV QRZ D FRPPRQ PRGXOH IRU ERWK WKH (< DQG WKH (.
7KH ´0DLQWHQDQFHµ DQG ´'UDZLQJµ VHFWLRQV KDYH DOVR EHHQ PDGH
LQWR FRPPRQ PRGXOHV IRU WKH (< DQG WKH ($ 3
5HY )
6RIWZDUH YHUVLRQ 5HY *
$ QHZ VRIWZDUH LQVWDOODWLRQ URXWLQH KDV EHHQ LQWURGXFHG LQ WKH ´,Q
VWDOODWLRQ DQG V\VWHP WHVWµ VHFWLRQ 6HFWLRQ LV WKXV LVVXHG LQ UHYLVLRQ
& 5HIHU WR (0 *
,9
*
Simrad EY 500
SYSTEM FAMILIARIZATION
P3400E / 857-160017 / 4AA062
This section contains a description of the system modules of the EY 500 sounder
system. It also contains a simplified block diagram and technical specifications.
P3400/B
1
System familiarization
Document revisions
Rev
A
2
Documentation
department
Hardware/Software
Design
Project/Product
Management
Date
Sign
Date
Sign
Date
Sign
25.08.95
CL
25.08.95
HS
31.08.95
RB
P3400/B
Simrad EY 500
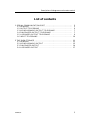
List of contents
1 INTRODUCTION . . . . . . . . . . . . . . . . . . . . . . . . . . . . . . . . . . . . . . . . . . .
1.1 GENERAL . . . . . . . . . . . . . . . . . . . . . . . . . . . . . . . . . . . . . . . . . . . . .
1.2 DESCRIPTION OF THE EQUIPMENT . . . . . . . . . . . . . . . . . . . . . .
1.2.1 Configuration . . . . . . . . . . . . . . . . . . . . . . . . . . . . . . . . . . . . . . .
1.2.2 Simplified block diagram . . . . . . . . . . . . . . . . . . . . . . . . . . . . . .
1.2.3 Interconnections . . . . . . . . . . . . . . . . . . . . . . . . . . . . . . . . . . . . .
5
5
6
6
7
8
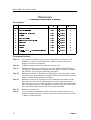
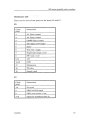
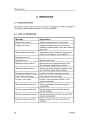
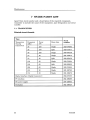
2 TECHNICAL SPECIFICATIONS . . . . . . . . . . . . . . . . . . . . . . . . . . . . . . .
9
P3400/B
3
System familiarization
Document history
(The information on this page is for Simrad’s internal use)
Rev. A Original issue. First edition as module. Was section 1 of P2473E.
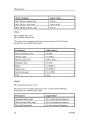
Rev. B Change in text on page 10 and more detailed printer specifications on
page 13.
4
P3400/B
Simrad EY 500
1 INTRODUCTION
1.1 GENERAL
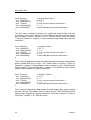
The SIMRAD EY 500 scientific echo sounder is designed for biomass estimation
where portability and low power consumption is important. This highperformance, portable scientific sounder system is the result of combining stateof-the-art echo sounder technology with the latest achievements in personal
computers (PCs).
The EY 500 system basically consists of power source, transducer, the EY 500
transceiver, a personal computer (desktop, laptop, or notebook) and an optional
colour printer. The EY 500 transceiver is housed in a cast aluminium case
designed for the environment encountered in portable use. Emphasis has been
placed on simple installation and ease of operation. A variety of computer
choices is allowed by using standard Centronics parallel interface between
EY 500 transceiver and PC.
Typical applications for the EY 500 are:
Fish stock assessment in lakes, rivers and shallow waters
Fish behaviour studies (the split-beam method allows tracking and counting
of individual fish)
Monitoring biomass from buoys
Pollution monitoring
Dam surveillance systems
The collected data is processed on-line for generation of colour echograms and
tables giving fish densities in up to 10 depth layers. The echogram is presented
on the PC display and on an optional colour printer. A file system allows storing
of selected data for further analysis by means of the Simrad EP 500 Echo Postprocessing System. Sample data may also be stored on hard disk and replayed
off-line for easy regeneration or demonstration of survey echo data. A navigation
instrument may be connected to the PC serial port, and position data for logging
of the survey track can be combined with the measured echo data. Remote
control of the EY 500 and output telegrams through serial port are used for
online monitoring of acoustic data.
The EY 500 system includes substantial processing power. Bottom detection,
echo integration and target strength algorithms are carried out solely in
software. The concept used in the receiver design provides an instantaneous
dynamic range of 160 dB. At the same time the absolute amplitude measurement accuracy is very high, and combined with a low self-noise this assures
correct measurement of all targets.
P3400/B
5
System familiarization
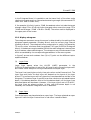
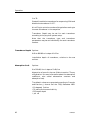
1.2 DESCRIPTION OF THE EQUIPMENT
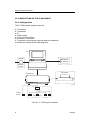
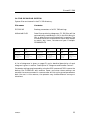
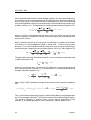
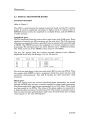
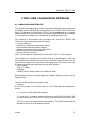
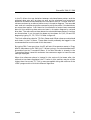
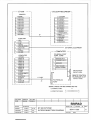
1.2.2 Configuration
The EY 500 sounder system comprises
Transducer
Transceiver
PC
Power supply
Colour printer (option)
Navigation instrument
Transducer multiplexing (requires external hardware)
Modem for remote control and telegrams
PC
Modem
Navigation
instrument
Remote
control
HP printer
Transceiver
EY 500
(CD472)
Mux
Transducer
Transducers
Figure 1 EY 500 system modules.
6
P3400/B
Simrad EY 500
A range of single-beam transducers is available for different frequencies.
Additionally, dedicated split-beam transducers are available for 38, 70 and
120 kHz for measuring target strength.
The minimum requirements for the PC to be used with the EY 500 transceiver
are listed under the Technical Specifications.
The EY 500 transceiver requires a supply voltage of 10 to 40 VDC and can be
powered from a battery or from an AC power source via an AC/DC converter.
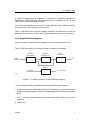
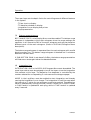
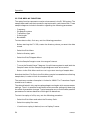
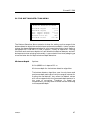
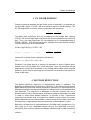
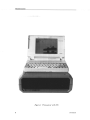
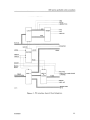
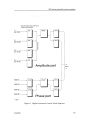
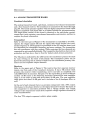
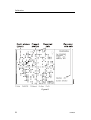
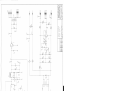
1.2.4 Simplified block diagram
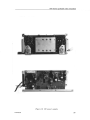
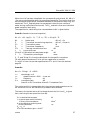
Figure 2 shows a simplified block diagram of the transceiver electronics.
The EY 500 transceiver unit comprises four printed circuit boards:
Analog
Transceiver
Digital
Transceiver
PCInterface
Transducer
PC
Power
Power
Shut-down
10 - 40V DC
(CD473)
Figure 2 EY 500 transceiver, simplified block diagram.
C An analog transceiver module containing transmitter and receivers
C A digital transceiver module performing A/D-conversion, log. amplitude table
lookup and measurement of electrical phase (applies to split-beam operation
only).
C A PC interface module supporting transceiver and Centronics printer
interface.
Power unit
P3400/B
7
System familiarization
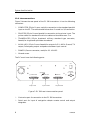
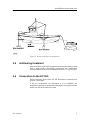
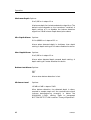
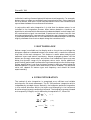
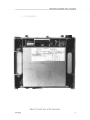
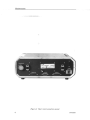
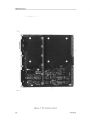
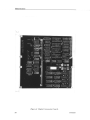
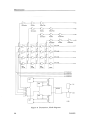
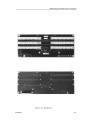
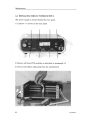
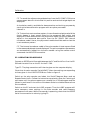
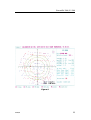
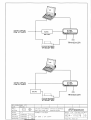
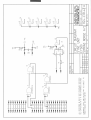
1.2.6 Interconnections
Figure 3 shows the rear panel of the EY 500 transceiver. It has the following
connectors:
*
COMPUTER (25-pin D-conn. male) for connection to the standard parallel
input on the PC. The cable should be less than 1 m and is a 1/1 connection.
*
PRINTER (25-pin D-conn female) for connection to the printer input. The
printer cable is a standard Centronics cable and should be max. 5 m.
*
TRANSDUCER (12-pin Amphenol military standard type connector,
female) for single and split beam transducer.
*
AUXILIARY (15-pin D-conn female) for output of +5 V, ±20 V. Ground, TX
output, 2xfrequency output and power shutdown input control.
*
POWER (Cannon connector, male) for 10 - 40 VDC.
*
Ground screw.
The PC must have the following ports:
ON
TRANSDUCER
OFF
POWER
10 - 40 V Dc
(Ground)
COMPUTER
AUXILIARY
PRINTER
(CD474)
25 pin male
15 pin female
25 pin female
Figure 3 EY 500 rear interconnection panel.
*
Centronics port for connection to the EY 500 transceiver
*
Serial port for input of navigation data/or remote control and output
telegrams.
8
P3400/B
Simrad EY 500
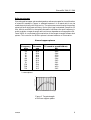
2 TECHNICAL SPECIFICATIONS
Common specifications for single-beam and split-beam versions:
Frequencies:
38, 70, 120, 200 and 710 kHz
Transmitting power:
50 to 250 W, see table on next page.
Range:
1, 5, 10, 25, 50, 100, 150, 250, 500, 1000, 1500
and 2500 m
Phasing:
0 to 2500 m in 1-m increments.
Display:
Echogram in 12 colours (3 dB per colour)
Colour scale related to true volume backscattering strength or target strength.
Scope presentation of echo signal amplitude
Layers:
Up to 10 surface or bottom locked layers.
Integrator:
Virtually unlimited dynamic range. Independent integration within each layer.
Data storage:
Selected EY 500 data and echogram written
to hard disk in real time.
Calculation intervals:
Ping, time or simulated speed.
Replay function:
For storing and replaying sample data.
Specifications valid for split-beam version only:
Target strength analyzer: 24 TS classes (1.5 dB per class) in up to 10 layers
given in tables
Target’s position in the beam.
Lobe compensated TS values
Sample angle data and echo trace data in the
super layer
Data storage:
P3400/B
TS distribution in preselected layers.
9
System familiarization
Options:
Colour printer:
SIMRAD EP 500 Echo
Postprocessing System:
Echogram in 12 colours (3 dB per colour)
Tables available on printer for Sa values and
TS distribution in preselected layers.
Postprocessing system developed by Lindem
Data Acquisition. Calculates TS distribution
from single beam data (Craigs and Forbes
statistical method). Echograms stored in disk
files can be presented on display and printer.
On-line monitoring of echograms can be done
via serial interface. Sa and TS values can be
calculated in selectable layers off-line.
Minimum PC specification:
386 AT, 8 MByte RAM, 80 MByte hard disk,
Numerical co-processor, Serial port for
navigation data input or remote control and
output telegrams. Printer port for EY 500
transceiver unit. Note that the parallel
interface must be of standard type in order to
work properly with the EY 500.
Option: storage on streamer (Backpack).
Power system:
DC voltage 10 - 40 VDC
AC voltage 110-220 VAC (via AC/DC adapter)
10
P3400/B
Simrad EY 500
Transceiver:
Supply voltage:
10 to 40 VDC
Power consumption:
Operating temperature:
approx. 15 W
0 - 55E
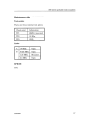
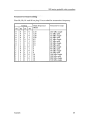
Transceiver parameters:
Frequency
(kHz)
Beam
type
Power
(W)
Pulse duration
(ms)
Bandwidth (kHz)
Narrow
Wide
Resolution
(cm)
37.878
Single
250
0.3
1.0
3.0
0.38
3.8
10
70.422
"
50
0.2
0.6
2.0
0.7
7.0
5
119.047
"
60
0.1
0.3
1.0
1.2
12.0
3
200.000
"
60
0.06
0.2
0.6
2.0
20.0
2
714.286
"
50
0.06
0.2
0.6
7.1
71.4
2
37.878
Split
250
0.3
1.0
3.0
0.38
3.8
10
70.422
"
50
0.2
0.6
2.0
0.7
7.0
5
119.047
"
60
0.1
0.3
1.0
1.2
12.0
3
P3400/B
11
System familiarization
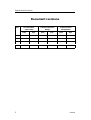
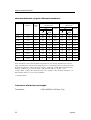
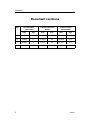
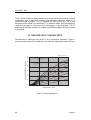
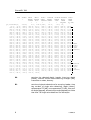
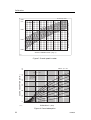
Maximum detection range for different transducers:
Type
Beamwidth
(degrees)
Max. detection depth
Freshwater (m)
Cable
length
(m)
fish
Max detection depth
Seawater (m)
bottom
TS = !30
dB
!50 dB
TS =
fish
bottom
TS = !30
dB
!50 dB
TS =
38-22
11x22
15
500
170
3000*
360
140
1900
ES 70-11
11x11
15
440
150
1500*
260
120
950
70-24
11x11
15
480
170
1500*
270
130
950
120-25
11x11
25
440
170
900*
230
120
650
ES120-7
7x7
20
500
210
900*
260
140
700
200-7
7x7
15
350
150
600*
190
100
490
200-28
7x7
25
350
150
600*
190
100
490
200-30
30x30
15
110
40
600*
85
35
290
710-30
5x5
15
75
40
160
65
35
130
710-36
2.5x2.5
15
95
60
180
80
50
150
These transducers can be hull-mounted, foil-mounted or provisionally mounted on a rod. The
range calculations are valid for water temperature 10EC, Sound absorption according to Francois
& Garrison, JASA Dec. 1982, Fish target strength !30 dB and !50 dB, Bottom backscattering
strength -10 dB per sq. m, Acoustic noise = SPL-DI+M+B (dB re 1 V) SPL = 142 20 log f (dB re 1 FPa per Hz). Electrical noise -189 + B (dB re 1 W), Detection threshold = 10
dB. Seawater salinity 3.5%, 0.3% for freshwater.
* = Sample limited
Transceiver dimensions and weight:
Transceiver:
12
L340 x W350 x H141 mm, 7 kg
P3400/B
Simrad EY 500
Printer specifications:
PaintJet
DeskJet, type 850C
Paper width
210 mm
210mm
Resolution
720 pixels across paper
720 pixels across paper
Supply voltage
187 - 264 VAC 50/60 Hz
90 - 132 VAC 50/60 Hz
21 - 31 VDC
100-240 VAC 50/60 Hz
Power consumption
20 W max.
48 W max.
Operating temperature
0 - 55EC
5 - 40EC
Dimensions
W442 x H98 x D302 (mm)
W444 x H226 x D396 (mm)
Weight
5 kg
6.5 kg
P3400/B
13
System familiarization
14
P3400/B
,QVWDOODWLRQ DQG V\VWHP WHVW
$$ (< ,QVWDOODWLRQ
DQG V\VWHP WHVW
7KLV VHFWLRQ FRQWDLQV WKH LQVWDOODWLRQ SURFHGXUHV IRU WKH
(< HFKR VRXQGHU V\VWHP ,W SUHVHQWV D V\VWHP WHVW
SURFHGXUH DQG GHVFULEHV KRZ WR LQVWDOO WKH VRIWZDUH
&
,
6LPUDG (< 'RFXPHQW UHYLVLRQV
5HY
'DWH
:ULWWHQ E\
&KHFNHG E\
$SSURYHG E\
$
&/
+6
5%
%
&/
+6
5/1
&
&/
*+0
(67
'
7KH RULJLQDO VLJQDWXUHV DUH UHFRUGHG LQ WKH FRPSDQ\·V ORJLVWLF GDWDEDVH
,,
&
,QVWDOODWLRQ DQG V\VWHP WHVW
7DEOH RI FRQWHQWV
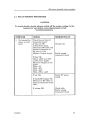
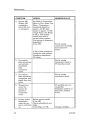
,1752'8&7,21 ,QVWDOODWLRQ SURFHGXUHV (/(&75,&$/ ,167$//$7,21 &RQQHFWLRQV 3RZHU FRQVLGHUDWLRQV *URXQGLQJ 0RXQWLQJ WKH SULQWHU 75$16'8&(5 ,167$//$7,21 ,QWURGXFWLRQ +XOO PRXQWHG WUDQVGXFHUV $OWHUQDWLYH WUDQVGXFHU DUUDQJHPHQWV 7UDQVGXFHU IRLO IRU WRZLQJ $QWLIRXOLQJ WUHDWPHQW &RQQHFWLRQ WR WKH (< 62)7:$5( ,167$//$7,21 ,QWURGXFWLRQ 50; ERRW VHVVLRQ ,QVWDOODWLRQ RQ KDUGGLVN 6\VWHP HUURU GLDJQRVWLFV 6<67(0 7(67 &
,,,
6LPUDG (< 'RFXPHQW KLVWRU\
7KH LQIRUPDWLRQ RQ WKLV SDJH LV IRU LQWHUQDO XVH
5HY$
)LUVW HGLWLRQ DV PRGXOH :DV VHFWLRQ RI 3(
5HY%
&KDQJHV LQ WKH GHVFULSWLRQ RI VRIWZDUH LQVWDOODWLRQ 7KH FKDSWHU DERXW
FDOLEUDWLRQ KDV EHHQ UHPRYHG DQG LV QRZ LQFOXGHG LQ WKH VHFWLRQ ´&D
OLEUDWLRQ RI WKH (. (< µ D FRPPRQ PRGXOH IRU WKH (. DQG (< HFKR VRXQGHUV
5HY&
6RIWZDUH LQVWDOODWLRQ FKDSWHU XSGDWHG 'RFXPHQW FRQYHUWHG WR ,QWHU
OHDI DQG QHZ VWDQGDUG OD\RXW 5HIHU WR (0 &
,9
&
,QVWDOODWLRQ DQG V\VWHP WHVW
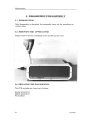
,1752'8&7,21
,QVWDOODWLRQ SURFHGXUHV
7KH LQVWDOODWLRQ RI WKH (< V\VWHP FRPSULVHV
'HFLGLQJ WKH ORFDWLRQV IRU WKH XQLWV
0DNLQJ FRQQHFWLRQV EHWZHHQ (< WUDQVFHLYHU XQLW 3&
SULQWHU WUDQVGXFHU DQG SRZHU VRXUFH
,QVWDOOLQJ WKH VRIWZDUH ZLWK WKH (< ERRW DQG LQVWDOODWLRQ
GLVNV ZKLFK DUH SDUW RI WKH GHOLYHU\
7HVWLQJ WKH V\VWHP
&
6LPUDG (< (/(&75,&$/ ,167$//$7,21
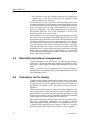
&RQQHFWLRQV
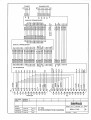
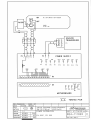
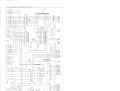
5HIHU WR GUDZLQJV LQ VHFWLRQ µ'UDZLQJVµ
5HI (< 6\VWHP LQWHUFRQQHFWLRQ GLDJUDP 5HI (< 3RZHU GLVWULEXWLRQ 5HI (< 3RZHU V\VWHP 7KH IROORZLQJ FDEOHV DQG SOXJV DUH LQFOXGHG LQ WKH GHOLYHU\
3RZHU FDEOH IRU EDWWHU\ 6LPUDG VWRFN QXPEHU &DEOH IRU FRQQHFWLRQ EHWZHHQ WKH &20387(5 SOXJ RQ WKH
UHDU SDQHO RI WKH (< WUDQVFHLYHU XQLW DQG WKH VWDQGDUG
SDUDOOHO LQSXW RQ WKH 3& 6LPUDG VWRFN QXPEHU 3OXJ IRU WUDQVGXFHU FDEOH
3RZHU FRQVLGHUDWLRQV
7KH (< V\VWHP PD\ EH SRZHUHG IURP HLWKHU DQ $& RU D '&
VRXUFH 5HIHU WR GUDZLQJ (< 3RZHU V\VWHP ,Q WKH FDVH RI DQ
$& SRZHU VRXUFH RSWLRQ DOO FRPSRQHQWV LQ WKH V\VWHP VKRXOG
XVH WKH $&'& RULJLQDO HTXLSPHQW DGDSWRUV WR WKH (< WUDQVFHLYHU XQLW 3& DQG SULQWHU XQLW :KHQ RQO\ EDWWHU\ SRZHU LV
DYDLODEOH WKH (< VKRXOG EH FRQQHFWHG GLUHFWO\ WR WKH EDWWHU\
7KH 3& DQG WKH SULQWHU VKRXOG DOVR EH SRZHUHG GLUHFWO\ RU
WKURXJK '&'& FRQYHUWHUV '&$& FRQYHUWHUV PD\ EH XVHG
SURYLGHG WKH PHDVXUHG QRLVH OHYHO LV DFFHSWDEOH 7KH EHVW VROXWLRQ
IRU EDWWHU\ OLIH DQG QRLVH FRQVLGHUDWLRQV ZLOO EH WR DSSO\ SRZHU
GLUHFWO\ WR HDFK V\VWHP XQLW ZKHQHYHU SRVVLEOH
*URXQGLQJ
5HPHPEHU WR FRQQHFW WKH JURXQG VFUHZ RQ WKH UHDU SDQHO RI WKH (<
7UDQVFHLYHU 8QLW WR WKH EHVW DYDLODEOH JURXQG 0DNH WKH
FDEOLQJ DV VKRUW DV SRVVLEOH 2EVHUYH WKH HIIHFW RI JURXQGLQJ E\
UHDGLQJ 1RLVH LQ WKH 7HVW 0HQX 7UDQVFHLYHU
0RXQWLQJ WKH SULQWHU
7KH SULQWHU PXVW EH PRXQWHG LQ D QHDU KRUL]RQWDO SRVLWLRQ IRU
SURSHU ORQJ WHUP RSHUDWLRQ RI WKH MHW LQN KHDG
&
,QVWDOODWLRQ DQG V\VWHP WHVW
75$16'8&(5 ,167$//$7,21
,QWURGXFWLRQ
7KH (< FDQ XVH D QXPEHU RI GLIIHUHQW WUDQVGXFHU W\SHV DQG
WKHUHIRUH WUDQVGXFHU GUDZLQJV DUH QRW LQFOXGHG LQ WKLV PDQXDO
7UDQVGXFHU GUDZLQJ ZLWK LQVWDOODWLRQ SURFHGXUH LV LQFOXGHG ZLWK
HDFK WUDQVGXFHU GHOLYHU\ 6LPUDG FDQ VXSSO\ GUDZLQJV RI EOLVWHUV
RI GLIIHUHQW VL]HV XSRQ UHTXHVW 0RXQWLQJ GHVFULSWLRQ IRU
WUDQVGXFHU IRLO FDQ DOVR EH VXSSOLHG
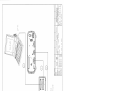
7KH PRXQWLQJ SURFHGXUHV UHFRPPHQGHG E\ 6LPUDG DUH JHQHUDOO\
DSSURYHG E\ 'HW QRUVNH 9HULWDV (DFK LQGLYLGXDO LQVWDOODWLRQ
VKRXOG QHYHUWKHOHVV EH LQVSHFWHG DQG DSSURYHG ORFDOO\
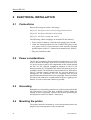
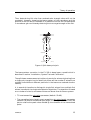
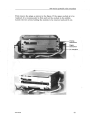
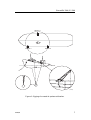
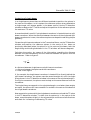
)LJXUH 5HFRPPHQGHG WUDQVGXFHU ORFDWLRQ
+XOO PRXQWHG WUDQVGXFHUV
7KH HFKR VRXQGLQJ SHUIRUPDQFH GHSHQGV WR D ODUJH H[WHQW RQ WKH
WUDQVGXFHU ORFDWLRQ ZLWK UHVSHFW WR K\GURG\QDPLF IORZ QRLVH DQG
SURSHOOHU QRLVH 7KH JHQHUDO UXOHV JLYHQ EHORZ VKRXOG EH DGKHUHG
WR DV FORVH DV SRVVLEOH $OVR UHIHU WR )LJXUH 7KH WUDQVGXFHU FDEOH PXVW EH UXQ LQ VWHHO SLSHV DOO WKH ZD\ XS WR
WKH HFKR VRXQGHU
7R PLQLPL]H WKH SURSHOOHU LQWHUIHUHQFH WKH WUDQVGXFHU VKRXOG EH
ORFDWHG VR WKDW WKH YHVVHO·V KXOO DFWV DV D VFUHHQ EHWZHHQ WKH
SURSHOOHU DQG WKH WUDQVGXFHU
0RXQW WKH WUDQVGXFHU DW D ORFDWLRQ EHWZHHQ DQG RI WKH
YHVVHO·V OHQJWK PHDVXUHG IURP WKH ERZ
,QFOLQH WKH WUDQVGXFHU VR WKDW D OLQH RI VLJKW DORQJ WKH
WUDQVGXFHU UDGLDWLQJ VXUIDFH ZLOO SDVV XQGHU WKH NHHO EHORZ WKH
SURSHOOHU
7R DYRLG FDYLWDWLRQ QRLVH WKH SURSHOOHU PXVW EH IUHH IURP
GDPDJHV DQG URXJKQHVV $PSOH VSDFLQJ VKRXOG H[LVW EHWZHHQ
WKH SURSHOOHU EODGHV DQG WKH KXOO
&
6LPUDG (< 2Q ZRRGHQ YHVVHOV WKH SURSHOOHU QRLVH PD\ EH UHGXFHG E\
FXWWLQJ DZD\ ZRRG DERYH DQG EHORZ WKH SURSHOOHU 6KDUS
HGJHV VKRXOG EH ZHOO URXQGHG
7KH DHUDWHG ZDWHU FORVH WR WKH KXOO FDQ EH GLVDVWURXV WR WKH HFKR
VRXQGHU SHUIRUPDQFH 7KH WUDQVGXFHU VKRXOG WKHUHIRUH EH ORFDWHG
LQ D EOLVWHU LQ VRPH GLVWDQFH IURP WKH NHHO RU SUHIHUDEO\ LQ D ER[
NHHO RU D ZLGHQHG SDUW RI VDPH 7KH ORFDOL]DWLRQ RI D EOLVWHU LV
DOZD\V D FRPSURPLVH 7KH VKDSH DQG GLPHQVLRQV RI WKH EOLVWHU
ZLOO GHSHQG XSRQ WKH VL]H RI WKH WUDQVGXFHU DV ZHOO DV WKH
WUDQVYHUVH VKDSH RI WKH YHVVHO·V KXOO
$ JHQHUDO UXOH LV QRW WR KDYH WKH GHHSHVW SDUW RI WKH EOLVWHU EHORZ
WKH NHHO DQG WKDW WKH KHLJKW RI WKH EOLVWHU VKRXOG DOZD\V EH PP RU PRUH GRZQ IURP WKH YHVVHO·V KXOO 7KH ORQJLWXGLQDO D[LV RI
WKH EOLVWHU VKRXOG KDYH D WRH LQ RI DSSUR[LPDWHO\ WR GHJUHHV
WRZDUGV WKH ERZ DQG WKH ERWWRP PXVW EH WLOWHG XS WR GHJUHHV
IRUZDUG UHODWLYH WR WKH YHVVHO·V ZDWHU OLQH 7KH EOLVWHU FHQWUH OLQH
ZLOO GHSHQG RQ WKH VL]H RI WKH YHVVHO DQG LV QRUPDOO\ PP RII WKH YHVVHO·V FHQWUH OLQH 1RLVH PD\ EH UHGXFHG E\ URXQGLQJ
VKDUS HGJHV 3URWUXGLQJ SDUWV SLSH RXWOHWV HWF ZKLFK PD\
JHQHUDWH K\GURG\QDPLF QRLVH VKRXOG EH DYRLGHG LQ IURQW RI DQG
RQ WKH VLGH RI WKH WUDQVGXFHU
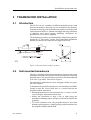
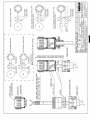
$OWHUQDWLYH WUDQVGXFHU DUUDQJHPHQWV
6LPUDG WUDQVGXFHUV DUH ZHOO VXLWHG IRU GLIIHUHQW DSSOLFDWLRQV
6RPH KDYH D VKRUW WKUHDGHG WXEH DURXQG WKH WUDQVGXFHU FDEOH
RWKHUV KDYH D ERDW VKDSHG KRXVLQJ ZLWK PRXQWLQJ KROHV LQ ERWK
HQGV
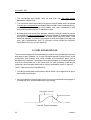
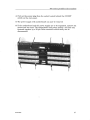
)LJXUH SDJH VKRZV VXJJHVWLRQV IRU YDULRXV WUDQVGXFHU
DUUDQJHPHQWV $ PRXQWLQJ UDFN DUUDQJHPHQW PXVW EH PDGH WR ILW
HDFK LQGLYLGXDO YHVVHO
7UDQVGXFHU IRLO IRU WRZLQJ
6LPUDG FDQ DOVR VXSSO\ D WUDQVGXFHU IRLO WKDW FDQ EH XVHG ZLWK D
QXPEHU RI 6LPUDG WUDQVGXFHUV 7KH WUDQVGXFHU IRLO LV DYDLODEOH DV
D VHSDUDWH XQLW DQG ZLOO EH VXSSOLHG ZLWK QHFHVVDU\ ZHLJKWV IRU
WKH GLIIHUHQW WUDQVGXFHU W\SHV 0RXQWLQJ DFFHVVRULHV DUH DOVR
VXSSOLHG
7KH WUDQVGXFHU IRLO PXVW KDYH D URSH IRU WRZLQJ VXSSOLHG E\ WKH
XVHU 7KH WUDQVGXFHU FDEOH PXVW E\ QR PHDQV EH XVHG IRU WRZLQJ
DQG VKRXOG EH VHL]HG WR WKH WRZLQJ URSH ZLWK WDSH DSSUR[ FP
EHWZHHQ HDFK VHL]LQJ 7KH URSH VKRXOG SUHIHUDEO\ EH FRQQHFWHG
WR WKH WRZLQJ KRRN ZLWK D TXLFN UHOHDVH FRQQHFWRU
0RVW RI WKH WUDQVGXFHUV DUH GHOLYHUHG ZLWK D PHWHU ORQJ FDEOH
EXW VRPH VLQJOH EHDP WUDQVGXFHUV DUH VXSSOLHG ZLWK DQ
XQGHUZDWHU SOXJ DQG H[WHQVLRQ FDEOH ,I D ORQJHU WUDQVGXFHU FDEOH
LV UHTXLUHG WKH WUDQVGXFHU FDQ EH PDGH WR RUGHU RU D VHSDUDWH
H[WHQVLRQ FDEOH ZLWK XQGHUZDWHU FRQQHFWRUV FDQ EH VXSSOLHG
&
,QVWDOODWLRQ DQG V\VWHP WHVW
)LJXUH 9DULRXV WUDQVGXFHU DUUDQJHPHQWV
$QWLIRXOLQJ WUHDWPHQW
$IWHU LQVWDOODWLRQ WKH KXOO PRXQWHG WUDQVGXFHU VKRXOG EH FRDWHG
ZLWK D KLJK TXDOLW\ DQWLIRXOLQJ FRPSRXQG OLNH $QWLIRXOLQJ
6HDPDWH +% IURP -RWXQ 6DQGHIMRUG 1RUZD\ RU HTXDO W\SHV
&RQQHFWLRQ WR WKH (< 5HIHU WR GUDZLQJ (< 7UDQVGXFHU FRQQHFWLRQV LQ
VHFWLRQ µ'UDZLQJVµ
,I WKH (& 'HFODUDWLRQ RI &RQIRUPLW\ LV WR EH IXOILOOHG WKH
WUDQVGXFHU FDEOH KDV WR EH WKUHDGHG WKURXJK D VWHHO SLSH IURP WKH
KXOO WR WKH ($ 3 WUDQVFHLYHU XQLW
&
6LPUDG (< 62)7:$5( ,167$//$7,21
,QWURGXFWLRQ
&KHFN WKDW WKH PLQLPXP V\VWHP UHTXLUHPHQWV IRU WKH (< 3&
DUH PHW
,%0 $7 FRPSDWLEOH 3& ZLWK QXPHULFDO FRSURFHVVRU RU
KLJKHU
,%0 $7 FRPSDWLEOH SDUDOOHO SULQWHU SRUW
| 0E\WHV RI 5$0
6WDQGDUG 9*$ JUDSKLFV
µ ERRWDEOH IORSS\ GULYH IRU 0E\WH GLVNHWWHV
'26 YHUVLRQ RU DERYH
| 0E KDUGGLVN
8VH WKH 50; %RRW ,QVWDOODWLRQ 'LVN IRU WKH LQLWLDO V\VWHP
WHVWLQJ
1RWH 'R QRW VWDUW RQ WKH LQVWDOODWLRQ RQ KDUGGLVN SDUW EHIRUH WKH 50; ERRW
VHVVLRQ KDV EHHQ YHULILHG 50; ERRW VHVVLRQ
)ROORZ WKLV SURFHGXUH
7XUQ RII WKH 3& DQG WKH 7UDQVFHLYHU 8QLW
&RQQHFW WKH 3& SULQWHU SRUW WR WKH 7UDQVFHLYHU 8QLW
8VH WKH &RPSXWHU LQSXW
,QVHUW WKH '& SRZHU SOXJ LQWR WKH 7UDQVFHLYHU 8QLW
6HW WKH VZLWFK RQ WKH 7UDQVFHLYHU 8QLW·V UHDU SDQHO WR 2Q
&KHFN WKH 7UDQVFHLYHU 8QLW·V IURQW SDQHO IRU WKH UHG OLJKW
SRZHU RQ LQGLFDWLRQ
,QVHUW WKH 50; %RRW ,QVWDOODWLRQ 'LVN LQWR WKH ERRWDEOH
IORSS\ GLVN GULYH $ DQG VZLWFK RQ WKH 3&
6HOHFW %227 50; LQ WKH 06'26 6WDUWXS 0HQX
)ROORZ WKH LQVWUXFWLRQV RQ WKH GLVSOD\
:KHQ WKH (< SURJUDP LV UXQQLQJ XVH WKH DUURZ NH\V IRU
PHQX VHOHFWLRQV
6HOHFW WKH 7UDQVFHLYHU PHQX DQG FKHFN WKDW WKH IUHTXHQF\ LV
FRUUHFW
(QWHU WKH 8WLOLW\ PHQX DQG VHW 'HIDXOW 6HWWLQJ WR <HV
&
,QVWDOODWLRQ DQG V\VWHP WHVW
(QWHU WKH 2SHUDWLRQ PHQX DQG VHW 3LQJ 0RGH WR 1RUPDO
3LQJLQJ VWDUWV ZLWK DQ HFKRJUDP VKRZLQJ WKH WUDQVPLWWHU SXOVH RQ
WKH XSSHU SDUW RI WKH GLVSOD\ ,I HYHU\WKLQJ ORRNV QRUPDO \RX PD\
QRZ FRQWLQXH ZLWK WKH LQVWDOODWLRQ RQ KDUGGLVN SURFHGXUH
GHVFULEHG EHORZ RWKHUZLVH HQWHU WKH 6\VWHP HUURU GLDJQRVWLFV
VHVVLRQ
,QVWDOODWLRQ RQ KDUGGLVN
,QVHUW WKH 50; %RRW ,QVWDOODWLRQ 'LVN LQWR WKH ERRWDEOH
IORSS\ GLVN GULYH $ DQG WXUQ RQ WKH 3&
6HOHFW ,QVWDOO (< LQ WKH 06'26 6WDUWXS PHQX
)ROORZ WKH LQVWUXFWLRQV RQ VFUHHQ
6HYHUDO VXEGLUHFWRULHV DUH FUHDWHG DQG WKH 50; V\VWHP ILOHV DUH
FRSLHG IURP WKH IORSS\ GLVN RQWR WKH & KDUGGLVN GULYH
:KHQ SURPSWHG LQVHUW WKH (< 3URJUDP GLVN LQWR WKH $
GULYH DQG W\SH
LQVWDOO
7KH (< SURJUDP GLUHFWRU\ LV FUHDWHG DQG WKH (< SURJUDP ILOHV DUH FRSLHG IURP WKH IORSS\ GLVN RQWR WKH &
KDUGGLVN GULYH
7R YHULI\ D VXFHVVIXO LQVWDOODWLRQ
5HQDPH \RXU &21),*6<6 ILOH WR &21),*2/'
5HQDPH \RXU $872(;(&%$7 WR $872(;(&2/'
&RS\ WKH ILOH $872(;(&50; WR $872(;(&%$7
&RS\ WKH ILOH &21),*50; WR &21),*6<6
5HPRYH DQ\ IORSS\ GLVN IURP WKH IORSS\ GLVN GULYH DQG
UHERRW WKH 3&
7KH IROORZLQJ WH[W QRZ DSSHDUV
'26:,1'2:6
(< 6HOHFW (< WR VWDUW WKH (< SURJUDP
,I LQVWDOODWLRQ DQG UXQQLQJ WKH (< SURJUDP LV VXFFHVVIXO
&
5HERRW WKH 3&
6HOHFW '26:,1'2:6 RQ WKH VWDUW XS PHQX
6WDUW DQ\ WH[W HGLWRU LQ RUGHU
2SHQ WKH &21),*6<6 ILOH
6LPUDG (< 7KH FRQWHQW RI WKH QHZ &21),*6<6 ILOH LV
>PHQX@
PHQXLWHP '26'26:,1'2:6
PHQXLWHP 50;50;
>'26@
5(0 ,QVHUW DOO \RXU UHJXODU &21),* FRPPDQGV KHUH
>50;@
EXIIHUV ILOHV ODVWGULYH 9
&RS\ WKH FRQWHQWV RI \RXU &21),*2/' ILOH LQWR WKH QHZ
&21),*6<6 ILOH
3ODFH WKH FRQWHQWV DIWHU WKH VHQWHQFH
5(0 ,QVHUW DOO \RXU UHJXODU &21),* FRPPDQGV KHUH
6DYH WKH HGLWHG &21),*6<6 ILOH
2SHQ WKH $872(;(&%$7 ILOH
7KH FRQWHQWV RI WKH QHZ $872(;(&%$7 ILOH LV
JRWR FRQILJ
'26
5(0 ,QVHUW DOO \RXU UHJXODU $872(;(& FRPPDQGV KHUH
JRWR HQG
50;
F?GRVUP[?UP[WVUH[H
F?GRVUP[?ORDGUP[H[H Q F?GRVUP[?GRVUP[ V FBGRV I G Z
#FOV
#HFKR RII
HFKR HFKR HFKR 7\SH µ$/7!6<65(4!µ WR VZLWFK WR L50; HFKR HFKR JRWR HQG
HQG
&
,QVWDOODWLRQ DQG V\VWHP WHVW
&RS\ WKH FRQWHQWV RI \RXU $872(;(&2/' LQWR WKH QHZ
$872(;(&%$7 ILOH
3ODFH WKH FRQWHQWV DIWHU WKH VHQWHQFH
5(0 ,QVHUW DOO \RXU UHJXODU $872(;(& FRPPDQGV KHUH
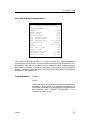
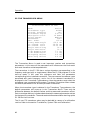
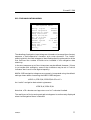
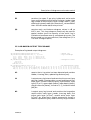
6\VWHP HUURU GLDJQRVWLFV
,I D SUREOHP VKRXOG RFFXU FKHFN WKH 3& FRQILJXUDWLRQ LQIRUPDWLRQ
DJDLQVW WKH H[DPSOH VKRZQ EHORZ
1XPHULFDO &RSURFHVVRU
%DVH 0HPRU\ 6L]H
([WHQGHG 0HPRU\ 6L]H
9LGHR 0RGH
9LGHR 5$0 $GGUHVV
9LGHR 5$0 6L]H
9LGHR $GDSWHU
3DUDOOHO 3RUWV
6HULDO 3RUWV
3ODWIRUP W\SH
3UHVHQW
NLORE\WHV
NLORE\WHV
:LGWK /HQJWK %++
E\WHV
3RUW $GGUHVV '+ 0RGH
5HJLVWHU +
/37 +
&20 )+ &20 )+
$7
&KHFN WKDW SDUDOOHO SRUW DQG VHULDO SRUW KDYH FRUUHFW ,2
DGGUHVVHV
&KHFN WKDW SDUDOOHO SRUW PRGH LV VHW WR 6WDQGDUG ,%0
FRPSDWLEOH PRGH RXWSXW RQO\
([WHQGHG PHPRU\ VKRXOG EH JUHDWHU WKDQ 0E
&KHFN GDWD IRU WKH 9LGHR DGDSWHU
,I QHFHVVDU\ WXUQ DQ\ 3RZHU 0DQDJHPHQW V\VWHP 2))
&
6LPUDG (< 6<67(0 7(67
7KLV SURFHGXUH VKRXOG EH IROORZHG ZKHQ WKH V\VWHP LV SRZHUHG
XS IRU WKH ILUVW WLPH
&KHFN WKH V\VWHP FDEOLQJ
&KHFN WKH VXSSO\ YROWDJH
6ZLWFK RQ WKH (< WKH SULQWHU DQG WKH 3& LQ WKLV
VHTXHQFH
'R WKH VRIWZDUH LQVWDOODWLRQ
6HOHFW (< RQ WKH 3&
7KH GLVSOD\ VKRXOG SUHVHQW D PHQX RQ WKH OHIW VLGH RI WKH
VFUHHQ
(QWHU WKH 7HVW PHQX 9HUVLRQ DQG FKHFN WKDW WKH FRUUHFW
VRIWZDUH YHUVLRQ LV LQVWDOOHG
(QWHU WKH 7UDQVFHLYHU PHQX DQG FKHFN IRU FRUUHFW IUHTXHQF\
6HW 0RGH WR 7HVW DQG PHDVXUH WKH DPSOLWXGH RI WKH LQWHUQDO WHVW
RVFLOODWRU WR EH G% á G% UH :
:KHQ ILQLVKHG VHW 0RGH WR $FWLYH
(QWHU WKH 2SHUDWLRQ PHQX DQG VHOHFW 1RUPDO PRGH
7KH V\VWHP ZLOO FRPPHQFH WUDQVPLWWLQJ DIWHU D IHZ
VHFRQGV 7KH GLVSOD\ VKRXOG SUHVHQW WKH WUDQVPLW SXOVH
DW WKH WRS RI WKH VFUHHQ DQG WKHQ DQ HFKRJUDP VFUROOLQJ
RYHU WKH VFUHHQ
(QWHU WKH 7HVW PHQX 7UDQVFHLYHU DQG REVHUYH 1RLVH
7KH QRLVH OHYHO VKRXOG EH PHDVXUHG ZLWK WKH WUDQVFHLYHU
LQ 3DVVLYH PRGH
5HDGLQJV DERYH ^G% UH ZDWW` DUH FRQVLGHUHG DV D
KLJK QRLVH OHYHO 5HPHPEHU WKDW D ORZHU QXPEHU PHDQV
D KLJKHU QRLVH OHYHO
,I D SULQWHU LV FRQQHFWHG
&KHFN WKH FDEOLQJ EHWZHHQ WKH (< WUDQVFHLYHU XQLW DQG
WKH SULQWHU
6ZLWFK RQ WKH SULQWHU FKHFN WKDW LW LV µ2Q OLQHµ 0DNH VXUH
WKDW WKH SDSHU LV ORDGHG SURSHUO\ DQG WKDW WKH SDSHU PD\
UXQ IUHHO\
(QWHU WKH 3ULQWHU PHQX DQG VHOHFW 0RGHO 7\SH 3DLQW-HW RU
'HVN-HW
6HOHFW (FKRJUDP :LWK (FKRJUDP VHW WR 6ODYH WKH SULQWHU
RXWSXW ZLOO EH HTXDO WR WKH GLVSOD\ SUHVHQWDWLRQ
&
Simrad EY 500
OPERATION
P3402E / 857-160019 / 4AA062
This section contains information about the interactive menu system, the
echogram layout on display and printer, the file system, operation examples and
descriptions of each menu.
P3402/C
1
Operation
Document revisions
Rev
2
Documentation
department
Hardware/Software
Design
Project/Product
Management
Date
Sign
Date
Sign
Date
Sign
A
25.08.95
CL
25.08.95
HS
31.08.95
RB
B
15.08.96
CL
19.08.96
HS
19.08.96
RLN
C
22.05.97
CL
22.05.97
HS
22.05.97
RLN
P3402/C
Simrad EY 500
List of contents
1 INTRODUCTION . . . . . . . . . . . . . . . . . . . . . . . . . . . . . . . . . . . . . . . . . . .
1.1 THE INTERACTIVE MENU SYSTEM . . . . . . . . . . . . . . . . . . . . . . .
1.2 ECHOGRAM LAYOUT ON DISPLAY AND PRINTER . . . . . . . . . .
1.2.1 Introduction . . . . . . . . . . . . . . . . . . . . . . . . . . . . . . . . . . . . . . . .
1.2.2 The colour scale . . . . . . . . . . . . . . . . . . . . . . . . . . . . . . . . . . . . .
1.2.3 Display echogram . . . . . . . . . . . . . . . . . . . . . . . . . . . . . . . . . . . .
1.2.4 Colour printer echogram . . . . . . . . . . . . . . . . . . . . . . . . . . . . . .
1.3 OPERATION EXAMPLES . . . . . . . . . . . . . . . . . . . . . . . . . . . . . . . . .
1.4 THE EY 500 FILE SYSTEM . . . . . . . . . . . . . . . . . . . . . . . . . . . . . . .
1.5 THE REPLAY FUNCTION . . . . . . . . . . . . . . . . . . . . . . . . . . . . . . . .
5
5
5
5
6
7
12
20
23
24
2 MENU DESCRIPTIONS . . . . . . . . . . . . . . . . . . . . . . . . . . . . . . . . . . . . . .
2.1 THE MAIN MENU . . . . . . . . . . . . . . . . . . . . . . . . . . . . . . . . . . . . . .
2.2 THE OPERATION MENU . . . . . . . . . . . . . . . . . . . . . . . . . . . . . . . .
2.3 THE DISPLAY MENU . . . . . . . . . . . . . . . . . . . . . . . . . . . . . . . . . . .
2.3.1 The Display/Echogram Menu . . . . . . . . . . . . . . . . . . . . . . . . . . .
2.4 THE PRINTER MENU . . . . . . . . . . . . . . . . . . . . . . . . . . . . . . . . . . .
2.4.1 The Printer/Echogram Menu . . . . . . . . . . . . . . . . . . . . . . . . . . .
2.5 THE TRANSCEIVER MENU . . . . . . . . . . . . . . . . . . . . . . . . . . . . . .
2.6 THE BOTTOM DETECTION MENU . . . . . . . . . . . . . . . . . . . . . . . .
2.7 THE LOG MENU . . . . . . . . . . . . . . . . . . . . . . . . . . . . . . . . . . . . . . . .
2.8 THE LAYER MENU . . . . . . . . . . . . . . . . . . . . . . . . . . . . . . . . . . . . .
2.8.1 The Layer Submenus . . . . . . . . . . . . . . . . . . . . . . . . . . . . . . . . .
2.9 THE TS DETECTION MENU . . . . . . . . . . . . . . . . . . . . . . . . . . . . . .
2.9.1 The TS Detection Submenu . . . . . . . . . . . . . . . . . . . . . . . . . . . .
2.10 THE DISK MENU . . . . . . . . . . . . . . . . . . . . . . . . . . . . . . . . . . . . . .
2.10.1 The Disk/Telegram Menu . . . . . . . . . . . . . . . . . . . . . . . . . . . . .
2.10.2 The Disk/Echogram Menu . . . . . . . . . . . . . . . . . . . . . . . . . . . .
2.11 THE SERIAL COMMUNICATION MENU . . . . . . . . . . . . . . . . . .
2.11.1 The SERIAL/Telegram Menu . . . . . . . . . . . . . . . . . . . . . . . . . .
2.11.2 The SERIAL/USART Menu . . . . . . . . . . . . . . . . . . . . . . . . . . .
2.11.3 The SERIAL/Echogram Menu . . . . . . . . . . . . . . . . . . . . . . . . .
2.12 THE ANNOTATION MENU . . . . . . . . . . . . . . . . . . . . . . . . . . . . . .
2.13 THE NAVIGATION MENU . . . . . . . . . . . . . . . . . . . . . . . . . . . . . .
2.14 THE UTILITY MENU . . . . . . . . . . . . . . . . . . . . . . . . . . . . . . . . . .
2.15 THE TEST MENU . . . . . . . . . . . . . . . . . . . . . . . . . . . . . . . . . . . . .
26
26
27
29
31
36
39
40
47
49
51
53
55
56
59
61
63
66
67
71
72
75
77
82
85
P3402/C
3
Operation
Document history
(The information on this page is for Simrad’s internal use)
Rev. A Original issue. First edition as module. Was section 3 of P2473E.
Rev. B Update from software version 5.00 to 5.20.
Rev. C Update from software version 5.20 to 5.30.
4
P3402/C
Simrad EY 500
1 INTRODUCTION
NOTE !
The EY 500 Instruction Manual is based on software version 5.30.
Changes made in the software may require amendments in this manual.
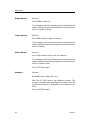
1.1 THE INTERACTIVE MENU SYSTEM
The EY 500 system is operated via the PC keyboard. Operation is based on an
interactive menu system which to a large extent is self-explanatory with all
operational options listed on the display.
The keyboard arrows enable you to move a cursor (a reverse field) over the
desired choices in the menu. Each press on one of the up or down keys will move
the cursor one line up or down in the text. The keyboard arrow pointing to the
right is used for moving into different levels in the menu and for entering
values. The arrow pointing to the left is used for moving back to a higher level
in the menu system.
The start procedure is described in paragraph 1.3. For installation of the EY 500
software, refer to section "Installation, System Test and Calibration".
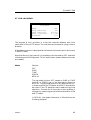
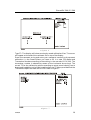
1.2 ECHOGRAM LAYOUT ON DISPLAY AND PRINTER
1.2.1 Introduction
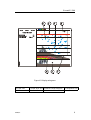
Figure 1 shows the display layout. The menu field is on the left-hand side of the
screen, and the echogram on the right-hand side. In addition to the echoes, the
following information may be presented:
Layer lines
Super layer
Bottom range echogram
Scale lines
Integration line
Event marker
Bottom lines
P3402/C
5
Operation
Figure 1. Display layout.
The printer echogram may contain all the information of the display echogram,
as well as the additional elements:
Nautical mile marker
Annotation
Date and time
TS distribution tables
Integration tables
Navigation text
Identification for range, TVG and colour sensitivity
The various elements of the display and printer echograms are described in
paragraphs 1.2.3 and 1.2.4.
1.2.2 The colour scale
The echogram has a colour scale which is proportional to the strength of the
signals. The echo strength is divided into twelve colour categories, the weakest
corresponding to grey and the strongest to brown. The scale is logarithmic with
a 3-dB step between each colour, which gives the colour scale a dynamic range
of 36 dB from the weakest to the strongest echo signal.
6
P3402/C
Simrad EY 500
In the Echogram Menu it is possible to set the lower limit of the colour scale
relative to target strength or volume backscattering strength (the commands TS
colour min. and Sv colour min.).
If, for example, this limit is set to -70 dB, the weakest colour includes the target
strength range -70 to -67 dB, while the strongest colour covers the range -37 to
-34 dB and stronger (-70 dB + 36 dB = -34 dB). The colour scale is displayed in
the upper part of the screen.
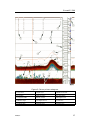
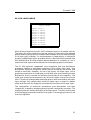
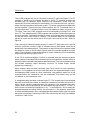
1.2.3 Display echogram
The echogram movement across the screen is determined by the setting of the
echogram speed parameter (Display Menu) and the current ping interval
(Operation Menu). The echogram colour presentation is mainly influenced by
TS and Sv colour minimum and the selected TVG type (DISPLAY/Echogram
Menu). If the bottom range is enabled, 20% of the main echogram is overwritten
by this bottom-referenced echogram. The echogram may include several lines
which are enabled by the corresponding parameters in the menu system.
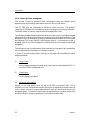
In figure 2 arrows and numbers from (1) to (7) point out the different topics
explained below:
(1)
Layer lines.
Layer lines appear when the LAYER LINES parameter in the
DISPLAY/Echogram Menu is set to ON. All layer lines for the active layers will
be in black colour except for the layer selected as the super layer.
The layer lines have higher priority than echo colour and will overwrite it. The
layer type and limits for each layer will determine the layout of the layer
picture. The surface layers will only have the lines above bottom visible in the
echogram. The bottom layer lines will be written relative to estimated bottom
depth. If the bottom detector fails to find the bottom depth, all the layer lines
described above will be absent. However, if the layer type is set to PELAGIC,
the layer lines are always written. In this case the bottom depth is not
necessary for successful integration and TS-detection.
(2)
Super layer.
One of the layers may be selected as a super layer. The layer selected as super
layer will have the layer lines written in red colour instead of black.
P3402/C
7
Operation
The super layer sets the depth limits for controlling several different features
in the system:
- TS bar chart on display
- TS detection window on display
- Integration line on display and printer
- Scope presentation.
(3)
Bottom range echogram.
BOT. RANGE PRES. in the Display Menu must be enabled. The bottom range
echogram is independent of the main echogram since the range settings are
separate. It will overwrite 20% of the main echogram and may be placed on
different parts of the main echogram. (Refer to DISPLAY/Echogram Menu
description).
The bottom range echogram is separated from the main echogram with a solid
black boundary line. The bottom range echogram is blanked out if no bottom
detection has been done.
If SUB.BOTTOM GAIN is set above 0.0 dB/m, the bottom range presentation
will feature an excess gain below the detected bottom.
(4)
Integration line.
INTEGRATION LINE in the DISPLAY/Echogram Menu must be enabled. The
super layer status must be assigned to one of the layers since the integration
line connects to this layer. The deflection line steepness is controlled by the
number selected for corresponding S A value across the echogram paper.
MODE in the Log Menu must be enabled to start integration and thereby
causing the integration line to change. The integration line will be reset when
log interval or SA value for one echogram crossing is reached. The deflection
value is updated every sub-log interval (normal = 1/200 nm) in SPEED mode.
In PING mode it is updated for each ping, while in TIME mode it is updated
every 2 seconds.
8
P3402/C
Simrad EY 500
Figure 2. Display echogram.
1. Layer line
2. Super layer line 3. Bottom range echogram
5. Event marker
6. Scale line
P3402/C
4. Integration line
7. Bottom detection line
9
Operation
Blank page
10
P3402/C
Simrad EY 500
5) Event marker
EVENT MARKER in the Display Menu must be turned ON. The event input
may be caused by EVENT COUNTER in the Annotation Menu. The event will
result in a red vertical line.
(6)
Scale lines.
If SCALE LINES in the DISPLAY/Echogram Menu is set greater than 0, the
selected number of dotted equidistant lines will be written across the echogram.
(7)
Bottom detection line.
The bottom detection line may be introduced for easy marking of the bottom
(Bot. Det. Line in the Display/Echogram Menu must be set to ON).
The PRESENTATION parameter in the same menu has the following options:
NORMAL
WH. LINE
CONTOUR
These options are described under the DISPLAY/Echogram Menu description.
P3402/C
11
Operation
1.2.4 Colour printer echogram
The printer is able to generate more information than the display. Most
elements are controlled by parameters found in the Printer Menu.
The EY 500 may be interfaced to different colour printers. The graphic
resolution is 720 dots with 12 different colours ranging from light grey to brown.
The black colour is mainly used for text and separation lines.
The echogram paper speed is determined by the setting of the echogram speed
parameter (Printer Menu) and the current ping interval (Operation Menu). The
echogram colour presentation is mainly influenced by the colour minimum and
the selected TVG type (PRINTER/Echogram Menu). If the bottom range is
enabled, 20% of the main echogram is overwritten by this bottom-referenced
echogram.
The echogram may include several lines and text strings which are enabled by
the corresponding parameters in the menu system.
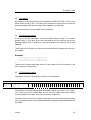
In figure 3, arrows and numbers from (1) to (15) point out the different topics
explained below:
1)
Layer lines.
As for display echogram, except that layer lines are switched ON/OFF in
the PRINTER/Echogram Menu.
2)
Super layer.
As for display echogram.
(3)
Nautical mile marker,
MODE in the Log Menu must be set to SPEED and NAUTICAL MILE
MARKER in the Printer Menu must be set to ON. At detection of a new nautical
mile, a black vertical line accompanied with text will be written across the
echogram paper. The text string shows the log distance in nautical miles plus
the NM indicator for easy recognition of the nautical mile data.
12
P3402/C
Simrad EY 500
(4)
Annotation.
Annotations can be entered via the PC keyboard. ANNOTATION in the Printer
Menu must be set to ON. The text string entered will be written across the
echogram paper after the carriage return character is received.
The maximum text string length is 80 characters.
(5)
Date and time stamp.
If the time interval parameter in the Annotation Menu is set to a number
greater than 0, the date and time information will be written across the
echogram paper with a spacing in time controlled by the number of minutes
selected.
The format of this output has a date and a time field with a separation space in
the middle.
Example:
9 3 0 1 2 3
0 8 2 5 Twenty-five minutes past eight o’clock on the twenty-third of January in the
year nineteen ninety-three.
(6)
TS distribution table.
The layout for the TS distribution results is shown below:
TS-step = 1.5 dB
-50
-47
-44
-41
-38
-35
-32
-29
-26
-23
-20
-17
-14
TS-max = -14.0 dB
10.0 70 1 Sur. 3.0
15.0
3 3367 0 0 0 0 0 0 0 0 0 0 0 0 0 0 0 0 0 0 0 0 0 0
30.0
57 7251154 4 0 0 0 0 0 0 0 0 0 0 0 0 0 0 0 0 0 0 0
93/01/23 kHz 2 Sur. 15.0
3 Sur. 30.0
45.0
84 018 84510 6 1 2 5 4 0 0 1 0 0 0 0 0 0 0 0 0 0 0
08.31.20
5 Bot. 1.0
11.0
28 0 721291114 0 7 4 4 0 0 0 0 0 0 0 0 0 0 0 0 0 0
The header in the table above gives the details about the current TS range in
use. The first column underneath on the left side adds information about
current log distance, date, time and transceiver frequency.
The next column shows the numbers, types and limits for the active layers. Note
that the layers without any accepted single fish echoes will be suppressed from
this table.
P3402/C
13
Operation
The next column shows the total number of accepted single fish echoes found
within each layer. These numbers will give a good indication on the database for
the distribution that is given in the next 24 columns.
The numbers in the distribution field is the percentage occurrence in each TS
group. The total sum of all groups within each layer should add up to
approximately 100 %.
(7)
Integration table.
The layout for the integration results is shown below:
10.0 70 10
9
8
7
6
5 Bot. -804 Sur. -803 Sur. -802 Sur. -801 Sur -80 1.0 11.0 45.0 65.0 30.0 45.0 15.0 30.0
3.0 15.0 93/01/23 kHz
92 10.0
99 12.3
63 15.0 219 15.0
447 12.0 08.02.23
If the INTEGRATION TABLES parameter is enabled from the Printer Menu
and a log interval limit is reached, the integration results will be printed across
the paper. The format consists of 11 columns where the 10 rightwards columns
have identical layout. The left column carries the log distance, date, time and
transceiver frequency information. The other columns show the following
settings and results:
- Layer numbers (1 to 10)
- Layer type ( Surface, Bottom, Pelagic)
- Sv threshold
- Lower and upper layer limits referred to surface or bottom
- SA integration numbers (red colour). Note that the Sa(mean) to be used for
fish density calculations is S a (mean) = SA/4B
- Average layer thickness (blue colour)
Note that the average layer thickness will become smaller when a layer is
intersected by bottom or transmitter pulse (The margin must also be included).
(8)
Event marker.
As for display echogram, except that Event Marker is controlled from the
Printer Menu. In addition the current event number and navigation data will
be written across the echogram paper.
14
P3402/C
Simrad EY 500
(9)
Navigation data.
For navigation data on the printer a connection between the navigation serial
port and the navigation instrument must be established. The navigation
interval must be greater than 0 in the Printer Menu. If the navigation telegram
sent to the EY 500 is decoded successfully, the navigation data will be written
across the echogram paper. The output rate is controlled by the navigation
interval parameter setting in the Printer Menu.
10)
Bottom range echogram.
As for display echogram, except that this echogram is controlled from the
PRINTER/Echogram Menu.
11)
Integration line.
As for display echogram, except that the integration line is controlled from the
PRINTER/Echogram Menu.
12)
Scale lines.
As for display echogram, except that the scale lines are controlled from the
PRINTER/Echogram Menu.
(13/14) Range and identification fields.
The range and identification fields will always be enabled. The fields will be
printed each time the range is changed, and regularly three to four times per
page (A4-format) The range information will be written across the paper on top
and bottom of the echogram with the corresponding upper and lower depth
values given as whole numbers in meters.
The identification field will carry the following two echogram identifiers:
1.
2.
TVG-type
(Sv or TS)
Min colour sensitivity value (no minus sign)
The identification field is placed close to the lower depth range field on the
bottom of the echogram, and it represents the major information reference for
the echogram.
P3402/C
15
Operation
15)
Bottom detection line.
As for display echogram, except that the bottom detection line is controlled from
the PRINTER/Echogram Menu.
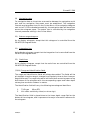
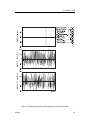
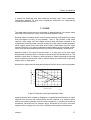
The SCOPE option is very nice to use during calibration sequence for justification of measured data on reference targets. An example of SCOPE
presentation is shown in figure 4.
16
P3402/C
Simrad EY 500
Figure 3. Colour printer echogram.
1 Layer lines
2 Super layer
3 Nautical mile text
4 Annotation
5 Date and time
6 TS distribution
7 Integration table
8 Event marker
9 Navigation text
10 Bottom range
11 Integration line
12 Scale line
13 Identification
14 Range lower
15 Bottom line
P3402/C
17
Operation
Blank page
18
P3402/C
Simrad EY 500
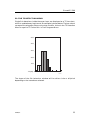
Figure 4. Scope plot showing 300 samples of transceiver data.
P3402/C
19
Operation
1.3 OPERATION EXAMPLES
The following examples describe procedures for a specific setup of the EY 500
with a limited use of its features. The procedure is outlined in a stepwise
manner in order to emphasize the structured menu system in the EY 500. The
following functions will be examined.
1) Start of pinging
2) 40 log echogram on display (TS)
3) 20 log echogram on printer (Sv)
4) Defining the calculating interval
5) Defining the layer picture
6) Limiting the bottom detection range
7) Monitoring of data
8) Sending data to the hard disk
Make sure that sounder unit, PC and printer (optional) are switched on in this
sequence. In this example we assume that MODE in the Transceiver Menu is
set to ACTIVE and that ECHOGRAM is enabled. To check this:
Select the Transceiver Menu.
Check that MODE is ACTIVE.
Select the Display Menu.
Check that ECHOGRAM is set to ON.
The use of keyboard arrows is described in paragraph 1.1.
1. Start of pinging
When the sounder unit is turned on, the PING mode is OFF.
Select the Operation Menu and set PING MODE to NORMAL.
After some time delay an echogram will start scrolling from right to left on the
display.
If PING AUTO START in the Operation Menu is set to ON and PING MODE
is NORMAL, the sounder will start pinging automatically the next time the
power is turned on.
2. 40 log echogram on display
Select the DISPLAY/Echogram.
Set TVG to 40 log R.
Set RANGE to the most suitable value referred to the depth.
Set LAYER LINES to ON.
Set TS COLOUR MIN. to the most suitable value according to expected target
strength.
20
P3402/C
Simrad EY 500
3. 20 log echogram on the printer
Select the Printer Menu. Set the printer’s MODEL TYPE if the current setting
is wrong.
Set ECHOGRAM to ON
Set INTEGRATOR TABLES to ON.
Select the PRINTER/Echogram Menu.
Set TVG to 20 log R.
Set RANGE to the most suitable value referred to the depth.
Set LAYER LINES to ON.
Set SV COLOUR MIN. to the most suitable value referred to expected volume
back-scattering strength.
4. Defining the calculating interval
In order to initiate printouts of tables from integration and target strength
distribution, and TS distribution bar graph in the TS Detection Menu, the log
system must be turned on.
Select the Log Menu.
Set MODE to PING.
5. Defining the layer picture
The layers in the EY 500 are useful for isolating certain depth ranges for data
processing. In this exercise only layer No. 1 is used.
Select the Layer-1 Menu.
Set TYPE to SURFACE.
Set RANGE to 50 m.
Set RANGE START to 5 m
Set MARGIN to 1.0 m.
Select the Layer Menu.
Set SUPER LAYER to 1.
The selected layer will then be assigned as super layer. Various special
functions are attached to this layer, as described in paragraph 2.8. The layer
lines are turned on for both display and printer and will be drawn in red colour
at 5 m and 55 m depth.
P3402/C
21
Operation
6. Limiting the bottom detection range
The bottom detector algorithm uses the minimum and maximum depth settings
to limit the range of interest for finding the real bottom. Very often the default
values will not correspond with the presumed depth pattern in the area of
surveying. Therefore, to speed up computations:
Select the Bottom Detection Menu.
Enter the best value according to the maximum expected depth.
7. Monitoring of data
When all of the above parameters are set, it will be possible to monitor the
incoming acoustic data by different means. For example in a split-beam system
the TS distribution bar diagram (TS-Detection Menu) and the TS window (TSDetection Submenu) may be useful to study, as well as the integration tables
printed together with the echogram on the printer. Scope data may be studied
in the Test Menu.
8. Sending data to disk
The disk is an independent device with its own echogram definition. Several
telegram types may be enabled for on-line storage. When LOG in the Disk Menu
is ON, the data will automatically be given a name including creation time. The
file size is limited to the value given in MAX. FILE SIZE in the Disk Menu. The
format of the telegrams are described in an appendix. The postprocessing
system will read these files and enable the user to scrutinize the data with new
layer limits.
The data file will be suited for replaying if the sample power and angle
telegrams have been stored.
22
P3402/C
Simrad EY 500
1.4 THE EY 500 FILE SYSTEM
System files are located in the EY 500 directory.
File name:
Contents:
EY500.PAR
Backup parameters of all EY 500 settings.
MoDaHoMi.DGY
Data files containing telegrams. EY 500 files will be
automatically created when LOG in the Disk Menu is
ON, or when the current file size limit is reached. The
file name contains a unique identification with respect
to month, day, hours, minutes and year. Example:
12100849.DG4.
12
10
08
49
.
DG
4
Month
Day
Hours
Minutes
.
DG
Year
2-digit
identifier
(1-12)
2-digit
identifier
(1-31)
2-digit
identifier
(1-23)
2-digit
identifier
(1-59)
EY 500
datagram
1-digit
identifier
(1-9)
A list of telegrams is given on page 62, and a detailed description of each
telegram is given in section "Description of Telegrams and Remote Control".
Parameter settings may be saved by using the DOS command COPY to save the
backup file EY500.PAR with another name, and when these settings are
wanted, the same command in reverse order will bring the stored parameters
back into use. In this manner, the operator may choose different surveys or
situations.
P3402/C
23
Operation
1.5 THE REPLAY FUNCTION
The replay function represents a major enhancement in the EY 500 system. The
sample data read from the transceiver may be stored in real time on disk. These
sample telegrams include information regarding the following parameters:
-
Frequency
Single/split system
Transducer type
Pulse length
Bandwidth
To store data to disk, first carry out the following procedure:
- Before starting the EY 500, create the directory where you want the data
stored.
- Select the Disk Menu.
- Select a directory path.
- Select the Disk/Telegram Menu.
- Set the Sample Range to cover the range of interest.
- Turn on the Sample Power Telegram. If a split-beam system is used, both the
Sample Power and the Sample Angle telegrams must be turned on.
- Return to the Disk Menu and turn on Log to start storing of sample data.
Note that the Max. File Size in the Disk Menu may be increased when collecting
sample data, in order to limit the number of files.
The maximum number of samples is limited to 10000. The Transducer Depth
should be at 0 meters.
The data collected in situ may be replayed again and again with new parameter
settings. Thus it is possible to optimize the echo sounder settings by observing
the effect of parameter changes. Typical examples are to find the best possible
parameters for bottom detection and single fish detections.
To start the replay of a file, carry out the following procedure:
- Select the Disk Menu and select the Directory Path.
- Select the replay file name.
- If continuous replay is desired, turn on Replay Forever.
24
P3402/C
Simrad EY 500
- Select the Operation Menu and set Ping Mode to Replay.
The replay function may also be used to restore the following survey
information:
- Time
- Annotation
- Navigation
- Vessel speed pulses
It is important that the telegrams above are turned on when logging data.
Also notice that when this survey information from Navigation and Vessel
Speed is used, the replay function makes possible a complete offline rerun with
new parameter settings. This information may be written to a new file to be
read by postprocessing systems such as the BI 500 or the EP 500.
Note that the REPLAY message is blinking on the top of the screen to indicate
that data is replayed.
P3402/C
25
Operation
2 MENU DESCRIPTIONS
2.1 THE MAIN MENU
The main menu is the top level of the menu system and consists of a list of the
menus available in the system.
MAIN MENU
OPERATION MENU
DISPLAY MENU
PRINTER MENU
TRANSCEIVER MENU
BOTTOM DETECTION MENU
LOG MENU
LAYER MENU
TS DETECTION MENU
DISK MENU
SERIAL COM. MENU
ANNOTATION MENU
NAVIGATION MENU
UTILITY MENU
TEST MENU
Figure 2.1 Main menu.
26
P3402/C
Simrad EY 500
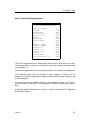
2.2 THE OPERATION MENU
Operation Menu
Ping Mode
Ping Auto Start
Ping Interval
Off
Off
0.0 s
The Operation Menu is used to activate the sounder, to choose if the sounder is
to start pinging immediately after being turned on and to set the time interval
between pings.
Ping Mode
Options:
OFF
NORMAL
EXT. TRIG
REPLAY
At power on this parameter is OFF implying that the
sounder is not activated. Normal operation occurs when
this parameter is NORMAL, provided the transceiver is
in the ACTIVE mode. When Ping Mode is set to
REPLAY, the file selected in the Disk Menu will be
replayed. EXT. TRIG provides synchronization with
other equipment. This operation requires special
hardware supplied by Simrad. Refer to drawing Ext.
sync. cable plan in section 7 in this manual.
Ping Auto Start
Options:
OFF
ON
After power on, it will normally be necessary to enter the
Operator menu and set PING MODE to NORMAL to
start pinging. If PING AUTO START is ON and PING
MODE is set to NORMAL, the sounder will start pinging
automatically when the power is turned on.
P3402/C
27
Operation
Ping Interval
Options:
0.0 to 20.0 in steps of 0.1 second
A fixed ping interval can be set. If the echo sounder is
unable to ping as fast as the selected ping interval, a
warning will be given, and the ping will be delayed one
or more ping intervals. Normal operation is 0.0, i.e. the
sounder will ping as fast as possible (only delayed by
sound propagation and internal data processing).
If unwanted multiple bottom echoes appear on the
echogram, these may be eliminated by changing the ping
interval.
28
P3402/C
Simrad EY 500
2.3 THE DISPLAY MENU
Display Menu
Colour Set
Event Marker
Echogram Speed
Echogram
Echogram Menu
Light
Off
1:1
On
The Display Menu is used to choose between different display modes, to
introduce an event marker on the display, to choose the desired speed of the
echogram movement across the screen and for switching the echogram
presentation on and off. The Display Menu also contains the entry line for the
Echogram submenu.
Colour Set
Options:
LIGHT
DARK
MONO
Various display modes can be chosen; light or dark background colour, or monochrome for grey scale LCD PCs.
Event Marker
Options:
OFF
ON
When ON, a vertical line is drawn across the echogram
on the display each time an "event" occurs. Refer to the
Annotation Menu description for information about how
to generate events.
P3402/C
29
Operation
Echogram speed
Options:
1:1
1:2
1:3
1:5
1:10
With setting 1:1 every ping is displayed. With setting 1:2
every second ping is displayed, with setting 1:3 every
third ping is displayed, etc. Note that this is to slow
down the display echogram speed only, and has no
influence on the other output devices.
Echogram
Options:
OFF
ON
To switch the echogram on the screen ON/OFF.
30
P3402/C
Simrad EY 500
2.3.1 The Display/Echogram Menu
DISPLAY/Echogram Menu
Transd. Number
Range
Range Start
Auto Range
Bottom Range
Bot. Range Start
Bot. Range Pres.
Sub. Bottom Gain
Presentation
TVG
Scale Lines
Bot. Det. Line
Layer Lines
Integration Line
TS Colour Min.
Sv Colour Min
1
100 m
0 m
Off
10 m
5 m
Off
0.0 dB/m
Normal
20 log R
10
On
Off
Off
-50 dB
-70 dB
The DISPLAY/Echogram Menu is used to choose the desired echogram
presentation on the screen. A special bottom echogram may be selected. This
echogram is referred to the bottom and its range may cover areas both above
and below the bottom. The bottom echogram may be positioned at different
places in the main echogram area. Also refer to the description of the display
echogram in paragraph 1.2.3.
Transd. Number
Options:
1 to 32
To be used only when external transducer multiplexer is
included in the system. The command selects which
transducer echogram is to be displayed. The command is
only effective when TRANSD. SEQUENCE in the
Transceiver Menu is ON.
P3402/C
31
Operation
Range
Options:
1m
5m
10 m
15 m
25 m
50 m
100 m
150 m
250 m
500 m
750 m
1000 m
1500 m
2500 m
Depth range across echogram.
Range Start
Options:
0 to 2500 meters in steps of 1 m
Upper start depth of echogram.
This parameter is only valid when Auto Range is OFF.
Auto Range
Options:
OFF
ON
Automatic adjustment of Range Start aimed at
maintaining the bottom echo inside the echogram. When
Auto Range is ON, the Range Start value will be ignored.
Bottom Range
Options:
0 to 100 m in steps of 1 m.
Range of bottom echogram.
Bot. Range Start Options:
-100 m to +100 m in steps of 1 m.
This command sets the upper start depth of bottom
echogram relative to detected bottom depth; positive
values above the bottom and negative values below the
bottom.
32
P3402/C
Simrad EY 500
Bot. Range Pres.
Options:
OFF
UPPER
BOTTOM
LOWER
While a normal echogram is referred to the surface, the
bottom echogram is always referred to the bottom. The
Bottom Range Presentation command allows you to
position this echogram at different places in the
echogram area. Bottom Range Presentation can be OFF,
positioned along the UPPER or LOWER boundary of the
echogram area, or positioned immediately below the
detected BOTTOM inside the echogram.
Sub. Bottom Gain
Options:
0.0 to 5.0 dB/m in 0.1 dB/m steps.
This command may improve visual presentation of subbottom echoes. When set to 0.5 dB/m an excess gain of
0.5 dB per meter below the detected bottom is added in
order to compensate for absorption in the bottom.
Presentation
Options:
NORMAL
WH. LINE
CONTOUR
In NORMAL mode the echo signal is continuously
recorded as received by the transducer.
WHITE LINE presentation introduces a small gap in the
echogram below the detected bottom in order to improve
observation of targets close to the bottom.
CONTOUR presentation causes the echogram below the
detected bottom to be blanked out.
P3402/C
33
Operation
TVG
Options:
20 log R
40 log R
This parameter controls which transmission loss
compensation algorithm is to be used (TVG = Time
Variable Gain). 20 log R is selected for echogram
presentation of volume back-scattering strength, and 40
log R for presentation of target strength.
Scale Lines
Options:
0 to 250 lines in steps of 1
Allows you to enter a number of equidistant scale lines
across the echogram. Scale lines disabled by setting
value to 0.
Bot. Det. Line
Options:
OFF
ON
A black line is introduced in the echogram at the current
depth, when set to ON.
Layer Lines
Options:
OFF
ON
This command allows you to include layer lines in the
echogram. The selected super layer lines have red colour,
and all other layer lines are black.
34
P3402/C
Simrad EY 500
Integration Line
Options:
OFF
10
100
1000
10000
100000
1000000
The echo integration buildup within the super layer is
plotted as a deflection line. The numeric setting
determines the vertical range across the echogram in
units of m²/nm². Refer to paragraph ECHO
INTEGRATION in section "Theory of Operation".
TS Colour Min.
Options:
-100 to 0 dB in steps of 1 dB
Lower limit of colour scale relative to target strength. If
for example this parameter is set to -50 dB, the lowest
TS visible on the display will be -50 dB (grey colour).
Sv Colour Min.
Options:
-100 to 0 dB in steps of 1 dB
Lower limit of colour scale relative to volume
backscattering strength. If for example this parameter is
set to -70 dB, the lowest Sv visible on the display will be
-70 dB (grey colour).
P3402/C
35
Operation
2.4 THE PRINTER MENU
Printer Menu
Model Type
PaintJet
Navig. Interval
0
Event Marker
Off
Annotation
Off
Naut. Mile Marker
Off
TS Distribution
Off
Integr. Tables
Off
Echogram Speed
1:1
Echogram
Off
Echogram Menu
The Printer Menu is used to choose the desired presentation of echogram and
data on the printer printout. Also refer to the description of the printer
echogram in paragraph 1.2.4.
Model Type
Options:
PaintJet
DeskJet
To select between printer types. The echogram layout for
the two printers are identical except that the DeskJet does
not have continuous paper feeding. To indicate the sequence
of the echogram, the DeskJet puts the page number and the
time information on the top of each page.
Navig. Interval
Options:
0 to 1000 in steps of 1
This command sets the number of incoming navigation
telegrams to the sounder per printout on the printer. If for
example the telegrams are coming in every second, you set
NAVIGATION INTERVAL to 60 to get a printout every
minute. No navigation data will appear on the printer when
the NAVIGATION INTERVAL is set to 0.
36
P3402/C
Simrad EY 500
Event Marker
Options:
OFF
ON
When ON, a vertical line is drawn across the echogram each
time an "event" occurs. The event number is printed on top
of the paper. Refer to the Annotation Menu description for
information about how to generate events.
Annotation
Options:
OFF
ON
When ON, annotation messages received via the keyboard
will be printed.
Naut. Mile
Marker
Options:
OFF
ON
When ON, every nautical mile will be indicated on the
echogram paper if the LOG MODE is set to SPEED. A
vertical line is drawn across the paper, and the distance is
shown along this line.
TS Distribution Options:
OFF
ON
To select printout of TS distribution table.
Integr. Tables
Options:
OFF
ON
To select printout of echo integration table.
Echogram Speed
P3402/C
Options:
37
Operation
1:1
1:2
1:3
1:5
1:10
With setting 1:1 every ping is displayed. With setting 1:2
every second ping is displayed, with setting 1:3 every
third ping is displayed, etc. This in order to get a more
compact history on the echogram or to increase the ping
rate.
Echogram
Options:
OFF
ON
SLAVE
To select printout of echogram.
When SLAVE is selected, the printer echogram will be a
slave of the display in such a way that the display
echogram settings are used directly for the printer.
38
P3402/C
Simrad EY 500
2.4.1 The Printer/Echogram Menu
PRINTER/Echogram Menu
Transd. Number
Range
Range Start
Auto Range
Bottom Range
Bot. Range Start
Bot. Range Pres.
Sub. Bottom Gain
Presentation
TVG
Scale Lines
Bot. Det. Line
Layer Lines
Integration Line
TS Colour Min.
Sv Colour Min
1
100 m
0 m
Off
10 m
5 m
Off
0.0 dB/m
Normal
20 log R
10
On
Off
Off
-50 dB
-70 dB
This menu is identical to the DISPLAY/Echogram Menu except for SCOPE in
the PRESENTATION submenu. For the other menu descriptions, refer back to
paragraph 2.4.1 The DISPLAY/Echogram Menu. Also refer to the description of
the printer echogram in paragraph 1.2.4
Presentation
Options:
NORMAL, WH. LINE and CONTOUR as in the
DISPLAY/Echogram Menu.
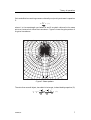
SCOPE presentation is intended for special purpose studies
of the echo return and causes an oscilloscope-like plot of a
single ping to be printed. Echo amplitude and directional
angles are plotted; echo amplitude in units of dBW (referred
to the transducer terminals) and directional angles in units
of phase steps (64 phase steps = 180 electrical degrees). The
plot starts at the upper depth boundary of the super layer,
and a total of 300 samples (basic hardware sampling rate of
transceiver) is plotted. Note that no echogram is plotted
during the printout period. Refer to figure 4.
P3402/C
39
Operation
2.5 THE TRANSCEIVER MENU
Transceiver Menu 38 kHz
Mode
Transducer Type
Transd. Sequence
Transducer Depth
Absorption Coef.
Pulse Length
Bandwidth
Max. Power
2-Way Beam Angle
Sv Transd. Gain
TS Transd. Gain
Angle Sens.Along
Angle Sens.Athw.
3 dB Beamw.Along
3 dB Beamw.Athw.
Alongship Offset
Athw.ship Offset
Active
ES38B
Off
0.00 m
10 dBkm
Medium
Auto
125 W
-20.6 dB
26.50 dB
26.50 dB
21.9
21.9
7.1 dg
7.1 dg
0.0 dg
0.0 dg
The Transceiver Menu is used to set important receiver and transmitter
parameters. In this menu all the parameters will influence on the final result
and must therefore not be tampered with.
The transceiver in the EY 500 has a unique signature corresponding to its
frequency and type (split or single beam). When the EY 500 program is in the
start-up mode, it will read this signature and fetch the parameters
corresponding to the installed transceiver. There are several transducer types
associated with each frequency, and a list of the relevant transducers is
displayed in the Transducer Type submenu. Here the operator must select the
transducer type connected to the system. The above Transceiver Menu shows
the default parameters of a 38 kHz split-beam transceiver.
When the transducer type is selected in the Transducer Type submenu, the
default parameters will come up in the Transceiver Menu. There may be
differences between the default values and the measured transducer values.
Each transducer delivery includes a data sheet with measured parameter values
for that specific transducer. These values should be entered after starting up the
EY 500 for the first time.
The Sv and TS transducer gains may be decided by means of a calibration
routine. Refer to the section "Installation, System Test and Calibration".
40
P3402/C
Simrad EY 500
Mode
Options:
OFF
ACTIVE
PASSIVE
TEST
The transceiver is OFF, ACTIVE (normal operation),
PASSIVE (normal operation but with the transmitter
disabled) or in TEST mode (a test tone is inserted in the
receiver front end, the transmitter is disabled).
Transducer Type
Options:
ES38B
ES38-12
ES38
ES38D
ES38-5
OTHER
The list of transducers above depends on the signature
read from the transceiver. The transducer type connected
to the system should be selected. When set to OTHER,
the operator may enter the relevant specifications if a
non-standard transducer is to be used.
Transd. Sequence
Options:
OFF
ON
This operation requires special hardware supplied by
Simrad. Up to 32 transducers can be used in a multiplexing scheme.
The procedure for Transd. Sequence is:
1. Set Transd. Sequence to ON
This brings forth the following submenu:
Number
1
State
On
No. of Ping
1
Depth
0.00 m
Number is the transducer number and may be set from
P3402/C
41
Operation
1 to 32.
State will enable the transducer for sequencing if ON and
disable the transducer if OFF.
No. of Ping is set to the number of pings before moving to
the next transducer in the sequence.
Transducer Depth may be set for each transducer
according to the physical system setup.
Note that the transducer type and transducer
parameters may be set individually for each transducer
number.
Transducer Depth Options:
0.00 to 999.99 m in steps of 0.01 m
Installation depth of transducer, relative to the sea
surface.
Absorption Coef.
Options:
0 to 300 dB/km in steps of 1 dB/km
Absorption of sound in the sea. (Refer to section "Theory
of Operation" for more information about the absorption
coefficient, also called attenuation constant and
absorption loss).
The default values are computed according to Francois
and Garrison, J. Acoust. Soc. Am. 72(6), December 1982.
* 10 degrees| Celsius
* 35 parts per thousand salinity
* 250 meter depth
* pH = 8
42
P3402/C
Simrad EY 500
Pulse Length
Options:
SHORT
MEDIUM
LONG
You may select between three different pulse lengths
(pulse durations). A short pulse length gives a better
vertical resolution while a long pulse length is used to
increase the detection range.
There is a close connection between choice of pulse length
and choice of bandwidth. See Bandwidth description
below.
Bandwidth
Options:
NARROW
WIDE
AUTO
Your may select between WIDE and NARROW manual
bandwidth, or AUTO for automatic selection.
A narrow bandwidth results in little noise, but a poor
pulse response. A wide bandwidth lets through more
noise, but improves the pulse response.
In AUTO the bandwidth is automatically adjusted to the
pulse length:
- WIDE bandwidth for Short and Medium pulse length
- NARROW bandwidth for Long pulse length.
Please observe that NARROW bandwidth should not be
used in combination with Short and Medium pulse
length.
Wide bandwidth is approximately 1/10 of the frequency.
Narrow bandwidth is approximately 1/100 of the
frequency.
P3402/C
43
Operation
Max. Power
Options:
0 to 10,000 W in steps of 1 W
Transmit power referred to the transducer terminals.
This setting only affects the value for Pt used in the
computations, not the actual power going out. Refer to
paragraph POWER BUDGET in the section "Theory of
Operation".
2-Way Beam Angle Options:
-99.9 to 0.0 dB in steps of 0.1 dB
Equivalent two-way beam opening solid angle.
Refer to paragraph POWER BUDGET in section "Theory
of Operation".
Sv Transd. Gain
Options:
0.00 to 99.99 dB in steps of 0.01 dB
Peak transducer gain assumed during computation of
volume backscattering strength. Refer to paragraph
POWER BUDGET in section "Theory of Operation".
TS Transd. Gain
Options:
0.00 to 99.99 dB in steps of 0.01 dB
Peak transducer gain assumed during computation of
target strength.
Refer to paragraph POWER BUDGET in section "Theory
of Operation".
44
P3402/C
Simrad EY 500
Angle Sens.
Along
Options:
0.0 to 100.0 in steps of 0.1.
Angle sensitivity in the fore-and-aft direction. Angle
sensitivity of split-beam transducer = electrical angle in
degrees for one mechanical angle in degrees.
Refer to paragraph SPLIT BEAM OPERATION in
section "Theory of Operation".
Angle Sens.
Athw.
Options:
0.0 to 100.0 in steps of 0.1.
Angle sensitivity in the athwartships direction. Angle
sensitivity of split-beam transducer = electrical angle in
degrees for one mechanical angle in degrees.
Refer to paragraph SPLIT BEAM OPERATION in
section "Theory of Operation".
3 dB Beamw.
Along
Options:
0.0 to 99.9 degrees in steps of 0.1 degree.
3 dB beamwidth of transducer in the fore-and-aft
direction.
Refer to paragraph SPLIT-BEAM OPERATION in
section "Theory of Operation".
3 dB Beamw.
Athw.
Options:
0.0 to 99.9 degrees in steps of 0.1 degree.
3 dB beamwidth of transducer in the athwartships
direction.
Refer to paragraph SPLIT-BEAM OPERATION in
section "Theory of Operation".
P3402/C
45
Operation
Alongship Offset
Options:
-9.99 to +9.99 degrees in steps of 0.1 degree.
Mechanical offset angle in the fore-and-aft direction.
Refer to paragraph SPLIT-BEAM OPERATION in
section "Theory of Operation".
Athw.ship Offset Options:
-9.99 to +9.99 degrees in steps of 0.1 degree.
Mechanical offset angle in the athwartships direction.
Refer to paragraph SPLIT-BEAM OPERATION in
section "Theory of Operation".
46
P3402/C
Simrad EY 500
2.6 THE BOTTOM DETECTION MENU
Bottom Detection Menu
Minimum Depth
0.0 m
Maximum Depth
x m
Min. Depth Alarm
0.0 m
Max. Depth Alarm
0 m
Bottom Lost Al.
Off
Minimum Level
-50 dB
The Bottom Detection Menu contains choices for setting up the range of the
bottom detection algorithm and minimum and maximum depth. It also contains
choices for alarm settings and value for minimum bottom echo level. Refer to
paragraph BOTTOM DETECTION in section "Theory of Operation". Setting
minimum and maximum depths to 0 will disable the bottom detector and will
be important when pinging horizontally. Layers should then be of pelagic type
since the latter do not require bottom depth detection.
Minimum Depth
Options:
0.0 to 4,999.9 m in steps of 0.1 m
Minimum depth for the bottom detection algorithm.
The bottom detector algorithm uses the minimum and
maximum depth settings to limit the range of interest for
finding the real bottom. Very often the default values
will not correspond with the presumed depth pattern in
the area of surveying. Therefore, to speed up
computations, you may enter the best values according
to the expected depth.
P3402/C
47
Operation
Maximum Depth Options:
0 to 5,000 m in steps of 1 m
Maximum depth for the bottom detection algorithm. The
default value depends on the transducer installed. A
depth setting of 0 m disables the bottom detection
algorithm. See Minimum Depth description above.
Min. Depth Alarm Options:
0.0 to 4,999.9 m in steps of 0.1 m
Alarm when detected depth is shallower than depth
setting. A depth setting of 0.0 meter disables the alarm.
Max. Depth Alarm Options:
0 to 5,000 m in steps of 1 m.
Alarm when detected depth exceeds depth setting. A
depth setting of 0 meter disables the alarm.
Bottom Lost Alarm Options:
OFF
ON
Alarm when bottom detection is lost.
Minimum Level
Options:
-80 dB to 0 dB in steps of 1 dB.
After bottom detection, the detected depth is decremented in sample steps until the received echo signal
(volume backscattering strength) is below the
MINIMUM LEVEL setting. Refer to paragraph
BOTTOM DETECTION in section "Theory of Operation".
48
P3402/C
Simrad EY 500
2.7 THE LOG MENU
Log Menu
Mode
Ping Interval
Time Interval
Dist. Interval
Distance
Off
100
60 sec
1.0 nm
0.0
The purpose of the Log Menu is to set the intervals between each final
calculation of Sa and TS values. The intervals can be based on pings, time or
distance.
A log distance counter is displayed at the bottom of the menu and is active only
in SPEED mode.
Note that during a log interval it is possible to set the mode to OFF and then
initiate outputs of the log result. This is useful when uneven distance intervals
are needed.
Mode
Options:
OFF
PING
TIME
SPEED
REPLAY
The log mode is either OFF, based on PING or TIME
interval, or SPEED (set in the Navigation Menu) or
REPLAY. The log mode must be in any position but OFF
in order to get Sa and TS tables. Also the TS distribution
bar chart in the TS detection menu needs the log to be
operative. Common for all intervals in the Log Menu is
the end of a measuring period and the calculation of Sa
and TS tables.
In REPLAY, the speed information is filtered from the
file being replayed.
P3402/C
49
Operation
Ping Interval
Options:
10 to 10000 in steps of 1
The averaging interval (along the path travelled by the
vessel) used by the statistical algorithms are entered in
units of number of pings.
Time Interval
Options:
10 to 3600 seconds in steps of 1 second
The averaging interval (along the path travelled by the
vessel) used by the statistical algorithms are entered in
units of seconds.
Dist. Interval
Options:
0.1 to 10.0 nautical miles in 0.1 nm intervals
The averaging interval (along the path travelled by the
vessel) used by the statistical algorithms are entered in
units of nautical miles.
Only in SPEED mode!
Distance
Options:
0 to 9999.9 nm in steps of 0.1 nm.
Sets the EY 500 internal log distance counter. The
counter is typically set according to the vessel’s log. The
log distance counter is displayed at the bottom of the
menu.
Only in SPEED mode!
50
P3402/C
Simrad EY 500
2.8 THE LAYER MENU
Layer Menu
Super Layer
Layer-1 Menu
Layer-2 Menu
Layer-3 Menu
Layer-4 Menu
Layer-6 Menu
Layer-7 Menu
Layer-8 Menu
Layer-9 Menu
Layer-10 Menu
Much of the processing of the EY 500 is related to layers in the water volume.
The layers are either referred to the sea surface or referred to the detected
bottom, and only pings with a successful bottom detection are processed, except
if the layer type is pelagic. For measurements in deep waters, or horizontal
pinging, a pelagic layer type is provided, which is referred to the transducer face
with processing of all pings whether bottom detection is successful or not. A
maximum of ten layers can be defined, and overlapping layers are allowed.
The EY 500 performs independent echo integration and size distribution
processing (applies to split-beam transceiver only) within each layer. Size
distribution and echo integration tables may be printed by the printer and
stored on hard disk. However, for one of the layers, the super layer, also a
graphical presentation on the display is available; a bar chart showing the size
distribution and an inclined line showing the buildup of the integrator. The
super layer status can be attached to any of the ten layers, but only to one at a
time. The output of sample data and scope plots is also controlled by the super
layer settings. Only sample data inside the super layer is output in sample
mode, and the start of a scope plot coincides with the start of the super layer.
The computation of statistical parameters (size distribution and echo
integration) is based on averaging along the path travelled by the vessel. The
averaging interval is often referred to as the log interval. The start and the stop
of the averaging interval are common to all layers. The averaging interval is set
from the Log Menu.
P3402/C
51
Operation
Super Layer
Options:
0 to 10 in steps of 1
The super layer status is attached to one of the ten
layers. Various special functions are related to this layer:
- TS bar chart on display
- fish behaviour window on display
- integration line on display and printer
- SCOPE on printer and display
The super layer is shown with red layer lines on the
display and the printer. All super layer functions are disabled when set to zero.
52
P3402/C
Simrad EY 500
2.8.1 The Layer Submenus
Layer-x
Type
Range
Range Start
Margin
Sv Threshold
Menu
Off
50.0 m
x m
1.0 m
-80 dB
Default range start value depends on layer number.
For description of layers, refer to description in the previous paragraph.
Type
Options:
OFF
SURFACE
BOTTOM
PELAGIC
A layer is either OFF, referred to the sea SURFACE
(bottom detection required for integration and TS
measurements), referred to the detected BOTTOM, or
PELAGIC (referred to the sea surface but with no bottom
detection required). The pelagic type should be used in
deep waters when no bottom detection is available, and
when pinging horizontally.
Range
Options:
0.0 to 1000.0 m in steps of 0.1 m.
Thickness of layer. Should be minimum 2 sample
intervals.
P3402/C
53
Operation
Range Start
Options:
-10.0 to +9999.9 m in steps of 0.1 m.
The upper depth limit of the layer is either referred to
the sea surface (positive values below the surface) or to
the detected bottom (positive values above the bottom).
Margin
Options:
0.0 to 10.0 m in steps of 0.1 m.
The margin parameter causes a surface layer to stop at
the margin distance above the detected bottom and a
bottom layer to stop at the margin distance below the
transducer face. In pelagic layer type this parameter is
ignored.
Sv Threshold
Options:
-100 to 0 dB in steps of 1 dB
Volume backscattering strength threshold value for echo
integration. Refer to paragraph ECHO INTEGRATION
in section "Theory of Operation".
54
P3402/C
Simrad EY 500
2.9 THE TS DETECTION MENU
Single fish detections inside the super layer are displayed as a TS bar chart,
which is updated every log interval. An example is shown below. The bar colours
correspond to echogram colours only when the Min. Value in the TS Detection
Menu is equal to TS Colour Min. in the Echogram Menu.
50%
40%
30%
20%
10%
TS (dB) -50
-44
-38
-32
-26
-20
-14
(CD485)
The shape of the fish behaviour window will be either circle or elliptical
depending on the transducer selected.
P3402/C
55
Operation
2.9.1 The TS Detection Submenu
TS-Detection
Min.
Min.
Max.
Max.
Max.
Value
Echo Length
Echo Length
Gain Comp.
Phase Dev.
-50 dB
0.8
1.5
4.0 dB
4.0
Refer to paragraph SPLIT BEAM OPERATION in section "Theory of
Operation".
Single fish detections inside the super layer are displayed in a fish behaviour
window. In addition, data related to the strongest single echo is displayed
numerically. The figure below shows the position of two fishes in the sound
beam, seen from above. Up to 30 fish echoes may be displayed simultaneously.
(CD480)
Depth
TS compensated
TS uncompensated
Angle along
Angle athwart
56
16.30m
-37.0 dB
-39.0 dB
0.8 dg
2.1 dg
P3402/C
Simrad EY 500
Min. Value
Options:
-100 to 0 dB in steps of 1 dB.
The threshold value for single echo detections. Also lower
boundary for the computation of TS distribution classes
in the TS tables.
Min. Echo Length
Options:
0.0 to 10.0 in steps of 0.1.
For a single echo detection to occur the normalized echo
length (echo length between the 6 dB points relative to
the peak value divided by the duration of the transmitted
pulse) must exceed this parameter.
Max. Echo Length Options:
0.0 to 10.0 in steps of 0.1.
A single echo detection requires the normalized echo
length to be less than the max echo length setting.
Max. Gain Comp
Options:
0.0 to 6.0 dB in steps of 0.1 dB.
The correction value returned from the transducer gain
model must not exceed the max gain compensation
setting. (This is the one-way max. gain compensation, the
two-way max. compensation will be 12 dB).
All echoes outside the angle corresponding to the chosen
gain compensation are skipped. Thus one can reduce the
sample volume (beam angle) by choosing a lower value
for max. gain compensation.
P3402/C
57
Operation
Max. Phase Dev
Options:
0.0 to 10.0 in steps of 0.1.
Average electrical phase jitter between samples inside an
echo pulse must not exceed the max phase deviation
setting where max phase deviation is set in units of
phase steps (64 phase steps = 180 electrical degrees).
This parameter controls one of several mechanisms for
isolating echoes from single fish. Recommended setting
is 2 - 3 for normal conditions. For weak echoes in noisy
conditions one should allow more jitter (4 - 10).
58
P3402/C
Simrad EY 500
2.10 THE DISK MENU
Disk Menu
Log
Off
Max File Size
10 Mb
Drive
C
Directory
\EY500
Replay File Name
Replay Forever
Off
Telegram Menu
Echogram Menu
The Disk Menu is used to turn the logging to disk ON/OFF, to choose maximum
file size, disk drive, the directory path, the name of the file to be replayed, and
to select the Telegram Menu and the Echogram Menu. The Max. File Size
setting is used for defining the limit of the file containing the current data
telegrams. The Telegram Menu is used to select which data to be sent to the
disk. The Echogram Menu is used to set up the echogram to be sent to disk.
Log
Options:
OFF
ON
When LOG is ON, selected telegrams will be written to
a file on the disk. The name of this file is automatically
given at creation time. When the current file reaches the
maximum size set in the MAX. FILE SIZE submenu, the
file is closed and the next file is created. The file is stored
in the directory selected by the DIRECTORY command.
Max. File Size
Options:
1 Mb
2 Mb
5 Mb
10 Mb
20 Mb
P3402/C
59
Operation
50 Mb
100 Mb
Refer to description under Log (above).
Drive
Options:
A through Z
To select the drive to be used for logging or replaying.
Directory
Options:
To select the directory path to be used for logging or
replaying. The path may include several subdirectory
levels. Both the / and the \ may be used in the path
name.
Replay File Name
Options
To select the file to be replayed.
Replay Forever
Options
OFF
ON
When set to ON, the file being replayed will start anew
each time it is finished.
60
P3402/C
Simrad EY 500
2.10.1 The Disk/Telegram Menu
DISK/Telegram Menu
Sample Range
Status
Parameter
Annotation
Navigation
Depth
Echogram
Echo-Trace
Sv
Sample Angle
Sample Power
Sample Sv
Sample TS
Vessel-Log
Layer
Integrator
TS Distribution
0 m
Off
Off
Off
Off
Off
Off
Off
Off
Off
Off
Off
Off
Off
Off
Off
Off
The DISK/Telegram Menu is used to select which data is to be sent to the disk.
The selected data is collected in a file which has the file name setup described
in paragraph 1.4.
The sample range sets the total range per ping for the sample data telegrams.
The following table lists the contents of each telegram. Common for all
telegrams is a 4-byte integer value header containing the number of bytes in the
current telegram.
All telegrams contain number of bytes in the telegram, header, time (hour,
minute, second, hundredth). Some telegrams include the date (year, month,
day).
A detailed telegram description is given in section "Description of Telegrams
and Remote Control".
P3402/C
61
Operation
Telegram type
Identifier
Recommended
for EP 500
Sample Range
Recommended
for
replay
Contents
*
Max. range for collecting sample data.
Status
ST
Error, warning or alarm message
Parameter
PE
*
Annotation
CS
*
*
Annotation output telegram.
Navigation
GL
*
*
Navigation output telegram
Depth
D1
*
Detected bottom depth (m)
Echogram
Q1
*
TVG type, detected bottom depth (m), upper
depth of pelagic echogram (m), number of
pelagic echogram data points, upper depth of
bottom echogram (m), lower depth of bottom
echogram (meter), number of bottom echogram
data points and echogram data.
Echo-Trace
E1
*
Number of echo-traces (single-fish detections),
target depth (m), compensated TS (dB),
uncompensated TS (dB), alongship angle
(degree), athwartships angle (degree)
Sv
S1
Sample Angle
B1
*
Sample angle data (max. 10000 samples). Only
used in split-beam system.
Sample Power
W1
*
Sample power data (max. 10000 samples)
Sample Sv
V1
Sample Sv data (max. 10000 samples)
Sample TS
P1
Sample TS data (max. 10000 samples)
Parameter enter or parameter request output
telegram
Layer identifier (1-10), mean Sv per ping
within layer (dB), mean effective thickness of
layer (meter),
VL
*
*
Vessel log distance (nautical miles)
Layer
LL
*
Super layer identifier (1-10), number of active
layers, layer limits for each layer
Integrator
A1
*
Integrator data
TS Distribution
H1
*
Lower boundary of TS range (dB), number of
detections within layer, detections per TS class
(%)
Vessel-Log
Table 1. Telegram types.
62
P3402/C
Simrad EY 500
2.10.2 The Disk/Echogram Menu
DISK/Echogram Menu
Range
100 m
Range Start
0 m
Auto Range
Off
Bottom Range
15 m
Bot. Range Start
10 m
No. of Main Val.
250
No. of Bot. Val.
75
TVG
20 log R
The DISK/Echogram Menu is used to set up the echogram to be sent as a
telegram to the hard disk.
Range
Options:
1m
250 m
5m
500 m
10 m 1000 m
15 m 1500 m
25 m 2500 m
50 m
100 m
150 m
Depth range across echogram.
Range Start
Options:
0 to 2500 meters in steps of 1 m
Upper start depth of echogram.
This parameter is only significant while Auto Range is
OFF.
P3402/C
63
Operation
Auto Range
Options:
OFF
ON
Automatic adjustment of Range Start aimed at
maintaining the bottom echo inside the echogram. Auto
Range ON implies that the Range Start value has no
significance.
Bottom Range
Options:
0 to 100 m in steps of 1 m.
Range of bottom echogram.
Bot. Range Start Options:
-100 m to +100 m in steps of 1 m.
This command sets the upper start depth of bottom
echogram relative to detected bottom depth; positive
values above the bottom and negative values below the
bottom.
No. of Main Val. Options:
0 to 700 in steps of 1.
Resolution of main echogram range (number of main
echogram values).
No. of Bot. Val.
Options:
0 to 500 in steps of 1.
Resolution of bottom echogram range (number of bottom
echogram values).
64
P3402/C
Simrad EY 500
TVG
Options:
20 log R
40 log R
This parameter controls which transmission loss
compensation algorithm is to be used (TVG = Time
Variable Gain). 20 log R is selected for echogram
presentation of volume back-scattering strength, and 40
log R for presentation of target strength.
For postprocessing with integration, 20 log R should be
chosen.
P3402/C
65
Operation
2.11 THE SERIAL COMMUNICATION MENU
SERIAL COM. MENU
Telegram Menu
USART Menu
Echogram Menu
This menu is used for entry to the different Serial Communication submenus.
The default COM2 port on the PC is used for this serial line input/output.
COM1 is used for navigation input. Switching between COM1 and COM2 can
be done in the Utility Menu (COM1/COM2 switch).
For more information, refer to the section "Description of Telegrams and Remote
Control".
66
P3402/C
Simrad EY 500
2.11.1 The SERIAL/Telegram Menu
SERIAL/Telegram Menu
Format
Modem Control
Remote Control
Status
Parameter
Annotation
Navigation
Depth
Depth NMEA
Echogram
Echo-Trace
Sv
Vessel-Log
Layer
Integrator
TS Distribution
Binary
On
On
Off
Off
Off
Off
Off
Off
Off
Off
Off
Off
Off
Off
Off
This menu basically controls the composition of output data telegrams on the
serial port. For details about telegrams, refer to section "Description of
Telegrams and Remote Control".
Format
Options:
ASCII
Binary
To select ASCII or binary format for output telegrams.
The formats are described in detail in the section
"Description of Telegrams and Remote Control".
If on-line EP 500 is used for reading EY 500 data on
serial line, the binary format must be chosen.
P3402/C
67
Operation
Modem Control
Options:
OFF
ON
To enable modem data transfer.
When Modem Control is ON, a command string for
enabling of "auto answer mode" is sent. This enables the
echo sounder to be called remotely and for data to be
transferred through the telephone network.
Remote Control
Options:
OFF
ON
Ignore or interpret input telegrams.
Status
Options:
OFF
ON
Error/warning/alarm output telegram.
Parameter
Options:
OFF
ON
Parameter enter and parameter request output telegram.
Annotation
Options:
OFF
ON
Annotation output telegram.
68
P3402/C
Simrad EY 500
Navigation
Options:
OFF
ON
Navigation output telegram.
Depth
Options:
OFF
ON
Detected depth output telegram.
Depth NMEA
Options:
OFF
ON
Detected depth output NMEA telegram.
Echogram
Options:
OFF
ON
This output telegram may be used by postprocessing
systems (e.g. EP 500 or BI 500) and allows an entire
cruise to be replayed off line on a general purpose computer.
Echo-Trace
Options:
OFF
ON
Single echo detection output telegram.
Sv
Options:
OFF
ON
Output telegram containing mean volume backscattering
strength per ping within each of the layers.
P3402/C
69
Operation
Vessel-Log
Options:
OFF
ON
Output telegram reporting that a simulated log pulse has
been detected. Typically, there are 200 pulses per
nautical mile generated in simulated vessel speed.
Layer
Options:
OFF
ON
Output telegram containing the layer parameter settings
every averaging interval.
Integrator
Options:
OFF
ON
Output telegram containing echo integration results for
every averaging interval.
TS Distribution
Options:
OFF
ON
Output telegram containing TS distributions for every
averaging interval.
70
P3402/C
Simrad EY 500
2.11.2 The SERIAL/USART Menu
SERIAL/USART Menu
Baudrate
Bits Per Char.
Stop Bits
Parity
9600
8
1
None
This menu is used to set up baudrate, bits per character, number of stop bits
and parity for serial telegrams.
Baudrate
Options:
300
600
1200
2400
4800
9600
19200
38400
57600
115200
Baudrate in bits per second (RS232 port).
Bits per Char
Options:
7
8
Number of bits per character (RS232 port).
Stop Bits
Options:
1
2
Number of stop bits (RS232 port).
Parity
Options:
NONE
ODD
EVEN
Type of parity (RS232 port).
P3402/C
71
Operation
2.11.3 The SERIAL/Echogram Menu
SERIAL/Echogram Menu
Range
Range Start
Auto Range
Bottom Range
Bot. Range Start
No. of Main Val.
No. of Bot. Val.
TVG
100 m
0 m
Off
15 m
10 m
250
75
20 log R
This menu is used to enter settings for echograms to be transmitted via the
serial port.
Range
Options:
1m
250 m
5m
500 m
10 m 1000 m
15 m 1500 m
25 m 2500 m
50 m
100 m
150 m
Depth range across echogram.
Range Start
Options:
0 to 2500 m in steps of 1 m.
Upper start depth of echogram.
This parameter is only significant while Auto Range is
OFF.
72
P3402/C
Simrad EY 500
Auto Range
Options:
OFF
ON
Automatic adjustment of Range Start aimed at
maintaining the bottom echo inside the echogram. Auto
Range implies that the Range Start value has no
significance.
Bottom Range
Options:
0 to 100 m in 1 m steps.
Range of bottom echogram.
Bot. Range Start Options:
-100 m to +100 m in steps of 1 m
This command sets the upper start depth of bottom
echogram relative to detected bottom depth; positive
values above the bottom and negative values below the
bottom.
No. of Main Val. Options:
0 to 700 in steps of 1.
Resolution of main echogram (number of main echogram
values).
No. of Bot. Val.
Options:
0 to 500 in steps of 1.
Resolution of bottom echogram (number of bottom
echogram values).
P3402/C
73
Operation
TVG
Options:
20 log R
40 log R
This parameter controls which transmission loss
compensation algorithm is to be used (TVG = Time Variable Gain). 20 log R is selected for echogram presentation
of volume backscattering strength, and 40 log R for
presentation of target strength.
74
P3402/C
Simrad EY 500
2.12 THE ANNOTATION MENU
Annotation Menu
Event Counter
Counter Mode
Time Interval
Text
0
Increase
0 min
The Annotation Menu contains the possibilities of entering event count
numbers, choosing the time between date/time annotations and inserting text
to be stored and/or printed.
Event Counter
Options:
0 to 10,000 in steps of 1.
Entering an event count number causes an event with
the selected number. Hence, events can be generated
from the menu just by entering the current event counter
value.
An event results in a red vertical line across the echogram on display and printer, if the event marker
parameter in the DISPLAY/PRINTER Menu is ON. On
the printout is also included the current event number.
Counter Mode
Options:
Increase
Decrease.
This command makes it possible to choose between
increasing or decreasing the event number each time an
event is generated.
Time Interval
Options:
0 to 60 minutes in steps of 1 minute.
Entering a value of n minutes will cause a date/time
annotation to occur every nth minute. A value of 0
disables the function.
P3402/C
75
Operation
Text
76
Selecting this entry results in a cursor for start of input
of text. Maximum length of text string is 80 characters.
Input is terminated by pressing the ENTER key.
P3402/C
Simrad EY 500
2.13 THE NAVIGATION MENU
Navigation Menu
Navig. Input
SERIAL
Start Sequence
$GPGLL
Separation Char.
002C
Stop Character
000D
First Field No.
2
No. of Fields
4
Speed Input
Manual
Manual Speed
10.0 knt
Baudrate
4800
Bits Per Char.
8
Stop Bits
1
Parity
None
The decoding of navigation input telegrams is based on the recognition of a start
sequence, a field separation character and a stop character. The "useful"
substring within the total telegram is identified by specifying the position of the
first field and the number of fields to be included in the navigation data
substring.
In the start sequence up to 6 start characters may be defined. However, if there
is no trouble with ambiguity, some of the characters may be set to ? which
indicates "don’t care" to test against equality.
NMEA 0183 navigation telegrams are properly interpreted using the default
settings shown above. Assuming the NMEA 0183 telegram
$GPGLL,4728.31,N,12254.25,W<CR><LF>
the "useful" navigation data substring becomes
4728.31,N,12254.25,W
Note that <CR> denotes carriage return and <LF> denotes linefeed.
The useful part of the incoming navigation telegrams is continuously displayed
when the Navigation Menu is selected.
P3402/C
77
Operation
The navigation port default may be configured for different baudrates and
communication protocols. It is possible to switch between COM1 and COM2
using the COM1/COM2 Switch in the Utility Menu.
Refer to the end of this paragraph for a table showing ASCII characters versus
hexadecimal representation
Navig. Input
Options:
OFF
SERIAL
To select the source of navigation input. OFF disables
input of navigation telegrams.
Start Sequence
Options:
0020h to 007Fh.
First characters of telegram.
Up to 6 characters to be set in a sequence.
The ? sign indicates a don’t care character.
Separation Char
Options:
0000h to 007Fh.
Field separation character.
("," corresponds to ASCII 2C hex)
Stop Character
Options:
0000h to 007Fh.
Last character of telegram.
(<LF> corresponds to ASCII 0A hex)
First Field No.
Options:
1 to 100 in steps of 1.
Position of first field of navigation data substring.
78
P3402/C
Simrad EY 500
No. of Fields
Options:
1 to 100 in steps of 1.
Number of fields to be included in navigation data
substring.
Speed Input
Options:
MANUAL
SERIAL
The speed input may be received via the serial port or
set manually (see Manual Speed).
Manual Speed
Options:
0.0 to 25.0 knots in steps of 1 knot
To set manual speed.
If Log Menu/Log Mode is set to SPEED, the Manual
Speed should be set to a number greater than zero to
obtain log intervals.
Baudrate
Options:
300
600
1200
2400
4800
9600
19200
Baudrate in bits per second (navigation port).
Bits per Char.
Options:
7
8
Number of bits per character (navigation port).
P3402/C
79
Operation
Stop Bits
Options:
1
2
Number of stop bits (navigation port).
Parity
Options:
NONE
ODD
EVEN
Type of parity (navigation port).
80
P3402/C
Simrad EY 500
ASCII CHARACTERS VERSUS HEXADECIMAL REPRESENTATION
0x
1x
2x
3x
4x
5x
6x
7x
4
x0 NUL
DLE
space
0
@
P
p
x1 SOH
DC1
!
1
A
Q
a
q
x2 STX
DC2
"
2
B
R
b
r
x3 ETX
DC3
#
3
C
S
c
s
x4 EOT
DC4
$
4
D
T
d
t
x5 ENQ
NAC
%
5
E
U
e
u
x6 ACK
SYNC
&
6
F
V
f
v
x7 BEL
ETB
’
7
G
W
g
w
x8 BS
CAN
(
8
H
X
h
x
x9 HT
EM
)
9
I
Y
i
y
xA LF
SUB
*
:
J
Z
j
z
xB VT
ESC
+
;
K
[
k
{
xC FF
FS
,
<
L
\
l
|
xD CR
GS
=
M
]
m
}
xE SO
RS
.
>
N
^
n
~
US
/
?
O
_
o
DEL
xF SI
P3402/C
81
Operation
2.14 THE UTILITY MENU
Utility Menu
Beeper
On
Status Messages
On
Date
yy.mm.dd
Time
hh.mm.ss
External Clock
Off
Password
0
Default Setting
No
Language
English
Sound Velocity 1500 m/s
COM1/COM2 Switch
On
The Utility Menu contains different commands, like Beeper ON/OFF, Default
settings YES/NO etc.
Beeper
Options:
OFF
ON
Beeper ON/OFF. The beeper outputs short sound signals
for status messages/warnings and long tones for alarms.
Status Messages
Options:
OFF
ON
Enables/disables error, warning and alarm messages on
the display.
Date
Year, month and day are entered as a triplet into the PC
internal clock (battery backup power).
Time
Hour, minute and second are entered as a triplet into the
PC internal clock (battery backup power).
82
P3402/C
Simrad EY 500
External Clock
Options:
OFF
SERIAL
This command synchronizes the echo sounder with
external clock via the serial port.
Password
Options:
0 to 9999.
A password number in the range 0 to 9999 can be
entered. The menu system is blocked until the selected
password is re-entered.
Default Settings
Options:
NO
YES
Simrad default settings are entered for all parameters
when specifying YES.
Language
Options:
ENGLISH
FRENCH
GERMAN
NORW.
To choose between English, French, German or
Norwegian menu texts.
Sound Velocity
Options:
1400 to 1700 m/s in steps of 1 m/s
The sound velocity in the sea varies with temperature,
salinity and pressure. The default value assumes a
constant velocity of 1500 m/s for all depths.
Note that the echogram will be velocity compensated.
Refer to the sound velocity diagram in section
"Calibration".
P3402/C
83
Operation
COM1/COM2
Switch
Options:
OFF
ON
If OFF is selected:
COM1 = navigation input
COM2 = remote control/telegrams
If ON is selected:
COM1 = remote control/telegrams
COM2 = navigation input
84
P3402/C
Simrad EY 500
2.15 THE TEST MENU
Test Menu
Message
Transceiver
Version
Counter
Scope
Serial Port
Simrad
The Test Menu is used for checking the receiver response, to display the current
version of the EY 500 software, and to display amplitude and phase data of a
single ping. The final menu entry is for Simrad personnel only.
Message
Options:
OFF
ON
When Message is set to ON, a test message will be
transmitted to the serial communication port COM1.
Example:
phase
amplitude athwarts. depth
9
9
9
XX1:,-110.5, 12, 20,-120.3,167.5,dummy,dummy,
8
8
8
transceiver phase noise
No.
along
Transceiver
P3402/C
This menu entry is primarily used for checking the
receiver response. For every ping, the display shows:
- the amplitude (Ampl.) of sample 511 (dBW)
- the fore-and-aft (Alo.) electrical phase of sample 511
(phase steps)
- the athwartships (Ath.) electrical phase of sample 511
(phase steps)
- the background noise level (dBW)
85
Operation
Version.
The EY 500 software version is displayed.
Counter
The CPU activity is displayed. A large number indicates
that there is spare CPU time, and zero implies that the
CPU is fully utilized or not running.
Scope
This menu entry is used to display sample amplitude
data. Start of sample data is referred to the current
super layer. The layout is very similar to SCOPE on the
printer described in paragraph 2.5.1.
The first parameter to be set is the dynamic range for the
plot. The second parameter to be set is the lowest
amplitude value to be included in the plot.
Serial Port
This menu entry is used to test the serial line
communication for COM1 and COM2. The last input and
output bytes detected by the interface are shown.
Simrad
Simrad use only.
86
P3402/C
Theory of operation
THEORY OF OPERATION
P3403E / 857-160020 / AA062
This section contains some of the theory behind the measurements performed
by the EY 500; bottom detection, echogram generation, echo integration and
target strength statistics.
P3403E/A
1
Simrad EY 500
Document revisions
Rev
A
2
Documentation
department
Hardware/Software
Design
Project/Product
Management
Date
Sign
Date
Sign
Date
Sign
25.08.95
CL
25.08.95
HS
31.08.95
RB
P3403E/A
Theory of operation
List of contents
1 INTRODUCTION . . . . . . . . . . . . . . . . . . . . . . . . . . . . . . . . . . . . . . . . . . .
1.1 GENERAL DESCRIPTION . . . . . . . . . . . . . . . . . . . . . . . . . . . . . . . .
1.2 THE TRANSCEIVER . . . . . . . . . . . . . . . . . . . . . . . . . . . . . . . . . . . . .
1.3 THE SIGNAL PROCESSING . . . . . . . . . . . . . . . . . . . . . . . . . . . . . .
5
5
5
5
2 POWER BUDGET . . . . . . . . . . . . . . . . . . . . . . . . . . . . . . . . . . . . . . . . . . .
5
3 EY 500 DB FORMAT . . . . . . . . . . . . . . . . . . . . . . . . . . . . . . . . . . . . . . . . 11
4 BOTTOM DETECTION . . . . . . . . . . . . . . . . . . . . . . . . . . . . . . . . . . . . . . 11
5 BOTTOM RANGE . . . . . . . . . . . . . . . . . . . . . . . . . . . . . . . . . . . . . . . . . . . 12
6 ECHO INTEGRATION . . . . . . . . . . . . . . . . . . . . . . . . . . . . . . . . . . . . . . . 12
7 SPLIT-BEAM OPERATION . . . . . . . . . . . . . . . . . . . . . . . . . . . . . . . . . . . 14
8 IMPULSE RESPONSE . . . . . . . . . . . . . . . . . . . . . . . . . . . . . . . . . . . . . . . 16
9 NOISE . . . . . . . . . . . . . . . . . . . . . . . . . . . . . . . . . . . . . . . . . . . . . . . . . . . . 17
10 ABSORPTION COEFFICIENT . . . . . . . . . . . . . . . . . . . . . . . . . . . . . . . . 18
11 SOUND VELOCITY . . . . . . . . . . . . . . . . . . . . . . . . . . . . . . . . . . . . . . . . 19
P3403E/A
3
Simrad EY 500
Document history
(The information on this page is for Simrad’s internal use)
Rev. A Original issue. First edition as module. Was section 4 of P2473E.
4
P3403E/A
Theory of operation
1 INTRODUCTION
1.1 GENERAL DESCRIPTION
The EY 500 system performs bottom detection, echogram generation and echo
integration, and for split-beam systems also target strength statistics are
estimated. This section gives some theory behind this performance.
1.2 THE TRANSCEIVER
The transceiver contains transmitter, receiver and A/D-conversion circuitry.
The receiver does not contain any TVG (Time Varying Gain) function as the
EY 500 carries out this function solely in software. Instead, the receiving system
is designed as a "power meter" with a large instantaneous dynamic range. Input
power levels from -160 dBW to 0 dBW (dB’s relative 1 W) are measured to a
precision of a fraction of a dB and are output to the signal processor as 16-bit
digital words using the dBW scale for numeric representation. The receiver
includes one receiving channel for single-beam operation and four matched
channels plus phase measurement circuitry for split-beam operation.
1.3 THE SIGNAL PROCESSING
The signal processing is done by software in the PC. It takes care of control of
the transmitter/receiver and processing of received data.
The software generates echograms, and estimates physical parameters (depth,
volume backscattering strength, target strength etc) from the received signal
samples by taking into account instrumental effects, transmission losses and
transmitted power.
2 POWER BUDGET
The EY 500 utilizes a sophisticated receiver design which is characterized by a
very high amplitude measurement accuracy over the entire dynamic input range
(-160 dBW to 0 dBW). The absolute power level of the received signal is
measured enabling the EY 500 to estimate volume backscattering strength and
target strength in the absolute sense. The estimation algorithm is based on a
physical model which accurately accounts for instrumental effects and
propagation losses. This model will be outlined in order to assure that the
measured output scattering parameters are correctly interpreted.
The radiation and receiving properties of a transducer is traditionally stated in
terms of source level, directivity index, receiving response etc. However, the
P3403E/A
5
Simrad EY 500
algorithms of the EY 500 uses the more modern concept of gain in order to
facilitate power budget equations. The gain concept is used widely within many
fields in physics and is accepted internationally as a convenient measure of the
radiation properties.
Gain is defined as the intensity ratio observed at a distant point when using a
real transducer and an idealized lossless omni-directional transducer keeping
the electrical input power constant (see figure.1).
Transducer
Electrical
power
Observer
Figure 1 The gain concept.
Thus, gain accounts for both directional properties and losses and is independent of input power level, impedance and observation point. However, gain must
be referred to a defined point on the terminal side of the transducer in order to
uniquely identify the losses which are to be included. Gain (G) relates to
directivity (D) as shown in equation 1:
*( , )' @'( , ) (1)
where " and ß are the directional angles, and 0 is the efficiency of the
transducer. Thus, directivity is a normalized quantity which corresponds to the
gain pattern of an identical but lossless transducer. Whereas gain is used for
describing the radiation properties, it is common to state the receiving
properties in terms of the effective receiving area (A).
6
P3403E/A
Theory of operation
Gain and effective receiving area are related by reciprocity as shown in equation
2:
$'
2
4
* (2)
where 8 is the wavelength and where A and G are both referred to the same
point on the terminal side of the transducer. Figure 2 shows the gain pattern of
a typical transducer.
(CD477)
Figure 2 Beam pattern.
The echo from a small object, henceforth the target, is described by equation (3):
3U'3W*
P3403E/A
10& U
4 U2
10& U 2
* (3)
4 U2 4
7
Simrad EY 500
where
P and P are the received and transmitted power referred to the transducer
r
t
terminals.
G
is the transducer gain towards the target.
r
is the transducer target range.
"
is the attenuation constant.
F
is the effective backscattering cross-section area of the target.
8
is the wavelength.
This expression can be recognized as the classic radar equation, and its
derivation will be recapitulated.
Assuming an idealized lossless isotropic transducer the transmitted power will
propagate evenly in all directions, and the power density at the transducertarget range is explained in expression 4:
3W
4 U2
(4)
The real transducer amplifies the radiated signal by a factor G in the direction
of the target, and attenuation occurs while propagating from the transducer to
the target. Hence, the real power density at the target becomes:
3W *
10& U
(5)
4 U2
The ability of an object to backscatter energy is stated in terms of its effective
backscattering cross section area, henceforth the backscattering area, which
roughly corresponds to the physical cross section area as seen from the
transducer. Introducing this concept in the derivation the real target can be
replaced by an isotropic transmitter of power:
3W *
10& U
4 U2
(6)
While propagating back towards the transducer attenuation and spherical
spreading occur once more, and the power density at the transducer becomes:
8
P3403E/A
Theory of operation
3W *
10& U
4 U2
10& U
(7)
4 U2
Received power at the transducer terminals is obtained by multiplying this
power density by the effective receiving area of the transducer, and the complete
equation becomes:
3U'3W *
10& U
4 U2
10& U 2
* (8)
4 U2 4
Rearranging the terms a simple expression is obtained for calculating the echo
properties of the target (equation 9):
3 64
' U
3W* 2
3
U 4102 U
2
(9)
In hydroacoustics it is common to state the echo properties in terms of
backscattering strength rather than backscattering area, and the equivalent
expression for point backscattering strength becomes (equation 10):
6S'
4
U02
'
3U16
3W*
2
U02 2
2
U 4102 U
(10)
where r0 = 1 meter is the reference range for backscattering strength. Finally,
the EY 500 implements a logarithmic version of this equation 11:
4
2 U
10OJ(6S)'10OJ(3U)%10OJ(U 10
)&10OJ(
3W* 2U02
16
2
2
)
(11)
The left-hand side of this equation is commonly referred to as the target
strength or simply TS. Thus, target strength is obtained by adding a range
dependent term (corresponds to 40-log-r TVG) and a constant (accounts for
equipment parameters) to the received signal power (digital word from
transceiver/digitizer).
It should be observed that many of the internal algorithms of the sounder are
based on the quantity 10log(SP); TS echogram generation, size distribution
statistics etc.
P3403E/A
9
Simrad EY 500
Having established the basic power budget equation for point backscattering,
the extension to volume backscattering is straightforward. Whereas scattering
from a small object is characterized by its backscattering area, the scattering
from a homogeneous volume is characterized by the backscattering area per unit
of water volume,MF/MV. The equation for received power becomes (equation 12):
3U'
m9
3W*
10& U M 10& U 2
* G9 (12)
4 U 2 M9 4 U 2 4
where MF/MVdV is the backscattering area is from the small volume dV and
where integration includes all volume V contributing to the received signal at
a particular instant.
With a pulsed transmitter the volume V corresponds to a sphere of thickness
cJ/2 where c is the propagation speed in water and J is the transmit pulse
duration. Thus, the three-dimensional integration over V can be replaced by a
two dimensional integration over all solid angles 4B (dV =½cJr2dS), equation 13:
3U'3W
10& U M 10& U 2 F 2
U
* 2G
2 M9
2 4
m
4
2
4 U
4 U
(13)
The equivalent two-way solid beam angle Q is a key transducer parameter and
is defined (equation 14):
m4
* 2G '*02
(14)
where G0 is the peak gain. Introducing this definition, rearranging the terms
and normalizing with respect to r0 the expression for volume backscattering
strength becomes (equation 15):
6Y'
M /MY
4
U02
'
3U32
2
3W*02U02 2F
U 2102 U (15)
Again, the EY 500 implements a logarithmic version of this equation (equation
16):
3 *02U02 2F
10log(6Y)'10OJ(3U)%10OJ(U 2102 U)&10OJ( W
32 2
) (16)
Thus, volume backscattering strength is obtained by adding a range dependent
term (corresponds to 20-log-r TVG) and a constant to the received signal power.
The quantity 10log(Sv) is used by many of the internal algorithms of the
sounder; Sv echogram generation, echo integration, bottom detection etc.
10
P3403E/A
Theory of operation
3 EY 500 DB FORMAT
Simple conversion between dB and linear scale is obtained in a computer by
using 10 dB x log(2) = 3.0103··· dB as a reference value in the dB domain. The
EY 500 algorithms use 16-bit words to represent dB quantities.
A
B
XXXXXXXX XXXXXXXX
The eight most significant bits (A) correspond to the integer part relative
3.0103··· dB and the eight least significant bits (B) correspond to the fractional
part. Thus, the least significant bit corresponds to an increase/decrease of
3.0103··· dB/256 . 0.01 dB. Assuming as an example the linear decimal number
178.125 the value of A and B becomes
10 dB x log(178.125) = 22.507··· dB
A
B
22.507···/3.0103··· = 7.4767··· = 00000111.01111010
Conversion to linear scale is based on the relation
100.30103··· x A.B = 2A.B = 2A+0.B = 2A x 20.B
Evidently, the upper byte A is simply the exponent in binary floating point
format, and 2 to the power 0.B is the mantissa. Thus, the mantissa can be
obtained by using B as the address in an antilog lookup table containing 256
elements, and a similar technique can be used for the inverse conversion from
linear to dB scale.
4 BOTTOM DETECTION
The bottom detection algorithm is implemented solely in software. The
algorithm is designed with emphasis on reliability in the sense that erroneous
depth detections are never output. Whenever uncertainty is associated with a
detection the algorithm outputs zero depth to indicate that no reliable detection
was obtained. The algorithm is designed to maintain bottom lock for a
discontinuous jump in bottom depth, and special features have been included
in order to avoid false bottom detection on schools of fish. Operational
experience has shown that the algorithm indeed is quite robust; erroneous
bottom detections are virtually absent, a dense school of fish does not confuse
the algorithm, rough bottom contours cause only a few dropouts to occur.
Basically the algorithm is implemented as a fourfold tracking algorithm. For
each ping up to four candidate bottom returns are identified, and their
association with previous bottom candidates is determined in order to perform
P3403E/A
11
Simrad EY 500
individual tracking of several potential bottoms simultaneously. For example,
bottom return number one could be from a large school of fish, return two from
the true bottom, and return three could be the echo which has travelled twice
up and down between the surface and the bottom.
In conjunction with echo integration it is vital that the bottom return is not
included in the integration process. After bottom detection, therefore, an
algorithm is activated which decrements the detected depth in small steps until
the received echo signal has vanished. Experience has shown that this last
technique substantially improves echo integration near the bottom. However,
it should be observed that for an inclined bottom the detected depth tends to be
slightly shallower than the true depth along the transducer axis.
5 BOTTOM RANGE
Bottom range is available on the display and on the printer and allows the
echogram relative to detected bottom to be shown with a resolution different
from that of the main echogram. This feature is useful when studying soft
sediment layers and bottom consistency. Waves propagating down into the
bottom are strongly attenuated, and echoes from subbottom layers are soon
below the dynamic range of the echogram colour scale. Hence, additional
amplification (performed in software) brings these echoes into the visible range.
Excess amplification is set from the menu system in dB’s per meter below the
detected bottom. A typical value would be 0.5 dB/m. However, the optimum
value will depend on bottom type and frequency and should be found
experimentally.
6 ECHO INTEGRATION
The method of echo integration is recognized as an efficient and reliable
technique for fish stock assessment. The EY 500 performs integration within
independently set depth layers. Basically, the integrator performs integration
in the vertical direction within the layers and averaging in the horizontal
direction along the path travelled by the vessel. The integration process is based
on the quantity 10log(Sv) and is defined by the equations 17, 18 and 19:
M
'4 U02 69
M9
U M
M
' 2
GU
M$ mU1 M9
(18)
M
]
M$
(19)
$ 'PHDQ[
12
(17)
P3403E/A
Theory of operation
The first equation converts volume backscattering strength to backscattering
area per unit of volume. The corresponding backscattering area per unit of
horizontal area is obtained by integrating over the layer vertically, r1 to r2. The
output parameter from the integrator each averaging interval FA represents the
mean backscattering area per unit of horizontal area and is obtained by
averaging the individual MF/MA’s over one interval. The quantity sA (m2/nm2) is
related to FA (m2/m2) as:
V$'(1852P/QP)2 $
(20)
The algorithm implemented by the sounder is obtained by combining the four
equations
U
V$' 4 U02 @ PHDQ [ 269GU]@(1852P/QP)2
mU1
(21)
Calibrating the sounder for the first time with a reference target a small
discrepancy will most likely be observed between the measured SA and the
theoretically computed value (refer to section "Installation, System Test and
Calibration"). This discrepancy is due to differences between the true and the
nominal value of physical parameters; transducer gain, attenuation constant,
transmit power etc. Agreement between the echo integrator output and the
theoretically computed value is obtained by finetuning the peak transducer gain
parameter (equation for volume backscattering strength in paragraph 2). This
parameter is set from the menu system in units of dB. Note that different peak
transducer gain parameters are used for computing target strength and volume
backscattering strength.
To find mean Sv from sA (equation 22):
6Y'
P3403E/A
V$
4
U02 (1852 P/QP)2@(U2&U1)
(22)
13
Simrad EY 500
7 SPLIT-BEAM OPERATION
Observation of fish with the EY 500 is based on echo integration for assessment
of the total biomass and the split-beam technique for assessment of the size
distribution of individuals. Thus, the split-beam feature represents a valuable
supplement to echo integration.
.
FORE
FP
FS
PORT
STARBOARD
AP
AS
AFT
(CD469)
Figure 3 Split-beam transducer.
A split-beam transducer is electrically divided into four quadrants as shown in
figure 3. All four quadrants are excited in parallel during transmission.
However, the received signal from each quadrant is amplified separately in a
four-channel matched receiver allowing the direction of arrival of an echo to be
determined. An acoustic wavefront propagating towards the transducer arrives
at different times at the four quadrants causing the phase angle of the electrical
output signal from the quadrants to differ. The fore-and-aft angle is determined
from the electrical phase difference between the fore and the aft transducer
halves (the FP+FS signal relative the AP+AS signal), and the athwartships
angle from the starboard and port signals (the FS+AS signal relative to the
FP+AP signal). The ratio between the electrical and mechanical angle is
referred to as the "angle sensitivity" of the transducer (see table under
Transceiver Menu in section "Operation").
In figure 4 fish "A" is positioned along the transducer axis where maximum
transducer gain occurs, and fish "B" is positioned towards the edge of the beam
where the gain is lower. Evidently, the echo signal from fish "A" will be stronger
than the signal from fish "B" even though they are of the same size and at the
same depth.
14
P3403E/A
Theory of operation
Thus, determining fish size from received echo strength alone will not be
successful. However, knowing the beam pattern of the transducer and the
position of the fish within the beam it is possible to correct for the differences
in transducer gain and thereby obtaining the true target strength of the fish.
A
B
A
B
Side view
Top view
(CD470)
Figure 4 Split-beam principle.
The beam pattern correction in the EY 500 is based upon a model which is
described in section "Installation, System Test and Calibration".
The split-beam measurement principle only works for echoes originating from
a single point target since the electrical phase will be random if echoes from
multiple individuals at different positions in the beam are received simultaneously.
It is essential therefore to distinguish single fish echoes from multiple fish
echoes, henceforth the single echo detection algorithm. The algorithm is based
on a number of criteria, and some of these can be set from the menu system:
* TS must exceed the min value parameter (default -50 dB).
* The normalized echo length must exceed the min echo length parameter
(default 0.8) where normalized echo length is the length between the 6 dB
points relative the peak value divided by the duration of the transmitted
pulse.
P3403E/A
15
Simrad EY 500
* The normalized echo length must be less than the max echo length
parameter (default 1.8).
* The correction value returned by the gain correction model must not exceed
the max gain compensation parameter (default 4 dB). Narrow beamwidth for
small targets is obtained by using smaller max. gain compensation and
should be considered when TS detection is poor.
* Average electrical phase jitter between samples inside an echo pulse must
not exceed the max phase deviation parameter (default 2 phase steps) where
max phase deviation is set in units of phase steps (64 phase steps = 180
electrical degrees). In a noisy environment or when the targets are small, the
max. gain compensation and TS minimum values should be carefully
optimized to suit the current situation.
8 IMPULSE RESPONSE
The transmitted signal is characterized by a square-like envelope with zero rise
and decay times. However, on its way the signal passes through filters in the
transmitter and receiver and twice through the transducer which has a
bandpass-like response. The shape of the received signal is therefore different
from the transmitted one in the sense that the rise and decay times are no
longer zero and the peak amplitude is slightly reduced as shown in figure 5.
The EY 500 corrects for these effects by
* including a small peak amplitude correction factor in the algorithm for point
backscattering strength.
* using the effective pulse length rather than the transmitted pulse length in
the algorithm for volume backscattering strength.
Transmitted envelope
Received envelope
(CD471)
Figure 5 Signal envelopes.
16
P3403E/A
Theory of operation
It should be observed that both absolute accuracy and, more important,
consistency between TS and echo integration quantities are improved by
including these corrections.
9 NOISE
The deep water performance of a sounder is determined by the system noise
level; the sum of receiver noise, local noise and ambient noise.
Receiver noise includes thermic noise from the receiver itself and pickup noise
from the digital circuitry of the sounder. The EY 500 utilizes a low noise
receiver input stage, and the digital noise pickup has been reduced to an
insignificant level by proper internal screening. Local noise includes propeller
noise, engine noise, flow noise and other locally identifiable acoustic noise
sources. Basically, this noise is related to vessel design and transducer installation and can be reduced significantly by taking the necessary precautions.
Ambient noise is the noise of the sea itself. It is that part of the total noise
background of the sea which is not due to some locally identifiable source. The
ambient noise level is subject to wide variations. Heavy shipping and strong
wind increase the noise level, and in shallow water the noise level is typically
higher than in deep water.
Spectrum level (dB re 1uPa/ Hz)
Noise can in most practical cases be considered "white" with a continuous power
Local noise
70
60
50
40
Receiver noise
30
20
Ambient noise
10
1
10
Frequency (kHz)
100
(CD454)
Figure 6 Receiver noise versus ambient noise.
spectral density with respect to frequency. A quantitative evaluation of noise
requires that the various contributions are all referred to a common point
within the receiving system, and for most purposes it is convenient to use the
transducer terminals as the common point. Referred to this point the total
system noise is simply the sum of all individual noise power contributions.
P3403E/A
17
Simrad EY 500
The EY 500 provides a unique possibility for checking the noise level of the total
installation, and a method of showing the maximum detection depth for a
specified target strength. This is achieved by setting the min. TS in the
echogram menu equal to a specified TS in passive mode, and the echogram
range long enough to show when the noise begins to be displayed. The TS
specified can be observed down to a depth just above the depth where the noise
is displayed.
10 ABSORPTION COEFFICIENT
The absorption coefficient can be set in the Transceiver submenu. Figure 7
shows the variations of this coefficient for different frequencies and salinities.
60
SIMRAD sept. 1990
FRANCOIS & GARRISON
JASA dec. 1982
ITY
50
LIN
35%
10 Degrees C
200 m depth
pH = 8
SA
40
30
25
30
20
15
20
10
10
5
0
0
SOUND ABSORPTION (dB/km)
from
0
(CD468)
25
50
75
100
125
150
175
200
FREQUENCY (kHz)
Figure 7 Sound absorption.
18
P3403E/A
Theory of operation
11 SOUND VELOCITY
Figure 8 is a diagram showing the sound velocity for different salinities and
temperatures.
Simrad sept. 1992
1550
m/s
lin
Sa
1500
ity
Mackenzie (1981) J.acoust.Soc.Am., 70,807-12.
Del Grosso (1972) J.acoust.Soc.Am., 52,1442-6.
SOUND SPEED IN SEA WATER
at depth 0 m
40
Sa
lini
ty 0
1450
1400
0
5
10
15
20
25
30
WATER TEMPERATURE (deg. C)
(CD467)
Figure 8 Sound velocity diagram.
P3403E/A
19
Simrad EY 500
20
P3403E/A
Description of telegrams and remote control
DESCRIPTION OF TELEGRAMS AND
REMOTE CONTROL
P3404E / 857-160021 /AA062
This section contains information about the serial communication port of the
EY 500 and descriptions of the different telegram types.
P3404E/A
1
Simrad EY 500
Document revisions
Rev
A
2
Documentation
department
Hardware/Software
Design
Project/Product
Management
Date
Sign
Date
Sign
Date
Sign
25.08.95
CL
25.08.95
HS
31.08.95
RB
P3404E/A
Description of telegrams and remote control
List of contents
1 SERIAL COMMUNICATION PORT . . . . . . . . . . . . . . . . . . . . . . . . . . . . 5
1.1 GENERAL . . . . . . . . . . . . . . . . . . . . . . . . . . . . . . . . . . . . . . . . . . . . . 5
1.2 OUTPUT TELEGRAMS . . . . . . . . . . . . . . . . . . . . . . . . . . . . . . . . . . 6
1.3 ASYNCHRONOUS OUTPUT TELEGRAMS . . . . . . . . . . . . . . . . . . 7
1.4 PING-BASED OUTPUT TELEGRAMS . . . . . . . . . . . . . . . . . . . . . . 7
1.5 LOG-BASED OUTPUT TELEGRAMS . . . . . . . . . . . . . . . . . . . . . . . 9
1.6 INPUT TELEGRAMS . . . . . . . . . . . . . . . . . . . . . . . . . . . . . . . . . . . . 10
2 THE DISK STORAGE . . . . . . . . . . . . . . . . . . . . . . . . . . . . . . . . . . . . . . . .
2.1 GENERAL . . . . . . . . . . . . . . . . . . . . . . . . . . . . . . . . . . . . . . . . . . . . .
2.2 ASYNCHRONOUS OUTPUT . . . . . . . . . . . . . . . . . . . . . . . . . . . . . .
2.3 PING BASED OUTPUT . . . . . . . . . . . . . . . . . . . . . . . . . . . . . . . . . .
2.4 LOG BASED OUTPUT . . . . . . . . . . . . . . . . . . . . . . . . . . . . . . . . . . .
P3404E/A
11
11
12
14
17
3
Simrad EY 500
Document history
(The information on this page is for Simrad’s internal use)
Rev. A Original issue. First edition as module. Was section 5 of P2473E.
4
P3404E/A
Description of telegrams and remote control
1 SERIAL COMMUNICATION PORT
1.1 GENERAL
The serial communication port on the EY 500 (default COM2) is of type RS232.
Communication parameters such as baud rate, bits per character etc. can be
programmed from the Serial/USART Menu. The port may be connected to an
external computer, a terminal, a printer, a modem or any devices that can
receive or transmit RS232 ASCII data.
Together with the EP 500 postprocessing system it is possible to receive and
display data online. This makes it possible to monitor a remote system by
means of a modem and the worldwide telephone network..
The messages transmitted and received on the serial communication port are
referred to as "telegrams".
The following information applies to all telegrams:
- All output telegrams contain a two-character header indicating the telegram
type, for example PR for Parameter Request telegrams.
- "," separates fields within a telegram.
-
<CR>
denotes carriage return and <LF> denotes line feed.
- Two consecutive carriage returns <CR><CR> are used as telegram terminator in
output telegrams implying that <CR><LF> can be used freely inside the telegrams
in order to obtain a nice printout when using a standard printer.
- All output telegrams contain a time tag in the second field: hour, minute,
second, hundredth of a second, for example 10024310.
- A menu parameter is identified by including its path in the menu system in
the appropriate field.
For example:
/DISPLAY MENU/Echogram Menu/TVG
addresses the TVG type to be used for the echogram on the display.
P3404E/A
5
Simrad EY 500
The * character may be used as a wildcard in the input telegrams.
The path string above would then look like:
/DISP*/E*U/TV*
- Input telegrams use a single carriage return
<CR>
as telegram terminator.
- The input telegram interpreter is insensitive to upper/lower case letters.
There are three types of output telegrams:
- Asynchronous telegrams (triggered by uncorrelated external and internal
events)
- Ping-based telegrams
- Log-based telegrams.
There are three types of input telegrams:
- Parameter request telegrams
- Parameter enter telegrams
- Comment string (annotation) telegrams.
1.2 OUTPUT TELEGRAMS
Serial port output telegrams may be in either ASCII or binary format. The
binary format is identical to the disk telegram format except for a header (4
bytes) containing both the number of bytes in the telegram (2 bytes) and its
checksum (2 bytes). The checksum is the arithmetic sum of all bytes in the
telegram. This checksum is used by the receiving system to ensure good quality
of data telegrams. Telegrams with a faulty cheksum should be disregarded.
The ASCII format should be selected when the need for reading the data as text
is important. Binary is more compact, and is used for data transfer directly to
computer or via modem (e.g. EP 500).
6
P3404E/A
Description of telegrams and remote control
1.3 ASYNCHRONOUS OUTPUT TELEGRAMS
Examples of asynchronous output telegrams:
6 parameter request
6 parameter enter
6 comment string
(annotation)
6 navigation data
6 status telegram
PR,10024310,/OPERATION MENU/Ping Mode=Normal<CR><CR><LF>
PE,10024720,/OPERATION MENU/Ping Interval=1.3 sec<CR><CR><LF>
CS,10031140,TS measurements near Greenland<CR><CR><LF>
GL,10031520,4728.31,N,12254.25,W<CR><CR><LF>
ST,10041140,Ping-interval warning<CR><CR><LF>
PR
is returned as a response to a parameter request input telegram and
contains the header PR, the time tag, the path and the parameter.
PE
reports that a parameter has been entered (due to a manual command
operation from the menu), and contains header,time path, parameter.
CS
reports that an annotation comment string has been entered (from the
keyboard or as an input annotation telegram), and contains header, time
tag, annotation string.
GL
contains navigation data: header, time tag, position data substring.
ST
reports errors, warnings and alarms: header, time tag, message string.
1.4 PING-BASED OUTPUT TELEGRAMS
Examples of ping-based output telegrams:
D1,10024330,74.42,-18, 1,-23<CR><CR><LF>
E1,10024330, 5,<CR><LF>
32.40,-41.6,-43.2, -2.3, 3.4,<CR><LF>
36.35,-29.2,-31.1, 4.1, -4.3,<CR><LF>
37.75,-33.7,-34.1, 2.2, 2.2,<CR><LF>
42.10,-45.2,-45.9, -1.2, -1.5,<CR><LF>
61.10,-37.7,-38.6, -3.3, 2.4,<CR><CR><LF>
S1,10024330, 3,<CR><LF>
1,-87.5, 30.00,<CR><LF>
2,-56.3, 28.72,<CR><LF>
9,-61.6, 20.00<CR><CR><LF>
P3404E/A
6 bottom depth
6 echo trace
6 ping based SV
7
Simrad EY 500
TVG
9
Q1,11360180,0,
-2.1, -1.9,
-95.9, -94.2,
-80.3, -87.8,
-76.6, -77.8,
-85.4, -83.6,
-82.7, -82.4,
-76.7, -75.5,
-72.0, -73.4,
-36.6, -36.5,
-35.4, -35.2,
-34.3, -34.2,
-42.2, -41.1,
-48.1, -52.3,
-48.3, -52.8,
-52.3, -53.5,
-51.4, -50.3,
-41.3, -38.3,
-30.3, -28.4,
-35.3, -34.6,
-39.3, -39.2,
-42.2, -42.1,
-47.3, -51.0,
-58.5, -61.2,
-66.0, -66.8,
-63.7, -55.1,
-81.1, -83.2,
-71.4, -72.4,
-77.7, -76.2,
-79.7, -79.4,
-70.3, -70.8,
-38.8, -37.3,
-36.8, -36.7,
-36.1, -36.0,
DEPTH MAIN
MAIN
9
RANGE RANGE
START STOP
9
9
29.65,
-48.5,
-91.9,
-89.0,
-79.9,
-81.7,
-82.0,
-77.6,
-71.1,
-36.3,
-35.1,
-34.1,
-39.9,
-48.6,
-52.9,
-52.2,
-45.5,
-35.8,
-32.7,
-32.0,
-39.1,
-42.1,
-64.0,
-57.9,
-64.6,
-54.2,
-82.0,
-73.4,
-77.0,
-78.4,
-71.7,
-37.2,
-36.6,
-35.9,
ECHO- BOTTOM BOTTOM BOTTOM ECHOGRAM
RANGE
RANGE ECHOGRAM
VALUES START
STOP
GRAM
DATA
9
9
9
VALUES (in dB)
9
9
0.0, 100.0,250,
10.0,
-5.0, 75,
-82.8, -87.7, -98.7, -99.1, -99.3, -98.9, -96.5,6
-92.6, -95.0, -94.7, -84.3, -84.7, -83.3, -81.9, -75.1, -63.7, -65.1, -75.9, -79.4, -81.5, -77.9, -82.3, -82.2, -75.7, -75.3, -76.0, -76.3, -76.6, -80.1, -80.1, -81.1, -82.3, -81.6, -80.4, -81.3, -73.6, -71.7, -73.4, -73.5, -72.9, -75.2, -76.9, -80.3, -79.5, -78.9, -73.7, -71.8, -70.0, -70.5, -70.0, -38.6, -37.2, -37.1, -37.0, -36.8, -36.7, -36.2, -36.1, -36.0, -35.8, -35.7, -35.6, -35.5, -35.0, -34.9, -34.8, -34.7, -34.6, -34.5, -34.4, -34.0, -33.9, -39.2, -40.5, -37.3, -34.9, -40.2, -39.8, -40.3, -44.9, -44.9, -44.8, -46.9, -48.2, -50.9, -47.7, -50.0, -53.4, -53.4, -53.0, -47.4, Main
-54.2, -59.2, -53.4, -52.6, -52.6, -53.4, -53.9, echo-52.2, -51.9, -51.8, -53.0, -54.6, -52.3, -53.3, gram
-44.1, -41.8, -41.7, -37.4, -36.2, -40.5, -41.4, (250
-35.8, -30.0, -28.8, -29.2, -36.2, -38.3, -35.3, values)
-35.1, -40.0, -37.9, -34.9, -34.8, -34.7, -37.9, -29.2, -34.3, -34.2, -34.2, -34.2, -34.0, -34.6, -35.2, -37.3, -41.8, -47.1, -38.9, -38.8, -40.0, -38.9, -41.4, -39.1, -43.2, -48.8, -51.1, -48.2, -65.3, -68.6, -68.1, -59.1, -58.7, -57.6, -57.3, -59.1, -58.3, -57.7, -55.8, -62.6, -64.3, -65.9, -63.2, -63.4, -63.0, -61.0, -61.2, -63.9, -65.5, -54.7, -54.8, -55.4, -64.8, -63.2, -62.9, -60.4,6
-83.0, -82.9, -82.4, -82.1, -80.3, -78.5, -70.6,6
-73.2, -74.4, -73.4, -72.9, -72.7, -74.3, -78.2, Bottom
-75.5, -75.1, -76.3, -77.5, -79.6, -80.4, -79.6, echo-79.1, -74.5, -72.0, -72.4, -70.4, -70.0, -71.0, gram
-71.6, -73.3, -75.0, -70.6, -70.6, -70.0, -69.9, (75
-37.1, -37.1, -37.0, -37.0, -36.9, -36.9, -36.8, values)
-36.5, -36.5, -36.4, -36.3, -36.3, -36.2, -36.1, -35.9, -35.9,
6
D1
contains the detected depth: header, time tag, depth
[meter], bottom surface backscattering strength [dB],
transducer number, dummy.
E1
contains single-echo detections for one ping: header, time
tag, number of single echo detections, depth [meter],
compensated TS [dB], uncompensated TS [dB], fore-andaft angle [degrees], athwartships angle [degrees] etc. Note
that max. 30 single-echo detections can be output.
8
P3404E/A
Description of telegrams and remote control
S1
contains the mean Sv per ping inside each active main
layer and the effective thickness of the layer: header, time
tag, number of active layers, layer number, mean Sv [dB],
effective thickness [meter] etc. Note that Sv values smaller
than -99.9 dB causes $$$.$ to be printed.
Q1
contains main and bottom echogram values in dB as
ASCII text. This long telegram should only be used for
special studies since the capacity of the serial line is
limited and overflows even at a moderate ping rate. The
binary mode is a lot more efficient (See echogram Q1 in
The Disk Storage chapter).
1.5 LOG-BASED OUTPUT TELEGRAMS
Examples of log-based output telegrams:
VL,10030740,930523,1834.015<CR><CR><LF>
6 vessel log
LL,10031120,930523,1835.000, 1, 3,<CR><LF>
6 layer settings
1,S, 10.0, 40.0, 1.0, 1, -80.0,<CR><LF>
2,S, 40.0, 70.0, 1.0, 1, -80.0,<CR><LF>
9,B, 20.0,
0.0, 5.0, 1, -80.0<CR><CR><LF>
A1,10031120,930523,<CR><LF>
6 integrator table
31,<CR><LF>
121,<CR><LF>
27E-1<CR><CR><LF>
H1,10031120,930523,-50.0,<CR><LF>
6 TS distribution table
818,38,38,17, 6, 1, 0, 0, 0, 0, 0, 0, 0, 0, 0, 0, 0, 0, 0, 0, 0, 0, 0, 0, 0,<CR><LF>
73, 0, 0, 0, 0, 4, 4,11,16,14,10, 4,18,10, 3, 3, 3, 0, 1, 0, 0, 0, 0, 0, 0,<CR><LF>
88, 0, 0, 0, 0, 3, 3, 9,16,11, 9, 5,18,12, 6, 2, 2, 1, 1, 0, 0, 0, 0, 0, 0<CR><CR><LF>
VL
reports that a log pulse has been detected and contains
header, time tag, date, updated log distance [nm].
LL
is output every log interval and contains the current layer
settings: header, time tag, date, current log distance [nm],
super layer, number of active layers, layer number, layer
type (S, B or P), upper depth [meter], lower depth [meter],
margin distance [meter], the value 1, Sv threshold value
[dB] etc.
A1
is output every log interval and contains the integration
results within each layer: header, time tag, date, first
active main layer [m2/nm2], second active main layer
[m2/nm2] etc. Note that a special exponential format is
used for representing very small and very large numbers.
P3404E/A
9
Simrad EY 500
H1
is output every log interval and contains the TS
distribution within each layer: header, time tag, date,
lower boundary of TS range [dB], total number of single
echo detections within first active main layer, 24 fields
containing detections within each TS class (percentage of
relative total number of detections), total number of single
echo detections within second active main layer etc.
1.6 INPUT TELEGRAMS
There are three different types of input telegrams:
/operation menu/ping mode<CR>
/operation menu/ping interval=1.3<CR>
CS, TS measurements in lake Borrevann<CR>
6 parameter request
6 parameter enter
6 comment string
(annotation)
A PR output telegram is returned by the echo sounder when a parameter
request telegram is sent as input to the sounder. This telegram simply consists
of the path of the parameter. A parameter is entered by specifying the path and
the new parameter value, separated by a = sign. Input telegrams not starting
with a / are taken as annotation input strings. It should be observed that:
-
continuous variable parameter values are processed numerically and
may be entered with or without dimension
-
discrete parameter values are processed as strings and must be entered
with dimension
-
the wildcard character * matches any substring of characters within
menu names, parameter names and discrete parameter value strings.
-
there is no distinction between upper and lower case characters.
-
the password of the utility menu can not be remotely controlled or
requested.
-
test menu parameters can not be remotely controlled or requested.
Some parameters include two or more numeric quantities, and these are
remotely entered/requested as shown below:
/utility*/date=93.06.06<CR>
/util*/time=14:41:16<CR>
10
6 year, month, day
6 hour, minute, second
P3404E/A
Description of telegrams and remote control
2 THE DISK STORAGE
2.1 GENERAL
The hard disk in the PC is an independent device with its own echogram
definition. Several telegram types may be enabled for on-line storage. When
LOG in the Disk Menu is ON, the data will automatically be given a name
including creation time. The file will be terminated at the current file size given
in MAX. FILE SIZE in the Disk Menu or by turning Disk Menu/Log = OFF. The
postprocessing system will read these files and enable the user to scrutinize the
data with new layer limits.
The SHOW program supplied with the Utility Disk enables the user to convert
the binary telegrams stored in a file into an ASCII readable file for easy
inspection of EY 500 data.
All relevant files are stored in the EY 500 directory.
File name:
Contents:
EY500.PAR
Backup parameters of all EY 500 settings.
(Refer to chapter "The EY 500 file system"
in section "Operation").
MoDaHoMi.DGY
Data files containing telegrams. EY 500
files will be automatically created when
LOG in the Disk Menu is ON, or when the
current file size limit is reached. The file
name contains a unique identification with
respect to month, day, hours, minutes and
year. Example: 06061105.DG4.
06
06
11
05
.
DG
4
Month
Day
Hours
Minutes
.
DG
Year
2-digit
identifier
(1-12)
2-digit
identifier
(1-31)
2-digit
identifier
(1-23)
2-digit
identifier
(1-59)
EY 500
datagram
1-digit
identifier
(1-9)
The disk storage facility implements all telegrams found on the Serial
Communication port, but also includes four new telegrams:
P3404E/A
11
Simrad EY 500
- B1
- W1
- V1
- P1
sample angle data
sample power data
sample Sv data
sample TS data
The disk storage is basically the binary type of telegrams. The main changes
made moving from ASCII to binary telegram format are:
- Numeric quantities are represented by the appropriate binary type, and text
strings remain unchanged.
- Output telegrams do not include carriage returns or line feeds.
- All output telegrams start with a two character header and a time tag
separated by a comma just as the ASCII version of the telegrams.
- All telegrams have a four-byte length field in front giving the number of bytes
in the current telegram.
The telegrams are described in the next paragraphs using C programming
language structures. The size of the various C types are:
- char
- short
- long
- float
8-bit integer
16-bit integer
32-bit integer
32-bit floating point IEEE 754
Structure members of type array are defined with their maximum size. During
real data transfer their actual size depends on EY 500 parameter settings and
data statistics. Many computers can only access two-byte quantities at even
addresses and four-byte quantities at addresses dividable by four. A few
telegrams therefore include a dummy fill parameter in order to facilitate
communication with these computers. Note that binary quantities are
transmitted in Intel byte order (least significant byte first).
2.2 ASYNCHRONOUS OUTPUT
struct Text {
char Header[2];
char Separator1[1];
char Time[8];
char Separator2[1];
char Text[256];
};
12
/* parameter request */
/* "PR" */
/* "," */
/* hour, minute, second, hundredth */
/* "," */
/* parameter path and value */
P3404E/A
Description of telegrams and remote control
struct Text {
char Header[2];
char Separator1[1];
char Time[8];
char Separator2[1];
char Text[256];
};
/* parameter enter */
/* "PE" */
/* "," */
/* hour, minute, second, hundredth */
/* "," */
/* parameter path and value */
struct Text {
char Header[2];
char Separator1[1];
char Time[8];
char Separator2[1];
char Text[256];
};
/* comment string (annotation) */
/* "CS" */
/* "," */
/* hour, minute, second, hundredth */
/* "," */
/* comment string */
struct Text {
char Header[2];
char Separator1[1];
char Time[8];
char Separator2[1];
char Text[256];
};
/* geographical location (navigation) */
/* "GL" */
/* "," */
/* hour, minute, second, hundredth */
/* "," */
/* geographical position */
struct Text {
char Header[2];
char Separator1[1];
char Time[8];
char Separator2[1];
char Text[265];
};
/* status telegram */
/* "ST" */
/* "," */
/* hour, minute, second, hundredth */
/* "," */
/* error, warning or alarm message */
P3404E/A
13
Simrad EY 500
2.3 PING BASED OUTPUT
struct Depth {
/* detected bottom depth */
char Header[2];
/* "D1" */
char Separator1[1];
/* "," */
char Time[8];
/* hour, minute, second, hundredth */
char Separator2[1];
/* "," */
float Depth;
/* detected bottom depth [meter] */
float Ss;
/* bottom surface backscattering strength [dB] */
long Transducer Number; /* transducer number */
float Dummy2;
/* not implemented in EY 500 */
};
struct EchoTrace {
char Header[2];
char Separator1[1];
char Time[8];
char Separator2[1];
long Traces;
struct {
float Depth;
float CompTS;
float UncompTS;
float AlongShip;
float AthwartShip;
} Trace[30];
float Sa[30];
};
/* echotrace (single fish detections) */
/* "E1" */
/* "," */
/* hour, minute, second, hundredth */
/* "," */
/* number of echo traces in telegram */
/* target depth [meter] */
/* compensated TS [dB] */
/* uncompensated TS [dB] */
/* alongship angle [degree] */
/* athwartships angle [degree] */
/* max 30 detections per ping */
/* Sa values for single targets */
struct MeanSv {
/* Mean Sv per ping */
char Header[2];
/* "S1" */
char Separator1[1];
/* "," */
char Time[8];
/* hour, minute, second, hundredth */
char Separator2[1];
/* "," */
long Layers;
/* number of active layers */
struct {
long LayerID;
/* layer identifier [1-10] */
float MeanSv;
/* mean Sv per ping within layer [dB] */
float MeanWidth; /* mean effective thickness of layer [meter] */
} Layer[10];
/* max 10 layers */
};
14
P3404E/A
Description of telegrams and remote control
struct Echogram {
/* echogram (post processor) */
char Header[2];
/* "Q1" */
char Separator1[1];
/* "," */
char Time[8];
/* hour, minute, second, hundredth */
char Separator2[1];
/* "," */
long TVGType;
/* TVG type: */
float Depth;
/* detected bottom depth [meter] */
float PelagicUpper; /* upper depth of pelagic echogram [meter] */
float PelagicLower; /* lower depth of pelagic echogram [meter] */
long PelagicCount;
/* number of pelagic echogram data points */
float BottomUpper;
/* upper depth of bottom echogram [meter] */
float BottomLower;
/* lower depth of bottom echogram [meter] */
long BottomCount;
/* number of bottom echogram data points */
short Data[1200];
/* max 1200 pelagic+bottom echogram data points */
};
The resolution of the pelagic echogram and the bottom echogram is controlled
by parameters in the Disk Menu. The TVG type indicates which TVG is used (0
= 20 log R, Sv, 1 = 40 log R, TS). Depth and range parameters are output in
meter. The size of the pelagic echogram array and bottom echogram array are
included. The Sv/TS data is output in the EY 500 dB format (Refer to section
"Theory of Operation", chapter 3, "EY 500 dB format").
struct Sample {
char Header[2];
char Separator1[1];
char Time[8];
char Separator2[1];
short Data[5000];
};
/* sample angle data */
/* "B1" */
/* "," */
/* hour, minute, second, hundredth */
/* "," */
/* max 5000 data points per data block*/
The B1 output telegram provides angle sample data from the transceiver
(applies to split beam transducer channel only) and is used for special purpose
studies. The fore-and-aft (alongship) and athwartships electrical angles are
output as one 16-bit word; the alongship angle as the most significant byte and
the athwartships angle as the least significant byte. Angle data is output in
units of phase steps (64 phase steps = 180 electrical degrees) where the least
significant seven bits are the magnitude and the most significant bit is the sign;
zero in the fore and starboard direction, one in the aft and port direction. Thus,
an angle is not expressed in 2’s complement. The sample data limits are given
by the sample range in the Disk Menu/Telegram Menu.
P3404E/A
15
Simrad EY 500
struct Sample {
char Header[2];
char Separator1[1];
char Time[8];
char Separator2[1];
short Data[5000];
};
/* sample power data */
/* "W1" */
/* "," */
/* hour, minute, second, hundredth */
/* "," */
/* max 5000 data points per data block*/
The W1 output telegram provides echo amplitude sample data from the
transceiver; power level referred to the transducer terminals as measured by
the transceiver. Data is output in the EY 500 dB format (Refer to section
"Theory of Operation", chapter 3). See the sample angle telegram for general
comments.
struct Sample {
char Header[2];
char Separator1[1];
char Time[8];
char Separator2[1];
short Data[5000];
};
/* sample Sv data */
/* "V1" */
/* "," */
/* hour, minute, second, hundredth */
/* "," */
/* max 5000 data points per data block */
The V1 output telegram provides volume backscattering strength sample data;
power sample data with 20-log-r TVG added (Refer to section "Theory of
Operation", chapter 2, "Power budget"). Data is output in the EY 500 dB format
(Refer to section "Theory of Operation", chapter 3, "EY 500 dB format"). See the
sample angle telegram for general comments.
struct Sample {
char Header[2];
char Separator1[1];
char Time[8];
char Separator2[1];
short Data[5000];
};
/* sample TS data */
/* "P1" */
/* "," */
/* hour, minute, second, hundredth */
/* "," */
/* max 5000 data points per data block */
The P1 output telegram provides target strength sample data; power sample
data with 40-log-r TVG added.. Data is output in the EY 500 dB format See the
sample angle telegram for general comments. Also refer to section "Theory of
Operation", chapter 3, "EY 500 dB format".
16
P3404E/A
Description of telegrams and remote control
2.4 LOG BASED OUTPUT
struct VesselLog {
char Header[2];
char Separator1[1];
char Time[8];
char Separator2[1];
char Date[6];
char Separator3[2];
float Distance;
};
/* vessel log */
/* "VL" */
/* "," */
/* hour, minute, second, hundredth */
/* "," */
/* year, month, day */
/* ", " */
/* vessel log distance [nautical mile] */
struct LayerSetting {
char Header[2];
char Separator1[1];
char Time[8];
char Separator2[1];
char Date[6];
char Separator3[2];
float Distance;
short SuperLayer;
short Layers;
struct {
short LayerID;
short Type;
float Upper;
float Lower;
float Margin;
long SubLayers;
float Threshold;
} Layer[10];
};
/* layer settings */
/* "LL" */
/* "," */
/* hour, minute, second, hundredth */
/* "," */
/* year, month, day */
/* ", " */
/* vessel log distance [nautical mile] */
/* super layer identifier [1-10] */
/* number of active layers */
struct TableSA {
char Header[2];
char Separator1[1];
char Time[8];
char Separator2[1];
char Date[6];
char Separator3[2];
float SA[10];
};
/* Integrator output table */
/* "A1" */
/* "," */
/* hour, minute, second, hundredth */
/* "," */
/* year, month, day */
/* ", " */
/* integrator values for active layer */
P3404E/A
/* layer identifier [1-10] */
/* ’S’ = surface, ’P’ = pelagic, ’B’ = bottom */
/* upper layer boundary [meter] */
/* lower layer boundary [meter] */
/* margin distance [meter] */
/* always equal to 1 */
/* Sv threshold value [dB] */
/* max 10 layers */
17
Simrad EY 500
struct TableTS {
char Header[2];
char Separator1[1];
char Time[8];
char Separator2[1];
char Date[6];
char Separator3[2];
float MinTS;
struct {
long Detections;
char Class[24];
} Layer[10];
};
18
/* TS distribution table */
/* "H1" */
/* "," */
/* hour, minute, second, hundredth */
/* "," */
/* year, month, day */
/* ", " */
/* lower boundary of TS range [dB] */
/* number of detections within layer */
/* detections per TS class [%] */
/* max 10 layers */
P3404E/A
500 series! portable echo sounders
MA1N1'ENANCE
P3405E /857- 160022/ 4AA062
This section contains information on preventive and corrective maintenance
the Simrad 500 Series portable echo sounders EY 500 and EA 50 IP.
P3405E/B
on
Maintenance
Document revisions
Rev
Documentation
department
Date
25. 08.
IS. O3. Q(9
Sign
HardwarelSoftware
Design
Date
Sign
Date
Sign
31.08.
25.08.
i? oJ ft~
ProjectJProduct
Management
(/J
/B. D!, qb
P3405E/B
500 , series. portable - echo
sounders
Llst! of' contents
INTRODUCTION .
2 TECHNICALDESCRIPTION.
INTRODUCTION .
2 PC INTERFACE BOARD .
. 9
3 DIGITAL TRANSCEIVER BOARD
2.4 ANALOG TRANSCEIVER BOARD
5 DC POWER SUPPLY .
BACKPLANE .
. 24
. 26
3 PREVENTIVE MAINTENANCE .
. 28
4 CORRECTIVE MAINTENANCE .
. 29
1 FUSES AND TEST POINTS .
TROUBLESHOOTINGHINTS .
3 BUILT- IN TEST FUNCTIONS .
1 Internaltest.
. 29
. 30
. 30
2 Self- test procedure for printer
4.4 FAULT- FINDINGPROCEDURE
5 DISASSEMBLYIREASSEMBLY
INTRODUCTION .
REMOVING THE UPPER COVER
3 REPLACING THE PCB MODULES. .
5.4 REPLACING THE DC POWER SUPPLY. .
.
.
.
.
34
34
34
34
MESSAGES .
INTRODUCTION .
2 LIST OF MESSAGES .
ERROR MESSAGES CONCERNING SIGNAL PROCESSING (SP) 40
Introduction .
List of error messages concerning signal processing
7 SPARE PARTS LIST .
TRANSCEIVER .
P3405E/B
. 40
. 41
. 44
. 44
Main tenance
fJocumen t history
(The information on this page is for Simrad' s
internal use)
Rev.
Original issue.
Rev.
The document is expanded to cover the portable echo sounders in the
Simrad 500 Series; EA 501P and EY 500.
P3405E/B
500 .series portable echo.. sounders
INTRO D
This section
CTI
is intended for the service engineer , and contains
and service instructions down to a level of detail
technical
which is
descriptions
recommended by Simrad. Simrad' s philosophy of service is that in most cases
the service engineer - with use of the information given here - should be able
to locate and change a faulty circuit board or module , but will not do the repair
on the circuit board level. The technical descriptions are based on block
diagrams , and complete electronic diagrams are not included.
The echo sounder comprises the following units:
Transceiver
* PC
* Transd
* Prin
ucer
ter
* DC power supply
For more details and technical
Familiarization
specifications , refer to section
System
For details about the printer and the PC , refer to their respective manuals.
P3405E/B
Maintenance
Figure
Transceiver with PC.
500 senes
Vlew
transceiver.
echo sounders
Maintenance
Figure
interconnection
500, series portable. echo ,sounders
DESCRIPTION
2 TECaN:r(~AL
INTRODUCTION
The transceiver unit contains the following printed circuit boards/modules:
* PC Interface board
* Digital transceiver board
* Analog transceiver board , single beam or split beam
* Backplane
* Power module
Figure 4 shows a simplified block diagram of the transceiver.
AMPL.
TRANS- ~
DUCER
ANALOG
PHASE
DIGITAL
""',$';.~~""""',m,'
m""""""""",,"','.',$,'.';."-
TRANSCEIVER
TRANSCEIVER
INTERFACE
DISPLAY
HARDDISK
KEYBOARD
CLOCK
"'~:'2;
COM 1
COM 2
2;;
1::
:::i::-
PRINTER
2xFO
(CD478)
Figure 4
Transceiver block diagram.
* The analog transceiver/digital transceiver combination contains transmitter
receiver and AID-conversion circuitry. The receiver does not contain any
TVG (Time Varying Gain) function as the echo sounder implements this
function solely in software. Instead , the receiving system is designed as a
power meter with a large instantaneous dynamic range. Input power levels
a precision of
0 dBW (dB' s relative 1
from the PC interface board as 16-bit digital
160 dBW
W) are measured
to
a fraction of a dB and are output
to
to
words using the dBW scale for numeric representation. The receiver includes
one receiving channel for single beam operation. For split-beam operation
the receiver includes four matched channels plus phase measurement
circui try.
P3405E/B
Maintenance
interface boardlncllid'es Centronics printer interface and computer
interface. It uses the standard parallel interface on the PC for reading data
* The PC
and controlling the transceiver and printer units.
For a complete interconnection diagram , refer to drawing 824- 111019 in section
Drawings
2 PC INTERFACE BOARD
Functional description
Refer to block diagram , Figure 5 and drawing 824- 109291
(in section
Drawings ). The PC Interface board contains circuitry to provide an interface
between the transceiver boards and the PC and printer. The board has 4 plugs:
, P2: Different input/output signals connected directly to the motherboard
P3:
Printer
P4:
Computer
Transd ucer Coding port
4 pins on the analog transceiver board are coded for frequency. The frequency
information is routed through the PC interface
card.
Demultiplexer
Converts amplitude and phase data to proper (4- bit) format for PC read control
through MUX1 and MUX2.
Timer
Sets correct pulse length , frequency and sample clock.
Control outputs
Bandwidth , reset of transceiver FIFOs , test mode , TX- pulse trigger and beam
type.
P3405E/B
500 series. portable echo.: sounders
TEST
BEAMTYPE
cntr
LATCH
~ TX
~ 2*
tif.'iW;K.W'.iW~:t.;'J'f#MMw.',;:r;:Ji;f.;(*'::";;'
TIMER
~ SCLCK
data
~Wi'i~iWfl+#Vf,J.(,~'!fg,KM~iWf#:#;~?;fi3"
8 bit out
~ PRINTER
latchstb
strobe
ptrstb
DECODE
select a
select b
fifostb
:i~t
';i'.'
RESET
~JI
INTER-
RUPT
,if
RS- FIFO
READ
MUX.
MUX.
FIFO/PRT/SIGN.
NWfW?iWNtMMkiWlJfWMi
€",)?'i&Wi&MW##W;;:;MW~i:M%lt
COUNT
16 bits
HALF- FULL AMPLITUDE
& PHASE
M~WWM'
giMWWf:j'M%WmiWiW8WJW~
L---
~ READ
~ SEL AlP
~I:
(CD479)
Figure
P3405E/B
SIGNATURE
BITS
PC interface board, block diagram.
Maintenance
Figure
500 series portable echo sounders
M aintenanceaids
There are two rows of test points on the board , P5 and P7.
Check
point
Information
AI. Timer control.
AD. Timer control.
CS/WR Timer control
TX trigger (active high)
Spare
Test (test = high)
Single/split (single = low)
BW (wide = low)
+5V
13-
GND
2xfrequency
TX pulse
Sample clock
Check
point
Information
Not used
FIFO half full signal
FIFO reset (active = low)
Signature transducer bits (4)
P3405E/B
Maintenance
3 DIGITAL TRAN"SCEIV'ERBOARD
Functional description
Refer to Figure 7.
This PCB is used between the analog transceiver board and the PC interface
board. It converts amplitude and phase to digital words. It includes also an
EPROM which converts the amplitude to a suitable format , and also FIFOs as
a buffer memory.
Amplitude part:
The DC-amplitude from the receiver has 4 gain levels with 3D- dB steps. These
signals are routed to an AID converter , one for each level. The AID converter
which has an amplitude within a specified value is selected and routed through
a PROM. This PROM converts the amplitude to a format suitable for micro-
processing. The microprocessor can select between up to 4 different formats.
The 16- bit word out of the PROM is then stored in two FIFOs.
The four DC signals from the receiver envelope detectors have different
amplitude levels with 30 dB steps , G 1 , G2 , G3 and G4.
STEP
GAIN (dB)
Active amplitude
5V
5V
5V
5V
-
158mV
158mV
158mV
noise
region
level
For each new ping there is first one reset pulse (RS/) to reset the FIFOs. Then
starts a sequencer which then starts the four AID
the sample clock
(SMPU)
converters simultaneously. The link
decides the AID converter s clock
frequency.
Phase part:
The TTL signals from the receiver containing phase information are routed
through an XOR gate and into a counter network for phase-angle measuring.
The phase angles and sign bits are represented in two 8- bit bytes. These bytes
are then stored in two FIFOs. The values of the phase angles are measured in
a digital hardware system of synchronous ICs. This makes it possible to get a
fast and continuously updated phase angle value for each fourth zero-crossing
of the signal (i. e. for each 760 degrees).
P3405E/B
500 series. portable echo
Only the output from one AID is
chosen every sample.
AID
PROM
FIFO
~ain: 0 dB
FIFO
AID
~ain: 30 dB
:::J
CtS
CtS
C\I
T"""
AID
~ain: 60 dB
AID
~ain: 90 dB
Amplitude part
)hase "
COUNT
DO-
FIFO
)hase "
)hase "
FIFO
)hase "
f-/
Phase art
(1125)
Figure
P3405E/B
Digital transceiver board, block diagram.
sounders
Maintenance
500. series
Maintenance aids
Test points
There are three internal test points.
Check point
Information
TP1
SMPU
TP2
10 Mhz
TP3
GND
(inverted)
Links
10 MHz
625 MHz
1.25 MHz
5 MHz
EPROM
U34.
P3405E/B
Open
Open
Mounted
Open
portable echo sounders
Maintenance
ANALOG TRANSCEIVER: BOARD
Functional description
The analog transceiver board , split beam , contains a four-channel transmitter
and a four-channel receiver. The transducer is connected to the board through
plug P3. The board operates together with the digital transceiver board which
digitizes amplitude and phase data to a format suitable for microprocessing.
The single- beam version of this board is identical to the split- beam version
except that it only contains a one-channel transmitter and receiver , and has no
outputs for phase information.
Transmitter
9. The transmitter is controlled by two TTLand
the signal 2xfo which decides the trans,
the
trigger
signals
mitter frequency fa. Both signals are generated on the PC interface board , and
are dependent on transmitter frequency and menu settings. The transmitter
has one transformer with four outputs. While receiving, the four channels are
separated by anti- parallelled diodes. The transmitter has built- in short- circuit
protection and has also a fuse in front for battery short- circuit protection
Refer to the lower part of Figure
signal
TXI
The TX- pulse is indicated by the LED across the transformer primary (located
for easy viewing on the front of the board). The transmitter power can be
halved by mounting link A instead of link B on the transformer primary side.
There are four separate output channels.
Receiver
9. The receiver has four separate receiver
inputs , one from each of the transducer elements. It has a TR-switch which
protects the receiver while transmitting, and it can take an amplitude of 5
volts RMS before it saturates. The gain over the input filter is about 16 dB and
another 14 dB comes in the following transistor network. The next amplifier
stage is a low-noise op amp and gives about 30 dB gain. The next amplifier
Refer to the upper part of Figure
stage gives also about 30 dB gain and it includes
a low- Q
bandpass filter as
well.
At the end of each channel there is a precision comparator with a TTL-output
which goes to the phase detector at the digital transceiver board. The input of
the comparator is saturation protected with a voltage divider. The supply
voltage to the comparators comes from separate voltage regulators because of
noise considerations.
The four TTL outputs represent
relative phase angles.
P3405E/B
500 series portable echo sounders
There are four ana1'og BUtputs' " from the receiver with different grades of
amplification. These outputs which represent the amplitude , have an active
area from 158m V to 5V DC except the 90 dB gain output which operates from
5V down to the receiver s noise level.
P3405E/B
Maintenance
Summation
Rectifier
Buffer/Filter
Summation
Rectifier
Buffer/Filter
Summation
Rectifier
Buffer/Filter
Summation
Rectifier
Buffer/Filter
(TTL level)
1 (TTL level)
I (TTL level)
(TTL level)
I AMP
I +30 dB
I AMP
I AMP
I +30 dB
I +30 dB
- - J
I COMP
- - - J
Transducer 1
Transducer 2
Transducer 3
Transducer 4
AMP
AMP
TX/
DRIVER
2xfO
AMP
AMP
(1126)
Figure
Transceiver, block diagram.
P3405E/B
500 series portable echo sounders
Figure
tra nsce i ver
Maintenance
Maintenance aids
LEDs
In the front there are three LEDs. Two for
internally regulated voltages
15V
to the receiver and one for the TX- pulse. The one for TX- pulse illuminates only
at long TX- pulse. The TX- pulse is audible , but if there is much noise , this LED
is useful to establish if there is a TX pulse present.
Test points
Internally the
PCB contains a large number of test points. There is one after
the 30 dB gain steps for each channel , one after summation of four channels
and one for each phase output.
There is also one for GND. The analog outputs after the envelope detectors can
be reached on P2.
Important test points:
TP22: 2xfo (2 x transmitter
TP23: TX/ (trigger pulse)
frequency)
Links
B 1: Max power
AI: 1/2 power
P3405E/B
500 series , portable, echo sounders
Transceiver board' codIng
Pins 83 , 82 , 81 and 80 on plug PI are coded for transceiver frequency.
Coding
Clock frequency
(MHz)
Transceiver type
1.10
1.25
1.25
1.25
210kHz single
12 kHz split
18 kHz single
18 kHz split
27 kHz single
27 kHz split
38 kHz single
38 kHz split
49 kHz single
49 kHz split
70kHz single
70 kHz split
120 kHz single
120 kHz split
200 kHz single
710kHz single
P3405E/B
"""""'u'
V. -'
Maintenance
DC POWER SIJPPLY
Refer to drawing 824- 109632 in section " Drawings . The power supply contains
20V
a switching power supply generating the following DC voltages: +5V
and the high voltage (HV) for the transmitter (48V).
The supply can operate from an input voltage between 10V and 40V. The
switching frequency can be between 80 and 250 kHz and may be adjusted
within this range by potmeter R1. This makes it possible to reduce noise
problems for the receivers by tuning the switching frequency away from the
frequency of the receiver. All of the outputs can be short-circuited or left open
without damaging the power supply, although input fuse Fl may blow.
Connections
Plug PI is connected to the backplane.
Plug P2 is connected to the DC power source.
Plug P3 is connected to the high voltage.
LED
LED indicator: +5V OK.
Test points
POWER SUPPLY
a. a. a. a. a.
co I'-- co 1.0 ~ ('I) C\/ ~
a.
a.
I- a.
I- a.
I- a.
I- a.
I- II- a.
in (10- 40)
Sw. Freq. (80- 250
Bypass control signal
+5V
Ground
Shutdown of reg. (active low)
20V
+20V
A V dd (typical
kHz)
12V)
High voltage negative
High voltage positive
Ext. power shutdown input
Figure
(CD486)
11
Test points on the DC power supply.
P3405E/B
500 series
power
echo sounders
Maintenance
BACKPLANE
Refer to drawing 824- 109327 in section " Drawings
Maintenance aids
Important test points:
TP1: TX pulse
TP2: 2xfo
TP3: SMPL frequency
TP4: GND
TP5: +5V
P3405E/B
500 series portable echo sounders
Maintenance
PREVENTIVE
MAINTENANCE
sounder is very limited. When
required , clean the surfaces of the equipment with a soft , lintfree cloth and a
mild detergent.
The preventive maintenance on the echo
For information about preventive maintenance on the computer and optional
printer , refer to their respective instruction manual.
P3405E/B
500 series portable echocSounders
CORRECTIVE MAINTENANCE
FUSES AND TEST POINTS
There are two fuses in the transceiver unit , a 10 A fuse on the power supply
and a 4A fuse on the analog transceiver board. A label on the cover for the PCB
modules points to the test points on the DC power supply. For information
about other test points , refer to the PCB descriptions.
TROUBLESHOOTING IDNTS
CAUTION
To avoid electric shock, always switch off the mains voltage to the
transceiver unit before removing printed circuit
boards! com
ponen ts.
1. Check control settings.
does not exist. If
there is any question about the correct function or operation of any of the
menu commands , refer to section " Operation
Incorrect control settings can indicate a trouble that
2. Check external equipment.
Before proceeding with troubleshooting, check that equipment used with
the echo sounder system is operating correctly. Also check that input/output signals are properly connected and that
are not defective. Check the supply voltage.
the interconnecting cables
3. Visual check.
Check the equipment visually. Many troubles can be found by visible
indications , such as unsoldered connections , broken wires , damaged
circuit boards or damaged components.
4. Check power supply.
Incorrect operation of all circuits often indicates troubles in the power
supply. Refer to the power supply description in this manual. +5V voltage
is indicated by a LED on the top of the DC power supply, where also test
points for the different voltages are located.
5. Built- in test functions.
The built- in test functions of the echo sounder are described in paragraph
P3405E/B
Maintenance
3 BUILT- IN
TEst FtTNCt't ON'8
1 Internal test
Switch on the echo sounder.
Ping Mode
Select the Operation Menu and set
to
Off
Menu/Version
Enter Test
The version number of software is displayed and should be the same as the
version marked on the installation diskette.
Transceiver test
to
Ping Mode
Select the Operation Menu and set
Normal
Select the Transceiver Menu
Set
Mode
to
Test
Select the Test Menu
Transceiver
Activate
Provided the transducer output has a 60-ohm
termination ,
the following
data will be displayed.
AMPL:
ALO:
NOISE:
ATH:
SPL transducer
2dB
2dB
Single transducer:
2dB
2dB
2 Self- test procedure for printer
Switch off the printer
from the transceiver unit.
test:
Press
the
FF knob while switching on printer.
Start self-
Disconnect the printer
The printer will print one
page. Refer to printer user
Note that this is an internal test of the
s guide.
printer only. Interface ports are not
tested , and therefore errors in communication
between
printer and
transceiver unit will not be detected.
P3405E/B
500. series
portable echo sounders
4 FAULT- FINDING- PROCEDURE
CAUTION
To avoid electric shock, always switch off the mains voltage to the
transceiver unit before removing printed circuit
boards! com ponen ts.
SYMPTOM
No transmitter
pulse , no echogram.
REMEDYIFAULT
CHECK
Check fuse on front of
transceiver board.
If fuse not OK:
If fuse blows again:
Disconnect HV cable and
Change fuse.
measure resistance on
, pins 1- 4 (3-
Mohms). If short circuit:
Faulty analog
transceiver board.
If fuse OK:
Check
20V and +48V
on DC power supply.
Measure voltages in test
points.
TP14: +5V
TP13: - 20V
TP12: +20V
TP10~TP11: +48V
If not OK:
Faulty DC power
supply.
If fuse/LED/voltages OK:
Measure on HV cable on
front of transceiver board
48V)
If voltage OK:
Check cable.
Faulty analog
transceiver board.
P3405E/B
Maintenance
SYMPTOM
System OK
display OK
transmitter
pulse OK , but
no echogram.
CHECK
REMEDYIFAULT
Set Mode in Transceiver
Menu to Test. Enter Test
Menu - Transceiver.
Amplitude should be
approx. - 55 dB (split
beam) or approx. - 61 dB
(single beam). Set Range
to 50 m. The display
should now show a
striped colour pattern.
(the pattern is frequency
dependent).
If not OK:
Faulty analog
transceiver board/dig-
ital transceiver
board.
If OK: Check transducer
connection and measure
transducer impedance
(60 ohms).
No reaction
Faulty analog
transceiver board or
after activating
narrow/wide
PC interface board.
bandwidth
from
transceiver
menu.
No reaction
Faulty analog
after activating
transceiver test
signal from test
transceiver board.
menu.
Wrong transceiver frequency dis-
PC parallel port not
played in
transceiver
menu.
fa ul ty PC interface
writes
black/white
when the sysPrin ter
tem is switched
on.
compatible.
Backplane problem or
board.
Switch printer on/off.
If not OK:
Check colourlblack cartridge.
If cartridge not OK:
Change cartridge.
P3405E/B
500 series portable echo sounders
CHECK
REMEDYIFAULT
Printer writes
random charac-
Run printer self test.
If not OK:
Printer defective.
ters.
If OK:
SYMPTOM
Measure cable.
If cable OK:
Faulty PC interface
board or printer.
Refer to Printer User
Guide
Printer prints
If wrong colours: Check
wrong colours
or parts of
characters are
colour cartridge.
(Refer to Printer User
Guide).
mIssIng.
If cartridge not OK:
Replace cartridge.
If black/white not OK:
Check black cartridge.
If not OK:
Error message:
Printer not
ready.
Check and measure
cabling and plugs.
If OK , change printer
port.
If error message disappears:
If error message still on:
P3405E/B
Replace cartridge.
Change PC interface
board.
Faulty PC interface
board or printer.
Maintenance
SA;SSEMBL Y IREASSE
INTRODUCTION
Only disassembly is described , for reassembly carry
procedures
reverse order.
REMOVING THE UPPER COVER
Simply remove the four crosshead screw and lift up the
REPLACING THE PCB MODULES.
The PCB modules are , from top to bottom:
Analog transceiver
Digital transceiver
PC interface
cover.
500 series portable echo sounders
figure.
First remove the plugs as shown in the
upper module is to be
replaced , it is recommended to first pull out the module in the middle.
Loosen the two screws holding the module be removed and pull it out.
Analog
Digital
transceiver
PC interface
Maintenance
5..
RERLACING THE DC POWER SUPPL Y..
The power supply is located behind the rear panel.
1) Unscrew 8 screws
on the rear panel
2) Remove all three PCB modules as described
paragraph 5.
3) Pull out the ribbon cable plug from the motherboard
500 series portable echo sounders
the socket located behind the ON/OFF
switch on the rear panel.
5) The power supply with motherboard can
be removed
6) If the motherboard and the power supply are to be separated , unscrew six
screws and two nuts. The motherboard and power module are then only
fastened together by a 25- pin Delta connector which easily can be
disconnected.
Maintenance
lV1:ESSAGES
INTRODUCTION
The echo sounder may issue alarms , errors , warnings and other messages to
the display and external devices (via serial port/disk).
2 LIST OF MESSAGES
Message
Explanation
Bottom lost alarm
Bottom tracking lost for transceiver
Display not ready
Display overload (may occur if system
unable to update display with the current
ping rate)
Illegal remote parameter
Parameter value of received remote command out of range or not recognized
Internal error 1-
Spurious interrupt
Internal error 7
Maxim um depth alarm
1
Minim um depth alarm
Bottom has been detected deeper than
the maximum depth alarm setting
Bottom has been detected shallower than
the minimum depth alarm setting
Navigation telegram error
Ping interval warning
Prin ter- 1
not ready
Invalid navigation telegram received
. Ping interval time exceeded
Printer- 1 not connected , offline or not
ready to print yet
Rem. annotation received
Remote annotation has been received
successfully
Remote command ignored
Remote control received while remote
control disabled
Remote parameter entered
Remote parameter received , decoded and
entered successfully
Remote request executed
Remote request has been executed suc-
cessfully
P3405E/B
500 series. portableecho sounders
Message
Explanation
Serial Com. load warning
Too much data is directed to serial port
data may soon be lost
Serial Com. overload
Too much data is directed to serial port
data is lost
Serial- line 1 error
PC COM2 failure
Unknown error
An unexpected software error has been
detected. Should be reported to Simrad
Unknown remote command
Invalid remote command path/parameter
received
Unknown transceiver type
Transceiver hardware switch not recognized
* = Internal software problem. Should be reported to Simrad.
P3405E/B
Maintenance
ERROR
lVIESSAGE1~CO:NC:ERNING
SIGNAL PROCESSING (SP)
1 Introduction
The software consists of a signal processor module and a control processor
module. The signal processor module reads the control parameters sent by
the control processor module before initiating a new ping. The program will
then test each parameter against its legal values. If the parameter is found
to be illegal , or the value does not agree with the other settings , an error
message code is sent to the control processor which will issue the error
message.
At power up the signal processor will never start
real pinging until all the
parameters are granted. However , in order to receive new information from
the control processor , it will simulate pinging until no errors occur.
If the error message " SP- 1 not responding error " is shown on the display,
the signal processor has not answered within a timeout period. This error is
probably caused by one of the following hardware errors:
1) No cable connection between PC and transceiver.
2) Transceiver is not turned on.
3) Hardware error in transceiver.
4) Mismatch between PC and parallel port or not enough memory.
P3405E/B
500, series portable echo sounders
concerning signal processing
messages'
2 List of error
I Error message
I Legal values
SP- 1 angle sensi. error
0 to 100 el.lmech.
SP- 1 bandwidth error
0 to 1
SP- 1
beam type error
0 to 1
SP- 1
btm. max. depth
error
SP- 1 btm. min. depth error
SP- 1 btm. min. level error
0 to 20000 m
1000 m
0 to
80 to 0 dB
SP- 1 damping coeff. error
0 to 300 dB/km
SP- 1 display data error
See note I
SP- 1 equ. beam angle error
100 to - 1 dB
SP- 1 frequency error
104 to 106 Hz
SP- 1 layer data error
See note
SP- 1 not responding error
See paragraph 6.
SP- 1 ping mode error
0 to 3
SP- 1
printer- 1
data error
III
See note I
SP- 1 pulse length error
03 to 10 ms
SP- 1 sample interval error
01 to 0. 5 m
SP- 1 sample tg error
0 to 1
SP- 1 sound velocity error
1400 to 1700 m/s
SP- 1 transceiv. mode error
0 to 3
SP- 1 transd. depth error
0 to
SP- 1 transd. gain error
1 to 100 dB
SP- 1
transd.
paramo error
1000 m
See note
SP- 1 transmit power error
0 to 10 k
SP- 1 TS max. compo
0 to 6 dB
error
SP- 1 TS max. length error
P3405E/B
0 to 10
Main tenance
Error message
SP- 1 TS min. length error
I Legal values
0 to 10
SP- 1 TS min. level error
SP- 1 TS phase devia. error
100 to 0 dB
0 to 10
Note I
SP- 1 display data error
SP- 1 printer- 1 data error
The above error messages will occur if one or more of the following
parameters are outside legal limits:
I Parameter
Bottom echogram dots
Bottom range
Bottom range start
I Legal values
0 to 500
0 to 100 m
100 to 100 m
Echogram dots
0 to 700
Range
0 to 2500 m
Range start
0 to 2500 m
Sub- bottom gain
0 to 5 dB/m
TVG
0 to 2
Note
SP- 1 transd. parameter error
The above error message will occur if one or more of the following
parameters are outside legal limits:
I Parameter
Alongship offset angle
Athwartships offset angle
Three dB bandwidth
I Legal values
20 to 20 mechanical degrees
20 to 20 mechanical degrees
0 to 50 mechanical degrees
P3405E/B
500 series portable echo . sounders
Note
III
SP- 1layer data error
The above error message will occur if one or more of the following
parameters are outside legal limits:
I Parameter
Layer margin
I Legal values
0 to 10
Layer start
100 to 20000
Layer stop
100 to 20000
Layer type
0 to 3
3 Error messages concerning disk
Disk error 0
File not found
Replay end of file
Replay data not found
Replay bad data
File create error
File open error
File write error
File close error
P3405E/B
storage
Maintenance
SpARE. PARTS LIST
Apart from stock number and a description of the required component
remember to include the name of the equipment , type designation and serial
number.
TRANSCEIVER
Printed circuit boards
Type
Beam type
Stock
number
250
Single
382- 074983
250
Split
382- 073377
250
Single
382- 056149
Single
382- 109214
Split
382- 065458
120
Single
382- 074984
120
Split
382- 082822
200
Single
382- 074985
210
Single
382- 109762
710
Single
382- 108879
Transceiver
Frequency
Power
(Analog
(kHz)
(W)
transceiver)
Digital interface (Digital transceiver)
382- 073500
PC interface
382- 109289
DC power supply
290- 109905
Backplane
382- 109325
P3405E/B
Simrad EK 500 / EY 500
CALIBRATION OF THE EK 500 / EY 500
P2260 / 859-043867 / AA011
This document contains calibration procedures, procedures to determine the
beam compensation in a split-beam system and procedures for noise
measurements at sea.
P2260/E
1
Calibration
Document revisions
Rev
Documentation
department
Date
2
Sign
Hardware/Software
Design
Date
Sign
Project/Product
Management
Date
Sign
A
01.02.91
-
B
31.08.92
-
C
01.10.93
-
D
28.05.96
CL
29.05.96
RLN
29.05.96
RB
E
20.05.97
Cl
20.05.97
HS
20.05.97
RLN
P2260/E
Simrad EK 500 / EY 500
List of contents
1 THE PURPOSE OF CALIBRATION . . . . . . . . . . . . . . . . . . . . . . . . . . . . . 5
2 CALIBRATION PROCEDURE . . . . . . . . . . . . . . . . . . . . . . . . . . . . . . . . . . 6
3 THE LOBE CALIBRATION PROGRAM . . . . . . . . . . . . . . . . . . . . . . . . . 17
3.1 UNPACKING AND STARTUP . . . . . . . . . . . . . . . . . . . . . . . . . . . . . 17
3.2 OPERATING PROCEDURE . . . . . . . . . . . . . . . . . . . . . . . . . . . . . . . 18
4 NOISE MEASUREMENTS AT SEA . . . . . . . . . . . . . . . . . . . . . . . . . . . . . 24
P2260/E
3
Calibration
Document history
(The information on this page is for Simrad’s internal use)
Revisions:
Rev. A
Rev. B
Rev. C
Rev. D
Original issue
Minor changes to the text.
Minor changes to the text. EY 500 implemented.
Various changes in the procedures. A chapter about the lobe calibration
program is added. Ref. EM 10526.
Rev. E Some uneccessary information removed from pages 16-17, and a few
minor corrections made on page 6, 8, 15 and on the Calibration Report
sheet.
4
P2260/E
Simrad EK 500 / EY 500
1 THE PURPOSE OF CALIBRATION
The EK 500 and EY 500 are scientific echo sounders designed for quantitative
measurements, i.e. measurement of single fish target strength and
measurement of biomass backscattering coefficient. During the calibration a
reference target with a known target strength is lowered into the sound beam,
and the measured target strength is compared with the known target strength.
If it is necessary to adjust the echo sounder, this is performed by changing a
parameter in the mathematical equations in software. Since the echo sounder
is digital right from the receiver front end, there is no analog gain adjustment.
The reference target is normally a metal sphere. Simrad supplies copper
spheres, one for each frequency. The sphere diameter is selected for minimum
temperature dependence.
For acoustic surveys where accurate quantitative measurements are required
it is essential that the echo sounder is correctly calibrated. It is a safe practice
to perform the calibration before and after the survey. If experiences over time
show that no adjustments are necessary, it may be appropriate to reconsider the
need for frequent calibration. Simrad recommends that calibration is performed
at least once a year, and in areas with different summer and winter condition
at least twice a year.
In the following calibration procedure typical settings on the EK 500/EY 500 are
specified:
Ping Interval:
Transmit Power:
Pulse Length:
Receiver Bandwidth:
Transducer Depth:
1 sec.
Normal (applies only for EK 500)
Medium
Wide
0.0 m
If other settings are to be used during the survey, the calibration should be
repeated for these.
A lobe program which can be supplied from Simrad makes the TS gain
calibration procedure a relatively uncomplicated task by using an extra PC
connected to serial line 1 in a split-beam system. This program will be
noncritical with respect to movement of the reference target sphere and it will
enable the inexperienced operator to obtain a good calibration result. This
program should be used whenever possible. This procedure is described in
chapter 3.
P2260/E
5
Calibration
2 CALIBRATION PROCEDURE
Check the hardware installation
Check that the transducer cable is connected to the correct transducer plug on
the rear side of the EK 500 / EY 500.
Check the internal test oscillator
Select the Transceiver Menu and set Mode to Test.
Select the Operation Menu and set Ping Mode to Normal and Noise Margin to
0 dB.
Select the Test Menu/Transceiver.
The amplitude of the internal test oscillator is now displayed. It should be
-55 dB ±2 dB re 1W on a split-beam sounder and -61 dB ±2 dB re 1W on a
single-beam sounder. If the amplitude is outside these limits, disconnect the
transducer cable and check the amplitude to see if the fault is in the transducer
or in the receiver. The amplitude should now be -49 dB ±2 dB re 1 W on a split
beam sounder, and -55 dB ±2 dB re 1 W on a single beam sounder. If the
amplitude is still outside the limits, the problem is probably related to the
receiver. If it is inside the limits, the transducer impedance should be checked.
Rigging
The following rigging description is to a great extent reproduced from ICES
report 144. The vessel should be anchored in calm and sheltered water. The
depth must be sufficient for separation of sphere and bottom echoes. It is
desirable, moreover, to work in water as deep as possible, consistent with
maintaining a stable platform. Both bow and stern anchoring or tying are
recommended. This is illustrated in figure 1.
Placing of winches
Winches should be used to guide and steer lines to the sphere for its
centering in the echo sounder beam. Affix these winches to the deck railing
in accordance with detailed ship drawings. Place the first winch in the
transverse plane of the vessel running through the transducer. If the
transducer is mounted on one side of the keel, place the first winch on the
opposite side of the vessel. Place the second and third winches on the same
vessel side as the transducer and at equal distances from the transverse
section containing the transducer and first winch.
Each winch must be provided with a long spool of 0.60 mm diameter monofilament nylon line, which is marked with small swivels at 5 m intervals,
beginning 10 m from the loose end.
6
P2260/E
Simrad EK 500 / EY 500
WINCH 1
WINCH 3
WINCH 2
(CD481)
Figure 1 Rigging of a vessel for sphere calibration.
P2260/E
7
Calibration
The purpose of the swivels is threefold:
- to unravel rotation of the nylon line
- to mark distances on the line
- to add weight so that the line sinks in water
Attaching the sphere
Prior to commencing the sphere measurements, a rope should be drawn
beneath the hull from the first winch to the second and third winch before
anchoring. Use this rope to pull the line from the first winch beneath the hull
to the side with the second and third winches.
Attach the appropriate sphere, with affixed loop, to the three suspension
lines, refer to figure 1. For the smaller spheres it may be necessary to add a
weight to keep the sphere stable. This is done via a second line attached to
the three suspension lines. The length of the line must be at least two pulse
lengths, so that the echo from the additional weight does not interfere with
the sphere echo. Immerse the sphere in a solution of dishwashing detergent
and freshwater and lift it overboard by the fastened lines without touching
it. The soap helps to eliminate air bubbles attached to the sphere.
Lowering the sphere
Lower the sphere beneath the vessel to the desired distance, for example
25 m, which is determined roughly by counting the swivels on each line.
In general, one should use sphere distances of 15 m or more for 38 kHz or
higher frequencies. This in order to reduce the effect of pulse rise time and
resolution in distance measurements on the calibration results. Software
version 5.30 has corrected for these effects on the TS and s A calibration.
Two further considerations in choosing the range are the transducer
beamwidth and vessel geometry. The physical width of the beam, which
increases linearly with range, should be sufficiently great so that the sphere
echo is unaffected by the small, perhaps pendular movements to which it is
inevitably subjected. The minimal range must also be convenient with
respect to the vessel geometry. In particular, if the suspension lines do not
hang freely, then control of the sphere may be hindered by friction or possible
obstructions on the hull. Despite the number and variety of these considerations, it is seldom difficult in practice to find a suitable range which satisfies
all of the above criteria.
8
P2260/E
Simrad EK 500 / EY 500
Reference target.
Simrad supplies copper spheres designed as reference targets for the calibration
of scientific sounders. Copper is selected because it is a metal which can be
made electrolytically with high purity. The spheres are machined to the perfect
spherical form with great accuracy, and a nylon loop is attached. Except for 12
kHz, 49 kHz and 50 kHz, the sphere diameter is different for each frequency in
order to obtain a target strength with minimum dependence of temperature (K.
Foote 1983). A curve showing the variation of the target strength follows each
sphere. The curve for the 38 kHz sphere is shown below as an illustration.
Simrad copper spheres
Frequency
kHz
Diameter
mm
12*
18
27
38
49*
50*
70
120
200
710
45.0
63.0
42.0
60.0
45.0
45.0
32.1
23.0
13.7
10.3
TS sound at speed 1490 m/s
dB
-40.4
-34.4
-37.9
-33.6
-36.4
-36.2
-39.1
-40.4
-45.0
-50.5
SIMRAD
60 mm COPPER SPHERE
38 kHz
oct.1991
PULSE DURATION
ms
-34.5
TARGET STRENGTH (dB)
-34.0
-33.5
-33.0
* same sphere
1400
3.0
0.3
1420
1440
1460 1480 1500
SOUND SPEED (m/s)
1520
1540
1560
(CD3146)
Figure 2 Target strength
of a 60 mm copper sphere.
P2260/E
9
Calibration
Simrad sept. 1992
1550
lin
Sa
1500
ity
Mackenzie (1981) J.acoust.Soc.Am., 70,807-12.
Del Grosso (1972) J.acoust.Soc.Am., 52,1442-6.
SOUND SPEED IN SEA WATER
at depth 0 m
m/s
40
Sa
lini
ty 0
1450
1400
0
5
15
10
20
25
30
WATER TEMPERATURE (deg. C)
(CD467)
Figure 3 Sound speed in water.
60
SIMRAD sept. 1990
50
FRANCOIS & GARRISON
JASA dec. 1982
35%
10 Degrees C
200 m depth
pH = 8
SA
LIN
ITY
40
30
25
30
20
15
20
10
10
5
0
0
SOUND ABSORPTION (dB/km)
from
0
(CD468)
25
50
75
100
125
150
175
200
FREQUENCY (kHz)
Figure 4 Sound absorption.
10
P2260/E
Simrad EK 500 / EY 500
Centering of split beam
The purpose of this operation is to move the immersed, suspended sphere onto
the acoustic axis of the transducer. First the echo sounder must be set so that
the echo from the sphere is visible on the display.
Note that in the following procedures, references to transceiver 1, 2 and 3, and
printer 1, 2 and 3, only apply to the EK 500 echo sounder. The EY 500 only uses
one transceiver and one printer.
Select the Transceiver Menu and set:
Mode:
Pulse Length:
Bandwidth:
Transducer Depth
Active
Medium
Wide
0.0 m
Select the Operation Menu and set
Ping Mode:
Ping Interval:
Noise Margin:
Normal
1.0 sec.
0 dB
Select the Display/Echogram Menu and set
Range:
Range Start :
Auto Range:
Bot. Range Pres.:
Presentation:
Layer Lines:
Integration Lines:
TVG:
TS Colour Min:
Select a range from the sea surface to well below the sphere
0m
Off
Off
Normal
On
10 000
40 log r
-50 dB
Select the Log Menu and set
Mode:
Ping Interval:
Ping
100
Select the Layer Menu and set
Super Layer:
P2260/E
1
11
Calibration
Select the Layer Menu/Layer-1 Menu and set
Type:
Range:
Range Start:@
Margin:
Sv Threshold:
No. of Sublayers:
Surface
The layer must be wide enough to cover
the sphere echo during the movements in the
centering operation. Otherwise it should be
as narrow as possible, in order to exclude disturbing fish echoes. Be sure that also the
bottom echo as well as the trailing edge of the
transmitter pulse and the echo from the
additional weight are outside the layer.
0.0 m
-80 dB
1
The rest of the main layers should be turned off.
Select the TS-Detection Menu and set
Min. Value:
Min. Echo Length:
Max. Echo Length:
Max. Gain Comp.:
Max. Phase Dev.:
-50 dB
0.8
1.8
6.0 dB
2.0
The best value for the sound velocity (profile) should be set in the Sound
Velocity Menu in order to keep the accuracy as high as possible for the
calibration exercise.
If the sphere is in the beam an echo will now be seen as a steady line in the
echogram. If the sphere furthermore is inside the -6 dB limit on the beam, the
echo will show up as a dot on the TS detection window on the left-hand side of
the screen. This horizontal projection makes it easy to see which way the sphere
must be moved to reach the beam center. Movement of the sphere occurs by
turning of the various hand winches, always one winch at a time and on specific
command by the director of this procedure, who is guided by constant
observation of the echo on the screen.
12
P2260/E
Simrad EK 500 / EY 500
Centering of single beam
In a single beam system there are different methods to position the sphere in
the centre of the beam. In this system the reference sphere, when detected as
a single target, will always appear in the beam centre. Use the TS detection
window to observe the TS value and adjust the position of the reference sphere
for maximum TS value.
A second method is useful if a single beam transducer is located close to a split
beam transducer. When the distance between the centre of the single and split
beam transducers is known, the reference sphere can be positioned using simple
geometry.
Choose the split-beam transducer in the Transceiver Menu, use the TS detection
window and position the reference sphere in the centre of the beam as
previously described (when the sphere is in the centre of the beam, both the
Angle Along and the Angle Athwart in the TS window will be zero degrees).
Calculate the angle " by means of the information regarding the distance
between the two transducers and the distance between the sphere and the
transducers. Refer to figure 5.
WJ '
G
U
d = distance between single beam and split beam transducers
r = distance between the sphere and the transducers
" = refer to the figure
If, for example, the single beam transducer is located 0.6 m directly behind the
split beam transducer, the sphere must be moved straight aft until the Angle
Along shown in the TS detection window is the same as the calculated angle ".
During the movement, the sphere must be kept at the same distance from the
transducer.
The Angle Along corresponds to the calculated angle " and when these angles
are equal, the sphere will have moved 0.6 m and be in the centre of the beam of
the single beam transducer.
Now operate the system with the single beam transducer and read the TS value
in the TS detection window. To check that the sphere is in the centre of the
beam, move the sphere slightly in the athwartships and fore-and-aft directions
and check for increasing or decreasing TS value.
P2260/E
13
Calibration
Single beam
transducer
Split beam
transducer
d
Minimum
distance
r
µ
The sphere after
being moved to
the centre of the
single beam
The sphere in the
centre of the
split beam
(CD3144)
Figure 5
The Scope mode may be useful during this process as well. The scope plot starts
at the beginning of the super layer, and the horizontal axis contains 200 depth
samples. Accordingly, this depth scale is different for the different frequencies.
Check that the sphere is well within the super layer. Select the Test Menu,
Scope and a dynamic range for the plot (50 dB). Then select the highest
amplitude value to be included in the plot (-50 dB). The sphere echo should now
appear on the scope plot. Reduce the dynamic range to give a high vertical
resolution and adjust the highest amplitude to give a convenient plot where the
peak sphere echo reaches the horizontal centre line on the scale. Then move the
sphere in the transversal and longitudinal directions until the maximum
amplitude position has been found.
Use the TS detection window for single beam to read maximum TS value.
Look at the echogram and check that you have, from the top:
14
P2260/E
Simrad EK 500 / EY 500
-
transmitter pulse
upper layer limit (red line)
sphere echo
lower layer limit (red line)
echo from the additional weight (if used)
bottom echo
all well separated, and no other echoes within the layer limits.
TS-measurement
Select the TS-Detection Menu to get the horizontal projection window. With the
sphere in the center of the beam, the TS compensated and the TS uncompensated should be identical. These values are read on the screen underneath
the horizontal projection window. If there is a small difference use the TS
compensated value as the measured TS value. It is recommended that the
measured TS value is logged together with other important information. A
recommended form is attached at the end of this document.
If the measured TS value differs from the known TS value of the sphere, then
calculate a new TS transducer gain:
TS measured - TS sphere
New transd. gain = Old transd. gain + _________________________________________
2
Select the new TS Transducer Gain in the Transceiver Menu and check that the
measured target strength is correct.
In software version 5.20 and higher, TS values have been corrected for TVG
inaccuracies because of the sample intervals and the pulse rise time.
sA - measurement
The calibration of the TS-measurement described in the previous paragraph is
the primary calibration and it will in many cases be a sufficient calibration. The
TS-measurement, however, is based on the peak value of the echo samples in
the sphere echo, whereas the sA-measurement is based on integration
(averaging) of the echo samples. The received echo may have a smoothed rise
and decay. Therefore the algorithm for calculation of sA in the sounder uses an
effective pulse length rather than the nominal pulse length. A test, and if
necessary, a calibration of the sA calculation may be carried out according to the
following procedure.
P2260/E
15
Calibration
Check the cable connection to colour printer-1.
Switch on colour-printer-1.
Select the Printer1 Menu and set
Integrator Tables:
Echogram:
Number of the transceiver in use (if EK 500)
Slave
The echogram recording will then be similar to the one at the display.
Read the measured sA-value, the red number in the integrator table after each
log interval. Calculate the theoretical sA-value as follows:
TS sphere = target strength of the sphere
F bs = backscattering cross section of the sphere
F bs = 10TS sphere/10
r = distance between the transducer and the sphere
(read from the display screen, underneath the horizontal projection
window).
Q = equivalent 2-way beam angle
(from the measurement data delivered with the transducer)
Q = 10dB-value / 10
4Br02 . Fbs . (1852 m/nm)2
sA (theory) =
______________________________________
Q . r2
where r0 = 1 meter is the standard reference distance for backscattering.
If the measured sA-value differs from the theoretical value, this can be corrected
by changing the Sv Transducer Gain in the Transceiver Menu. Calculate a new
transducer gain:
10 log (s A(measured)/sA(theory))
New transd. gain = Old transd. gain + ___________________________________________________
2
Enter the Sv transducer gain in the Transceiver Menu, and the measured sAvalue will be correct.
The calibration report form at the end of this appendix may be used for
recording calibration conditions and results.
16
P2260/E
Simrad EK 500 / EY 500
3 THE LOBE CALIBRATION PROGRAM
3.1 UNPACKING AND STARTUP
This software package greatly simplifies the task of determining the optimum
transducer pattern parameters to be used in the EK 500/EY 500 Transceiver
Menu. The program runs on IBM PC/XT/AT’s and compatibles. It is strongly
recommended to have a mathematics coprocessor (8087/80287/80387) installed
in the computer to speed up the estimation and plotting algorithms.
This software is distributed free of charge to all Simrad EK 500/EY 500
customers. A self-extracting archive contains
- C source code files
- makefile for automatic compilation/linking
- the executable lobe calibration program
- example transducer measurement data files
- archive program with user’s manual
- this manual (manual.doc)
The C source code was compiled with a Borland Turbo C++ 1.01 compiler.
The procedure for unpacking the archive files is straightforward. Insert the
Simrad distribution diskette in the A drive. Create an empty directory on the
hard disk and copy the archive file to the empty directory. Move to the new
directory and execute the self-extracting archive program.
mkdir lobedir
copy a:*.* lobedir
cd lobedir
lo950117.exe (or older version with different date)
After completion of the archive program the "lobedir" directory contains all the
unpacked files.
To start the lobe calibration program, type
lobe.exe
at the DOS prompt. The function keys F1 to F5 select different operational
menus.
F1. To quit the lobe calibration program.
F2. Serial port 1 is used for communication with the EK 500. For the EY 500
connect to the serial line on the PC and set /Utility/Com1/Com2 Switch = On)
This menu sets the communication parameters. The RS232 cable coupling
diagram is shown on the computer display.
P2260/E
17
Calibration
F3. To record the reference target detections from the EK 500/EY 500 into a
measurement data file. Horizontal hit position and vertical target depth are
displayed.
A simulation mode is available for demonstration and training purposes by
starting the lobe calibration program with an option parameter
lobe.exe -s
F4. To view the true transducer pattern. A two-dimensional polynomial of the
fourth degree is least square fitted to the measured data points and
displayed. Please observe that the polynomial model has more freedom to
adjust to the measured data points than the EK 500/EY 500 internal
transducer model. Hence, the polynomial model should be used to view the
true transducer pattern.
F5. The internal transducer model of the echo sounder is least-square fitted
to the measured data points and displayed. The optimum pattern parameters
are automatically loaded into the echo sounder using the remote control
commands via the RS232 connection.
3.2 OPERATING PROCEDURE
Connect an RS232 serial line cable between the PC and Serial Port 1 on the EK
500 and the serial line on the PC for the EY 500.
Type F2. The plug connections will then be given on the computer display.
Check that the echo sounder Serial/USART Menu has settings corresponding
to those given in the LOBE RS232 Menu. Refer to figure 6.
Switch on the echo sounder and select the Serial/Telegram Menu and set
Remote Control to On. Follow the instructions previously given for Centering of
split beam until the sphere appears as a steady line in the echogram and the
sphere is positioned in the centre of the beam and at a suitable distance from
the transducer.
Switch on the PC and start the LOBE program. Then the LOBE program will
enter necessary menu settings in the echo sounder and read necessary
parameters from same. While the sounder is operating, check that the RS232
serial line connection is active by typing F2.
18
P2260/E
Simrad EK 500 / EY 500
Figure 6
Type F3. The display will show previously saved calibration files. The cursor
will appear at the end of the comment file on top of the display.
Erase the comment string and enter your comments concerning the present
calibration. In the Record Menu you have to fill in a new File Name and
Transceiver Number according to the setting in the sounder (if EK 500). The
transceiver number is selected by means of the horizontal arrow keys. The
correct TS for the calibration sphere according to actual sound velocity has to
be entered in addition to the Depth reading from the TS Menu provided that the
Transducer Depth has been set to 0.0 m. Refer to figure 7.
Figure 7
P2260/E
19
Calibration
The LOBE program will set up "windows" around TS value and Depth. The TS
window is ±4 dB and the Depth window is ±10%. TS samples outside the
windows will be rejected. When starting the calibration, check that the
measured TS value is well within the window. If it is close to the limit, you may,
when moving the sphere, easily end up with TS values outside the window that
will be rejected. To avoid this you should readjust the TS Transducer Gain in
the echo sounder's Transceiver Menu until the reading is closer to the correct
TS value. Then the LOBE program has to be restarted by typing CR/LF and
then F3. This is because the LOBE program has to collect the new settings from
the echo sounder. The Depth window is shown as the green part of the red bar
on the left hand side of the PC display. The present depth of the reference
sphere is shown as the white dot on the right hand side of the bar. Refer to
figure 8.
Then move the reference sphere slowly to collect TS data sets until the file
contains sufficient number (>100) of samples evenly distributed inside the 4
quadrants of the beam pattern. The present or last position of the sphere inside
the beam is shown in white colour (black) and the recorded samples are blue
(grey). The recorded number of Data Sets is shown. When the file is completed,
stop collecting data by typing CR/LF.
If the TS of unwanted objects like fish is recorded, note the sample numbers
when these are recorded. Before processing the recorded data, use an editor to
delete the data recorded from these unwanted echoes. They can be located using
the sample numbers noted, obviously incorrect TS or/and Depth values
appearing incidentally.
When suspect data has been removed, type F4 to check the true transducer
pattern. If this appears to be non-consistent with the expected shape or with
considerable offset values or other anomalies, the possible cause has to be
revealed before the calibration can be completed. The reason may be the
transducer or the transceiver unit.
If acceptable data has been recorded, type F5. The processing of the collected
data will start and the number of iterations is shown at the lower end of the Fit
Menu. When reaching approximately 50 iterations, the processed data will
remain even and the processing can be stopped by typing CR/LF. In the Fit
Menu there is a Relative Angle given in % ( E in old versions). 150 % means all
accepted samples are being used in the calculation. If the operator would like
to check the beam pattern for a reduced angle, decrease the setting by using the
horizontal arrow keys. Reducing to 100 % the calculation will only use samples
inside the -3 dB circles.
20
P2260/E
Simrad EK 500 / EY 500
In the Fit Menu the rms deviation between calculated beam pattern and the
collected data sets will be given as well as the minimum and maximum
deviation and where these data sets are recorded in the file. The max. and min.
values are shown by a red and a blue cross in the polar diagram. The recorded
max. and min. samples should be removed by using the editor if the deviations
are more than approx. 1 dB. Note the line numbers to locate these unwanted
data. All the remaining data sets are shown in the polar diagram by red and
blue dots. The red ones are those above the calculated beam pattern, the blue
are those below. A cut through the beam can be shown for 0, 45, 90 and 135
degrees by typing F1, F2, F3 or F4. Refer to figure 9.
The final calibration data for TS Gain, Beam and Offset values are calculated
and shown in the Fit Menu. These data should preferably be logged in the
recommended form at the end of this document.
By typing CR/LF one more time, the PC will ask if the operator wants to "Copy
best fit parameters to EK 500 (y/n) ?". When typing y, the calculated data will
be entered into the Transceiver Menu. If the echo sounder is already in the
Transceiver Menu, leave this and enter the same menu again to have the new
settings displayed.
When the reference sphere is located in the centre of the beam after the
calibration has been completed, the TS value in this position may be a little
higher than the correct TS. This is more perceptible using old versions of the
LOBE program with a little bit different algorithm.
P2260/E
21
Calibration
Figure 8
22
P2260/E
Simrad EK 500 / EY 500
Figure 9
P2260/E
23
Calibration
4 NOISE MEASUREMENTS AT SEA
The final result of the noise measurements should be a plot of the acoustic noise
in front of the transducer versus vessel speed. This plot may be compared with
similar plots for other transducers on the same vessel, or plots from other
vessels, and may thus serve as an evaluation of the transducer location and the
vessel noise radiation. In addition, the noise plot may be a guide in choosing the
vessel speed during acoustic surveys. Since the propeller pitch and revolutions
per minute influence the noise level, it is important to determine the most
favourable combination of these factors. Normally a slow rotation and a high
pitch give the lowest noise.
The noise measurements should take place at least one nautical mile off shore,
far from other ship traffic and and with favourable weather conditions. It is
preferable that the water depth is 200 m or more. The noise should be measured
at different vessel speeds, from 0 to maximum speed, with steps of 2 knots. The
vessel’s course must be kept steady during these measurements.
With the settings specified below, the printer will produce an echogram and an
integrator table. With some experience it should be possible to reveal the noise
source from looking at the echogram. Typical sources may be propeller
cavitation, small damages on the propeller blade, the machinery, or thermal
noise. It is a good routine to save the echogram with the integrator table for
comparison with later recordings.
Select the Operation Menu and set:
Ping Mode:
Ping Interval:
Transmit Power
Noise Margin:
Normal
0.0
Normal (only for the EK 500)
0 dB
Select the Transceiver Menu/Transceiver-1 Menu (if the transceiver to be tested
is transceiver No. 1) and set:
Mode:
Pulse Length:
Bandwidth:
Passive
Medium
Wide
Select the Transceiver Menu/Transceiver-2 Menu and set (only for the EK 500):
Mode:
Off
Select the Transceiver Menu/Transceiver-3 Menu and set (only for the EK 500):
Mode:
24
Off
P2260/E
Simrad EK 500 / EY 500
Select the Log Menu and set:
Mode:
Ping Interval:
Ping
200
Select the Display Menu and set:
Echogram Speed: 1:1
Echogram:
1
Select the Display Menu/Echogram-1 Menu and set:
Range:
Range Start:
According to table below
According to table below
Frequency
(kHz)
18
38
120
200
Auto Range:
Bot. Range Pres.
Presentation:
Layer Lines:
TVG:
Sv Colour Min.
Range Range
Start
5000
0
1000
100
250
0
200
0
Off
Off
Normal
On
20 log R
-80 dB
Select the Printer-1 Menu and set:
TS Distribution: Off
Integrator Tables 1
Echogram:
Slave
Select the Layer Menu and set:
Super Layer:
P2260/E
1
25
Calibration
Select the Layer Menu/Layer-1 Menu and set:
Type:
Range (layer thickness L)
Range Upper:
Sv Threshold
No. of Sublayers:
Frequency
kHz
18
38
120
200
Range L
m
50
20
10
5
Pelagic
See table below
See table below
-100 dB
1
Range Start
m
3975
990
195
147,5
2TL
dB
96
80
61
59,5
Range settings and transmission loss for different frequencies
Start the noise - speed trial with the vessel in a fixed position. Make a short
echogram recording and an integration table for the same interval. Print a
marker line when starting the recording and give the line a number that at
the same time is logged in the noise-speed report form at the end of this
document.
Print a second marker line at the end of the recording, connect the propeller
and increase the speed to 2 knots. When the vessel has reached a stable
speed, make a new echogram recording interval and integration table for the
same interval. Continue the same procedure at 2-knot intervals until
reaching maximum speed. Use marker lines to separate the different
intervals. When at maximum speed, disconnect the propeller as quick as
possible and print marker lines for each 2 knots as the speed decreases
towards 0.
If the noise level quickly decreases towards the level at 0 knots as soon as the
propeller has been disconnected, this means that the noise is generated by
the propeller. If the recording at decreasing speed is more or less equal to the
same noise level at increasing speed, the cause is probably flow-noise.
If the increase in level is propeller noise and this substantially reduces the
performance of the sounder, repeat the tests with different combinations of
pitch and propeller speed if possible, to find the most favourable conditions.
When making echogram recordings at different speed levels, select the Test
Menu/Transceiver and read the noise power P N re 1 W. Enter readings in the
same form at the end of this appendix.
26
P2260/E
Simrad EK 500 / EY 500
When the trial has been completed, the corresponding noise level, NL dB re 1
FPa can be calculated for both the recording procedures. The results from the
two procedures might differ somewhat because of the different ways they are
measured. The SA method gives the average echo level from a volume of
water during a specified time interval. The P N method is from one individual
power sample in each ping.
The equations for calculating from recorded data to NL is given below.
From SA: (based on the sonar equation)
NL = Si + 10 " log (PTX " SA " T / Z " L) - 2TL + 10 log Q - 75
NL
=
Noise level
dB re 1 FPa
=
Transducer transmitting response
dB re 1 FPa per A
Si
PTX
=
Transmitter power
W
Z
=
Transducer impedance
ohm
2TL
=
Two-way transmission loss
dB
L
=
Layer thickness
m
10 log Q = Equivalent two way beam angle
dB
I
=
Transmitter pulse length
msec
Si , Z , and 10 log Q is from the data sheet for the specific transducer
For split beam transducers Z is for all four quadrants in parallel
PTX and I is from the sounder specifications 2TL and L from the table on
page 26.
From PN:
NL= PN - 20 log 8 - G + 192.8
8=
c=
f=
G=
wavelength = c/f
speed of sound = 1500 m per sec.
frequency
Hz
transducer gain
dB
Read G in the Transceiver Menu/SV Transducer Gain
This noise level NL is comparable with the previous measurements on the
EK 400 when the EK 400 calibration procedure was followed.
The theory for the derivation of the above formula for NL from P N is given
here, now using linear quantities (not dB):
PN is received noise power
IN is plane wave sound intensity
in front of the transducer
A is the effective receiving area
of the transducer
PN = IN . A
G is the transducer gain = 4BA/82
P2260/E
W
W/m2
m2
27
Calibration
n is the plane wave sound pressure in
front of the transducer
Pa
n2 = IN . D c
D is water density = 1000
kg/m3
c is the speed of sound = 1500
m/s
NL = 20 log n + 120
dB re 1 µPa
120 dB is introduced for conversion from Pa to µPa
For the reason of documentation it is recommended to record one scope plot
at survey speed.
Select the Printer-1 Menu/Echogram-1 Menu and set:
Presentation: Scope.
When the scope printout has started, set:
Presentation: Normal
Repeat the measurement for transceiver 2 and 3 (if installed).
References
ICES
Cooperative Research Report 144:
Calibration of acoustic instruments for fish density estimation: A
practical guide.
ICES, Palægade 2, 1261 Copenhagen K, Denmark
ICES
Fish Capture Committee 1981/B:20
Improved calibration of hydroacoustic equipment with copper
spheres. By Foote, Knudsen, Vestnes, Institute of Marine Research,
Bergen and Brede, Nielsen, Simrad Subsea Horten, Norway.
Journal of the Acoustical Society of America, March 1983.
Maintaining precision calibrations with optimal copper spheres By
Ken Foote.
28
P2260/E
Simrad EK 500 / EY 500
Ref.
no
.
Revolutions
Engine
r.p.m.
0
1
2
3
4
5
6
7
8
9
10
11
12
13
14
15
16
17
18
19
20
21
22
23
24
Propeller
r.p.m.
0
Propeller
pitch
Vessel
speed
Measured
SA
Knots
0
Increasing
2
Increasing
4
Increasing
6
Increasing
8
Increasing
10
Increasing
12
Increasing
14
Increasing
16
m2/nm2
NL from
SA
dB re.
1 FPa
Test menu
NOISE
dB re.
1W
NL from
test menu
dB re.
1 FPa
Disconn.
0
0
0
0
0
0
0
P2260/E
29
Calibration
Blank page
30
P2260/E
Simrad EK 500 / EY 500
CALIBRATION REPORT EK 500 / EY 500
VESSEL:................................................................ DATE:........................................................................
PLACE:................................................................. EK/EY 500 SERIAL NO:.........................................
TRANSDUCER TYPE:......................... SERIAL NO.:.................... FREQUENCY:.................. KHZ
WATER TEMP:..................EC
SALINITY:...................% SOUND VELOCITY:............M/SEC.
Ping Interval
1
1
1
Absorption Coefficient
Pulse Length
sec.
dB//km
SHORT
MEDIUM
LONG
Bandwidth
Maximum Power
W
Transmit Power
Angle Sensitivity Alongship (fore and aft)*
Angle Sensitivity Athwartships*
TS of Sphere
dB
Default TS Transducer Gain
dB
Measured TS
dB
Calibrated TS Transducer Gain
dB
Calibrated TS
dB
Default 2-Way Beam Angle
dB
Transducer data 2-Way Beam Angle
dB
Measured Distance Transducer - Sphere
m
Default Sv Transducer Gain
dB
Theoretical sA
m2/nm2
Measured sA
m2/nm2
Calibrated Sv Transducer Gain
dB
Calibrated sA
m2/nm2
Default -3dB Beamwidth Along. *
degrees
Default -3dB Beamwidth Athw. *
degrees
Calibrated -3dB Beamwidth Along.*
degrees
Calibrated -3dB Beamwidth Athw.*
degrees
Alongship (fore-and-aft) Offset*
degrees
Athwartships Offset*
* Valid for split-beam transducers only
degrees
Calibration
Blank page
32
P2260/E
500 series portable echo sounder
DRAWINGS
P3406E / 857-160023 / 4AA062
This document contains the referenced drawings for maintenance of the echo
sounder.
P3406E/B
1
Drawings
Document revisions
Rev
2
Documentation
department
Hardware/Software
Design
Project/Product
Management
Date
Sign
Date
Sign
Date
Sign
A
25.08.95
CL
25.08.95
HS
31.08.95
RB
B
15.03.96
CL
18.03.96
EF
18.03.96
EF
P3406E/B
500 series portable echo sounder
List of Drawings
System interconnection diagram . . . . . . . . . . . . . . . . . . 824-111020 ( 652-05)
Power system . . . . . . . . . . . . . . . . . . . . . . . . . . . . . . . . . . 824-111079 (652-33)
Transducer connections . . . . . . . . . . . . . . . . . . . . . . . . . . 824-111021 (652-06)
Plug connection drawing . . . . . . . . . . . . . . . . . . . . . . . . . 820-134006 (664-36)
Interconnection diagram . . . . . . . . . . . . . . . . . . . . . . . . . 824-111019 (652-04)
Power distribution . . . . . . . . . . . . . . . . . . . . . . . . . . . . . . 824-111022 (652-07)
Motherboard diagram . . . . . . . . . . . . . . . . . . . . . . . . . . . 824-109327 (643-32)
Interface PCB, circuit diagram . . . . . . . . . . . . . . . . . . . . 824-109291 (620-07)
Power supply, circuit diagram . . . . . . . . . . . . . . . . . . . . 824-109632 (640-74)
Sync. unit circuit diagram . . . . . . . . . . . . . . . . . . . . . . . . 824-133142 (627-15)
External sync. cable plan . . . . . . . . . . . . . . . . . . . . . . . . 824-133141 (871-08)
P3406E/B
3
Drawings
Document history
(The information on this page is for Simrad’s internal use)
Rev. A Original issue
Rev. B The document is expanded to cover the portable echo sounders in the
500 Series; EA 501P and EY 500.
4
P3406E/B
SHOW - Convert Binary EY 500 Telegrams to ASCII
Page 1
P2616E/A
SHOW - CONVERT BINARY EY 500
TELEGRAMS TO ASCII
SYNOPSIS
Show input_file [> output_file]
Show -a input_file [> output_file]
Input_file is a EY 500 .dgx file
(Refer to chapter "The Disk Storage" in section "Description of Telegrams and
Remote Control" in the EY 500 Instruction Manual.
DESCRIPTION
The Simrad EY 500 echo sounder outputs binary telegrams over the DISK
interface and the RS232 interface on PC (default COM2). This program
translates binary telegrams into ASCII telegrams providing a useful mechanism
for displaying the content of binary data. Using DOS command input is taken
from the EY 500 input file name at the command line,and output is sent to the
standard output (CRT or a an output file). The telegram formats, binary and
ASCII, are described in the EY 500 Instruction Manual, section "Description of
Telegrams and Remote Control". Five telegrams are only output in binary
format by the EY 500, due to their large size, and no ASCII equivalent is
defined in the EY 500 manual. The full content of these telegrams are printed
in ASCII using the -a option.The compressed ASCII output formats are
described below.
Q1,15280070,Sv, 252.90
pelagic: 0.00, 100.00,250
bottom: 10.00, -5.00,75
B1,15280070
W1,15280070
V1,15280070
P1,15280070
Q1 contains complete echogram data and allows an entire survey to be replayed
and recomputed off line on a general purpose computer: header, time tag, data
type (volume backscattering strength, target strength), detected depth [meter],
upper depth boundary of pelagic echogram [meter],lower depth boundary of
pelagic echogram [meter], number of pelagic echogram data points, upper depth
boundary of bottom echogram [meter], lower depth boundary of bottom
echogram [meter], number of bottom echogram data points.
Simrad Subsea A/S
Horten - Norway
Page 2
P2616E/A
SHOW - Convert Binary EY 500 Telegrams to ASCII
The pelagic echogram boundaries are referred to the sea surface (positive values
below the surface),and the bottom echogram boundaries are referred to the
detected bottom (positive values above the bottom).
B1 contains raw angle sample data from the transceiver (applies to split-beam
transducer channels only): header, time tag, angle data points [phase steps]
alongship angle followed by athwartships angle).
W1 provides raw power sample data referred to the transducer terminals as
measured by the transceiver: header, time tag, amplitude data points [dBW].
V1 provides volume backscattering strength sample data: header, time tag
,amplitude data points [dB].
P1 provides target strength sample data: header, time tag, amplitude data
points [dB].
Simrad Subsea A/S
Horten - Norway