1
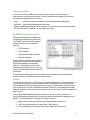
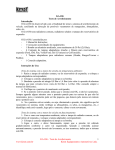
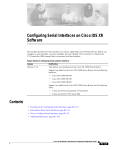
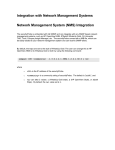
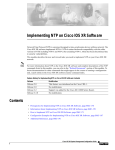
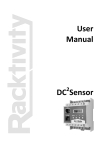
Network Monitoring with SNMP This paper describes how SNMP is used in WhatsUpProfessional and provides specific examples on how to configure performance, active, and passive monitors. Introduction SNMP (Simple Network Management Protocol) lets you manage and monitor network performance, troubleshoot problems with your network, and better prepare for future network growth. It is a flexible technology that can be used across operating systems and device types. For example, the SNMP agent on your router can provide information about the device's network configuration and operations, such as the device's network interfaces, routing tables, networking traffic statistics. This information, called SNMP objects, is stored in a standardized database called the Management Information Base (MIB). The structure of the MIB is defined in SMI (Structure of Management Information) files also called ‘MIB files.’ Each object in a MIB file has an OID (Object Identifier) associated with it. An OID is a series of numbers separated by dots that represent where on the MIB ‘tree’ the object is located. The MIB file defines the SNMP objects that can be managed and the format for each object. How WhatsUp Professional Uses SNMP In WhatsUp Professional, there are three types of SNMP Monitors that you can assign to a device: Passive Monitors, Active Monitors, and Performance Monitors. The differences between these monitors come in the way they gather and report data. Active. Active Monitors query network services installed on a device then wait on the response. Performance. These monitors gather data about specific properties on a device that is then presented visibly in performance graphs. Passive. These monitors ‘listen’ for specific types of information sent from a device. These monitors are stored in their respective library, and are associated to individual devices through device properties. When configuring the monitors for devices, you must provide the proper SNMP read community string (or SNMP credential) for the devices being monitored. The read community string is a pass phrase that must be supplied to make a connection to the SNMP device. SNMP community strings are configured and stored in the Credentials Library, and chosen for a device in the credentials section of device properties. If you do not supply the proper SNMP read community string (or SNMP credential), WhatsUp Professional cannot gather statistics or use the specified monitor for that device. Network Monitoring with SNMP 2 Using SNMP in Device Discovery During device discovery, you can scan your network with SNMP SmartScan, using the SNMP read community strings (separated by commas) entered on the SNMP SmartScan Settings dialog to get a list of devices from an SNMP enabled router. Once the devices are found, the devices are scanned again with the community strings. The devices that are SNMP enabled are identified, scanned for active and performance monitors, their OIDs are recorded, and a Credential entry is added to the device with the title ‘Discovery Credential.’ When adding a single device, click the Advanced button on the Add New Device dialog to enter the SNMP read string for the device you are adding. If correct, the OID is recorded in device properties for that device, and an SNMP credential is created for the string used. Supported Versions of SNMP WhatsUp Professional supports SNMPv1, SNMPv2, and SNMPv3. SNMPv1 and v2 are very similar in the way the application communicates with a device. A primary difference between the two is that you can request additional data packets from a v2 device. SNMPv3 reports the same data as v2, but uses a different authentication scheme. Instead of community strings, v3 devices require a username and password to poll to the device. In addition, users can be configured on the v3 device to have the data packets encrypted before they are sent to a device requesting the SNMP information. Creating SNMP Monitors The following sections provide further detail on creating SNMP monitors in WhatsUp Professional. Each monitor type is described, and real-world scenarios and solutions are used to give you ideas on how to use SNMP Monitors on your network. Adding MIB to WhatsUp Professional In some cases, you may want to add MIB files to the WhatsUp Professional system to make it easier to find specific OIDs within the MIB file. If you are reporting and alerting on non-enterprise OIDs, you may be able to use the MIB files already installed with the application. To add the MIB file to the application, copy the file to the Ipswitch\WhatsUp Professional\Data\Mibs folder in your installation directory. Once the MIB is in that directory, you must restart the WhatsUp Professional application to see the MIB in the MIB Browser. Network Monitoring with SNMP 3 Where to get MIBs If you do not have the MIB files you need for your devices, contact the device manufacturer, or search their website. If you still cannot find the proper file, there are several online resources that you can try. Cisco http://www.cisco.com/public/sw-center/netmgmt/cmtk/mibs.shtml mibDepot http://www.mibdepot.com/index.shtml Standard MIBs are published in RFC (Request for Comment) and can be downloaded from the official RFC repository at: http://www.ietf.org/rfc An SNMP Performance Monitor WhatsUp Professional is installed with four default performance monitors that use SNMP to monitor specific types of performance data on your network devices: CPU Utilization Disk Utilization Interface/Bandwidth Utilization Memory Utilization These monitors represent the majority of performance issues encountered in the day-to-day operation of networked devices. If you need to monitor other values reported on the device, you must create a custom performance monitor for that device. Performance Monitor Library The following example shows why you might need to create a custom performance monitor, and how to create the monitor for the device. Example It is important to keep your server room at a constant temperature. If the temperature is too low or too high, some of your hardware could be damaged, or the room could be uncomfortable for those who must work in the room on a regular basis. The thermostat on the cooling unit is set at 65 degrees Fahrenheit. Recently, more devices have been added to the room, and you are not sure the cooling unit can keep up with the additional heat sources. You install a SNMP enabled temperature sensor in the server room, and want to configure WhatsUp Professional to monitor and chart the temperature readings on the sensor. Here are the steps to configure this type of monitor: 1. Right-click on the map you want to add the temperature sensor to. 2. From the right-mouse menu, select New > New Device. 3. On the Add New Device dialog, enter the IP address of the sensor. Network Monitoring with SNMP 4 4. Click Advanced. 5. On the Device Discovery Properties dialog, clear the active and performance monitor selections (leaving only the Ping active monitor) and enter the read community sting in the SNMP read box. In this case, the string is ‘internal.’ 6. Click OK. 7. On the Add New Device dialog, click OK. WhatsUp Professional then scans the IP address using the SNMP community string to identify the device. 8. When the scan is complete, Device Properties for that device appears. Select the Performance Monitors section. 9. In the Performance Monitors section, click New. 10. Select SNMP Performance Monitor as the type and click OK. 11. On the Add Performance Counter dialog, enter ‘Temperature in F’ in the Name box. 12. After reading through the User Manual for the sensor, we know that the performance counter OID for the temperature on the device is 1.3.6.1.4.1.3854.1.2.2.1.16.1.14. Enter that number in the Performance counter box. If you only have the full MIB file, and do not have the specific OID for the performance counter, you must import that MIB file and browse to the specific performance counter in the MIB. To access the MIB Browser, click the Browse (…) button. Once you select the proper counter, the Performance counter box is filled in with the OID. 13. In the Collection Interval box, enter 5 to have WhatsUp Professional collect the data on the device every 5 minutes. 14. Click OK to add the monitor and begin collecting data. Network Monitoring with SNMP 5 It may take several polls to produce enough data to see anything interesting on your graph. Once you have enough data, you can view the performance reports by: 1. Right-click on the device icon and select Device Reports from the right-mouse menu. The Report View opens to the Device Reports list. 2. Select the Custom Performance Monitor report. This report shows the data collected on the device since the monitor was activated. The report graphs all of the temperature readings gathered at the specified interval. You can change the date and time of the displayed data to show more detail on the graph. Below the graph, the summary bar shows the maximum, minimum, and average value for the time period selected. Note: The temperature sensor used in this example reports the data in whole numbers instead of decimal. The graph above shows 69° as 690. An SNMP Active Monitor Now that you have several days of performance data for your device, you notice that you had occasional spikes in the data that you can’t account for. You can’t tell if a door was left open, a device was turned on, or anything else that would explain this type of spike. You decide that you want to be notified when one of these spikes occur, but only if the spike is, in your opinion, too high. To do this, you can create an active monitor that watches the returned value and makes sure that the value falls in an acceptable range. To create this monitor: 1. On the Device Properties for the temperature device, select Active Monitors. 2. On the Active Monitors section, click Add. The Select Active Monitor Type dialog appears. 3. Since you do not have an active monitor of this type configured in the Active Monitor Library, click Browse (…) to access the Active Monitor Library. 4. In the Active Monitor Library, click New. 5. Select SNMP Monitor as the type of monitor you want to create. Network Monitoring with SNMP 6 6. In the New SNMP Monitor dialog, enter ‘Temperature Range’ in the Name box. 7. Since we already created the performance monitor with this data, we know that the performance counter OID for the temperature on the device is 1.3.6.1.4.1.3854.1.2.2.1.16.1.14. Enter that number in the Performance counter box. 8. In the Check type pull-down menu, select ‘Range of Values.’ 9. We know from the performance monitor that the temperature sensor reports the temperature 60°F as 600. Therefore, enter 600 in the Low value box as the lowest temperature that should be in the server room. 10. Enter 700 as the High value box, since anything over 70°F is considered too high for the room. 11. Click OK to add the monitor to the Active Monitor Library, then click OK to record the selection of the new monitor type. 12. On the Select Active Monitor Type dialog, click Next. 13. Select Enable Polling for this Active Monitor and click Next. 14. Select the type of action scenario you want to use for your monitor. An action profile that you have configured through the Action Profile Library, or select Apply individual actions to build a list of actions that you select from the Action Library. 15. Click Finish to begin using this active monitor on the device. Now that the monitor is configured, you are alerted when the temperature reported by the sensor falls outside of the acceptable temperature range. An SNMP Passive Monitor Many people depend on a particular network printer to publish business-critical reports. When this printer is down, the print queue grows quite large before anyone notices that their reports are not being printed. This causes delays that management deems unacceptable. You have been tasked with monitoring this printer to make sure the toner is at an acceptable level, and there are no errors keeping the printer from functioning properly. To do this monitoring, you decide to create an SNMP Passive Monitor that listens for critical error message and the message that says the toner level is low. 1. Configure your device to send SNMP Traps to your WhatsUp Professional computer. View your device’s User Manual or contact your hardware vendor/manufacturer for how to configure this. 2. Turn on the SNMP Trap Listener by accessing Configure > Program Options > Passive Monitor Listeners in the WhatsUp Professional console. SNMP Trap and click Configure. On the configuration dialog, select Listen for messages on port 162. Click OK to turn the listener on, and click OK to close the dialog. If you have Windows Trap Listener enabled on the WhatsUp Professional computer, the SNMP Trap Listener will not work. You must turn the Windows Trap Listener off first. Network Monitoring with SNMP 7 3. On the Device Properties for the printer device, select Passive Monitors. 4. On the Passive Monitors section, click Add. The Select Passive Monitor Type dialog appears. 5. Since you do not have an active monitor of this type configured in the Passive Monitor Library, click Browse (…) to access the Passive Monitor Library. 6. In the Passive Monitor Library, click New. 7. Select SNMP Trap as the type of monitor you want to create. 8. In the SNMP Passive Monitor instance dialog, enter ‘Printer Alerts’ in the Name box. 9. In the Generic type (Major) box, select 6 Enterprise Specific. 10. Click the Browse (…) button to access the SNMP MIB Browser. 11. In the SNMP MIB Browser, find mgmt > mib-2 > printmib > prtAlert > printerV1Alert > printerV2AlertPrefix > printerV2Alert. This is the SNMP Trap ID for the printer MIB, a default MIB installed with WhatsUp Professional. 12. Click OK. 13. In the Enterprise/OID box, delete the last two digits behind the 2 in the OID. This should leave 1.3.6.1.2.1.43.18.2 in the box. 14. In the Payload box, click Add to build the expressions that you want to match on for the passive monitor. In this example, you browsed the MIB Browser and found the OIDs for prtAlertCode (1.3.6.1.2.1.43.18.1.1.7) and prtSeverityLevel (1.3.6.1.2.1.43.18.1.1.2). Since you want to be alerted when an SNMP Trap payload contains the ‘Towner Low’ message in the prtAlertCode table, configure the Match On to show 1.3.6.1.2.1.43.18.1.1.7=1104 (1104 is the code for ‘toner low.) Since the ‘.’ character is used as a match expression, you have to add a \ to the expression before each ‘.’ character. You also want to know anytime a critical warning is sent from the printer, so click Add again to add 1.3.6.1.2.1.43.18.1.1.2=3. We know from the description of the instance that 3 is the code for ‘critical warning.’ 15. Click OK to add the monitor to the Passive Monitor Library, then click OK to record the selection of the new monitor type. 16. On the Select Passive Monitor Type dialog, click Next. 17. In the Setup Actions for Passive Monitors dialog build a list of actions that you have created in the Action Library. When a trap is received that match the payload, these actions are fired. Network Monitoring with SNMP 8