1
AlliedView™-EMS 3.11
DEVICE MANAGER USER’S GUIDE
AlliedView™-EMS 3.11 Device Manager User’s Guide
Page 1 of 130
TABLE OF CONTENTS
1 OVERVIEW ............................................................................................................................................................................. 6
2 STARTING DEVICE MANAGER........................................................................................................................................ 7
2.1 STARTING FROM THE COMMAND LINE...............................................................................................................................8
2.1.1 Command Syntax.............................................................................................................8
2.1.2 Target Host.......................................................................................................................9
2.1.3 SNMP Version ..................................................................................................................9
2.1.4 Get Community .............................................................................................................10
2.1.5 Set Community ..............................................................................................................10
2.1.6 Trap Community ...........................................................................................................10
2.1.7 Titlebar String.................................................................................................................11
2.1.8 User Account Name .....................................................................................................11
2.1.9 Security Level..................................................................................................................11
2.1.10 Authentication Protocol ............................................................................................11
2.1.11 Authentication Password...........................................................................................12
2.1.12 Privacy Protocol...........................................................................................................12
2.1.13 Privacy Password .........................................................................................................13
2.1.14 Trap Version.................................................................................................................13
2.1.15 Parameter File ..............................................................................................................14
2.2 STARTING FROM A NETWORK MANAGEMENT APPLICATION ...................................................................................... 15
2.2.1 Starting From Castle Rock SNMPc............................................................................16
2.2.2 Starting From HP OpenView Network Node Manager .......................................17
2.2.3 Starting From IBM Tivoli NetView ............................................................................19
2.2.4 Starting From Ipswitch WhatsUp...............................................................................20
3 MAIN WINDOW ................................................................................................................................................................21
3.1 INITIAL WINDOW ............................................................................................................................................................... 22
3.2 PANEL WINDOW ................................................................................................................................................................ 23
3.2.1 System Name..................................................................................................................24
3.2.2 System Location .............................................................................................................24
3.2.3 System Contact ..............................................................................................................24
3.2.4 System Description .......................................................................................................24
3.2.5 Status Bar.........................................................................................................................24
4 BASIC OPERATIONS .........................................................................................................................................................25
4.1 CLICK .................................................................................................................................................................................... 26
4.2 OK, CANCEL AND SET BUTTONS .................................................................................................................................... 27
4.3 POP-UP MENUS .................................................................................................................................................................... 28
4.4 RESIZING WINDOWS.......................................................................................................................................................... 29
4.5 RESIZING TABLES ................................................................................................................................................................. 30
5 COMMON MENUS.............................................................................................................................................................34
5.1 FILE ........................................................................................................................................................................................ 35
5.1.1 Open.................................................................................................................................35
5.1.2 Reopen .............................................................................................................................40
5.1.3 Close.................................................................................................................................40
5.1.4 Property...........................................................................................................................41
5.1.5 Exit ....................................................................................................................................41
5.2 VIEW ..................................................................................................................................................................................... 42
AlliedView™-EMS 3.11 Device Manager User’s Guide
Page 2 of 130
5.2.1 Toolbar ............................................................................................................................42
5.2.2 Status Bar.........................................................................................................................42
5.2.3 System Info......................................................................................................................43
5.2.4 Threshold ........................................................................................................................43
5.2.5 Current Log ....................................................................................................................44
5.2.6 Snapshot...........................................................................................................................45
5.2.7 Refresh .............................................................................................................................46
5.3 OPTION ................................................................................................................................................................................ 47
5.3.1 Screen Tab.......................................................................................................................47
5.3.2 External Command Tab ...............................................................................................50
5.3.3 User Action Tab.............................................................................................................51
5.3.4 Other Tab........................................................................................................................54
5.4 TOOL .................................................................................................................................................................................... 57
5.4.1 TELNET ...........................................................................................................................57
5.4.2 WEB Browser.................................................................................................................57
5.4.3 MIB Browser...................................................................................................................58
5.4.4 VLAN Manager...............................................................................................................58
5.4.5 QoS Manager ..................................................................................................................58
5.5 USER MENU .......................................................................................................................................................................... 59
5.5.1 Create Your Own Menu Item ....................................................................................59
5.5.2 Edit ....................................................................................................................................60
5.5.3 Common..........................................................................................................................62
5.5.4 Target ...............................................................................................................................63
5.6 HELP ...................................................................................................................................................................................... 64
5.6.1 Index .................................................................................................................................64
5.6.2 ATI on-line ......................................................................................................................64
5.6.3 License Registration ......................................................................................................65
5.6.4 About................................................................................................................................66
6 MIB VARIABLE WINDOW ...............................................................................................................................................67
6.1 TABLE TAB ........................................................................................................................................................................... 69
6.1.1 Transpose Button ..........................................................................................................70
6.2 PLOT CHART TAB ............................................................................................................................................................... 71
6.2.1 Graph................................................................................................................................72
6.2.2 MIB Variable Table ........................................................................................................72
6.2.3 Select All Button ............................................................................................................72
6.2.4 Clear Button ...................................................................................................................72
6.2.5 Reverse Button...............................................................................................................72
6.3 BAR CHART TAB ................................................................................................................................................................. 74
6.3.1 Chart.................................................................................................................................75
6.3.2 MIB Variable Table ........................................................................................................75
6.3.3 Select All Button ............................................................................................................75
6.3.4 Clear Button ...................................................................................................................75
6.3.5 Reverse Button...............................................................................................................75
6.4 EDIT TAB .............................................................................................................................................................................. 77
6.4.1 Checkbox Column ........................................................................................................78
6.4.2 MIB Variable Column....................................................................................................78
6.4.3 MIB Value Column.........................................................................................................78
6.4.4 Select All Button ............................................................................................................78
6.4.5 Clear Button ...................................................................................................................78
AlliedView™-EMS 3.11 Device Manager User’s Guide
Page 3 of 130
6.4.6 Reverse Button...............................................................................................................78
6.4.7 Get MIB Value Button ..................................................................................................78
6.4.8 Set MIB Value Button....................................................................................................79
6.4.9 Threshold Button...........................................................................................................79
6.5 OPTIONS TAB ...................................................................................................................................................................... 81
6.5.1 Polling Interval ................................................................................................................81
6.5.2 Display Data Type of Chart ........................................................................................81
6.5.3 Regist Menu.....................................................................................................................82
6.5.4 Save Polling Data............................................................................................................82
6.5.5 Start Snapshot.................................................................................................................83
6.5.6 Default Button................................................................................................................84
7 RMON ....................................................................................................................................................................................85
7.1 RMON-SPECIFIC BUTTONS ............................................................................................................................................... 86
7.2 STATISTICS ............................................................................................................................................................................ 87
7.2.1 Data Group Buttons .....................................................................................................88
7.2.2 Management Information Area...................................................................................89
7.2.3 Entry Tab .........................................................................................................................89
7.2.4 Table Tab.........................................................................................................................92
7.2.5 Plot Chart Tab................................................................................................................93
7.2.6 Pie Chart Tab..................................................................................................................94
7.2.7 Options Tab ....................................................................................................................95
7.2.8 Close.................................................................................................................................99
7.3 HISTORY CONTROL TABLE .............................................................................................................................................100
7.3.1 Data Group Buttons .................................................................................................. 101
7.3.2 Management Information Area................................................................................ 102
7.3.3 Entry Tab ...................................................................................................................... 103
7.3.4 Table Tab...................................................................................................................... 106
7.3.5 Plot Chart Tab............................................................................................................. 107
7.3.6 Pie Chart Tab............................................................................................................... 108
7.3.7 Options Tab ................................................................................................................. 109
7.3.8 Close.............................................................................................................................. 114
7.4 ALARM TABLE ....................................................................................................................................................................115
7.4.1 Alarm Table Tab ......................................................................................................... 115
7.4.2 Event Table of Alarm ................................................................................................. 117
7.4.3 Add Button................................................................................................................... 117
7.4.4 Edit Button ................................................................................................................... 120
7.4.5 Remove Button ........................................................................................................... 120
7.4.6 Close.............................................................................................................................. 120
7.5 EVENT TABLE .....................................................................................................................................................................121
7.5.1 Event Table Tab .......................................................................................................... 121
7.5.2 Select Button ............................................................................................................... 122
7.5.3 Add Button................................................................................................................... 122
7.5.4 Edit Button ................................................................................................................... 123
7.5.5 Remove Button ........................................................................................................... 123
7.5.6 Close.............................................................................................................................. 123
7.6 EVENT LOG ........................................................................................................................................................................124
7.6.1 Log List of All Events ................................................................................................. 124
7.6.2 Event Log Entry........................................................................................................... 125
AlliedView™-EMS 3.11 Device Manager User’s Guide
Page 4 of 130
7.6.3 Remove All Button..................................................................................................... 125
7.6.4 Remove Button ........................................................................................................... 125
7.6.5 Display All Button....................................................................................................... 125
7.6.6 Refresh Button ............................................................................................................ 126
7.6.7 Close.............................................................................................................................. 126
8 FORWARDING DATABASE..........................................................................................................................................127
8.1 STANDARD VIEW ..............................................................................................................................................................128
8.2 ENHANCED VIEW ..............................................................................................................................................................129
AlliedView™-EMS 3.11 Device Manager User’s Guide
Page 5 of 130
1 Overview
Device Manager is a device management application that lets you manage Allied Telesis'
hubs, switches and routers using Simple Network Management Protocol (SNMP). You can
perform various operations on the devices from an intuitive graphical user interface. Since
Device Manager is written in Java, it runs on multiple platforms, including Windows, Solaris
and HP-UX, and provides a common look and feel on all supported platforms.
Device Manager can be used with an integrated network management platform such as HP
OpenView or as a standalone application.
This User's Guide describes the functions and operations common to all managed devices.
For device-specific operations, please refer to the ATI Device Management Guide.
Topics:
•
•
•
•
•
•
Starting Device Manager
Main Window
Basic Operations
Common Menus
MIB Variable Window
RMON
1 Overview
AlliedView™-EMS 3.11 Device Manager User’s Guide
Page 6 of 130
2 Starting Device Manager
Device Manager can be started in two ways, from the command line or from a network
management application.
When started, Device Manager identifies the target device after you enter its IP address.
Device Manager will then display the main panel of that device.
Note - In Windows environments, Device Manager can also be launched from the Start
menu or from the Run command in the File menu.
Topics:
•
•
Starting From the Command Line
Starting From a Network Management Application
2 Starting Device Manager
AlliedView™-EMS 3.11 Device Manager User’s Guide
Page 7 of 130
2.1 Starting From the Command Line
The command line interface is the most basic way to start Device Manager.
Topics:
•
•
•
•
•
•
•
•
•
•
•
•
•
•
•
Command Syntax
Target Host
SNMP Version
Get Community
Set Community
Trap Community
Titlebar String
User Account Name
Security Level
Authentication Protocol
Authentication Password
Privacy Protocol
Privacy Password
Trap Version
Parameter File
2.1.1 Command Syntax
To start Device Manager from the command line, use the following syntax.
devicemanager [options]
You can specify the following options:
TargetHost
Target host's IP address or DNS host name.
SnmpVersion
SNMP version to be used.
GetCommunity
SNMP Get community string. This is used when retrieving MIB values.
SetCommunity
SNMP Set community string. This is used when modifying MIB values.
TrapCommunity
SNMP Trap community string. This is used when receiving Traps from agents.
AlliedView™-EMS 3.11 Device Manager User’s Guide
Page 8 of 130
DisplayName
Titlebar string.
UserName
User account name to be used for accessing the MIB. This is required when using
SNMPv3.
SecLevel
Security level that is configured for the User Name. This is required when using
SNMPv3.
AuthProtocol
Authentication protocol that is configured for the User Name. This is required when
using SNMPv3.
AuthPassword
Authentication password that is configured for the User Name. This is required
when using SNMPv3.
PrivProtocol
Privacy protocol that is configured for the User Name. This is required when using
SNMPv3.
PrivPassword
Privacy password that is configured for the User Name. This is required when using
SNMPv3.
TrapVersion
SNMP Trap version to be used.
2.1.2 Target Host
The target host can be specified by entering the IP address of the device or its host name.
Examples:
devicemanager -TargetHost 172.16.99.123
devicemanager -TargetHost dvcmgrhub
2.1.3 SNMP Version
The Device Manager can use SNMPv1, SNMPv2c and SNMPv3. You may specify a value of 1,
2 or 3. If the SNMP Version is not specified, the default value of 1 (SNMPv1) will be used.
AlliedView™-EMS 3.11 Device Manager User’s Guide
Page 9 of 130
Examples:
devicemanager -TargetHost 172.16.99.123 -SnmpVersion 1
devicemanager -TargetHost 172.16.99.123 -SnmpVersion 2
2.1.4 Get Community
Get Community is an SNMP community string used to get MIB values from the agent. You
must specify the same community string as the one configured on the target host. If the
string is not specified, the default community string "public" is used.
Examples:
devicemanager -TargetHost 172.16.99.123 -GetCommunity getdvcmgr
devicemanager -TargetHost dvcmgrhub -GetCommunity getdvcmgr
2.1.5 Set Community
Set Community is an SNMP community string used to change the values of the agent's MIB
variables. You must specify the same community string as the one configured on the target
host. If the string is not specified, default community string "private" is used.
Examples:
devicemanager -TargetHost 172.16.99.123 -SetCommunity setdvcmgr
devicemanager -TargetHost dvcmgrhub -SetCommunity setdvcmgr
2.1.6 Trap Community
Trap Community is an SNMP community string used to receive traps from the agent. You
must specify the same community string as the one configured on the target host. If the
string is not specified, the default community string "public" is used. If the Trap Community
is explicitly defined, the trap will be enabled automatically.
Example:
devicemanager -TargetHost dvcmgrhub -TrapCommunity trapdvcmgr
AlliedView™-EMS 3.11 Device Manager User’s Guide
Page 10 of 130
2.1.7 Titlebar String
You can specify a string to display on the titlebar.
Example:
devicemanager -TargetHost dvcmgrhub -DisplayName dvcmgr
2.1.8 User Account Name
If you specified 3 (SNMPv3) for the SNMP Version, you must also specify a User Account
Name that is already configured on the target host.
Examples:
devicemanager -TargetHost 172.16.99.123 -SnmpVersion 3
-UserName AlliedView -SecLevel noAuthNoPriv
devicemanager -TargetHost 172.16.99.123 -SnmpVersion 3
-UserName AlliedView1 -SecLevel authNoPriv -AuthProtocol SHA
-AuthPassword PASS1233
2.1.9 Security Level
If you specified 3 (SNMPv3) for the SNMP Version, you must also specify a Security Level
that is configured for the User Account Name on the target host. The available Security
Levels are noAuthNoPriv, authNoPriv, and authPriv.
Examples:
devicemanager -TargetHost 172.16.99.123 -SnmpVersion 3
-UserName AlliedView -SecLevel noAuthNoPriv
devicemanager -TargetHost 172.16.99.123 -SnmpVersion 3
-UserName AlliedView1 -SecLevel authNoPriv
-AuthProtocol SHA -AuthPassword PASS1233
2.1.10 Authentication Protocol
If you specified 3 (SNMPv3) for the SNMP Version, and your Security Level is authNoPriv or
authPriv, you must specify an Authentication Protocol that is configured for the User
Account Name on the target host. The available Authentication Protocols are MD5 and
SHA.
AlliedView™-EMS 3.11 Device Manager User’s Guide
Page 11 of 130
Examples:
devicemanager -TargetHost 172.16.99.123 -SnmpVersion 3
-UserName AlliedView -SecLevel authNoPriv
-AuthProtocol MD5 -AuthPassword PASS1234
devicemanager -TargetHost 172.16.99.123 -SnmpVersion 3
-UserName AlliedView1 -SecLevel authNoPriv
-AuthProtocol SHA -AuthPassword PASS1233
2.1.11 Authentication Password
If you specified 3 (SNMPv3) for the SNMP Version, and your Security Level is authNoPriv or
authPriv, you must specify an Authentication Password that is configured for the User
Account Name on the target host.
Examples:
devicemanager -TargetHost 172.16.99.123 -SnmpVersion 3
-UserName AlliedView -SecLevel authNoPriv
-AuthProtocol MD5 -AuthPassword PASS1234
devicemanager -TargetHost 172.16.99.123 -SnmpVersion 3
-UserName AlliedView1 -SecLevel authNoPriv
-AuthProtocol SHA -AuthPassword PASS1233
2.1.12 Privacy Protocol
If you specified 3 (SNMPv3) for the SNMP Version, and your Security Level is authPriv, you
must specify a Privacy Protocol that is configured for the User Account Name on the target
host. The available Privacy Protocol is DES.
Examples:
devicemanager -TargetHost 172.16.99.123 -SnmpVersion 3
-UserName AlliedView -SecLevel authPriv
-AuthProtocol MD5 -AuthPassword PASS1234
-PrivProtocol DES -PrivPassword PASS5678
devicemanager -TargetHost 172.16.99.123 -SnmpVersion 3
-UserName AlliedView1 -SecLevel authPriv
-AuthProtocol SHA -AuthPassword PASS1236
-PrivProtocol DES -PrivPassword PASS5675
AlliedView™-EMS 3.11 Device Manager User’s Guide
Page 12 of 130
2.1.13 Privacy Password
If you specified 3 (SNMPv3) for the SNMP Version, and your Security Level is authPriv, you
must specify a Privacy Password that is configured for the User Account Name on the
target host.
Examples:
devicemanager -TargetHost 172.16.99.123 -SnmpVersion 3
-UserName AlliedView -SecLevel authPriv
-AuthProtocol MD5 -AuthPassword PASS1234
-PrivProtocol DES -PrivPassword PASS5678
devicemanager -TargetHost 172.16.99.123 -SnmpVersion 3
-UserName AlliedView1 -SecLevel authPriv
-AuthProtocol SHA -AuthPassword PASS1236
-PrivProtocol DES -PrivPassword PASS5675
2.1.14 Trap Version
The Device Manager can use SNMP v1, v2c, v3 traps or all versions of SNMP traps. You
may specify a value of 1, 2, 3, or 4. If the SNMP Trap Version is not specified, the default
value of 1 (v1) will be used. If the Trap Version is explicitly defined, the trap will be enabled
automatically.
Examples:
devicemanager -TargetHost 172.16.99.123 -TrapVersion 2
devicemanager -TargetHost 172.16.99.123 -SnmpVersion 2 -TrapVersion 4
If you specified 3 (v3) for the SNMP Trap Version, the SNMP Version that must be specified
is SNMPv3 also with additional SNMPv3 parameters. You can also combined SNMPv3
parameters with any trap versions.
Examples:
devicemanager -TargetHost 172.16.99.123 -SnmpVersion 3
-UserName AlliedView -SecLevel noAuthNoPriv -TrapVersion 3
devicemanager -TargetHost 172.16.99.123 -SnmpVersion 3
-UserName AlliedView1 -SecLevel authNoPriv -AuthProtocol SHA
-AuthPassword PASS1233 -TrapVersion 1
AlliedView™-EMS 3.11 Device Manager User’s Guide
Page 13 of 130
2.1.15 Parameter File
Option parameters can be written in a file and can be used by Device Manager to access the
device. The parameter file is a plain text file which contains a name-value pair on each line.
Example:
devicemanager -TargetHost H3600 @para1.txt
where para1.txt is:
-SetCommunity set
-GetCommunity get
-Displayname TEST
2 Starting Device Manager
AlliedView™-EMS 3.11 Device Manager User’s Guide
Page 14 of 130
2.2 Starting From a Network Management Application
Device Manager can be started from an integrated network management application.
Topics:
•
•
•
•
Starting From Castle Rock SNMPc
Starting From HP OpenView Network Node Manager
Starting From IBM Tivoli NetView
Starting From Ipswitch WhatsUp
AlliedView™-EMS 3.11 Device Manager User’s Guide
Page 15 of 130
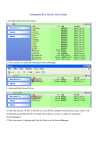
2.2.1 Starting From Castle Rock SNMPc
To start Device Manager from SNMPc, double-click on a node icon on the map window. If
the node is supported by Device Manager, the main panel of the node is displayed.
Note that Device Manager and SNMPc run independently of each other, so exiting SNMPc
has no effect on Device Manager. Device Manager continues to run even after SNMPc stops
running. To exit Device Manager, select Exit from its File menu.
Starting from SNMPc
Note - SNMPv3: In order to start Device Manager in SNMPv3 mode, the node's Read/Write
Access Mode attribute should be set to SNMP V3 No-Auth, SNMP V3 Auth-MD5, SNMP V3
Auth-SHA, SNMP V3 Priv Auth-MD5, or SNMP V3 Priv Auth-SHA, depending on the SNMPv3
settings configured on the target device.
AlliedView™-EMS 3.11 Device Manager User’s Guide
Page 16 of 130
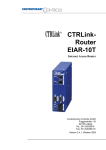
2.2.2 Starting From HP OpenView Network Node Manager
To start Device Manager from HP OpenView, select a node on the map window, then
select AlliedView-EMS > Device Manager from the Tools menu.
Note that Device Manager and HP OpenView run independently of each other, so exiting
HP OpenView has no effect on Device Manager. Device Manager continues to run even
after HP OpenView stops running. To exit Device Manager, select Exit from its File menu.
Starting from HP OpenView
Note - The configuration of HP OpenView changes during the installation of AlliedView-EMS
to incorporate Device Manager and AMIGO in its menu.
Note - For the AT-AR255E running firmware v1.0.2, HP OpenView sets the host name to
“RIP2-ROUTERS.MCAST.NET”. Device Manager, when started within HP OpenView, uses
this host name and connects to any RIP2 router present in the network. As a result, Device
Manager may not load the AT-AR255E device panel and may instead load another device’s
image. To prevent this from happening, create one entry in the local hosts file for each ATAR255E running firmware v1.0.2 in the network. Use the LAN IP address of the device and
a host name that is unique within the network.
AlliedView™-EMS 3.11 Device Manager User’s Guide
Page 17 of 130
Note - HP-UX : When manually adding an AT-AR255E running firmware v1.0.2 to the
network map in HP OpenView, use the device’s host name, as specified in the local hosts
file, for the Hostname field in the IP Map dialog. Using the device’s IP address instead of its
host name will reset the Hostname field to “RIP2-ROUTERS.MCAST.NET” causing Device
Manager to connect to any RIP2 router present in the network when started within HP
OpenView.
Note - HP OpenView can only start Device Manager in SNMPv1 mode.
AlliedView™-EMS 3.11 Device Manager User’s Guide
Page 18 of 130
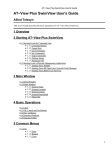
2.2.3 Starting From IBM Tivoli NetView
To start Device Manager from Tivoli NetView, select the device that you want to connect
to then choose Tools > AlliedView-EMS to start Device Manager.
Note that Device Manager and Tivoli NetView run independently of each other, so exiting
Tivoli NetView has no effect on Device Manager. Device Manager continues to run even
after Tivoli NetView stops running. To exit Device Manager, select Exit from its File menu.
Starting from Tivoli NetView
Note - The configuration of Tivoli Netview changes during the installation of AlliedView-EMS
to incorporate Device Manager and AMIGO in its menu.
Note - Tivoli NetView can only start Device Manager in SNMPv1 mode.
AlliedView™-EMS 3.11 Device Manager User’s Guide
Page 19 of 130
2.2.4 Starting From Ipswitch WhatsUp
To start Device Manager from Ipswitch WhatsUp, right click on the device you want to
connect to then choose AlliedView-EMS Device Manager.
Note that Device Manager and Ipswitch WhatsUp run independently of each other, so
exiting Ipswitch WhatsUp has no effect on Device Manager. Device Manager continues to
run even after Ipswitch WhatsUp stops running. To exit Device Manager, select Exit from
its File menu.
Starting from WhatsUp
Note - Ipswitch WhatsUp can only start Device Manager in SNMPv1 mode.
2 Starting Device Manager
AlliedView™-EMS 3.11 Device Manager User’s Guide
Page 20 of 130
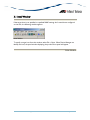
3 Main Window
When started, Device Manager displays one of the following windows, depending on how it
is started.
Topics:
•
•
Initial Window
Panel Window
3 Main Window
AlliedView™-EMS 3.11 Device Manager User’s Guide
Page 21 of 130
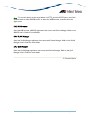
3.1 Initial Window
If the target host is not specified, or specified SNMP settings don't match those configured
on the host, the following window appears.
Initial Window
To specify a target host from this window, select File > Open. When Device Manager can
identify the host, the panel window displaying the product front panel will appear.
3 Main Window
AlliedView™-EMS 3.11 Device Manager User’s Guide
Page 22 of 130
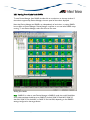
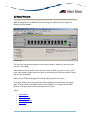
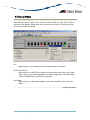
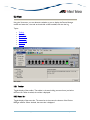
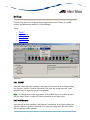
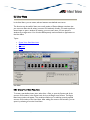
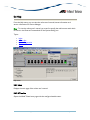
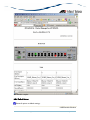
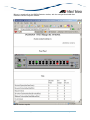
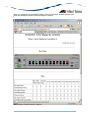
3.2 Panel Window
When the target host is specified and Device Manager can identify the host model, the
following window appears.
Panel window
The menu bar includes items specific to the product model, in addition to the menu items
common to all models.
Some elements such as network ports also act as menus. When you click on a port, a pulldown menu appears. Select these menu items in the same way as from the menu bar, where
they can also be selected.
Refer to the ATI Device Management Guide for device-specific menu items.
In the panel window, the lower half of the window displays information about the target
agent, showing values of the MIB-II system group variables. If you change the size of the
window, it will open at the new size the next time it is used.
Topics:
•
•
•
•
•
System Name
System Location
System Contact
System Description
Status Bar
AlliedView™-EMS 3.11 Device Manager User’s Guide
Page 23 of 130
3.2.1 System Name
Usually, the System Name is set to a unique descriptive name for identifying the device. This
refers to the MIB object sysName.
Note - SNMPv3: Depending on the READ VIEW access settings of the user name, there is a
possibility that the System Name will not be displayed.
3.2.2 System Location
Usually, the System Location is set to indicate where the device is installed. This refers to
the MIB object sysLocation.
Note - SNMPv3: Depending on the READ VIEW access settings of the user name, there is a
possibility that the System Location will not be displayed.
3.2.3 System Contact
The System Contact is set to indicate the name or phone number of the contact person for
the device. This refers to the MIB object sysContact.
Note - SNMPv3: Depending on the READ VIEW access settings of the user name, there is a
possibility that the System Contact will not be displayed.
3.2.4 System Description
Usually, the System Description is set to to indicate some information about the device
such as model name, software release and version. This refers to the MIB object sysDescr.
Note - SNMPv3: Depending on the READ VIEW access settings of the user name, there is a
possibility that the System Description will not be displayed.
3.2.5 Status Bar
The status bar is the area at the bottom of the panel window where a brief description of a
highlighted menu option or toolbar button is displayed. The depressed rectangular area at
the right end of the status bar shows the connection state of Device Manager.
3 Main Window
AlliedView™-EMS 3.11 Device Manager User’s Guide
Page 24 of 130
4 Basic Operations
This chapter describes the basic operations within Device Manager windows.
Topics:
•
•
•
•
•
Click
OK, Cancel and Set Buttons
Pop-up Menus
Resizing Windows
Resizing Tables
4 Basic Operations
AlliedView™-EMS 3.11 Device Manager User’s Guide
Page 25 of 130
4.1 Click
Device Manager uses both the left and right mouse buttons. To operate items on the menu
bar, you can use both the left and right mouse buttons. To click on the icons on the toolbar,
use the left mouse button. To open the menus for the device images displayed in the main
Device Manager window, use the right mouse button, then you can use either the left or
right mouse button to select an item in the menu that you have opened.
4 Basic Operations
AlliedView™-EMS 3.11 Device Manager User’s Guide
Page 26 of 130
4.2 OK, Cancel and Set Buttons
Dialog boxes have buttons to commit or discard changes made in the dialog box.
Clicking the OK button confirms and commits the changes made and closes the dialog box.
If the dialog box has tabs, the OK button commits changes in all the tabs.
Note - Some configuration options are effective only after restarting Device Manager.
Clicking the Cancel button discards the changes made in the dialog box and closes the
dialog box.
Clicking the Set button commits changes immediately without closing the dialog box.
Note - Clicking the Cancel button after the Set button cannot undo any changes.
4 Basic Operations
AlliedView™-EMS 3.11 Device Manager User’s Guide
Page 27 of 130
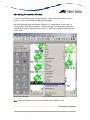
4.3 Pop-up Menus
Some elements such as network ports also act as menus. When you right click on a port, a
pull-down menu appears. Select these menu items in the same way as from the menu bar,
where they can also be selected.
Port
Right clicking on a port displays the menu items specific to the device.
RS-232 Terminal Port
Right clicking on an RS-232 port displays the menu items which allow you to select
how to log in to the device's management interface. Depending on the device type,
Telnet or WEB Browser (HTTP) can be selected.
Reset Button
Right clicking on a reset button displays a menu item that allows you to reset the
device.
4 Basic Operations
AlliedView™-EMS 3.11 Device Manager User’s Guide
Page 28 of 130
4.4 Resizing Windows
To resize a window, follow the procedures specific to the platform you use. The new
window size is stored when exiting Device Manager, and restored when Device Manager is
restarted. You can also resize the image or fix the display of the image using the Options
window. In the main Device Manager window, click Option > Option to open the Options
window then check the "Image size fixed" option.
Fixed image size
4 Basic Operations
AlliedView™-EMS 3.11 Device Manager User’s Guide
Page 29 of 130
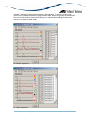
4.5 Resizing Tables
Device Manager displays information in tables. It is possible to resize table boundaries or
field/column boundaries by dragging the borders. To do this, position your pointer on a
table border. When the pointer has transfomed into arrows, left click on the border and
drag it to the right or to the left, depending on whether you want to increase or decrease
the table or field/column.
Example 1: Adjusting the MIB Variable column. To do this, position your pointer on the
column border. When the pointer has transfomed into arrows, left click on the border and
drag it to the left while holding the left mouse button to display the other columns.
Ex 1: Before adjustment
AlliedView™-EMS 3.11 Device Manager User’s Guide
Page 30 of 130
Ex 1: After adjustment
AlliedView™-EMS 3.11 Device Manager User’s Guide
Page 31 of 130
Example 2: Adjusting the boundary between graph and table. To do this, position your
pointer on the border between the graph and the table. When the pointer has transfomed
into arrows, left click on the border and drag it to the left while holding the left mouse
button to increase the table width.
Ex 2: Before adjustment
Ex 2: After adjustment
AlliedView™-EMS 3.11 Device Manager User’s Guide
Page 32 of 130
Example 3: Adjusting the table boundary. To do this, position your pointer on the right table
border. When the pointer has transfomed into arrows, left click on the border and drag it
to the right while holding the left mouse button to increase the table width.
Ex 3: Before adjustment
Ex 3: After adjustment
4 Basic Operations
AlliedView™-EMS 3.11 Device Manager User’s Guide
Page 33 of 130
5 Common Menus
This chapter describes the menu items common to all Allied Telesis managed devices.
Topics:
•
•
•
•
•
•
File
View
Option
Tool
User Menu
Help
5 Common Menus
AlliedView™-EMS 3.11 Device Manager User’s Guide
Page 34 of 130
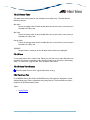
5.1 File
The File menu lets you start and stop managing a device, check the properties of the target
host, or exit Device Manager.
Topics:
•
•
•
•
•
Open
Reopen
Close
Property
Exit
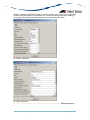
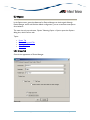
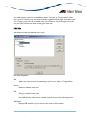
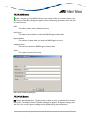
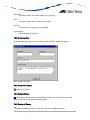
5.1.1 Open
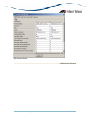
From the Open menu item, you can specify a target host to manage. When you select File >
Open, the following dialog box appears. To connect to the device, fill in parameters in the
dialog box, then click OK.
Note - This option is not available if Device Manager is already connected to a target host.
AlliedView™-EMS 3.11 Device Manager User’s Guide
Page 35 of 130
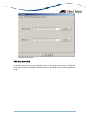
Select Target Host dialog box
Target host
The host name or the IP address of the target host. To see the description of the
host, fill in host name or IP address and click Confirm. To connect to the host, click
OK.
Note - If "v3" is the selected SNMP version and the specified user account has no
READ VIEW access to the System Description OID but has READ VIEW access to
the System Object ID, clicking on the confirm button will display the message,
"Unable to retrieve system description."
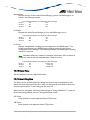
SNMP Options
Version
This drop down list allows you to select the SNMP version to use in managing the
target device.
Note - Before choosing "v2c" or "v3", make sure that the target device you are
connecting to supports SNMP v2c and/or SNMP v3 respectively.
AlliedView™-EMS 3.11 Device Manager User’s Guide
Page 36 of 130
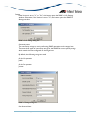
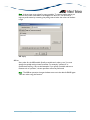
Settings
If the Version is set to "v1" or "v2c", this button opens the SNMP v1/v2c Settings
window. Otherwise, if the Version is set to "v3", this button opens the SNMP v3
Settings window.
SNMP v1/v2c Settings dialog box
Community name
The community strings to use in performing SNMP operations on the target host.
There are three types of community strings for the SNMP. Be sure to specify strings
which match the ones configured on the target host.
By default, the following strings are used:
for the Get operation
public
for the Set operation
private
SNMP v3 Settings dialog box
User Account Name
AlliedView™-EMS 3.11 Device Manager User’s Guide
Page 37 of 130
This is the SNMPv3 User Account to be used for accessing the MIB of the target
device. Make sure to specify a User Account that has already been configured on the
target device.
Security Level
This is the Security Level for the User Account Name that you have specified. Make
sure to set the Security Level to be the same as what is configured on the target
device.
These are the available Security Levels:
No Auth / No Priv
This Security Level uses no authentication and no privacy.
Auth / No Priv
This Security Level uses authentication without privacy.
Auth / Priv
This Security Level uses authentication and privacy.
Authentication Protocol
If the Security Level is "Auth / No Priv" or "Auth / Priv", you need to specify an
Authentication Protocol. Make sure to set the Authentication Protocol to be the
same as what is configured on the target device.
These are the available Authentication Protocols:
MD5
Use HMAC-MD5-96 protocol
SHA
Use HMAC-SHA-96 protocol
Authentication Password
If the Security Level is "Auth / No Priv" or "Auth / Priv", you need to specify an
Authentication Password. Make sure to set the Authentication Password to be the
same as what is configured on the target device.
Privacy Protocol
If the Security Level is "Auth / Priv", you need to specify a Privacy Protocol. This is
the available Privacy Protocol:
DES
Use Data Encryption Standard
AlliedView™-EMS 3.11 Device Manager User’s Guide
Page 38 of 130
Privacy Password
If the Security Level is "Auth / Priv", you need to specify a Privacy Password. Make
sure to set the Privacy Password to be the same as what is configured on the target
device.
Trap Options
Version
This drop down list allows you to select the SNMP trap version to be used in
receiving traps.
Note - Device Manager will only accept "v3" trap version if SNMP version in the
SNMP Options panel is also set to "v3".
Note - Device Manager will only be able to process and display SNMP v3 traps
received from the currently connected device.
Enable 'Trap' operation
To receive traps from a target host's SNMP agent, check this box.
Note - If SNMPc, HP OpenView or Tivoli NetView is running, Device Manager will
not receive any traps. This is because the traps are being intercepted by the
network management application and will never reach Device Manager.
v1/v2c Trap Community Name
Specify the community string that will be used for receiving SNMP v1 or v2c traps.
The default string is "public".
Polling Options
Settings
This button opens the Polling Options dialog box, in which you can change the
polling interval and retry parameters.
Polling Options dialog box
Polling Interval
AlliedView™-EMS 3.11 Device Manager User’s Guide
Page 39 of 130
Device Manager sends a GetRequest to the SNMP agent at predefined polling
intervals to ensure that it is still connected to the device. If a shorter or longer
interval is required adjust the value in the Polling Interval field accordingly.
The minimum interval is 5 seconds and the maximum is 3600 seconds (1 hour). The
default is 30 seconds.
Retry
Configures the SNMP timeout and the number of retries.
Timeout
The number of seconds Device Manager waits before it determines that the
device is not responding. The default is 5 seconds.
Retry times
The number of times Device Manager sends SNMP messages to the agent before
giving up. The default is 2 retries.
Enable periodic device polling
To regularly check the hardware configuration of hot-swappable devices, check this
box. When this is checked, Device Manager checks the hardware configuration at
every polling interval. The Panel window shows any hardware configuration changes
it finds.
If the target device is not hot-swappable, or if you do not expect any hardware
configuration changes, do not check this box. Polling the hardware configuration may
reduce performance.
Note - Device Manager always checks the latest hardware configuration of the target
device when initiating connection. To check the configuration on demand after the
session is established, select View > Refresh.
Current status
Indicates whether or not Device Manager is currently connected to a target device
and whether or not Trap operations are currently enabled.
5.1.2 Reopen
This command can be used to reconnect to a recently accessed device.
5.1.3 Close
Closes the SNMP session with the device and closes the Panel window. To connect to
another device, select File > Open.
AlliedView™-EMS 3.11 Device Manager User’s Guide
Page 40 of 130
5.1.4 Property
Change parameters for communicating with the device. The dialog box is identical to the
Select Target Host dialog box used to open a connection. For information on the settings
that can be modified or viewed from this dialog box, see section 5.1.1.
5.1.5 Exit
Terminates connection to the target device and closes the Device Manager application.
5 Common Menus
AlliedView™-EMS 3.11 Device Manager User’s Guide
Page 41 of 130
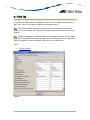
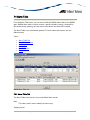
5.2 View
Using the View menu, you can determine whether or not to display the Device Manager
toolbar and status bar, view and set thresholds on MIB variables, and view the log.
Topics:
•
•
•
•
•
•
•
Toolbar
Status Bar
System Info
Threshold
Current Log
Snapshot
Refresh
View menu
5.2.1 Toolbar
Toggles display of the toolbar. The toolbar is the area holding command icons just below
the menu bar. When checked, the toolbar is displayed.
5.2.2 Status Bar
Toggles display of the status bar. The status bar is the area at the bottom of the Device
Manager window. When checked, the status bar is displayed.
AlliedView™-EMS 3.11 Device Manager User’s Guide
Page 42 of 130
5.2.3 System Info
Toggles display of system information, namely, System Name, System Location, System
Contact, and System Description.
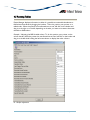
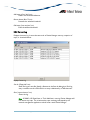
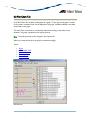
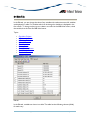
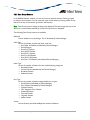
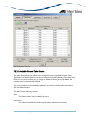
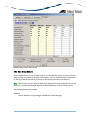
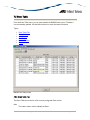
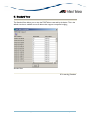
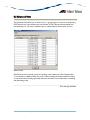
5.2.4 Threshold
Displays a list of the configured thresholds. You can also create new thresholds or change
the existing thresholds.
The table has the following fields:
•
•
•
•
•
•
•
Status - Indicates the status of the MIB variable that Device Manager is monitoring.
MIB Variable - Name of the MIB variable that Device Manager is monitoring.
Current Value - Current value of the variable.
Max Value - Highest value of the variable after Device Manager starts monitoring.
Min Value - Lowest value of the variable after Device Manager starts monitoring.
Average Value - Average value of the variable (per second) after Device Manager
starts monitoring.
Condition - Threshold configured on the variable. If the variable's value exceeds the
threshold, an action is executed. You can configure the type of action to execute in
the User Action tab of the Option menu.
Note - Current, Max, Min and Average values are zero before the first polling. After the first
polling, they all have the same value. Once the threshold is reached, the corresponding row
is highlighted with a red background. Note that thresholds can only be set for MIB variables
of type GAUGE, INTEGER, COUNTER, GAUGE32, INTEGER32, COUNTER32, or
COUNTER64.
Display Threshold
AlliedView™-EMS 3.11 Device Manager User’s Guide
Page 43 of 130
Add button (Green 'plus' icon)
Adds a new threshold definition.
Remove button (Blue 'X' icon)
Removes the selected threshold.
Edit button ('note and pen' icon)
Edits the selected threshold.
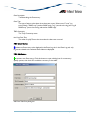
5.2.5 Current Log
Displays the event log. It records events such as Device Manager start up, reception of
traps, or threshold events.
Display Current Log
Save As ('Floppy disk' icon)
Saves the log as a text file. Specify a filename in the Save As dialog box. Each log
entry is saved as one line. Each field in an entry is delimited by a TAB character.
Clear ('note and eraser' icon)
Clears the log.
Note - If SNMPc, HP OpenView, or Tivoli NetView is running, Device Manager will
not receive any traps. This is because the traps are being intercepted by the
network management application and will never reach Device Manager.
AlliedView™-EMS 3.11 Device Manager User’s Guide
Page 44 of 130
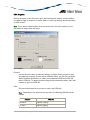
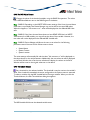
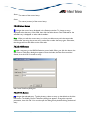
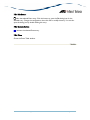
5.2.6 Snapshot
Clicking this option in the View menu opens the Start Snapshot window. Use this window
to create an image of the device, as well as tables or charts representing device information,
in HTML format.
Note - If you open the Start Snapshot from the View menu in the main window, you can
only create an image of the main panel.
Start Snapshot
File name
Use the 'Browse' button to select the directory or folder where you want to save
the image and to specify the name of the HTML file. When you click OK, three files
will be created in the directory or folder you've selected: a PNG file, an XML file,
and an HTML file. To display the device image and associated information, use a web
browser to open the HTML file.
Select
Choose the information that you want to save in the HTML file.
Note - Depending on the selections that you make, the following PNG files will be
created:
Selection
PNG File
Main Panel
snapshot_m#.png
Plot chart
snapshot_p#.png
AlliedView™-EMS 3.11 Device Manager User’s Guide
Page 45 of 130
Selection
Reload
PNG File
Bar Chart
snapshot_b#.png
Pie Chart
snapshot_i#.png
Table Data
No .png file is created for table data.
Mark this option if you want to update the HTML file at a regular interval.
Foreground Color
This enables you to specify the color of the foreground of the HTML file as displayed
on the web browser, including the text and table borders. Click the "Color
selection" button to open the Foreground Color Selection window where you can
choose the foreground color.
Background Color
This enables you to specify the color of the background of the HTML file as
displayed on the web browser. Click the "Color selection" button to open the
Background Color Selection window where you can choose the background color.
5.2.7 Refresh
Redisplay the Panel window with the latest device information. Use this menu when the
target host is replaced with another device or if the hardware configuration of the target
host changes.
5 Common Menus
AlliedView™-EMS 3.11 Device Manager User’s Guide
Page 46 of 130
5.3 Option
In the Option menu, general preferences for Device Manager can be changed. Although
Device Manager works well with the default configuration, you can customize some aspects
of its behavior.
This menu has only one submenu, 'Option'. Selecting Option > Option opens the Options
dialog box, which has four tabs.
Topics:
•
•
•
•
Screen Tab
External Command Tab
User Action Tab
Other Tab
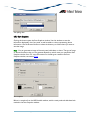
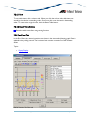
5.3.1 Screen Tab
Controls the appearance of Device Manager.
Screen tab
AlliedView™-EMS 3.11 Device Manager User’s Guide
Page 47 of 130
Look & feel
Changes how Device Manager windows are displayed. Your options are Windows,
CDE/Motif, and Metal. To put this change into effect, click OK.
Language
Changes the language. English and Japanese are available. If you change this setting,
you must restart Device Manager to put the change into effect.
Note - This feature is not supported in this version of Device Manager.
Toolbar type
Changes the appearance of the toolbar. Choose one of 'Text Only', 'Image Only' or
'Image and Text'. To put this change into effect, click OK.
Display type
Changes the display style for stackable devices. To put this change into effect, click
OK.
Stack Type
Displays all stacked devices in one window.
AlliedView™-EMS 3.11 Device Manager User’s Guide
Page 48 of 130
Tab Type
Displays each stacked device in a separate tab.
AlliedView™-EMS 3.11 Device Manager User’s Guide
Page 49 of 130
Resize window when the number of stack changes
When checked, Device Manager resizes the Panel window according to the number
of stacked devices. If this is not checked, the size of Panel window does not change
even if Device Manager detects a change in the stack configuration.
Image size fixed
When this option is selected, the size of the image in the main Device Manager
window will not change even if the window size is increased.
Link-down as error
When this option is selected, inactive ports are displayed as red ports in the main
Device Manager window, indicating that links to those ports are down. Disabled
ports are displayed as black ports.
Note - The Link-down as error option is not applicable to the following devices:
• AT-AR240E
• AT-AR250E
• AT-AR255E
• AT-RG213FX
• AT-RG213TX
5.3.2 External Command Tab
Configures application commands used to directly access the device's management interface.
You can specify a telnet client and a web browser to use. The web browser specified here
is also used to view the online user's manual.
TELNET command
Specifies a command line to start the Telnet client. On Windows, "C:\Program
Files\Windows NT\hypertrm.exe /t" may be used. On UNIX, use "dtterm -e telnet".
Make sure that the command is correct by manually executing the command line. To
select a command from the file list dialog box, click Browse.
WEB browser
Specifies the command or file used to start your web browser.
AlliedView™-EMS 3.11 Device Manager User’s Guide
Page 50 of 130
External Command tab
5.3.3 User Action Tab
In the User Action tab, you can specify the action to take when an event occurs. There are
three types of events: an SNMP command timeout, a threshold event, and the reception of
a trap.
AlliedView™-EMS 3.11 Device Manager User’s Guide
Page 51 of 130
User Action tab
You can choose an action for each event type. There are two types of actions.
Popup message
Device Manager displays a popup window when an event occurs.
Command
Device Manager executes a predefined command line when an event occurs. You
can use the following special arguments in the command line. They are automatically
passed by Device Manager.
For all event types
$TARGETHOST
The host name of the device. If Device Manager cannot get the host name
using the address, the IP address is used instead.
$TARGETIPADDR
The IP address of the device.
For threshold events
$MIBNAME
The name of the MIB variable which Device Manager calls.
AlliedView™-EMS 3.11 Device Manager User’s Guide
Page 52 of 130
$CURRENT
Current value of the variable.
$MAXVALUE
Highest value of the variable during the monitoring period.
$MINVALUE
Lowest value of the variable during the monitoring period.
$AVERAGE
Average value of the variable during the monitoring period.
$MAXLIMIT
Threshold value configured for the variable.
For trap events
$TRAPHOST
The host name of the device which sent the trap.
$TRAPIPADDR
The IP address of the device which sent the trap.
$GENERICTRAP
The generic trap number.
$SPECIFICTRAP
The specific trap number.
$ENTERPRISEOID
The trap's enterprise OID.
$ENTERPRISENAME
The name of the Trap MIB object. If Device Manager cannot get an object
name, $ENTERPRISEOID is used instead.
$TIMETICKS
The trap's TIMETICKS.
$VAROIDn
The OID of the nth MIB object sent with the trap, where n is a number in the
range 1 to 9.
$VARNAMEn
The name of the nth MIB object sent with the trap, where n is a number in
the range 1 to 9. If Device Manager cannot get a name, $VAROIDn is used
instead.
AlliedView™-EMS 3.11 Device Manager User’s Guide
Page 53 of 130
$VALUEn
The value of the nth MIB object sent with the trap, where n is a number in
the range 1 to 9.
5.3.4 Other Tab
In the Other tab, you can configure how MIB variables are displayed and the character
encoding system to use in sending and receiving SNMP data. Note that changes made here
apply to windows which are opened after the change is applied. Windows which are already
open are not affected by the changes.
Other tab
MIB variable name display type
Choose the display type of the variable name from "Convert", "MIB variable" and
"Both". When you change the setting, sample text is displayed in the "Sample"
textbox.
"Convert" option displays a MIB variable name in English.
Examples:
System Description
System Contact
System Name
System Location
AlliedView™-EMS 3.11 Device Manager User’s Guide
Page 54 of 130
"MIB variable" option displays a MIB variable name in its original form.
Examples:
sysDescr.0
sysContact.0
sysName.0
sysLocation.0
"Both" option displays a MIB variable name in both English and its original form.
Examples:
System Description (sysDescr.0)
System Contact (sysContact.0)
System Name (sysName.0)
System Location (sysLocation.0)
Omit Display
In the Edit tab of dialog boxes, where MIB variables can be edited, "Stack#.Port#" is
appended at the end of the MIB variable name. If you want to omit this suffix, check
this box.
The X-axis display name of the chart and graph is displayed with the number
When checked, item names on the graph/chart's x-axis are displayed as numbers
instead of variable names. This option may be useful when you view a lot of variables
on a screen.
Encoding
Specifies the character encoding system to use in sending and receiving SNMP data.
SNMP receive data encoding
Specifies the character encoding of the data received from the device. Your options
are None, Auto detect, Shift JIS, JIS, and EUC.
Note - In some cases, Device Manager may not be able to recognize the SNMP data
encoding format received when "Auto detect" is selected. If this occurs, you will
need to specify the appropriate SNMP data encoding format.
AlliedView™-EMS 3.11 Device Manager User’s Guide
Page 55 of 130
SNMP send data encoding
Specifies the character encoding of the data sent by the device. Your options are
None, Shift JIS, JIS, and EUC.
Note - It is advisable to set the encoding option to the default value.
5 Common Menus
AlliedView™-EMS 3.11 Device Manager User’s Guide
Page 56 of 130
5.4 Tool
From the Tool menu, you can launch external applications such as Telnet, your WEB
browser, the MIB browser AMIGO, or VLAN Manager.
Topics:
•
•
•
•
•
TELNET
WEB Browser
MIB Browser
VLAN Manager
QoS Manager
Tool menu
5.4.1 TELNET
Starts the Telnet application specified in the External Command tab of the Options dialog
box (Option > Option > External Command). This menu item simply starts the Telnet
application with no argument (target host) specified.
Note - To Telnet directly to the target device, click the RS-232 port in the Panel window
and then select Telnet, or select the Telnet command from the Agent menu.
5.4.2 WEB Browser
Starts the web browser specified in the External Command tab of the Options dialog box
(Option > Option > External Command). This menu item simply starts the web browser
with no argument (URL) specified.
AlliedView™-EMS 3.11 Device Manager User’s Guide
Page 57 of 130
Note - To connect directly to the target device via HTTP, click the RS-232 port in the Panel
window and then select WEB Browser, or select the WEB Browser command from the
Agent menu.
5.4.3 MIB Browser
Starts the MIB browser (AMIGO) application that comes with Device Manager. Refer to the
AMIGO User's Guide for more details.
5.4.4 VLAN Manager
Starts the VLAN Manager application that comes with Device Manager. Refer to the VLAN
Manager User's Guide for more details.
5.4.5 QoS Manager
Starts the QoS Manager application that comes with Device Manager. Refer to the QoS
Manager User's Guide for more details.
5 Common Menus
AlliedView™-EMS 3.11 Device Manager User’s Guide
Page 58 of 130
5.5 User Menu
In the User Menu, you can create, edit and execute user-defined menu items.
This function may be useful if there are a small number of Device Manager windows that
you use more often than all others (common GUI windows). Usually, you need to perform
several steps to open a window. By creating your own menu item, you can open the
windows by a single action. You can also add frequently used commands or applications to
the User Menu.
Topics:
•
•
•
•
Create Your Own Menu Item
Edit
Common
Target
User Menu
5.5.1 Create Your Own Menu Item
To create a user-defined menu item, select User > Edit, or open the Options tab of the
common GUI window. In the Options tab, click on the 'Regist menu' button. The Regist
Menu Item window will appear. This window will allow you to add the currently opened
common GUI window to the User Menu. After adding the common GUI window, you can
open it by selecting it from the User Menu.
AlliedView™-EMS 3.11 Device Manager User’s Guide
Page 59 of 130
User-defined menu items can be classified as either 'Common' or 'Target-specific'. Menu
items in the 'Common' group are always available, regardless of the target host. Menu items
in the 'Target' group are only accessible when you connect to the same target host as the
one you were connected to when creating the menu item.
5.5.2 Edit
Add, delete and edit user-defined menu items.
User Menu Registration
Add
Remove
Edit
Adds a new menu item to the selected group (Common Menu or Target Menu).
Deletes a selected menu item.
Changes a selected menu item.
User-defined menu items can be created to perform one of the following actions.
MIB display
Displays MIB variables of your choice in the common GUI window.
AlliedView™-EMS 3.11 Device Manager User’s Guide
Page 60 of 130
Note - It takes times to get values for many variables. To improve performance, you
can limit the number of variables to be displayed to about 10. You can further
improve performance by increasing the polling interval when the volume of the data
is high.
MIB display
MIB set
Sets a value for the MIB variable. Specify a variable and a value to set. You must
specify the variable with an instance number. For example, 'sysDescr.0' or
rptrMonitorPortEntry.1.8' are valid examples. If you specify a variable without an
instance such as 'sysDescr', the set operation cannot be performed.
Note - The MIB set operation changes the data structure in the device's SNMP agent.
Take care when using this function.
AlliedView™-EMS 3.11 Device Manager User’s Guide
Page 61 of 130
MIB set
External command
Executes the specified command line.
External command
5.5.3 Common
The Common submenu contains the user-defined menu items which are accessible
regardless of the target device.
AlliedView™-EMS 3.11 Device Manager User’s Guide
Page 62 of 130
5.5.4 Target
The Target submenu contains the user-defined menu items which are accessible only when
connected to the specific target device.
5 Common Menus
AlliedView™-EMS 3.11 Device Manager User’s Guide
Page 63 of 130
5.6 Help
From the Help menu, you can view the online user's manual, license information and
version information for Device Manager.
Note - To view the online user's manual, you must first specify the web browser with which
to view it in the External Command tab of the Options dialog box.
Topics:
•
•
•
•
Index
ATI on-line
License Registration
About
Help menu
5.6.1 Index
Displays the main page of the online user's manual.
5.6.2 ATI on-line
Opens the Allied Telesis home page with the configured web browser.
AlliedView™-EMS 3.11 Device Manager User’s Guide
Page 64 of 130
5.6.3 License Registration
Device Manager can be evaluated for a limited period without a license. If you want to use
Device Manager after that period, you must obtain a license. Contact your authorized Allied
Telesis distributor or reseller.
In the License Registration menu, you can view, add and remove license information stored
in Device Manager.
When you buy a license, you are supplied with a license sheet with your License Key
printed on it. Enter this to register your license.
To register your license, follow these steps.
1. Start Device Manager.
2. Select Help > License Registration.
3. Click the 'Add' button (green +).
Click 'Add' button
4. Enter the License Key written on your license sheet, then click OK.
Input License Key
5. Device Manager displays the registered license information.
AlliedView™-EMS 3.11 Device Manager User’s Guide
Page 65 of 130
5.6.4 About
Displays version and copyright information for Device Manager.
5 Common Menus
AlliedView™-EMS 3.11 Device Manager User’s Guide
Page 66 of 130
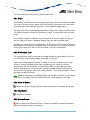
6 MIB Variable Window
When you select a menu item to view information from the SNMP agent, a MIB variable
window with tabs appears. In this window, you can view MIB variables in several different
styles, set a threshold on variables for monitoring, change the value of the variables and
change options.
The window has some common components regardless of the information displayed. This
section describes operations which are common for all such MIB variable windows.
The MIB variable windows have several tabs, each of which displays variables in different
styles, such as tables, plot charts, and bar charts. You can quickly change the view by clicking
a tab.
Additionally, the MIB variable windows have a tab which is used to change the values of the
MIB objects, and a tab to configure options.
Note - To change MIB variables, you must have configured the community string for the
SNMP 'Set' operation both in Device Manager and on the device.
Note - The type of variables displayed determines which kind of tabs are displayed and
which are not. For example, chart tabs are not displayed when you are only viewing string
variables.
Note - SNMPv3: There are times that the MIB Variable Window will only display one row
with the value column displayed as blank. This happens when the user does not refresh the
Panel Window after removing the read permission on the MIB Group.
Note - SNMPv3: Depending on the user's view access security settings, the values of some
MIB objects may not be displayed.
Topics:
•
•
•
•
•
Table Tab
Plot Chart Tab
Bar Chart Tab
Edit Tab
Options Tab
AlliedView™-EMS 3.11 Device Manager User’s Guide
Page 67 of 130
MIB Variable Window
6 MIB Variable Window
AlliedView™-EMS 3.11 Device Manager User’s Guide
Page 68 of 130
6.1 Table Tab
In the Table tab, MIB variables are displayed in a table. This is the default tab opened by a
menu item. Values in the table are updated at each polling interval.
Note - The type of variables displayed determines which kind of tabs are displayed and
which are not. For example, chart tabs are not displayed when you are only viewing string
variables.
Note - SNMPv3: Depending on the READ VIEW access settings of the User Account Name
used, there is a possibility that Device Manager may not be able to access some MIB values.
When this happens, the table will display a blank cell for those MIB values.
Topic:
•
Transpose Button
Table tab
AlliedView™-EMS 3.11 Device Manager User’s Guide
Page 69 of 130
6.1.1 Transpose Button
: flips rows and columns.
6 MIB Variable Window
AlliedView™-EMS 3.11 Device Manager User’s Guide
Page 70 of 130
6.2 Plot Chart Tab
In the Plot Chart tab, variables are displayed as a graph. To the right of the graph is a table
of the numeric variables which can be displayed in the graph. Variables selected in the table
are plotted on the graph.
The scale of the vertical axis is automatically adjusted according to the values of the
variables. The graph is updated at each polling interval.
Note - The polling interval can be changed in the Options tab.
When you resize the window, the graph is resized accordingly.
Topics:
•
•
•
•
•
Graph
MIB Variable Table
Select All Button
Clear Button
Reverse Button
Plot Chart tab
AlliedView™-EMS 3.11 Device Manager User’s Guide
Page 71 of 130
The components of the Plot Chart tab are discussed below.
6.2.1 Graph
The left half of the window contains the graph showing the values of the selected variables.
The vertical (Y) axis shows the values and the horizontal (X) axis shows time. New values
are plotted when Device Manager gets them, at the predefined polling interval.
The scale of the X-axis is automatically adjusted according to the number of values plotted.
The X-axis can display a maximum of the latest 20 values. The rightmost point is the most
recent.
Each variable is plotted in a different color and shape. A list of the variables on the graph
and their shapes and colors is displayed between the graph and the variable table.
By placing the mouse cursor on the plotted dot on the graph, you can see the exact values
(coordinates) of the variable. For example, when you move the cursor onto the 10th point
on the X-axis which has a value of 100, the numbers "(10,100)" are displayed.
6.2.2 MIB Variable Table
The right half of the window is the table of variables suitable for graph display. Each entry
has a checkbox. Only checked variables are plotted on the graph.
Assume that you selected four variables to display. If one of the variables has very large
values, for instance 1000000, and the other variables have low values, for instance
approximately 100, the vertical axis is automatically scaled to accomodate the largest
variable. In this situation, you can see only the largest variable because the scale of the
vertical axis is too large for other three smaller variables. To see smaller variables, uncheck
the largest variable temporarily.
Note - SNMPv3: Depending on the READ VIEW access settings of the User Account Name
used, there is a possibility that some MIB variables will not be displayed in this table.
6.2.3 Select All Button
: checks all variables. Clicking this button causes all variables to be plotted on the graph.
6.2.4 Clear Button
: unchecks all variables.
6.2.5 Reverse Button
: flips the states of all checkboxes, that is, unchecks all variables currently selected and
checks all variables currently not selected.
AlliedView™-EMS 3.11 Device Manager User’s Guide
Page 72 of 130
Note - Displaying many variables at the same time imposes a load on system resources. If
you encounter delay or reduced system performance, reduce the number of variables
displayed, or increase the polling interval. To reduce the number of variables, uncheck some
variables in the MIB variable table. To increase the polling interval, click the Options tab and
change the Polling Interval.
6 MIB Variable Window
AlliedView™-EMS 3.11 Device Manager User’s Guide
Page 73 of 130
6.3 Bar Chart Tab
The Bar Chart tab displays variables as a bar chart. To the right of the graph is a table of the
numeric variables which can be displayed in the chart. Only variables selected in the table
are displayed in the chart.
The scale of the vertical axis is automatically adjusted according to values of the variables
displayed. The chart is updated at the polling interval.
Note - The polling interval can be changed in the Options tab.
When you resize the window, the chart is resized accordingly.
Topics:
•
•
•
•
•
Chart
MIB Variable Table
Select All Button
Clear Button
Reverse Button
Bar Chart tab
AlliedView™-EMS 3.11 Device Manager User’s Guide
Page 74 of 130
The components of the Bar Chart tab are discussed below.
6.3.1 Chart
In the left half of the window is the chart showing the values of the selected variables. The
vertical (Y) axis shows the values and the horizontal (X) axis shows the variable name or
number. You can select whether to display the name or the number in Option > Option >
Other.
Each variable is shown with a different color. The colors of the variables are displayed
between the chart and the variable table.
By placing the cursor on a bar, you can see the exact value of the variable.
6.3.2 MIB Variable Table
The right half of the window is the table of variables suitable for graph display. Each entry
has a checkbox. Only checked variables are shown on the chart.
Assume that you selected four variables to display. If one of the variables has a very large
value, for instance 1000000, and the other variables have much lower values, for instance
around 100, the vertical axis is automatically scaled to accommodate the largest variable. In
this situation, you can see the largest variable only because the scale of the vertical axis is
very large. To see the smaller variables, uncheck the largest variable temporarily.
Note - SNMPv3: Depending on the READ VIEW access settings of the User Account Name
used, there is a possibility that some MIB variables will not be displayed in this table.
6.3.3 Select All Button
: checks all variables. Clicking this button causes all variables to be plotted on the chart.
6.3.4 Clear Button
: unchecks all variables.
6.3.5 Reverse Button
: flips the states of all checkboxes, that is, unchecks all variables currently selected and
checks all variables currently not selected.
AlliedView™-EMS 3.11 Device Manager User’s Guide
Page 75 of 130
Note - Displaying many variables at the same time imposes a load on system resources. If
you encounter delay or reduced system performance, reduce the number of variables
displayed, or increase the polling interval. To reduce the number of variables, uncheck some
variables in the MIB variable table. To increase the polling interval, click the Options tab and
change the Polling Interval.
6 MIB Variable Window
AlliedView™-EMS 3.11 Device Manager User’s Guide
Page 76 of 130
6.4 Edit Tab
In the Edit tab, you can change the value of any variable with read-write access. All variables
are displayed in a table. For variables which can be changed, a checkbox is displayed in the
first column. To change a value, input or select a new value in the MIB Value column, check
the variable, then click the Set MIB Value button.
Topics:
•
•
•
•
•
•
•
•
•
Checkbox Column
MIB Variable Column
MIB Value Column
Select All Button
Clear Button
Reverse Button
Get MIB Value Button
Set MIB Value Button
Threshold Button
Edit tab
In the Edit tab, variables are shown in a table. The table has the following columns (fields)
for each entry.
AlliedView™-EMS 3.11 Device Manager User’s Guide
Page 77 of 130
6.4.1 Checkbox Column
The first (leftmost) column shows whether or not the variable can be changed (i.e. the
variable supports the SNMP Set operation). If a checkbox is displayed in the column, the
variable's value can be changed.
When you change several variables, set the new values in the Value column and then check
all corresponding boxes. Device Manager sends new values for selected variables in a batch.
6.4.2 MIB Variable Column
MIB variable names are displayed.
6.4.3 MIB Value Column
The value of the variable is displayed. If the variable has write access (and a checkbox is
displayed in the first column), this field is editable. To change the MIB value, change the
value and check the box and then click the Set MIB Value button. If the variable takes a
value from a fixed set of options, this field works as a pull down listbox. For such a variable,
clicking this field shows the listbox.
The value in this field is the one at the time when this tab is opened. The value in this
column is not updated automatically. If you want to see the latest value, use the Get MIB
Value button or switch to the Table tab.
Note - SNMPv3: Depending on the READ VIEW access settings of the User Account Name
used, there is a possibility that Device Manager may not be able to access some MIB values.
When this happens, the table will display a blank cell for those MIB values.
6.4.4 Select All Button
: checks all variables that can be changed.
6.4.5 Clear Button
: unchecks all variables that can be changed.
6.4.6 Reverse Button
: Flips the states of all checkboxes, that is, unchecks all variables currently checked, and
checks all variables currently not checked.
6.4.7 Get MIB Value Button
: Updates the MIB Value fields of the selected variables. To select a variable, click the MIB
Variable field of the target variable.
AlliedView™-EMS 3.11 Device Manager User’s Guide
Page 78 of 130
6.4.8 Set MIB Value Button
: Changes the values of the checked variables, using the SNMP Set operation. The values
in the MIB Value fields are sent to the SNMP agent on the device.
Note - SNMPv3: Depending on the WRITE VIEW access settings of the User Account Name
used, there is a possibility that Device Manager may not be able to set some MIB values.
When this happens, a "No access error." value will be displayed on the affected MIB Value
cells.
Note - SNMPv3: If the User Account Name does not have READ VIEW but has WRITE
VIEW access for a MIB variable, you may still set the value of that variable. However, the
new value will not be displayed on the affected MIB Variable cells.
Note - SNMPv3: Device Manager still allows the user to set values for the following
parameters even if the user has No Write access to these:
•
•
•
System Name
System Contact
System Location
The write attempt will eventually fail and the value, "No access error" will be displayed on
the value column for the said parameters. Additionally, the new values set will be displayed
on the Panel Window, but once the user refreshes the display, the values on the Panel
Window will be reset to the original values set on the device.
6.4.9 Threshold Button
: Set a threshold on the selected variable. The threshold is used to monitor the variable's
value. If the threshold is exceeded, the action configured on the Options menu is executed.
To select a variable, click the MIB Variable field of the target variable. When you click the
Threshold button, the Edit Threshold Item dialog box appears.
Edit Threshold Item dialog box
The MIB Variable field shows the selected variable name.
AlliedView™-EMS 3.11 Device Manager User’s Guide
Page 79 of 130
To set a threshold, enter a threshold value in the Value field, then click OK. Note that this
specifies a rising threshold which triggers an event when the variable's value increases to
exceed the threshold, i.e. crosses the threshold from below.
When the threshold is reached, a pop-up message is displayed or a predefined command is
executed. You can select which action is executed in the Option > Option > User Action
tab.
Note - Thresholds can only be used for variables of type GAUGE, INTEGER, COUNTER,
GAUGE32, INTEGER32, COUNTER32, or COUNTER64.
6 MIB Variable Window
AlliedView™-EMS 3.11 Device Manager User’s Guide
Page 80 of 130
6.5 Options Tab
In the Options tab, preferences specific to the MIB variable windows can be changed.
Topics:
•
•
•
•
•
•
Polling Interval
Display Data Type of Chart
Regist Menu
Save Polling Data
Start Snapshot
Default Button
Options tab
6.5.1 Polling Interval
Specifies the polling interval. The valid range is 5 seconds to 3600 seconds (1 hour).
However, a short polling interval may reduce system performance. Care must be taken to
set an appropriate value for your system.
6.5.2 Display Data Type of Chart
Specifies how to display data on graphs or charts. Select one of the following two options.
AlliedView™-EMS 3.11 Device Manager User’s Guide
Page 81 of 130
Absolute
Displays a value as it is.
Relative
Displays a change in the value per second. This is (Current value - Previous value) /
Polling Interval.
Note - The change here takes effect the next time the data is polled.
6.5.3 Regist Menu
Add this window to the User Menu. If you want to view the current window repeatedly, do
the following.
1. Click "Regist menu".
2. On "Regist Menu Item" dialog box, select one of "Common Menu" or "Target
Menu". Common Menu is always accessible regardless of the target device. Target
Menu can be accessed only when connected to the same specific device type.
3. Optionally, change the MenuItem Name. This string is displayed as the menu item
name.
4. Click OK.
6.5.4 Save Polling Data
Save the collected data to a file. When you click this button, the Polling Data Save dialog
box appears and lets you specify the name of the file and the file format. To start saving data,
click OK in the Save Polling Data dialog box. The Save polling data button changes to
"Saving polled data". To close the file and stop saving data, click this button again.
The file format can be selected from the following options:
CSV Format
Save data in comma-separated values (CSV) format.
TAB Format
Save data in Tab-separated values (TSV) format.
AlliedView™-EMS 3.11 Device Manager User’s Guide
Page 82 of 130
Save polling data
6.5.5 Start Snapshot
Clicking this button opens the Start Snapshot window. Use this window to save the
information displayed in the front panel, as well as tables or charts representing device
information. Use the 'Browse' button to select the directory or folder where you want to
save the image.
Note - You can generate an image of the main panel, table data, or charts. The type of image
or device information that you can generate depends on which menu you opened the Start
Snapshot window from. For more information on the file types created in the Start
Snapshot window, see section 5.2.6.
Start snapshot
Below is a snapshot from the MIB Variable window, with the main panel and table data both
marked in the Start Snapshot window:
AlliedView™-EMS 3.11 Device Manager User’s Guide
Page 83 of 130
MIB Variables snapshot
6.5.6 Default Button
: Reset all options to default settings.
6 MIB Variable Window
AlliedView™-EMS 3.11 Device Manager User’s Guide
Page 84 of 130
7 RMON
The RMON (Remote network MONitoring) facility collects management information from
remote monitoring agents. Monitoring agents are implemented as dedicated hardware
devices or are built into networking devices like switches.
With Device Manager, you can view management information retrieved from built-in
RMON agents on the Allied Telesis switches that support RMON. You can also configure
RMON agents to selectively collect information or set thresholds on variables to monitor
their value.
Note - The RMON menu is displayed only if the target device supports the RMON MIB.
Note - Device Manager supports the following RMON groups only: Statistics, History, Alarm
and Event.
Topics:
•
•
•
•
•
•
RMON-specific Buttons
Statistics
History Control Table
Alarm Table
Event Table
Event Log
7 RMON
AlliedView™-EMS 3.11 Device Manager User’s Guide
Page 85 of 130
7.1 RMON-specific Buttons
The RMON window is slightly different from the MIB variable windows. The RMON
window has several tabs and each tab has the following tool buttons in addition to the
buttons in the MIB variable windows.
Absolute Value
Displays collected data as they are.
Per Sample
Displays the difference between the last two sampled values. The value is rounded.
Per Second
Displays the difference between the last two sampled values per second. This is
(Current value - Previous value) / Polling Interval. The value is rounded.
Start Polling
Restarts polling.
Stop Polling
Pauses polling. This may be useful for examining current data carefully.
Refresh
Forces immediate polling and displays the latest sampled value regardless of the
regular polling timer.
7 RMON
AlliedView™-EMS 3.11 Device Manager User’s Guide
Page 86 of 130
7.2 Statistics
From the Statistics menu, you can view RMON Statistics information.
Topics:
•
•
•
•
•
•
•
•
Data Group Buttons
Management Information Area
Entry Tab
Table Tab
Plot Chart Tab
Pie Chart Tab
Options Tab
Close
RMON Statistics window
AlliedView™-EMS 3.11 Device Manager User’s Guide
Page 87 of 130
7.2.1 Data Group Buttons
In the RMON Statistics window, you can view various network statistics. Data is grouped
by the type of information. You can view each type of information by clicking a Data Group
button at the top of the window (just below the title bar).
Note - Data Group buttons change the data to be displayed. The tabs change the view of the
data, that is, how the data selected by the Data Group buttons is displayed.
The following Data Group buttons are available.
Utilization
Shows utilization as a percentage. This is calculated by Device Manager.
Packet Size
Shows the number of packets by their octet size.
• Size Under 64 Packets (calculated by Device Manager)
• Size 64 Packets
• Size 65-127 Packets
• Size 128-255 Packets
• Size 256-511 Packets
• Size 512-1023 Packets
• Size 1024-1518 Packets
• Size Over 1518 Packets (calculated by Device Manager)
Packet Type
Shows the number of packets for each of the following categories.
• Received Packets
• Unicast Packets (calculated by the Device Manager)
• Broadcast Packets
• Multicast Packets
Error Type
Shows the number of packets categorized by error types.
• Good Packets (calculated by Device Manager)
• Error Packets (calculated by Device Manager)
• Collision Packets
• CRC Alignment Error Packets
• Undersize Packets
• Oversize Packets
• Fragment Packets
• Jabber Packets
Custom
Shows all items plus Received Bytes but without Utilization.
AlliedView™-EMS 3.11 Device Manager User’s Guide
Page 88 of 130
Note - Items calculated by Device Manager always have the descriptive title (not the
variable name) because they have no related MIB variables.
7.2.2 Management Information Area
At the bottom of RMON Statistics window, the following information is always displayed.
PortX: yyy Mbps
X is the port number of the selected port. yyy is the speed of the port.
Polling Interval: yyy sec
yyy is the polling interval in seconds.
In Polling / Polling Stopped
Status of polling. "In Polling" or "Polling Stopped".
Absolute Value / Per Sample / Per Second
Indicates how data is displayed.
Index
Value of etherStatsIndex of the RMON Statistics group.
Data Source
Value of etherStatsDataSource of the RMON Statistics group.
Owner
Status
Value of etherStatsOwner of the RMON Statistics group.
Value of etherStatsStatus of the RMON Statistics group.
7.2.3 Entry Tab
In the Entry tab, you can select and control the table entry displayed. Data collected by the
selected entry is shown in the Table, Plot Chart and Pie Chart tabs. By default, the entry
with the lowest index number is selected. In this tab, you can also add, remove or edit the
entries.
Topics:
•
•
•
•
•
Available Control Table Entries
Select Button
Add Button
Edit Button
Remove Button
AlliedView™-EMS 3.11 Device Manager User’s Guide
Page 89 of 130
RMON Statistics Entry tab
7.2.3.1 Available Control Table Entries
This table shows all control table entries configured on the target RMON agent. Data
displayed in the RMON Statistics window is collected using the selected control table entry.
Here you can create a new entry, or change or delete an existing entry. By default, the
topmost entry is automatically selected.
The control table is not automatically updated. If you want to see the latest information,
click the Refresh button.
The table has the following columns.
Index
The index number used to identify this entry.
Data Source
The index of the RMON interface which collects statistics for the entry.
AlliedView™-EMS 3.11 Device Manager User’s Guide
Page 90 of 130
Status
Owner
The status of the control entry.
The owner (creator) of the control entry.
7.2.3.2 Select Button
: changes the control entry displayed in the Statistics window. To change an entry
displayed, select the entry in the table, then click the Select button. Data collected for the
selected entry is displayed on other tabs thereafter.
Note - When you edit the current entry, or when you add an entry with the same index
number after removing the current entry, make sure to select the entry again. Otherwise,
the changes will not take effect on the other tabs.
7.2.3.3 Add Button
: adds a new entry to the RMON Statistics control table. When you click this button, the
Add Control Table Entry dialog box appears. Enter the Index, the Data Source and the
Owner, then click OK to create an entry.
Add Control Table Entry dialog box
7.2.3.4 Edit Button
: changes the selected entry. To edit the entry, select an entry on the table then click the
Edit button. The Modify Control Table Entry dialog box appears. Change the required
parameters, then click OK. You can also open the dialog box by double-clicking the desired
entry.
AlliedView™-EMS 3.11 Device Manager User’s Guide
Page 91 of 130
7.2.3.5 Remove Button
: removes the selected entry from the table. Be careful in using this button because the
entry is deleted without any confirmation.
7.2.4 Table Tab
In the RMON Statistics Table tab, network statistics are shown in the table format. The
data is updated at the polling interval.
Topics:
•
•
Sort
Reset Table Button
RMON Statistics Table tab
AlliedView™-EMS 3.11 Device Manager User’s Guide
Page 92 of 130
7.2.4.1 Sort
To sort table items, click a column title. When you click the column title, table items are
sorted by the column in ascending order. One more click sorts the items in descending
order. To restore the original order, click the Reset Table button.
7.2.4.2 Reset Table Button
: Reorders table items after using sorting function.
7.2.5 Plot Chart Tab
In the Plot Chart tab, network statistics are shown in the time-scaled plotting graph. Data is
updated at the polling interval. The horizontal axis contains a maximum of the 40 latest
values.
Topics:
•
Popup Display
RMON Statistics Plot Chart tab
AlliedView™-EMS 3.11 Device Manager User’s Guide
Page 93 of 130
7.2.5.1 Popup Display
You can see the exact value of a plotted dot by moving the mouse cursor onto the dot. The
values are displayed in the form "(x, y)". where x indicates the time elapsed after the RMON
window is opened and y indicates the value of the data.
Below the graph's horizontal axis, time is displayed. Note that the times shown there are
only for your reference. They are not synchronized with the polling interval plotted dots.
7.2.6 Pie Chart Tab
In the Pie Chart tab, network statistics are shown in a pie chart. This chart is useful for
checking the proportions of the various packet counts. The data is updated at the polling
interval.
Note - The pie chart is not displayed when all data has the value zero.
Topics:
•
Popup Display
RMON Statistics 3-D Pie Chart tab
AlliedView™-EMS 3.11 Device Manager User’s Guide
Page 94 of 130
7.2.6.1 Popup Display
When you move the mouse cursor onto a section of the pie chart, the value of the data for
the selected area is displayed.
7.2.7 Options Tab
In the Options tab, you can customize the display options or edit the statistics data.
Topics:
•
•
•
•
•
Polling Interval
Display Data Type of Chart
Regist Menu
Save Polling Data
Start Snapshot
RMON Options tab (Statistics)
7.2.7.1 Polling Interval
You can change the polling interval here.
AlliedView™-EMS 3.11 Device Manager User’s Guide
Page 95 of 130
7.2.7.2 Display Data Type of Chart
Specifies how to display data on the graph or chart. You can select one from the following
options.
Absolute Value
Displays a value as it is.
Per Sample
Displays the change in the value between the two pollings. This is Current value Previous value.
Per Second
Displays the change in the value per second. This is (Current value - Previous value)
/ Polling Interval.
Note - Calculated values are rounded. For example, Number of Error packets is usually very
small so that calculated value is likely to be zero.
7.2.7.3 Regist Menu
Add this window to the user-defined menu (User Menu).
7.2.7.4 Save Polling Data
This button opens the Polling Data Save dialog box used to save collected data to a file.
Specify the name and format of the file in which the data is saved. Select a file format from
the options below. To start saving the data, click OK.
When you start saving data, the button's label changes to "Saving polled data". To close the
file and stop saving the data, click the "Saving polled data" button.
CSV Format
Save the data in comma-separated values (CSV) format.
TAB Format
Save the data in Tab-separated values (TSV) format.
Note - Only the values of the collected RMON variables are saved. Values Device Manager
calculates from these collected values are not saved.
7.2.7.5 Start Snapshot
Clicking this button opens the Start Snapshot window. Use this window to create an image
of the graph and tables in the RMON tab panel in HTML format. Use the 'Browse' button
to select the directory or folder where you want to save the image.
AlliedView™-EMS 3.11 Device Manager User’s Guide
Page 96 of 130
Note - You can generate an image of the main panel, table data, or charts. The type of image
or device information that you can generate depends on which menu you opened the Start
Snapshot window from. For more information on the file types created in the Start
Snapshot window, see section 5.2.6.
Start snapshot
AlliedView™-EMS 3.11 Device Manager User’s Guide
Page 97 of 130
Below is a snapshot from the RMON Statistics window, with the main panel and table data
marked in the Start Snapshot window:
RMON Statistics snapshot
AlliedView™-EMS 3.11 Device Manager User’s Guide
Page 98 of 130
7.2.8 Close
Closes the RMON Statistics window.
7 RMON
AlliedView™-EMS 3.11 Device Manager User’s Guide
Page 99 of 130
7.3 History Control Table
From the History Control Table menu, you can view RMON History information.
Note - If there is a large amount of history data, it takes Device Manager a long time to
retrieve this data when you open the History Control Table window. If the message "Please
wait for a while" is displayed for a long time, decrease the "Request Bucket" value in the
Entry tab of the History Control Table window.
Topics:
•
•
•
•
•
•
•
•
Data Group Buttons
Management Information Area
Entry Tab
Table Tab
Plot Chart Tab
Pie Chart Tab
Options Tab
Close
AlliedView™-EMS 3.11 Device Manager User’s Guide
Page 100 of 130
RMON History Control Table window
7.3.1 Data Group Buttons
At the RMON History Control Table window, you can view the history of various network
statistics. Data is grouped by the type of information. You can view each type of information
by clicking a Data Group button at the top of the window (just below the title bar).
Note - Data Group buttons change the data to be displayed. The tabs change the view of the
data, that is, how Device Manager displays the data selected by the Data Group buttons.
The following buttons are available.
Utilization
Shows utilization as a percentage, calculated by Device Manager.
AlliedView™-EMS 3.11 Device Manager User’s Guide
Page 101 of 130
Packet Type
Shows the number of packets by the following types.
• Received Packets
• Unicast Packets (calculated by Device Manager)
• Broadcast Packets
• Multicast Packets
Error Type
Shows the number of packets categorized by error types.
• Good Packets (calculated by Device Manager)
• Error Packets (calculated by Device Manager)
• Collision Packets
• CRC Alignment Error Packets
• Undersize Packets
• Oversize Packets
• Fragment Packets
• Jabber Packets
Custom
Shows all items plus Received Bytes but without Utilization.
Note - Items calculated by Device Manager always have the descriptive title (not a
variable name) because they have no related MIB variables.
7.3.2 Management Information Area
At the bottom of the RMON History window, the following information is always displayed.
PortX: yyy Mbps
X is the port number of the selected port. yyy is the speed of the port.
Polling Interval: yyy sec
yyy is the polling interval in seconds.
In Polling / Polling Stopped
Status of the polling. "In Polling" or "Polling Stopped".
Absolute Value / Per Sample / Per Second
Indicates how the data is displayed.
Index
Value of etherStatsIndex of the RMON Statistics group.
Data Source
Value of etherStatsDataSource of the RMON Statistics group.
AlliedView™-EMS 3.11 Device Manager User’s Guide
Page 102 of 130
Owner
Status
Value of etherStatsOwner of the RMON Statistics group.
Value of etherStatsStatus of the RMON Statistics group.
7.3.3 Entry Tab
In the Entry tab, you can select a control table entry to view. Data collected by the selected
entry is shown on the Table, Plot Chart and Pie Chart tabs. By default, the entry with the
lowest index number is selected. On this tab, you can also add, remove or edit entries.
Topics:
•
•
•
•
•
Available Control Table Entries
Select Button
Add Button
Edit Button
Remove Button
RMON History Entry tab
AlliedView™-EMS 3.11 Device Manager User’s Guide
Page 103 of 130
7.3.3.1 Available Control Table Entries
This table shows all control table entries configured on the target RMON agent. Data
displayed in the RMON History window is collected using the selected control table entry.
Here you can create a new entry, or modify or remove an existing entry. By default, the
topmost entry is automatically selected.
The Control table is not automatically updated. To see the latest information, click the
Refresh button.
The table has the following columns:
Index
The index number used to identify this entry.
Data Source
The index of the RMON interface which collects history samples for the entry.
Request Buckets
The number of values which you asked the RMON agent to store.
Granted Buckets
The number of values the RMON agent allows you to store.
Sampling Interval
The time interval at which the RMON agent collects data.
Status
Owner
The status of the control entry.
The owner (creator) of the control entry.
7.3.3.2 Select Button
: changes the control entry displayed in the History window. To change the control entry
displayed, select an entry in the table, then click the Select button. Data collected by the
selected entry is displayed on other tabs thereafter.
Note - To display changes to the current entry, or to display a new entry with the same
index number as a previously removed entry, be sure to select the current entry.
Otherwise, the changes will not take effect on the other tabs.
AlliedView™-EMS 3.11 Device Manager User’s Guide
Page 104 of 130
7.3.3.3 Add Button
: adds a new entry to the RMON History control table. When you click this button, the
Add Control Table Entry dialog box appears. Enter the following parameters, then click OK
to create an entry.
Index
The index number used to identify this entry.
Data Source
The index of the interface on which the RMON agent collects data.
Request Buckets
The number of values which you want the RMON agent to store.
Sampling Interval
The interval at which the RMON agent retrieves data.
Owner
The creator (owner) of this entry.
Add Control Table Entry dialog box
7.3.3.4 Edit Button
: changes the selected entry. To edit the entry, select an entry on the table then click the
Edit button. The Modify Control Table Entry dialog box appears. Change the settings, then
click OK. You can also open this dialog box by double-clicking the desired entry.
AlliedView™-EMS 3.11 Device Manager User’s Guide
Page 105 of 130
7.3.3.5 Remove Button
: removes the selected entry on the table. Be careful in using this button because the
entry is deleted without any confirmation.
7.3.4 Table Tab
In the RMON History Table tab, RMON history information is displayed in table format.
The data is updated at the polling interval.
Topics:
•
•
•
History Table
Sort
Reset Table Button
RMON History Table tab
AlliedView™-EMS 3.11 Device Manager User’s Guide
Page 106 of 130
7.3.4.1 History Table
The table shows history data for the selected control table entry. The table has the
following columns:
Max Value
Shows the highest value of each variable after the current history control entry is
selected at the Entry tab.
Min Value
Shows the lowest value of each variable after the current history control entry is
selected at the Entry tab.
Average Value
Shows the average value of each variable after the current history control entry is
selected at the Entry tab.
XXXXXX
Sample Index. A maximum of the 40 latest index numbers are displayed.
7.3.4.2 Sort
To sort table items, click a column title. When you click the column title, table items are
sorted by the column in ascending order. One more click sorts the items in descending
order. To restore the original order, click the Reset Table button.
7.3.4.3 Reset Table Button
: Reorders table items to their original order after sorting.
7.3.5 Plot Chart Tab
In the RMON History Plot Chart tab, RMON history information is displayed in a timescaled plotted graph. Data is updated at the polling interval. The horizontal axis holds a
maximum of the 40 latest data values.
Topics:
•
Popup Display
AlliedView™-EMS 3.11 Device Manager User’s Guide
Page 107 of 130
RMON History Plot Chart tab
7.3.5.1 Popup Display
You can see the exact value of a dot by moving the mouse cursor onto the dot. The values
are displayed in the form of "(x, y)". where x indicates the elapsed time (sysUpTime seconds)
and y indicates the value of the data.
Below the graph's horizontal axis, time is displayed. Note that the times shown there are
only a reference point. They are not synchronized with the plotted dots.
7.3.6 Pie Chart Tab
In the Pie Chart tab, network statistics are shown in the pie chart. This chart is useful for
checking the proportions of the various packet counts. The data is updated after each
polling interval.
Note - The pie chart is not displayed when all values are zero.
AlliedView™-EMS 3.11 Device Manager User’s Guide
Page 108 of 130
Topics:
•
Popup Display
RMON History Pie Chart tab
7.3.6.1 Popup Display
To display the numeric value for a particular section of the pie chart, move the mouse
cursor onto that section.
7.3.7 Options Tab
In the Options tab, you can customize the options for viewing and editing the RMON
history data.
AlliedView™-EMS 3.11 Device Manager User’s Guide
Page 109 of 130
Topics:
•
•
•
•
•
Polling Interval
Display Data Type of Chart
Regist Menu
Save Polling Data
Start Snapshot
RMON Options tab (History Control Parameters)
7.3.7.1 Polling Interval
You can change the polling interval here.
7.3.7.2 Display data type of chart
Specifies how to display data in graphs and charts. You can select one of the following
options.
Because RMON histories are collected by RMON agents and Device Manager only displays
the collected data, settings here are slightly different from other windows. The Polling
Interval here is simply the interval at which Device Manager gets collected data from
RMON agents.
AlliedView™-EMS 3.11 Device Manager User’s Guide
Page 110 of 130
Absolute Value
Displays the sum of values which Device Manager got from the RMON agents, as
shown in the following example.
Data sampled by RMON Data displayed by Device Manager
Sample 1
100
100
Sample 2
50
150
Sample 3
250
400
Per Sample
Displays data which Device Manager got from the RMON agent as it is.
Data sampled by RMON Data displayed by Device Manager
Sample 1
100
100
Sample 2
50
50
Sample 3
250
250
Per Second
Displays "Sampled data / Sampling Interval configured on the RMON agent". The
sampling interval here is the RMON agent's sampling interval, not the interval
configured in Device Manager. In the following example, the RMON agent's sampling
interval is 10 seconds.
Note - Calculated values are rounded. For example, the Number of Error packets is
usually very small so that the calculated value is likely to be zero.
Data sampled by RMON Data displayed by Device Manager
Sample 1
100
10 (100 / 10)
Sample 2
50
5 (50 / 10)
Sample 3
250
25 (250 / 10)
7.3.7.3 Regist Menu
Add this window to the user-defined User Menu.
7.3.7.4 Save Polling Data
This button opens the Polling Data Save dialog box, used to save collected data to a file.
Specify the name and format of the file in which the data is to be saved. Select a file format
from the options below. To start saving the data, click OK.
When you start saving data, the button's label changes to "Saving polled data". To close the
file and stop saving the data, click the "Saving polled data" button.
CSV Format
Saves the data in comma-separated values (CSV) format.
TAB Format
Saves the data in tab-separated values (TSV) format.
AlliedView™-EMS 3.11 Device Manager User’s Guide
Page 111 of 130
Note - Only the values of the collected RMON variables are saved. Values Device Manager
calculates from these collected values are not saved.
7.3.7.5 Start Snapshot
Clicking this button opens the Start Snapshot window. Use this window to create an image
of the device, as well as tables or charts representing device information, in HTML format.
Use the 'Browse' button to select the directory or folder where you want to save the image.
Note - You can generate an image of the main panel, table data, or charts. The type of image
or device information that you can generate depends on which menu you opened the Start
Snapshot window from. For more information on the file types created in the Start
Snapshot window, see section 5.2.6.
Start snapshot
AlliedView™-EMS 3.11 Device Manager User’s Guide
Page 112 of 130
Below is a snapshot from the RMON History Control Parameters window, with the main
panel and table data marked in the Start Snapshot window:
RMON History Control Parameters snapshot
AlliedView™-EMS 3.11 Device Manager User’s Guide
Page 113 of 130
7.3.8 Close
Closes the RMON History window.
7 RMON
AlliedView™-EMS 3.11 Device Manager User’s Guide
Page 114 of 130
7.4 Alarm Table
From the Alarm Table menu, you can view and edit the RMON Alarm table on the RMON
agent. RMON Alarm table is used to monitor a specific variable by setting a threshold on
the variable and by specifying an event action to be taken if the threshold is reached.
The Alarm Table is not automatically updated. To see the latest information, click the
Refresh button.
Topics:
•
•
•
•
•
•
Alarm Table Tab
Event Table of Alarm
Add Button
Edit Button
Remove Button
Close
RMON Alarm Table tab
7.4.1 Alarm Table Tab
The Alarm Table shows the list of currently defined alarm entries.
Index
The index number used to identify this alarm entry.
Sampling Interval
AlliedView™-EMS 3.11 Device Manager User’s Guide
Page 115 of 130
The time interval at which the RMON agent samples data.
Sampling MIB Variable Name
MIB variable to be monitored. The object type must be one of INTEGER,
COUNTER, GAUGE and TIMETICKS.
Sampling Type
How to compare the sampled value with the threshold. "absolute value" means
comparing the sampled data with the threshold without modification. "delta value"
means comparing the difference between the latest sampled value and the previous
sampled value with the threshold.
Sampling Value
The last sampled value.
Startup Alarm Type
The type of threshold which is applied to the first sampled value after this Alarm
entry becomes valid.
rising alarm
A single RMON event is triggered if the first sampled value is greater than or equal
to the configured rising threshold.
falling alarm
A single RMON event is triggered if the first sampled value is less than or equal to
the configured falling threshold.
rising or falling alarm
A single RMON event is triggered if the first sampled value is greater than or equal
to the configured rising threshold, or if the first sampled value is less than or equal
to the configured falling threshold.
Rising Threshold
The ceiling threshold.
Falling Threshold
The floor threshold.
Rising Event Index
The index of the RMON Event entry which is triggered when the sampled value
rises above the rising threshold.
Falling Event Index
The index of the RMON Event entry which is triggered when the sampled value falls
below the falling threshold.
AlliedView™-EMS 3.11 Device Manager User’s Guide
Page 116 of 130
7.4.2 Event Table of Alarm
"Event Table of Alarm" shows a list of events for the Alarm entry which is selected in the
Alarm Table. You can check which type of events are configured for a specific alarm entry.
Index
The index number used to identify the Event entry.
Event Description
Text describing the Event entry.
Event Type
The type of action to be taken if the event occurs. Select one of "none" (no action
taken), "SNMP trap" (send out an SNMP trap), "log" (record to the log) and "log &
SNMP trap" (record to the log and send out an SNMP trap).
TRAP Community
Trap Community name.
Last Sent Event Time
The value of sysUpTime at the time when the last event occured.
Status
Owner
The status of the Event entry.
The owner (creator) of the Event entry.
7.4.3 Add Button
: adds a new entry to the table. Click this button to open the Add Alarm Table Entry
dialog box, enter parameters for the Alarm Table entry, and click OK to add the new entry.
Note - If you specify an SNMP trap action, trap hosts must be configured in the RMON
agent. Trap hosts cannot be configured by Device Manager. Use other means, such as a
console terminal, Telnet or Web interface to set up SNMP trap hosts on the agent.
Note - If you configure the station running Device Manager as the trap host, use the same
Trap community name configured in the Target Host Property dialog box (File >
Properties).
AlliedView™-EMS 3.11 Device Manager User’s Guide
Page 117 of 130
Add Alarm Table Entry dialog box
Alarm
Index
The index number used to identify this Alarm entry. By default, the lowest unused
number is automatically displayed. If you explicitly specify a number currently in use,
that entry will be overridden.
Sampling Interval
The sampling interval in seconds.
Sampling MIB Variable Name
Type or select the name of the MIB variable to be sampled.
Sampling Type
How the sampled value is compared with the threshold. "absolute value" compares
the sampled data with the threshold without modification. "delta value" compares
the difference between the latest sampled value and the previous sampled value with
the threshold.
AlliedView™-EMS 3.11 Device Manager User’s Guide
Page 118 of 130
Owner
The owner (creator) of the Alarm entry. By default, "AlliedView-EMS Device
Manager - station name" is used where "station name" represents the host name of
the station on which Device Manager is running.
Startup Alarm Type
The type of threshold which is applied to the first sampled value after this Alarm
entry becomes valid.
rising alarm
A single RMON event is triggered if the first sampled value is greater than or equal
to the configured rising threshold.
falling alarm
A single RMON event is triggered if the first sampled value is less than or equal to
the configured falling threshold.
\
rising or falling alarm
A single RMON event is triggered if the first sampled value is greater than or equal
to the configured rising threshold, or if the first sampled value is less than or equal
to the configured falling threshold.
Note - The Startup Alarm Type is only applied to the first sampled value. From the
second sampled value, both the rising and falling thresholds are effective regardless
of the Startup Alarm Type. If only one type of threshold is significant, set the "Event
Index" for the Alarm type that is not required to 0. For example, if you want to
monitor only the rising threshold, set the Falling Event Index to 0. No event occurs
for an Event Index of 0, even if the values reach the threshold.
Rising Alarm Event Rule
Configuration for the rising alarm. If you select "falling alarm" for the Startup Alarm
Type, only "Rising Threshold" and "Rising Event Index" can be configured. If there is
no Event entry corresponding to the Event Index, no event will occur.
Rising Threshold
The ceiling threshold. If the monitored variable exceeds this threshold, the rising
alarm is invoked. The default is 3000.
Event Type
The type of action to be taken when the event occurs. Select one of "none" (no
action taken), "SNMP trap" (send out an SNMP trap), "log" (record to the log) and
"log & SNMP trap" (record to the log and send out an SNMP trap).
Rising Event Index
Index of the RMON Event entry which is triggered when the sampled value reaches
the rising threshold. If you select "falling alarm" for the Start Alarm Type, this
defaults to zero. Because an Event Index of 0 is invalid and there is no event related
to Index 0, no event will occur even if the rising alarm is triggered.
AlliedView™-EMS 3.11 Device Manager User’s Guide
Page 119 of 130
TRAP Community
Trap Community name.
Event Description
Text string describing the event. By default, "Rising Event for Alarm#idx" is used
where "idx" represents the Alarm index number.
Falling Alarm Event Rule
Configuration for the falling alarm. If you select "rising alarm" for the Startup Alarm
Type, only "Falling Threshold" and "Falling Event Index" can be configured. If there is
no Event entry corresponding to the Event Index, no event will occur.
Falling Threshold
The floor threshold. If the monitored variable falls below this threshold, a falling
alarm event occurs. The default is 2000.
Event Type
The type of action to be taken when the event occurs. Select one of "none" (no
action taken), "SNMP trap" (send an SNMP trap), "log" (record to the log) and "log &
SNMP trap" (record to the log and send an SNMP trap).
Falling Event Index
The index of the RMON Event entry which is triggered when the sampled value falls
below the falling threshold. If you select "rising alarm" for the Start Alarm Type, this
defaults to zero. Because an Event Index of 0 is invalid and there is no event related
to Index 0, no event will occur even if falling alarm is triggered.
TRAP Community
Trap Community name.
Event Description
Text string describing the event. By default, "Falling Event for Alarm#idx" is used
where "idx" represents the Alarm index number.
7.4.4 Edit Button
: edits the selected Alarm entry. Click this button to open a dialog box, specify options,
then click OK. You can also open this dialog box by double-clicking the entry.
7.4.5 Remove Button
: removes the selected Alarm entry.
7.4.6 Close
Closes the window.
7 RMON
AlliedView™-EMS 3.11 Device Manager User’s Guide
Page 120 of 130
7.5 Event Table
From the Event Table menu, you can view and edit the RMON Event entries. The data is
not automatically updated. Use the Refresh button to view the latest information.
Topics:
•
•
•
•
•
•
Event Table Tab
Select Button
Add Button
Edit Button
Remove Button
Close
RMON Event Table window
7.5.1 Event Table Tab
The Event Table shows the list of all currently configured Event entries.
Index
The index number used to identify the Event.
AlliedView™-EMS 3.11 Device Manager User’s Guide
Page 121 of 130
Event Description
Text describing the Event entry.
Event Type
The type of action to be taken when the event occurs. Select one of "none" (no
action taken), "SNMP trap" (send an SNMP trap), "log" (record to the log) and "log &
SNMP trap" (record to the log and send an SNMP trap).
TRAP Community
The Trap Community name.
Last Sent Event Time
The value of sysUpTime at the time when the last event occured.
7.5.2 Select Button
: selects an Event entry to be displayed in the Event Log tab. In the Event Log tab, only
log entries related to the selected Event Index are displayed.
7.5.3 Add Button
: creates a new Event entry. Click this button to open a dialog box for a new entry.
Specify options, then click OK to add the new entry to the table.
Add Event Table Entry dialog box
AlliedView™-EMS 3.11 Device Manager User’s Guide
Page 122 of 130
7.5.4 Edit Button
: edits the selected Event entry. Click this button to open the Edit dialog box for the
selected entry. Change the configuration, then click OK to modify the entry. You can also
open this dialog box by double-clicking the entry.
7.5.5 Remove Button
: removes the selected Event entry.
7.5.6 Close
Closes the Event Table window.
7 RMON
AlliedView™-EMS 3.11 Device Manager User’s Guide
Page 123 of 130
7.6 Event Log
From the Event Log menu, you can view and remove RMON event log entries. Log entries
displayed on the screen are not automatically updated. To view the latest log entries, click
the Refresh button.
Topics:
•
•
•
•
•
•
•
Log List of All Events
Event Log Entry
Remove All Button
Remove Button
Display All Button
Refresh Button
Close
RMON Event Log tab
7.6.1 Log List of All Events
This table shows a list of all log events which occurred.
AlliedView™-EMS 3.11 Device Manager User’s Guide
Page 124 of 130
Event Index
The index number of the Event table for this log entry.
Index
The index number used to identify this log entry.
Log Time
The time when this log entry was recorded.
Log Description
Text describing the log entry.
7.6.2 Event Log Entry
By double-clicking the log entry, the following Event Log Entry dialog box appears.
Event Log Entry dialog box
7.6.3 Remove All Button
: clears all log entries.
7.6.4 Remove Button
: clears log entries that have the selected Event Index. You can select any one of the
entries which have the same Event Index number.
7.6.5 Display All Button
: displays all event log entries. It may take some time to display all entries.
AlliedView™-EMS 3.11 Device Manager User’s Guide
Page 125 of 130
7.6.6 Refresh Button
: displays the latest log table. The log entries are not automatically updated.
7.6.7 Close
Closes the Event Log window.
7 RMON
AlliedView™-EMS 3.11 Device Manager User’s Guide
Page 126 of 130
8 Forwarding Database
The Forwarding Database option under the Bridge menu allows you to view the FDB
(Forwarding Database) Table containing unicast entries for which the bridge has forwarding
and/or filtering information. AlliedView-EMS provides two ways of viewing the FDB Table:
Standard View and Enhanced View.
Topics:
•
•
Standard View
Enhanced View
8 Forwarding Database
AlliedView™-EMS 3.11 Device Manager User’s Guide
Page 127 of 130
8.1 Standard View
The Standard View allows you to view the FDB Table as returned by the device. This is the
default view that is available across all devices that support transparent bridging.
Standard View
8 Forwarding Database
AlliedView™-EMS 3.11 Device Manager User’s Guide
Page 128 of 130
8.2 Enhanced View
The Enhanced View allows you to select a port or group of ports to view its corresponding
FDB Table entries. It also displays the total number of FDB Table entries associated with
the selected ports. This view is available only for selected devices with at least 16 ports.
Enhanced View
FDB Table entries are initially sorted in ascending order based on the Port Number field.
To sort based on a different field, click on the column heading of the desired field. Clicking
on the same column heading repeatedly will cause the table to sort alternately in ascending
and descending order.
8 Forwarding Database
AlliedView™-EMS 3.11 Device Manager User’s Guide
Page 129 of 130
© 1998-2008 Allied Telesis K. K.
All rights reserved. No part of this publication may be reproduced without prior written permission from
Allied Telesis, K. K.
Microsoft is a registered trademark of Microsoft Corporation. Netscape Navigator is a registered trademark
of Netscape Communications Corporation. All other product names, company names, logos or other
designations mentioned herein are trademarks or registered trademarks of their respective owners.
Allied Telesis K. K. reserves the right to make changes in specifications and other information contained in this
document without prior written notice. The information provided herein is subject to change without
notice. In no event shall Allied Telesis K. K. be liable for any incidental, special, indirect, or consequential
damages whatsoever, including but not limited to lost profits, arising out of or related to this manual or the
information contained herein, even if Allied Telesis K. K. has been advised of, known, or should have known,
the possibility of such damages.
613-000203 Rev F
USA Headquarters | 19800 North Creek Parkway | Suite 200 | Bothell | WA 98011 | USA | T: +1 800 424 4284 | F: +1 425 481 3895
European Headquarters | Via Motta 24 | 6830 Chiasso | Switzerland | T: +41 91 69769.00 | F: +41 91 69769.11
Asia-Pacific Headquarters | 11 Tai Seng Link | Singapore | 534182 | T: +65 6383 3832 | F: +65 6383 3830
www.alliedtelesis.com