1
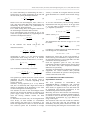
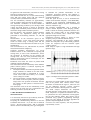
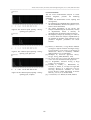
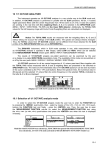
Annals of the University of Craiova, Electrical Engineering series, No. 34, 2010; ISSN 1842-4805 ____________________________________________________________ THE OFF-LINE DIAGNOSIS OF CIRCUIT BREAKERS WITH THE TIME DOMAIN AND FREQUENCY VIBRATION ANALYSIS Horia BALAN1, Aurel BOTEZAN1, Mircea BUZDUGAN1, Elena STEFAN1, Gabriel PIRV1, Petros KARAISSAS2 1 Technical University of Cluj Napoca, e-mail: [email protected] 2 T.E.I of Piraeus, Greece, email: [email protected]. Abstract - This paper presents a methodology for determining the operation time at opening and closing of the circuit breakers, using multi-channel sound and vibration analyzers. All the tests on the circuit breaker are made according the prescriptions of normative [3]. It is noteworthy that all tests prescribed by normative [3] are based on preventive diagnosis. This paper approaches the issue of predictive diagnosis of circuit breakers by proposing an original method of comparing the "witness pattern" to "actual pattern" by the Dynamic Time Warping algorithm (DTW). This algorithm is developed by the Megger Company from Sweden and use FFT frequency analysis and time domain analysis. To determine the speed and time of closing-opening for circuit breakers, the authors used sound and vibration analyzer Svan 958, which has triaxial accelerometers for vibration measurements, and offers the opportunity to make independent measurements on three phase. Using the multi-channel analyzer in diagnosis of circuit breakers, have the following advantages: enable the opening and closing times determining; by comparing the amplitude-time characteristics can be determined the non simultaneity of phases L1, L2 and L3; the setting possibilities of the SVAN 958 analyzer to determine acceleration, velocity or displacement, allow dynamic behavior analyzing; the frequency analysis by selecting 1/1 octave or 1/3 octave allows the analysis simplification by the method of Dynamic Time Warping in the predictive diagnosis procedures of circuit breakers. Keywords: dynamic time warping predictive diagnosis, circuit breakers diagnosis. 1. INTRODUCTION diagnosis, by developing of DIACOM diagnosis set, which performs on circuit breakers the contact resistance variation testing, the current variation rate fluctuations in the drive coil and mobile contact displacement depending on time. The Electric Equipments Laboratory from Technical University of Cluj-Napoca, in order to offer services and researches for solving the off-line diagnosis problem of circuit breakers, targeted to purchase the following equipment: x Equipment PME 100 for measuring contact resistance, producer EUROSMC – Spain; x Equipment PME 500 for measuring the simultaneity of contact closing of the circuit breakers, producer EUROSMC – Spain; x Sound and vibration Analyzer Svan 958 to determine the speed and driving time, producer SVANTEK - Poland. 2. THEORETICAL CONSIDERATIONS Literature [2] provides graphic-analytical solutions for determining the operating time and current variation in time during the closing or opening of the circuit breaker contacts. For example, for the circuit breakers the drive device is equipped with DC electromagnet, in which case for the electromagnet mobile armature displacement calculation is necessary to take into account the variation of inductance with respect to time: U The continuity of power supply requires the electric energy transport operator (Transelectrica) and distribution operator (Electrica), to take measures for ensuring the electrical reliability of the national energy system equipments. If we mean switching equipments, we can say that the best solution is more reliable monitoring equipments, but if we consider the price/quality ratio, we found that diagnosis is an acceptable solution. Currently, it tends to use predictive maintenance equipment in equipments Diagnosis instead of using preventive maintenance. On national plan can be mentioned the ICEMENERG concerns [1] to off-line 113 R i d) t dt R i L di dL i dt dt (1) For fixed armature dL / dt 0 and for moving armature dL / dt has a finite value. While moving armature is driving, appear eddy currents and hysteresis phenomenon, but if we make abstraction of these phenomena, the current through the coil at zero speed ( dL / dt 0 ) is: i R t · U§ ¨1 e L ¸ R© ¹ (2) Moving armature starts to move when the active force Fa is equal to the opposite force Fr: Fa c i12 Fr (3) Annals of the University of Craiova, Electrical Engineering series, No. 34, 2010; ISSN 1842-4805 ____________________________________________________________ an useful relationship for determining the time t1, elapsed since the voltage application on the coil and the start of the journey for mobile armature: L U ln R U R Fr / c t1 (4) Massive iron core electromagnets, have a time t1 to start a few times higher than those determined by the relationship above, because the phenomenon of electromagnetic field penetration. For a small starting time, the magnetic material for the electromagnet should be made of sheets. In an electromagnet with the initial air gap į0, the value of its proper inductance, by neglecting the iron reluctance and dispersion field is: N 2 A P0 L0 (5) G0 ³ (F Fr ) 'G t G 0 ³ v dW N 2 A P0 G0 l (6) v1 (7) v § · ¨ G 0 ³ v dW ¸ 0 © ¹ t 2 case in which the relationship (1) becomes: U R i N 2 A P0 di v N 2 A P0 i 2 t dt § · G 0 ³ v dW ¨ G 0 ³ v dW ¸ 0 0 © ¹ t 2 (F Fr ) (G G 0 ) m (11) (8) The equation (8) solution shows the current variation depending on time with the moving speed as parameter, which is a function depending of the current of the coil. Therefore, solving equation (8) is a very difficult task, but it is noteworthy that a high value of rate of change of inductance dL/dt, determines a low value of current through the electromagnet coil. The duration of action of the electromagnet means that the time between the moment of switching on of power supply circuit of the coil and the moment when the moving armature reaches the fixed armature. To determine the action time, on the magnetization curve ĭ=f(i), we shall consider n-1 intermediate points between the initial gap į0 and final įn, for which the magnetization curves are traced. Between two successive points can be defined an average 114 'G vm 2 G 0 G1 (12) v1 Considering a similar approach for other intervals the total driving time ǻt is determined: 't relationship in which l it is the moving armature displacement made during the time t, at constant speed v and the variation of inductance L, is written: N 2 A P0 (10) and the velocity v1 is 't1 0 dL dt m v12 2 (F Fr ) (G 0 G1 ) inductance becomes: N 2 A P0 (9) As we have stated before, for the moving armature displacement from the gap value į0 to the gap value į1, we may admit a constant average velocity vm = v1/2. Equation (9) becomes: the 0 L ª m v2 º '« » ¬ 2 ¼ The displacement time from the air-gap į0 to į1 can be written: t If the armature has moved with v dW velocity vm constant. If we neglect frictions, the work which determines the variation of the kinetic energy is: 't1 't 2 't n (13) Reducing the action time of the circuit breakers is achieved using iron laminations as magnetic circuits for the mobile armature, a low weight and a low time constant for the moving armature. From the applicative point of view, the above relationships intended to determine the closing speed and the action time, offer complicated solutions, difficult to use practically. Therefore, the manufacturers of diagnosis and testing equipments for circuit breakers offer practical solutions to determine the speed of closing-opening contacts and of the action time. 3. CONDITIONS FOR THE SWITCHING EQUIPMENT TESTING The tests performed in ELECTRICA and TRANSELECTRICA installations and electrical equipments are made according to the norms [3]. These norms are applied to the tests and check-outs of equipments and electrical installations, at the commissioning moment and in operation. Measuring the action time and the non simultaneity of closing and contacts separation of different phases or contacts in series of the same phase is performed with electronic second-meter (e.g. type MINUT) or using oscilloscopes. The measured value must not exceed the reference value by more than 10% and the maximum non simultaneity between phases should not exceed 5ms between opening and closing for circuit breakers used Annals of the University of Craiova, Electrical Engineering series, No. 34, 2010; ISSN 1842-4805 ____________________________________________________________ for generators and transformers, and 10ms in closing and 5ms in opening for line switches. The moment for the tests are: CT (the commissioning time), RR (the routine repair) TR (the technical revision) and AI (accidental intervention). The non simultaneity moments are approximately 3ms for medium voltage and 5ms for high voltage. The functional verification of circuit breakers to closing and opening are done by five driving at rated voltage and rated pressure, 5 driving at minimum voltage and/or minimum pressure and five driving at maximum voltage and/or maximum pressure. We must obtain a safe operation, without incidents and without any adjustments during the tests performed at the following moments: CT, TR and after AI. Measurements of the movement speed of the movable contacts, of the total stroke and contact stroke are made using a running drum and the measured values must fall within the limits set by the manufacturer. The test moments are CT, TR and after AI, and the measurement become compulsory. Checking kinematic characteristics for circuit breakers consists in the verification of opening and closing times, as well as non simultaneities, and to the separators in checking out the opening and closing times. The tests were performed using the MINUT second meter and an oscilloscope; the test moments are CT and TR. Parameters must meet the values of product STR (Domain Technical Standard). The measurement of non simultaneity of the different phases contacts phases is achieved respecting the following prescriptions: x The input terminals are linked in parallel and the output terminals are linked in the same mode. The circuit breaker is interpolated in a series circuit with a bulb and a battery or a rectified source voltage to 12VDC. x The circuit breaker is closed manually to achieve the contact on the first phase (when the ignition lamp) and in this position the distance between the contacts of other phases is measured with a feller gauge. The maximum value of the non simultaneity of the contacts must be 1mm; the test is performed in the following situations: R, RR, TR and AI. 4. THE PROBLEM OF PREDICTIVE MAINTENANCE It is noteworthy that all tests prescribed by norm PE116 are based on prophylactic diagnosis. Excepting the commissioning moment CT and the accidental intervention - AI, in the case of technical review - TR and routine repairs - RR is noticeable that the current trend offered by this type of diagnosis 115 to abandon the planned maintenance in the regulations prescribed intervals and adopting a predictive maintenance has a lot of technical and economic advantages. From this point of view, it can be mentioned the conduit of the Swedish company - (now MEGGER), embedded in the equipments TM1600/MA61 and TM1800 "Breaker Analyzer System" with dedicated software "CabaWin" [4]. The Company PROGRAMA uses a method of analysis named Dynamic Time Warping (DTW). DTW is based on checking similarities between two signals, one "witness mark" at the commissioning moment of the breaker, and a "mark time" when appropriate diagnosis are made. Comparison between signals is based on FFT frequency analysis and time domain analysis. Frequency and amplitude of the signal “moment pattern" are analyzed at every millisecond [5] and the results are compared with the reference signal "witness pattern”. DTW analysis requires a high bandwidth and high dynamic range. Figure 1: Example of circuit breaker pattern in which no changes appear. The errors in a circuit breaker go first to deviations in time of the pattern from "witness mark". These deviations are illustrated in Figure 2, where one can see the difference between “witness vibration pattern" and “moment vibration pattern" of 10ms. The DTW analysis determines the amplitude deviation between "witness mark" and "time mark". DTW compresses or expands the nonlinear time axis to synchronize the same phenomena oscillo-graphs: the test and reference model. This process can be performed using dynamic programming technique, which was first applied to the DTW algorithm for dynamic-temporal alignment of words. It involves two time sequences, with the parameters represented by vectors: Annals of the University of Craiova, Electrical Engineering series, No. 34, 2010; ISSN 1842-4805 ____________________________________________________________ A a1 , a 2 ,......a i ; B b1 , b 2 ,.....b j , (14) need to be compared. Generally, the actual number of points assessed is much smaller for two reasons: x In the field [1,I] x [1,J], only the area around the diagonal is relevant, which reduces the area of interest by a factor of 0.4 ... 0.1; x A word recognition compared to a reference may be neglected if the distance index D(T,R) can not be below a given threshold or if the partial distance index (normalized cumulative distance) is significantly different from the lowest index of partial contrast for all references. Under these conditions the number of actual treated points for a word is ĮMQL, where Į <1, and generalizing for the case of chained words without syntactic constraints we obtain: N=ĮMQKL2, where N is the number of points assessed for recognizing a sequence of words and K is the average number of words in a sequence. 5. EXPERIMENTAL RESULTS Figure 2: Example of circuit breaker pattern containing errors. Considering the plane splited into two areas A and B, the time alignment function indicates the correlation between the time axes of the A and B sequences and can be represented by a sequence of points in the plane c i, j : F c1 , c 2 ,......c k ; c k i k , jk (15) If the spectral distance between the two characteristic vectors ai and of the bj is represented by: d c d i, j (16) then the sum of distances to the end of the sequence, along of F is represented by: K D F ¦ d c w k k 1 K ¦ wk k (17) k 1 The smaller value gives the better match (similarity) between A and B. The computation volume of the comparison of the two acoustic oscillographs can be estimated by assessing the number of points (i,j) treated by a dynamic programming algorithm, in each point, the algorithm have to calculate the local distance d(i,j) and an partial aggregate (cumulated) g(i,j). To compare two isolated words of length I and J, all (i,j) points of the grid [1,I] x [1,J] are treated; the process of isolated word recognition requires to examine MxQxL points, where M is the vocabulary size, Q is the average number of references/word and L is the average length of words. 116 To determine the speed and the moments of breaker’s contacts closing-opening, the authors have used a sound and vibration analyzer SVAN 958, which uses tri-axial accelerometers for vibration measurements, which offers the opportunity to perform independent measurements on the three phases, with three monoaxial accelerometers. SVAN 958 it is a digital analyzer [6] for channels in the frequency range 0.5 Hz - 20 kHz including sound measurements (IEC 61672-1:2002) and measurements of vibration (ISO 8041:2005). Each of the four available channels (three for vibration and one for sound) can run simultaneously with independent input configuration (transducer type), filters and RMS detector of time constants. The four channels allow parallel measurements by independently defined filters and RMS additional time detectors (LEQ, LMax, LMin, LPeak, SPL, SEL) when measuring sound or RMS, PEAK, PEAKPEAK (P-P), VDV, MTVV in case of vibration measurements. "USB Memory Stick" allows you to store a large number of information and measurement results can be easily downloaded to your PC, using standard USB port (optional RS 232 or IrDA). The processing software is SvanPC + and the analyzer SVAN958 has the following possibilities of operation: x real-time measurements, measurements in 1/1 octave or 1/3 octave analysis, including statistical computation; x FFT analysis including overlapping spectra; x measurement of the reverberation time, noise dosimeter and rotational speed measurement. The above features make this type of analyzer helpful in off-line diagnosis in time and frequency domain analyzing three phase switching equipments. Annals of the University of Craiova, Electrical Engineering series, No. 34, 2010; ISSN 1842-4805 ____________________________________________________________ Logger results The authors conducted experimental determination of the contacts vibration in a circuit breaker IUP-M (In = 630A, Un = 12kV, Year: 1978) available in the electrical equipment laboratory of the Technical University from Cluj-Napoca. Acceleration-time diagrams (velocity or displacement, depending on the setting page Svan analyzer 958) of figures 3, 4 and 5, allow to determine the mobile equipment acceleration, the opening and closing times, being useful in the design stage for checking the kinematics characteristics of the circuit breaker (relations 4, 11 and 13). User title... Logger results User title... Main cursor 13:52:38.010 04-Jun-10 RMS (Ch3, P1) 12.882 m/s^2 Figure 5: Determination of closing time; phase L3. Logger 1/3 Octave, Channel 1, RMS, Acceleration, Filter HP, 07-Jun-10 14:24:52.010 User title... Main cursor 13:52:38.010 04-Jun-10 RMS (Ch1, P1) 295. 121 m/s^2 Figure 3: Determination of closing time for the L1 phase. Main cursor As it is noted above, the sound and vibration analyzer Svan 958 allows simultaneous analysis of the closing acceleration of the mobile armature, in time and frequency domain, as shown in figure 6 and 7, for the phase L1. 50.0 RMS 77.625 m/s^2 - - Figure 6: Simultaneous analysis in frequency domain; phase L1. 1/3 Octave Time intersection, Channel 1, Acceleration, Filter HP, f = 20.0Hz User title... Logger results User title... Main cursor 14:24:52.250 07-Jun-10 RMS 109.648 m/s^2 - - Figure 7: Simultaneous analysis in time; phase L1. Main cursor 13:52:38.010 04-Jun-10 RMS (Ch2, P1) 27. 861 m/s^2 Figure 4: Determination of closing time for the L2 phase. 117 The highlighting of the damping system problems and a kinematics comparison between phases can be performed by determining the speed-time characteristic during a complete cycle opening – closing – opening (OCO) on the three phases of the circuit breaker (figure 8, 9 and 10). Annals of the University of Craiova, Electrical Engineering series, No. 34, 2010; ISSN 1842-4805 ____________________________________________________________ Logger results, Channel 3, P1 (Vel3, 100 ms) 6. CONCLUSIONS User title... Main cursor 13:15:36.360 05-Jun-10 RMS (P1) 12.162 m/s - The use of the multi-channel analyzer in circuit breakers diagnosis, presents the following advantages: x enables the determination of the opening and closing times; x by comparing the amplitude-time characteristics the non simultaneity between the phases L1, L2 and L3 can be determined; x the setting possibilities of the SVAN 958 analyzer in determining the acceleration, velocity or displacement, allows a diversity of possibilities for the dynamic behavior analysis; x the frequency analysis by selecting 1/1 octave or 1/3 octave allows the analysis simplification by the method of Dynamic Time Warping in the predictive diagnosis procedures of circuit breakers. - Figure 8: The vibration speed, opening - closing – opening cycle; phase L1 Logger results, Channel 2, P1 (Vel3, 100 ms) User title... Main cursor 13:15:36.370 05-Jun-10 RMS (P1) 23.442 m/s - - Figure 9: The vibration speed, opening - closing – opening cycle; phase L2. Logger results, Channel 1, P1 (Vel3, 100 ms) User title... Main cursor 13:15:36.540 05-Jun-10 RMS (P1) 38.459 m/s - - Figure 10: The vibration speed, opening - closing – opening cycle, L3 phase. 118 [1]. Ionescu, I. Racovitan, I. Using Modern Methods of Diagnosis Off-line Medium and High Voltage Circuit Breakers in the Context of Transition to Maintenance Based on Reliability, FOREN2008, Neptune, 15 to 19 June 2008; [2]. Hortopan, G., Electrical Apparatus, Theory, Design, Testing, EDP, Bucharest, 1978; [3]. PE 116-94 Norm for Testing and Measurement in the electrical installations and equipments; [4]. *** Programma, Vibration Testing of High Voltage Circuit Breakers; [5]. Leonard, F., Landry, C., Beauchemin, R., Turcotte, O., Brikci, F., An Improved Algorithm Vibration Analysis as a Diagnostic Tool for Detecting Mechanical Anomalies on Power Circuit Breakers, IEEE Transaction on Power Delivery, vol. 23, no. 4, October 2008; [6]. ***Svan 958, User Manual, Svantek, Poland.