1
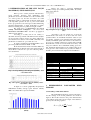
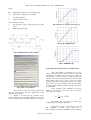
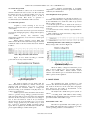
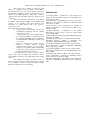
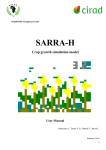
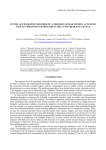
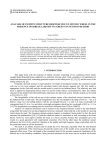
JOURNAL OF SUSTAINABLE ENERGY VOL. 4, NO. 3, SEPTEMBER, 2013
USING LOW POWER TURBINES IN AREAS WITH LOW WIND
POTENTIAL
JOIAN R. *, HORGOŞ M. **, PETRUŞ D.*, PALAGHIŢĂ N.*
* Technical University of Cluj-Napoca
** Technical University of Cluj-Napoca, North University of Baia Mare Centre
[email protected]
Abstract - This paper presents some low-power wind
turbine solutions that can be used in areas with low
wind potential. Statistics are presented in relation to
wind speed and direction, measured into a location
close to the city of Baia Mare. These data were plotted
in order to find the most favorable periods in the
range from 2008 to 2012. For performance evaluation
of the proposed wind turbine systems, in addition to
the technical specifications provided by the
manufacturers, we have developped a set of
simulations, using programs dedicated to wind
systems. Was performed experimental measurements
on a wind turbine power d emic belonging to the
Technical University of Cluj-Napoca, North
University of Baia Mare Centre.
Keywords: small power wind turbine, wind potential,
graphical representation.
1. INTRODUCTION
Wind energy occurs due to potential differences
in heat in the troposphere barrel respectively, differences
that are caused by uneven heating of the atmosphere.
Wind farms are those that currently play a decisive role in
producing electricity with wind as the main element. In
the early 1980s he began energy development in this area,
initially using generating hundreds of kW/unit. Currently
power is somewhere in the neighborhood of
7-8
MW/unit.
There are two parameters, the basic design and
operation of wind farms, namely:
• useful speeds (vu) - data time beating the
wind, which can be constant or increasing.
These rates are higher than the start;
•
minimum speed (v0) - generally 3 m /s is
the minimum speed to drive wind turbines.
There are a limited number of areas where wind
turbines can be placed large.
Our country's wind potential, following some
estimates amounts to about 30.000 MW. In about half the
territory, the wind is blowing at a speed of at least
3
m/s, and a duration exceeding the figure of
3.500
hours/year. At the end of 2012, Romania had installed
almost 2.000 MW wind, according to the SEPS. For the
end of 2013 is expected to total installed capacity of 4.000
MW and opinions Transelectrica has applications for
30.000 MW Wind turbines (connection permits were
issued for about 8.000 MW), although the system
supports more than 5.000 MW.
Most wind energy production in Romania was
reached on 08.01.2013 at 5.09, when turbines produce
1586 MWh (green graphics), while nuclear energy
production (red graphic) amounted to 1.421 MWh in 1184
hydrocarbons MWh (graphically yellow) and water to 395
MWh (blue graphic).
Fig. 1. Distribution of solar radiation in the
atmosphere
Fig.2. Graphic electricity production
Wind is an inexhaustible source of energy, so by
installing wind turbines, can be transformed into different
forms of energy. Sun warms the Earth, so heated air
masses will move vertically because the density
decreases, thus creating air pockets. Air pressure is
greater in cold areas of the Earth. Winds are formed in
nature tend to equalize, so cold air masses moving to
areas with hot air.
Wind turbines are placed on wind direction,
which generally must have constant speed in that area.
Known so far is that only a certain proportion of the
potential wind is received by the facility, which depends
on the area on which a wind impeller cover and the
efficiency of the wind generator (so called by using the
wind speed ratio). In conclusion we can say that the
potential of wind power depends on three important
factors: size of the installations, installed power, wind
speed.
ISSN 2067-5534 © 2013 JSE
JOURNAL OF SUSTAINABLE ENERGY VOL. 4, NO. 3, SEPTEMBER, 2013
2. DETERMINATION OF THE CITY TĂUŢII
MĂGHERĂUŞ WIND POTENŢIAL
Wind possess certain physical characteristics:
speed, intensity, direction, time distribution. The
parameters used for the calculations for the nominal value
of a wind power cut, and the area where we could
implement a plant or a wind farm. A measure wind speed
is an important operation in case of power a wind farm
that is proportional to the wind speed cubed. Measuring
physical characteristics of wind anemometer is made,
which are usually placed on pillars at a height of 50 m .
The main types of anemometers are placed
radially anemometer hemisphere - the most used,
anemometer with ultra-sound - use this to propagate in
different environments.
According to a study done in our country, to
determine the wind potential of Romania. In this analysis
we used specific software, meters, etc. In the analysis we
used data from 22 stations in the NAM community. The
parameters considered are: speed and direction.
To study potential wind around Baia Mare, used
personal portable anemometer PCE - A 420.
From measurements made in the Baia Mare city
Tăuţii Măgherăuş an amateur radio mast with a height of
about 40 m, located in the open, the following values
were determined:
Restore the chart to represent multiannual
monthly average speed during January 2008 - November
2012, in m/s (Fig. 6).
Fig.6 Graphical representation of mean monthly multi
(m/s)
According to the two graphs we see that the
measurements were made in an area with low wind
potential. There are maximum measured values in just
two months, otherwise gears spinning in the same values.
Usually a minimum speed drive wind is 3 m/s. However,
we propose a suitable solution for existing data. ASCOR
Ecoterm LLC, based in Scorteni, Prahova County, sells
low-power turbines whose minimum starting speed is 2
m/s. Technical characteristics for two turbines that can be
used given the data collected are presented in Table 1.
Incluxiv prices include VAT, shipment and installation.
Model wind turbine
Rated (W)
Nominal Voltage (V)
Rotor Diameter (m)
Starting wind speed (m/s)
Rated wind speed (m/s)
Wind speed safety (m/s)
Rated speed (rev/min)
Material pallets
Number of blades
column height (m)
Diameter pole (mm)
Weight turbine (generator
assembled with blades and
tail)
Downwind orientation mode
How to over-wind protection
Fig. 3. Average wind speed in the period January 2008
- November 2012
Number and capacity batteries
Capacity / Inverter / efficiency
at maximum
Load Regulator
Wind turbine SE 500
500
24
2,5
Wind turbine SE 1000
1000
48
2,7
2
8
9
35
400
Fiberglass Reinforced
3
6
89
51 kg
114
59 kg
Automatically by the tail
Automatic partial or total removal of the wind direction, with the
tail depending on the speed of rotation of the rotor
12V 200AH 2 piece
12V 200AH 4 piece
500W/ pure sine / 85%
1000W/ pure sine / 85%
The task of dissipating 500W
The task of dissipating 1000W
continuous intelligence
continuous intelligence
Packages include: generator blade, pole anchored 6m hybrid drive controller / inverter, batteries for
renewable energy applications, cables
Package Price
3200$
4800$
Tab.1 Proposed turbine purchase
Fig. 4. Frequency of wind direction in January 2008 November * 2012
In figure 5 is shown graphically interpretation
multiannual monthly average speed between January
2008 - November 2012, expressed in km/h.
3. EXPERIMENTAL LOW-POWER WIND
TURBINE
3.1 Modeling a 1 kW wind turbines
The mathematical model is presented in figure 7
and the settings of the model parameters are shown in
figure 8. The model is based on the power characteristics
of the turbine steady state. Power output of the turbine is
given by the following equation:
Pm = c p (λ , β )
Fig.5 Graphical representation of mean monthly multi
(km/h)
ISSN 2067-5534 © 2013 JSE
ρA
2
v 3 wind
(1)
JOURNAL OF SUSTAINABLE ENERGY VOL. 4, NO. 3, SEPTEMBER, 2013
where:
Pm
Mechanical output power of the turbine (W)
cp
Performance coefficient of the turbine
ρ
Air density (kg/m3)
A
Turbine swept area (m2)
vwind Wind speed (m/s)
λ
Tip speed ratio of the rotor blade tip speed to wind
speed
β
Blade pitch angle (deg)
Fig.9. The law of variation of wind speed
Fig.10. Speed wind turbine
Fig.7. Simulink model of wind turbine
Fig.11. Turbine torque
3.2 Testing and experimentation of a turbine 400W
Fig.8. Choice of parameters
The two inputs of the model are speed generator
(pu) and wind speed in m/s. The output shaft torque
applied to the generator.
Figures 9 and 10 show the evolution of the
profile considered input quantities. Figure 11 shows the
result of simulation model of wind under these conditions.
AirX wind turbine is classified as low-power
turbines and incorporates a microcontroller to sea load
performance of batteries and reduce noise. AirX can
charge battery systems from 25 to 2500 Ah. When the
batteries have reached predetermined load condition AirX
wind turbine will cease to have power and restart
charging when battery discharges below the set voltage.
Also in the event of storm damage to prevent the turbine
is equipped with a braking system if wind speed increases
above 49.2 m/s.
Power available at the terminals of the wind
turbine is proportional to the cube of the wind speed
according to the relation:
P=
1
ρ ⋅ A ⋅ v 3 [W ]
2
(2)
This means that every time the wind speed
doubles the power increases eight times.
AirX unique profile is such that they can take
full advantage of wind power. AirX uses a
microcontroller to track the maximum power efficiency
ISSN 2067-5534 © 2013 JSE
JOURNAL OF SUSTAINABLE ENERGY VOL. 4, NO. 3, SEPTEMBER, 2013
curve be appropriate, depending on the available energy
getting wind maximum power generated.
Test 2 :
For this test link Newmax batteries in series and
connected to the control panel to stand with correct
polarity (terminal (+) of the battery terminal (+) of the
array, ie as and negative terminals. Breaker in the
electrical panel by operating the turbine feeds power
stand. Currently LED is mounted at the bottom of the
turbine blinked twice which indicates proper functioning
of the controller. If the LED is not blinking when turbine
is connected the batteries we would be shown a failure of
the controller.
Test 3 :
Fig.12. Graphics power
Maximum power is achieved by continuously
adjusting the generator load and keeping the blades at an
optimum angle of attack (with vane system) at all wind
speeds. Such a turbine although the turbine AirX provides
a small amount of energy.
Experimentals stand has mounted in the
laboratory L-27 North Center University of Baia Mare. In
this lab we are able to produce a current of air that trigger
turbine. Airflow is produced by a fan driven by a motor
connected to a drive. By changing the frequency of the
supply voltage of the motor changes its speed and thus
airflow speed that we can measure anemometer.
For starters, check turbine if mechanical or
electrical defects. From the mechanical point of view it is
intended that the turbine is also clamped to the pillar rotor
blades are attached and secured against accidental
loosening. Fan housing not cracks or cracks that could
lead to its dissolution during operation.
This test requires a way to spin the turbine rotor
speed of 500 rev/min. In the absence of rotor spinning
device that I use the fan. I set the fan speed in order to
obtain an air flow to spin the turbine rotor over
500
rev/min. The turbine is connected to the load consists of
two batteries and turns on the fan, when the turbine rotor
starts rotating increasingly faster. LED lights often (10
times per second) until the turbine rotor exceeds 500
rev/min at which time the LED lights continuously which
indicates the start of charging batteries.
After performing tests results presented above
that the Air-X turbine tested in terms of electrical
functioning properly.
3.2.1 Air turbine operating modes - X
3.2.1.1 Load operation
Been sitting idle for doing so:
Output terminals not connected load, the turbine
remains open circuit. He receives power from speed
variator speed fan and grew until I got an airflow speed of
4 m/s at which the turbine rotor began to rotate. I
gradually increased fan speed and thus airflow speed.
With the circuit breakers voltmeter to monitor
voltage stand at different air flow speeds and the data
obtained are listed in Table 2.
Tab.2. Experimental results running on empty
Figure 14 was drawn chart with data obtained
above.
Fig.13. Experimental stand operation
As I tested electrically Air-X turbine follows:
Test 1:
For this test will proceed as follows:
- short circuit terminal (+) and Negative (-) on the control
panel of the stand
- turbine rotor rotates by hand
Following this test it was found that the rotor
opposes some resistance to turning his meaning as
specified in the user manual Air-X turbine generator that
it is good.
ISSN 2067-5534 © 2013 JSE
Fig.14. Load turbine operation
JOURNAL OF SUSTAINABLE ENERGY VOL. 4, NO. 3, SEPTEMBER, 2013
3.2.1.2 Circuit operation
The terminals is carried out on the instrument
stand and started from low revs fan of it. We found that
the airflow speed up to 6 m/s the turbine rotor does not
rotate, and if we increased airflow speed to 12 m/s it
rotates very slowly. This mode of operation is
recommended by the manufacturer without a load.
3.2.1.3 Normal operation
Coupled to a load consisting of two 12 volt
batteries connected in series to get 24 V nominal voltage
of the turbine.
We started the fan and its speed was increased
progressively changing frequency voltage with frequency
converter.
Airflow velocity was measured using
anemometer at a distance of 1.5 m in front of wind speed
at different values.
During battery charging control LED light
turbine issued. We monitored the load voltage and current
at different values of air flow. Values have been obtained
in table 3.
Curve obtained experimentally is essentially
comparable to schedule power user's guide Air-X turbine
outlined by the manufacturer.
3.2.1.4 Regulated mode operation
In this experiment we followed the behavior of
the turbine when the battery voltage reaches 28.2 V preset
by the manufacturer. To obtain this value we proceeded
battery voltage as follows:
• I set the fan speed in order to obtain an air velocity of
13 m/s because this value we obtained the largest turbine
power cut;
• I connected load consists of battery output terminals of
the switchboard;
• With voltmeter I monitored battery voltage and the
values we went in Table 4:
Tab.4 Experimental results running on a regulated
Battery charge chart is shown in Figure 16:
Tab.3. Experimental results normal
Figure 15 was drawn according to schedule
power airflow velocity values in Table 3.
Fig.16 Battery charge chart
When the battery voltage has reached the preset
value of 28.2 V turbine rotor speed to brake suddenly
became very small. LED - flashes turbine control
software often 10 times per second which means that the
turbine operates in the regulation.
Fig.15. Graphics power
4. CONCLUSION
The graph in Figure 14 was drawn with the
values obtained in the laboratory. Airflow velocity was
measured with anemometer and power is obtained
indirectly from the measured values of voltage and
current according to the formula P = UI [W] where: Uvoltage [V], I-current [A].
Airflow speed of 4 m/s the turbine starts and has
started to generate energy. Energy generated increases
with increasing airflow speed and reaches the maximum
when the air flow velocity is 13 m/s, the load voltage is
27.8 V, the load current is 12.59 A. If you increased
current velocity air at 14 m/s brake rotor to a low speed
and the energy generated by the turbine drops to near
zero, however I increased slightly increasing airflow
speed. This is regulated by the embedded controller and
protect against damage to turbine wind speeds.
We determined the wind potential in a real
location, and obtained from Daelim proposed a system to
suit locations monitored. At the same time and graphs
were plotted for the results of measurement of the
direction and intensity of the wind.
We analyzed two small wind power systems, as
follows:
• modeling unuei 1 kW turbines under existing
Simulink model, determining the law of variation of wind
speed wind turbine wind turbine torque.
Wind turbine AirX – 400
He built an experimental stand which gives us
the possibility that under laboratory conditions to produce
various operating conditions of wind turbines.
ISSN 2067-5534 © 2013 JSE
JOURNAL OF SUSTAINABLE ENERGY VOL. 4, NO. 3, SEPTEMBER, 2013
There have been a number of three tests with
which we concluded that the turbine Air-X 400 is
functional in terms of power. After testing we performed
the following simulations turbine operating mode of the
turbine Air X 400: Operation empty cage operation,
operation type (the most important mode) operation mode
regulators.
The most important experiment is one in which
the turbine was working normally, energy debiting task
consists of two batteries. The data obtained were
transferred to a table, with the aid of the power to
represent the chart..
The interpretation of graphs, resulting:
•
startup speed of the turbine is 4 m/s, the
manufacturer indicating that the starting
speed value 3.58 m/s;
•
air flow speed of 13 m/s maximum power
produced by the turbine is and has the value
P = 350 [W]. Maximum power specified by
the manufacturer is 400 [W] at a wind speed
of 12.5 m/s;
• When the airflow speed reached 14 m/s
turbine to brake without stopping
completely and ceased to produce energy.
Wind speed at which turbine significantly
reduce their speed specified in the user
manual Air-X turbine is 15.6 m/s.
In the laboratory we could not get the airflow
speed of 49.2 m/s, the turbine speed would be slowed
total if turbine would not stop at high wind speeds would
destroy it.
If I charged the batteries for about 3 hours on
battery voltage exceeded 28V and turbine began operating
in the regulation ceased to charge the battery energy.
Because of this risk is not Overcharging
REFERENCES
[1] Thomas Patara - Contributions to the analysis and
design of micro-renewable energy networks, PhD thesis,
Cluj - Napoca, 2012.
[2] Ionela Negrea - Adaptability study of low-power wind
turbines to the climatic conditions of Romania, PhD
thesis, Braşov, 2010.
[3] John Costin Coşoiu - Contributions to optimize the
design and operation of wind generators, PhD thesis,
Bucharest, 2008.
[4] Iulian Munteanu - Contributions to the optimal
management of wind energy conversion systems, PhD
thesis, Galaţi, 2006.
[5] Roman Baican - Energy regenrabile Publishing Grinta,
Cluj - Napoca, 2010.
[6] Mihai Octavian Popescu, Claudia Laurent Smith Renewable Energy, Volume 1: Principles and
Applications, Electra Publishing, Bucharest, 2010.
[7] Niculaie Palaghita, Petreuş Dorin Cristian Farcas Power Electronics, Volume II Mediamira Publishing
House, Cluj - Napoca 2004.
[8] Niculaie Palaghita, Petreuş Dorin Cristian Farcas Electronics Command and Control, Ed Mediamira, Cluj Napoca 2004.
[9] Chindriş, M., Cziker, A., Miron, Anca, Tomoiagă, B. energy management. Applications, Publishing House
Book of Science, Cluj-Napoca, 2009.
[10] Victor Emil Lucian - Renewable resources and their
conversion, MatrixRom Publishing House, Bucharest,
2011.
ISSN 2067-5534 © 2013 JSE