1
ISO 9001
INSTRUMENTATION FOR SOUND & VIBRATION
MEASUREMENTS AND ANALYSIS
ZETOM-CERT
SVAN 956
VIBRATION
LEVEL METER & ANALYSER
USER’S MANUAL (DRAFT VERSION)
SVANTEK Sp. z o.o.
WARSAW, August 2007
SVAN 956 USER MANUAL
_
Notice: This user’s manual presents the software revision named 6.05 / 6.05.3
(cf. the description of the UNIT LABEL position of the DISPLAY list). The succeeding software revisions
(marked with the bigger numbers) can slightly change the view of some displays presented in the text
of the manual.
1
2
3
4
5
INTRODUCTION
1-1
1.1 SVAN 956 as Vibration Meter & Analyser
1-1
1.2 General features of SVAN 956
1-1
1.3 Accessories included
1-2
1.4 Accessories available
1-2
1.5 Software options available
1-2
1.6 Current list of SVAN 956 options and accessories
1-3
MANUAL CONTROL OF THE INSTRUMENT
2-1
2.1 Control push-buttons on the front panel
2-1
2.2 Input and output sockets of the instrument
2-6
SETTING THE INSTRUMENT
3-1
3.1 Basis of the instrument’s control
3-1
3.2 Powering of the instrument
3-21
3.3 Initial setup of the instrument
3-23
3.4 Selection of the working mode- MODE
3-27
3.5 Activation of optional functions
3-27
3.6 Memory organisation
3-28
FUNCTIONS OF THE INSTRUMENT - FUNCTION
4-1
4.1 Selecting the mode of the instrument - MODE
4-1
4.2 Measurement functions of the instrument - MEASUREMENT FUNCTION
4-1
4.3 Instrument’s calibration - CALIBRATION
4-2
4.3.1 Calibration BY SENSITIVITY
4-3
4.3.2 The calibration BY MEASUREMENT in the case of vibration signal
4-4
4.3.3 History of the calibration - LAST CALIBRATION
4-6
4.3.4 Automatic reading of a vibration transducer parameters - TEDS
4-6
MEASUREMENT PARAMETERS SETTING - INPUT
5-1
5.1 Selection of measurement parameters - MEASUREMENT SETUP
5-2
5.1.1 Setting time delay before the start of measurements - START DELAY
5-2
5.1.2 Setting the integration period - INTEGR. PERIOD
5-3
5.1.3 Setting the number of repetition of measurement cycles - REP. CYCLE
5-4
5.1.4 Logger functionality switching On / Off - LOGGER
5-4
5.1.5 Setting time period between two writings to the logger’s file - LOGGER STEP
5-5
5.1.6 Logger file name edition - LOGGER NAME
5-6
5.2 Measurement range setting - MEASUREMENT RANGE
5-7
5.3 Setting parameters in a profile - PROFILE x
5-8
5.3.1 Weighting filter selection in a profile - FILTER
5.3.2 RMS detector selection - DETECTOR
5-8
5-9
5.3.3 PEAK result selection for saving in a logger’s file - LOGGER PEAK
5-10
5.3.4 MAX result selection for saving in a logger’s file - LOGGER MAX
5-10
5.3.5 P–P result selection for saving in a logger’s file - LOGGER P-P
5-11
SVAN 956 USER MANUAL
5.3.6 RMS result selection for saving in a logger’s file - LOGGER RMS
_
5-11
5.4 Triggering mode and parameters selection - TRIGGER SETUP
5-11
5.4.1 Trigger parameters setting - MEASURE TRIGGER
5-12
5.4.2 Trigger parameters in logger setting - LOGGER TRIGGER
5-15
5.4.3 Trigger parameters for recorder setting - RECORDER TRIGGER
5-18
5.5 Selection of FFT analysis parameters - FFT
5-20
5.5.1 The averaging of spectra in the FFT analysis - AVERAGING
5-21
5.5.2 Weighting filter during the FFT analysis - FILTER
5-21
5.5.3 Selecting the analysis band of the signal - BAND
5-21
5.5.4 Selecting the time window for the FFT analysis - WINDOW
5-21
5.5.5 Selecting the number of the lines of FFT analysis - LINES
5-22
5.5.6 Enabling the FFT spectra time history logging - LOGGER
5-22
5.6 Selection of 1/1 octave and 1/3 octave spectrum parameters - SPECTRUM
5-22
5.6.1 Selecting the weighting filter during 1/1 OCTAVE or 1/3 OCTAVE analysis - FILTER5-23
5.6.2 Selecting the band during the 1/1 OCTAVE or 1/3 OCTAVE analysis - BAND
5-23
5.6.3 Activation of logger for 1/1 OCTAVE or 1/3 OCTAVE analysis results - LOGGER 5-23
5.7 Selection of enveloping parameters - ENVELOPING
5.7.1 Selecting the weighting filter during the enveloping calculation - FILTER
5-24
5.7.2 Selecting the band during the enveloping analysis - BAND
5-24
5.7.3 Selecting the number of the lines in enveloping spectrum - LINES
5-25
5.8 Selection of RPM measurements parameters - RPM
5.8.1 Switching on the RPM measurement - RPM
6
5-26
5-26
5.8.3 Selecting the unit of RPM measurement - UNIT
5-26
DATA AVAILABLE ON THE DISPLAY - DISPLAY
6-1
6.1 Selection of the modes of measurement results presentation - DISPLAY MODES
6-1
6.1.1 Switching on/off spectrum view - SPECTRUM
6-4
6.1.2 Switching on/off three profiles view - 3 PROFILES
6-4
6.1.3 Setting on/off logger view - LOGGER
6-6
6.1.4 Setting on/off the view of the file description - FILE INFO
6-7
6.2.1 Setting the scale of the presentation and the display’s grid - DISPLAY SCALE
1-2
5-25
5.8.2 Selecting the number of pulses / rotations - PULSE / ROTATION
6.2 Setting the parameters of the graphical modes - DISPLAY SETUP
7
5-23
6-7
6-8
6.2.2 Selection of the Spectrum Type in VM - SPECTRUM TYPE
6-10
6.2.3 Setting the parameters of the logger files presentation - SPECTRUM VIEW
6-11
6.2.4 Selection of the Weighting Filters - TOTAL VALUES
6-12
6.2.5 Setting the parameters of the logger files presentation - LOGGER VIEW
6-14
6.3 Selection of the logger’s file to the display presentation - LOGGER VIEW
6-15
6.4 Setting the parameters of the display - SCREEN SETUP
6-17
6.4.1 Setting the contrast of the display – CONTRAST
6-17
6.4.2 Automatic switch off of the backlight - BACKLIGHT TIMEOUT
6-18
6.5 Checking the state of the internal battery – BATTERY
6-18
6.6 Checking specification of the instrument - UNIT LABEL
6-19
SAVING THE MEASUREMENT RESULTS - FILE
7-1
SVAN 956 USER MANUAL
7.1 Saving files in the instrument’s memory - SAVE and SAVE NEXT
7-3
7.2 Controlling the data storing in the instrument’s memory - SAVE OPTIONS
7-7
7.2.1 Saving data starting from the same address - RAM FILE
7.2.2 Replacement of the existing files by the new ones - REPLACE
7-7
7.2.3 Controlling the measurement results savings - AUTO SAVE
7-8
7.2.4 Direct access to the SAVE / SAVE NEXT function - DIRECT SAVE
7-10
7.2.5 Saving maximum values in the spectrum - SAVE MAX SPECT.
7-11
7.2.6 Saving the lowest values in the spectrum - SAVE MIN SPECT.
7-12
7.3 Loading the files with the measurement results - LOAD
7-12
7.4 Removing a file with the measurement results from memory – DELETE
7-15
7.4.1 Deleting files with the main results - RESULT FILES
7-15
7.4.2 Deleting logger files - LOGGER FILES
7-17
7.4.3 Deleting files with setup settings - SETUP FILES
7-19
7.5 Removing all files with measurement results from memory - DELETE ALL
9
7-21
7.5.1 Deleting all result files - RESULT FILES
7-21
7.5.2 Deleting all logger files - LOGGER FILES
7-22
7.5.3 Deleting all setup files - SETUP FILES
7-23
7.6 Merging file space - DEFRAGMENTATION
8
7-7
7-25
7.6.1 Merging result and setup files memory - FILES DEFRAGMENTATION
7-25
7.6.2 Merging logger files memory - LOGGER DEFRAGMENT.
7-27
7.7 Checking the contents of the memory - CATALOGUE
7-28
7.8 Checking the free space in the memory - FREE SPACE
7-30
7.9 Saving setup files in the instrument’s memory - SAVE SETUP
7-31
7.10 Loading the files with the setup settings - LOAD SETUP
7-34
7.11 Connecting the external USB memory stick- DIRECTORY
7-36
7.12 Copying files to the external USB memory stick- COPY FILES TO USB
7-37
7.13 Moving files to the USB memory stick- MOVE FILES TO USB
7-38
REPORTS PRINTING - REPORT
8-1
8.1 Edition of the user’s text to be added to the reports - TITLE
8-3
8.2 Printing of the measurement results - PRINT RESULTS
8-4
8.3 Printing of the measurement results from the selected file - PRINT FILE
8-6
8.4 Printing of the logger results - PRINT LOGGER
8-8
8.5 Printing of the coefficients of the user filters - PRINT USER FILTERS
8-9
8.6 Printing of the file’s catalogue - PRINT CATALOGUE
8-11
8.7 Selection of the printing options - OPTIONS
8-13
8.7.1 Selection of the format of the print out - FORMAT
8-13
8.7.2 Controlling the paper ejection after print out - EJECT P.
8-13
SETUP MENU - SETUP
9-1
9.1 Setting the language of the user interface - LANGUAGE
9-2
9.2 Return to the factory settings - CLEAR SETUP
9-4
9.3 Setting parameters of the Ext. I/O port - EXTERNAL I/O SETUP
9-5
1-3
SVAN 956 USER MANUAL
1-4
_
9.3.1 Mode selection of the Ext. I/O port - MODE
9-5
9.3.2 Digital output function selection of the I/O socket - FUNCTION
9-6
9.3.3 Polarisation selection of the digital output signal - POLARISATION
9-6
9.3.4 Active level selection of the digital output signal - ACTIVE LEVEL
9-7
9.3.5 Source signal selection for the alarm pulse generation - SOURCE
9-7
9.3.6 Alarm level selection on the digital output of I/O - ALARM LEVEL
9-7
9.4 Activation of human vibration filters - HUMAN VIB. FILT.
9-8
9.5 Selection of the current IEPE supply - IEPE CURRENT
9-8
9.6 Reference signal in vibration measurements - REFERENCE LEVELS
9-9
9.6.1 Setting the reference level of the acceleration signal - ACC
9-9
9.6.2 Setting the reference level of the velocity signal - VEL
9-9
9.6.3 Setting the reference level of the displacement signal - DIL
9-10
9.7 Parameters of remote communication - REMOTE COMMUNICATION
9-10
9.7.1 Selecting the type of remote communication - TYPE
9-10
9.7.2 Setting the packet size of the remote communication - PACKET
9-11
9.8 Detector’s type selection in the RMS calculations - RMS INTEGRATION
9-11
9.9 Activation of RPM measurement function - RPM MEASUREMENT
9-12
9.10 Setting the parameters of the serial interface - RS232
9-12
9.10.1 Setting the transmission speed of the serial interface - BAUD RATE
9-12
9.10.2 Setting time limit for the performance of serial interface operation - TIME OUT
9-13
9.11 Programming the instrument’s internal Real Time Clock - RTC
9-13
9.12 Selection of few push-buttons mode - SHIFT MODE
9-14
9.12.1 <SHIFT> / <ALT> push-button working mode selection - SHIFT
9-14
9.12.2 <START / STOP> push-button working mode selection - ST/SP
9-15
9.13 Activation of the signal generation option - SIGNAL GENERATOR
9-15
9.14 Programming the instrument’s internal timer - TIMER
9-16
9.14.1 Selecting the mode of the timer function - MODE
9-16
9.14.2 Setting day of the instrument’s switch on - START DAY
9-16
9.14.3 Setting hour of the instrument’s switch on - START HOUR
9-17
9.14.4 Selecting the start hours for four irregular automatic measurements - TIMEx
9-17
9.14.5 Selecting the period between two consecutive measurements - REPETITION
9-17
9.14.6 Description of the exemplary timer function execution
9-18
9.15 Selection the USB–HOST port functionality - USB–HOST PORT
9-19
9.16 Setting the coefficients of the user filters - USER FILTERS
9-22
9.16.1 Introduction the parameters of real time filters - REAL TIME FILTERS
9-22
9.16.2 Setting filter coefficients for octave analysis - SPECTRUM BASED FILTERS
9-24
9.17 Selection of the vibration units - VIBRATION UNITS
9-27
9.18 Warnings selection - WARNINGS
9-27
9.18.1 Saving the measurement results in a file - RESULTS NOT SAVED
9-27
9.18.2 Checking free space on the USB disk - USB DISK FREE SP.
9-28
9.18.3 Minimum USB disk memory free space setting - MIN FREE SPACE
9-28
SVAN 956 USER MANUAL
LIST OF FIGURES
SVAN 956 instrument with the accelerometer and tachometer..................................................................................1-3
Control push-buttons of the SVAN 956 instrument ...................................................................................................2-1
Display with the “MARKERS” (after pressing <ALT> and <SHIFT> together).......................................................2-5
Displays with the activated markers ...........................................................................................................................2-5
Time history plot with the indication of the active markers .......................................................................................2-5
Top cover of the SVAN 956 instrument in 1:1 scale .................................................................................................2-6
Bottom cover of the SVAN 956 instrument in 1:1 scale ............................................................................................2-6
Front panel of the SVAN 956 instrument in 1:1 scale................................................................................................2-7
Rear panel of the SVAN 956 instrument in 1:1 scale.................................................................................................2-8
Displays with the highlighted elements of the main list .............................................................................................3-1
Display with the recently accessed menu items (after double pressing of the <MENU> push-button)......................3-1
Displays with the main list (a) and the elements of the INPUT list (b) ......................................................................3-2
MEASUREMENT SETUP window opened (path: MENU / INPUT / MEASUREMENT SETUP)...........................3-2
MEASUREMENT SETUP window; the INTEGR. PERIOD position accessible.....................................................3-2
Displays with the accessed INTEGR. PERIOD position after pressing the <> or <> push-buttons,
respectively .....................................................................................................................................................3-2
Displays after three consecutive pressing of the <ESC> push-button from the MEASUR. SETUP sub-list .............3-2
Displays during and after the accessing the FREE SPACE window (path: MENU / FILE / FREE SPACE).............3-3
Displays during the edition of the text, which has to be printed as a header in the measurement reports (path:
MENU / REPORT / TITLE) ............................................................................................................................3-3
Control diagram of the FUNCTION list ....................................................................................................................3-4
Control diagram of the INPUT list in the 1/1 OCTAVE and 1/3 OCTAVE mode ....................................................3-6
Control diagram of the INPUT list in the FFT mode .................................................................................................3-7
Control diagram of the INPUT list in the ENVELOPING mode ...............................................................................3-7
Control diagram of the INPUT list in the LEVEL METER mode .............................................................................3-8
Control diagram of the DISPLAY SETUP sublist in 1/1 OCTAVE and 1/3 OCTAVE analysis of vibration.........3-11
Control diagram of the DISPLAY list......................................................................................................................3-12
Control diagram of the FILE list ..............................................................................................................................3-15
Control diagram of the REPORT list .......................................................................................................................3-16
Control diagram of the SETUP list ..........................................................................................................................3-21
BATTERY windows with different sources powering the instrument: SA 15 external DC power adapter (a),
SA 17A external battery pack (b), internal batteries (c) and USB power (d)................................................3-21
Displays with the “Battery” icon (a) and in the BATTERY window (path: MENU / DISPLAY / BATTERY) (b) ...3-22
Display with LOW BATTERY message..................................................................................................................3-22
Displays with the “Computer” icon (a) and in the BATTERY window (b) .............................................................3-22
SCREEN SETUP windows; BACKLIGHT TIMEOUT activation .........................................................................3-23
Displays after switching on the instrument...............................................................................................................3-23
Displays in one profile (a) and 3 PROFILES display mode (b) with the VLM measurement results ......................3-23
Displays in 3 PROFILES display mode with the measurements results, which are from LEVEL METER mode
(continuous lines) (b) and with the results, which are not from the LEVEL METER (dotted lines).............3-24
Display with all available icons................................................................................................................................3-24
Display with “Paper sheet” icon...............................................................................................................................3-24
Display with “Battery” icon .....................................................................................................................................3-25
Display with “Computer” icon .................................................................................................................................3-25
Display with “Antenna” (“Tree”) icon .....................................................................................................................3-25
Display with “Loudspeaker” icon.............................................................................................................................3-25
Display with “Headphone” icon...............................................................................................................................3-25
Display with “Envelope” icon ..................................................................................................................................3-26
Display with “Bell” icon ..........................................................................................................................................3-26
Display with “Timer” icon .......................................................................................................................................3-26
Display with “Arrows” icon .....................................................................................................................................3-26
Displays with the FUNCTION list opened, MODE selected (a) and MODE sub-list opened with
ACCELERATION (b) and VOLTAGE (c) mode selected ...........................................................................3-27
Displays with the FUNCTION list opened, MEASUREMENT FUNCTION selected (a) and
MEASUR. FUNCTION sub-list opened with all available options (b), (c), (d), (e), (f)...............................3-27
Displays during the entering of the access code to a function ..................................................................................3-28
Display after the unsuccessful verification of the access code .................................................................................3-28
Scheme of the instrument’s memory organisation without the USB–HOST............................................................3-29
1-5
SVAN 956 USER MANUAL
_
Scheme of the instrument’s memory organisation with the USB–HOST and memory stick connected .................. 3-30
Displays with the main list; the FUNCTION text selected (a) and the FUNCTION list opened; the MODE
selected (b) the MEASUREMENT FUNCTION selected (c) and the CALIBRATION selected (d) ............ 4-1
FUNCTION list opened; MODE selected (a) and MEASUR. FUNCTION sub-list opened with all available
modes b), (c)................................................................................................................................................... 4-1
MEASUREMENT FUNCTION windows opened (a) and the activation of the optional function (b)...................... 4-2
Displays with the main list; the FUNCTION text selected (a), the FUNCTION list opened, the
CALIBRATION text selected (b)................................................................................................................... 4-2
Displays with the selected calibration mode and after entering this mode................................................................. 4-3
Displays with the SENSITIVITY positions (path: MENU / FUNCTION / CALIBRATION / BY
SENSITIVITY) not accessible ......................................................................................................................... 4-3
Displays during setting the sensitivity higher than 10.0 mV / ms-2 (a) and after pressing the <ENTER> pushbutton with the calibration factor calculated (b) ............................................................................................. 4-3
Displays during setting the sensitivity lower than 10.0 mV / ms-2 (a) and after pressing the <ENTER> pushbutton with the calibration factor calculated (b) ............................................................................................. 4-4
Displays with the lowest possible sensitivity and the highest calibration factor (a) and the highest sensitivity
and the lowest calibration factor (b) ............................................................................................................... 4-4
Displays with the selected calibration mode and after entering this mode................................................................. 4-4
Displays while the instrument is waiting for the calibration measurement to commence .......................................... 4-5
Displays during the calibration measurements........................................................................................................... 4-5
Displays after the calibration measurements.............................................................................................................. 4-5
Displays after pressing the <ENTER> push-button (after calculation of the calibration factor value) ...................... 4-6
Displays in the CALIBRATION window; the LAST CALIBRATION text selected (a) the LAST
CALIBRATION window opened with ten calibration records (b) ................................................................. 4-6
Displays with the LAST CALIBRATION record...................................................................................................... 4-6
Display with the empty LAST CALIBRATION window .......................................................................................... 4-6
CALIBRATION window; TEDS text highlighted..................................................................................................... 4-7
TEDS window opened; NO DATA AVAILABLE message ..................................................................................... 4-7
Main list with the INPUT text selected...................................................................................................................... 5-1
INPUT list in the LEVEL METER (a), in 1/1 OCTAVE and 1/3 OCTAVE analyser (b) ........................................ 5-1
in FFT analyser (c) in ENVELOPING (d) and after activation of RPM option (e) .................................................. 5-1
Displays with not active sub-lists of INPUT list during measurement....................................................................... 5-1
Displays with the MEASUREMENT SETUP window.............................................................................................. 5-2
MEASUREMENT SETUP windows; the setting of the START DELAY with 1-second step.................................. 5-2
MEASUREMENT SETUP windows; the setting of the START DELAY with 10-seconds step .............................. 5-2
MEASUREMENT SETUP windows; the setting of the INTEGR. PERIOD with 1-second step.............................. 5-3
MEASUREMENT SETUP windows; the setting of the INTEGR. PERIOD with 10-seconds step .......................... 5-3
MEASUREMENT SETUP windows; the setting of the INTEGR. PERIOD with 1 and 10-minutes step................. 5-3
MEASUREMENT SETUP windows; the setting of the INTEGR. PERIOD with 10-hours step.............................. 5-3
Displays during setting the predefined INTEGR. PERIOD sequence ....................................................................... 5-4
Display, when the INT.PERIOD is too short for AUTO SAVE option..................................................................... 5-4
REP. CYCLE setting with the step equal to one........................................................................................................ 5-4
REP. CYCLE setting with the step equal to 20.......................................................................................................... 5-4
Displays with the LOGGER deactivated and activated ............................................................................................. 5-5
Displays during setting the LOGGER STEP; available values in a sequence 1, 2, 5................................................. 5-5
LOGGER STEP setting; available values in milliseconds......................................................................................... 5-5
LOGGER STEP setting; available values from 500 milliseconds to 1 hour .............................................................. 5-6
LOGGER NAME edition in MEASUREMENT SETUP .......................................................................................... 5-6
Displays during the attempt of overwriting the existing file ...................................................................................... 5-6
Relations between INTEGR. PERIOD and LOGGER STEP .................................................................................... 5-7
INPUT list with the MEASUREMENT RANGE selected ........................................................................................ 5-7
MEASUREMENT RANGE windows, the RANGE selection................................................................................... 5-8
Displays with change of the default range values caused by the calibration factor.................................................... 5-8
INPUT list with the PROFILE 1, PROFILE 2 and PROFILE 3 selected .................................................................. 5-8
PROFILE(1) windows; the selection of the weighting filter in acceleration measurements ...................................... 5-9
PROFILE(1) windows; the selection of the weighting filter in velocity measurements............................................. 5-9
PROFILE(1) windows; the selection of the weighting filter in displacement measurements..................................... 5-9
PROFILE(1) windows; the selection of the R1, R2, R3 weighting filter ................................................................... 5-9
PROFILE(1) windows; the selection of the RMS detector ...................................................................................... 5-10
1-6
SVAN 956 USER MANUAL
PROFILE(x) windows; the PEAK result to be not saved or saved in a logger’s file ...............................................5-10
PROFILE(x) windows ; the MAX result to be not saved or saved in a logger’s file................................................5-11
PROFILE(x) windows; the P-P result to be not saved or saved in a logger’s file ....................................................5-11
PROFILE(x) windows; the RMS result to be not saved or saved in a logger’s file .................................................5-11
TRIGGER SETUP selected in the INPUT list and the TRIGGER SETUP window ...............................................5-12
MEASURE TRIGGER windows .............................................................................................................................5-12
MEASURE TRIGGER window; TRIGGER switched off .......................................................................................5-12
Displays during the measurements while the triggering condition is not fulfilled....................................................5-12
MEASURE TRIGGER windows with the SLOPE modes selected .........................................................................5-13
MEASURE TRIGGER windows with the LEVEL modes selected .........................................................................5-13
MEASURE TRIGGER window with the GRAD + mode selected ..........................................................................5-13
MEASURE TRIGGER windows with not active SOURCE signal line ...................................................................5-13
MEASURE TRIGGER windows with the SOURCE signal selection......................................................................5-14
MEASURE TRIGGER windows with the LEVEL selection in the SLOPE + mode ...............................................5-14
MEASURE TRIGGER windows with the LEVEL selection in the SLOPE – mode (10 dB step down).................5-14
MEASURE TRIGGER windows with the LEVEL selection in the LEVEL + mode (1 dB step up) .......................5-14
MEASURE TRIGGER windows with the LEVEL selection in the GRAD + mode (1 dB step down)....................5-15
MEASURE TRIGGER windows with the GRADIENT selection (1 dB/ms and 10 dB/ms step up) .......................5-15
LOGGER SETUP windows, trigger mode selection................................................................................................5-16
LOGGER TRIGGER windows with the not active SOURCE signal line ................................................................5-16
LOGGER TRIGGER windows with the LEVEL selection (1 dB step up) ..............................................................5-16
LOGGER TRIGGER windows with the LEVEL selection (1 dB step up, cont.) ....................................................5-16
LOGGER TRIGGER windows with the LEVEL selection (10 dB step up) ............................................................5-17
LOGGER TRIGGER windows with the PRE selection ...........................................................................................5-17
LOGGER TRIGGER windows with the PRE selection for different LOGGER STEPS .........................................5-17
LOGGER TRIGGER windows with the POST selection.........................................................................................5-18
LOGGER TRIGGER windows with the POST selection for different LOGGER STEPS.......................................5-18
LOGGER TRIGGER windows with the POST selection for different LOGGER STEPS.......................................5-18
TRIGGER SETUP window; the RECORDER TRIGGER text highlighted ............................................................5-19
RECORDER TRIGGER windows; the TRIGGER selection...................................................................................5-19
RECORDER TRIGGER windows; the source selection for SLOPE + (a) and SLOPE – (b) ..................................5-19
RECORDER TRIGGER windows with the LEVEL selection, level expressed in linear units, 1 dB step up (a)
and 10 dB step up (b)....................................................................................................................................5-20
RECORDER TRIGGER windows with the GRADIENT selection (1 dB step up) .................................................5-20
RECORDER TRIGGER windows with the GRADIENT selection (10 dB step up) ...............................................5-20
FFT selected in the INPUT list and the FFT window opened ..................................................................................5-21
FFT window; the BAND selection...........................................................................................................................5-21
FFT sublist; the WINDOW selection.......................................................................................................................5-22
FFT window; the LINES selection...........................................................................................................................5-22
FFT window; the LOGGER activation ....................................................................................................................5-22
SPECTRUM selected in the INPUT list and the SPECTRUM window opened......................................................5-23
SPECTRUM window; the LOGGER selection........................................................................................................5-23
ENVELOPING selected in the INPUT list and the ENVELOPING window opened .............................................5-24
ENVELOPING window; the FILTER selection ......................................................................................................5-24
ENVELOPING window; the BAND selection.........................................................................................................5-25
ENVELOPING window; the LINES selection.........................................................................................................5-25
RPM selected in the INPUT list and the RPM window opened...............................................................................5-25
RPM window; the RPM selection ............................................................................................................................5-26
RPM window; the PULSES/ROTATIONS selection with 1 unit step ....................................................................5-26
RPM window; the PULSES/ROTATIONS selection with 10 unit step ...................................................................5-26
RPM window; the UNIT selection ...........................................................................................................................5-26
Display in the main list; the DISPLAY text highlighted (displayed inversely) ..........................................................6-1
Display with the DISPLAY list ..................................................................................................................................6-1
DISPLAY MODES windows in VM .........................................................................................................................6-2
Display in the LOGGER mode when there is nothing in the logger to be displayed (after setting LOGGER as
active) .............................................................................................................................................................6-2
Measurement results in VM presented in one profile mode .......................................................................................6-3
Measurement results in VM and unknow profile presented with the biggest fonts in one profile mode ....................6-3
Displays during the measurement performed in VM with the active LOGGER (an envelope icon) ..........................6-4
1-7
SVAN 956 USER MANUAL
_
DISPLAY MODES windows, SPECTRUM position accessible............................................................................... 6-4
Displays in SPECTRUM mode for 1/1 OCTAVE (a), 1/3 OCTAVE (b) and FFT (c) ............................................. 6-4
Setting on and off the accessibility of three profiles presentation mode .................................................................... 6-5
Measurement results in 3 PROFILES mode .............................................................................................................. 6-5
Results in 3 PROFILES mode; selection of the result in a profile ............................................................................. 6-5
Results in 3 PROFILES mode; selection of the profile.............................................................................................. 6-5
Displays during the measurement performed with the active LOGGER (envelope icon).......................................... 6-6
Displays during the measurement performed in LEVEL METER mode with the active LOGGER (the first
three) and after saving the results (the last one).............................................................................................. 6-6
Setting on and off the accessibility of LOGGER presentation mode ......................................................................... 6-6
Exemplary displays with the measurement results saved in the logger ...................................................................... 6-7
Setting on and off the file description presentation mode.......................................................................................... 6-7
Exemplary contents of the FILE INFO window ........................................................................................................ 6-7
DISPLAY list with the DISPLAY SETUP selected .................................................................................................. 6-8
DISPLAY SETUP windows in VLM (a) in 1/1 and 1/3 OCTAVE (b) and in FFT (c) ............................................. 6-8
Displays with the possible options of the vibration SCALE ...................................................................................... 6-8
Measurement results presented in linear [mm/s2] (a) and logarithmic [dB] (b) scale................................................ 6-8
Displays with the possible values of the DYNAMIC parameter................................................................................ 6-9
Displays with the results stored in the logger presented with different DYNAMIC parameter ................................. 6-9
DISPLAY SCALE windows; the X–ZOOM selection .............................................................................................. 6-9
Displays in 1/1 OCTAVE SPECTRUM 3x, 4x, and 5x X–ZOOM ........................................................................... 6-9
Displays in 1/3 OCTAVE SPECTRUM 2x, 3x, 4x, and 5x X–ZOOM ..................................................................... 6-9
Displays in FFT SPECTRUM 1x, 2x, 3x, 4x, and 5x X–ZOOM ............................................................................ 6-10
Displays with the grid switched on and off .............................................................................................................. 6-10
Displays with the grid switched on and off .............................................................................................................. 6-10
DISPLAY SETUP window; the SPECTRUM TYPE text highlighted .................................................................... 6-10
SPECTRUM TYPE windows with the available values.......................................................................................... 6-11
DISPLAY SETUP window; the SPECTRUM VIEW text highlighted.................................................................... 6-11
SPECTRUM VIEW windows; the VIEW selection ................................................................................................ 6-11
SPECTRUM VIEW windows; the TYPE selection................................................................................................. 6-11
SPECTRUM VIEW windows, the MAX selection.................................................................................................. 6-12
SPECTRUM VIEW windows; the MIN selection................................................................................................... 6-12
DISPLAY SETUP window; the TOTAL VALUES text highlighted ...................................................................... 6-12
TOTAL VALUES windows; the weighting filters selection in SM......................................................................... 6-12
TOTAL VALUES windows in VM; the TOTALx selected .................................................................................... 6-13
TOTAL x windows; the weighting filters selection in VM...................................................................................... 6-13
TOTALx windows; the TYPE selection .................................................................................................................. 6-13
TOTALx windows; CALIBRATION FACTOR setting .......................................................................................... 6-14
DISPLAY SETUP windows, the LOGGER VIEW text highlighted ....................................................................... 6-14
LOGGER VIEW windows with the possible values of the VIEW parameter ......................................................... 6-14
Displays with the possible values of the VIEW parameter ...................................................................................... 6-14
LOGGER VIEW windows with the possible values of the TIME parameter .......................................................... 6-14
Displays with the possible values of the TIME parameter....................................................................................... 6-15
DISPLAY list; the LOGGER VIEW text highlighted ............................................................................................. 6-15
Displays in the LOGGER VIEW sub-list ................................................................................................................ 6-15
Displays in the LOGGER VIEW sub-list; the selection of the file to be seen ......................................................... 6-16
Displays in the LOGGER VIEW sub-list; the scrolling of the file to be seen.......................................................... 6-16
Display in the LOGGER VIEW sub-list in the case when the files do not exist...................................................... 6-16
Displays with the selected logger’s file; the change of the cursor position.............................................................. 6-16
Display with the selected logger file the scrolling to the left ................................................................................... 6-16
Displays with the selected logger’s file; the change of the axis relation .................................................................. 6-17
Displays with the selected logger’s file; the change of the profile........................................................................... 6-17
Displays with the selected logger’s file; the change of the result from a profile...................................................... 6-17
DISPLAY list; the SCREEN SETUP text highlighted ............................................................................................ 6-17
SCREEN SETUP windows; the change of the contrast........................................................................................... 6-18
SCREEN SETUP windows; the BACKLIGHT TIMEOUT active (a), and not active (b) ...................................... 6-18
DISPLAY list; the BATTERY text highlighted ...................................................................................................... 6-18
BATTERY windows for different sources powering the instrument ....................................................................... 6-19
DISPLAY list; the UNIT LABEL text highlighted.................................................................................................. 6-19
1-8
SVAN 956 USER MANUAL
UNIT LABEL windows opened and after scrolling with the <>, <> push-buttons .........................................6-19
Main list; the FILE text highlighted (displayed inversely) .........................................................................................7-2
FILE list of the instrument .........................................................................................................................................7-3
SAVE window in the FILE list...................................................................................................................................7-3
Display during the process of setting the character in the edited name ......................................................................7-3
Display during the selection of the character’s position to be edited .........................................................................7-4
Display during the selection of the character .............................................................................................................7-4
FILE NAME edition after pressing the <SHIFT> and <
> push-buttons .................................................................7-4
FILE NAME edition after pressing the <SHIFT> and <
> push-buttons .................................................................7-4
Displays during the attempt of overwriting the existing file, changing the name and saving data .............................7-5
Displays in the simplified edition of the file name and the execution of the saving operation...................................7-5
Displays in the simplified edition of the file name, saving and the “saturation” of that operation .............................7-5
Displays after the attempt to perform unavailable saving operation and the return to the SAVE NEXT...................7-5
Display after the SAVE operation when there were no results for storing .................................................................7-6
View of all displays during and after the execution of the SAVE operation ..............................................................7-6
Displays after the attempt to overwrite a file if the REPLACE is not active..............................................................7-6
FILE list with the SAVE OPTIONS text highlighted (displayed inversely) ..............................................................7-7
SAVE OPTIONS sub-list; the selection of the RAM FILE .......................................................................................7-7
SAVE OPTIONS sub-list; the selection of the REPLACE ........................................................................................7-8
Displays during the file saving when the REPLACE is switched off and on .............................................................7-8
SAVE OPTIONS sub-list; the selection of the AUTO SAVE ...................................................................................7-8
Displays during the execution of the AUTO SAVE switching on; the FILE NAME skipping and return to the
SAVE OPTION sub-list..................................................................................................................................7-9
Display after attempt of switching on AUTO SAVE option with too short INT. PERIOD .......................................7-9
Displays during the execution of the AUTO SAVE switching on; the FILE NAME confirmation and return to
the FILE list ....................................................................................................................................................7-9
Displays after the incorrect file name edition.............................................................................................................7-9
Measurement results presented after pressing the <
> or <
> push-buttons ........................................................7-10
Results saved from a profile presented after pressing the <
> or <
> and <ALT> push-buttons..........................7-10
Results saved from a profile presented after pressing the <
> or <
> and <ALT> push-buttons..........................7-10
SAVE OPTIONS sub-list; the selection of the DIRECT SAVE ..............................................................................7-11
Display after the attempt to perform an unavailable operation during measurement in progress.............................7-11
Exemplary executions of the software with the DIRECT SAVE not active.............................................................7-11
Exemplary executions of the software with the DIRECT SAVE active...................................................................7-11
SAVE OPTIONS sub-list; the selection of the SAVE MAX SPECT. .....................................................................7-12
SAVE OPTIONS sub-list; the selection of the SAVE MIN SPECT........................................................................7-12
FILE list with the LOAD text highlighted (displayed inversely)..............................................................................7-12
Display after the attempt to perform an unavailable operation during measurement in progress.............................7-13
Display during the execution of the LOAD operation..............................................................................................7-13
Exemplary contents of the LOAD window ..............................................................................................................7-13
Exemplary result files associated with the same logger file (&LOG2) ....................................................................7-14
Display during the execution of the loading function...............................................................................................7-14
Displays after the execution of the LOAD operation ...............................................................................................7-14
Exemplary displays during the loading and checking the contents of a 1/1 OCTAVE file ......................................7-14
FILE list with the DELETE text highlighted (displayed inversely)..........................................................................7-15
RESULT FILES selected to be deleted and the flash memory does not contain any file.........................................7-15
Display after the attempt to perform an unavailable operation during measurement in progress.............................7-15
Selection of the RESULT FILES to be deleted........................................................................................................7-16
Execution of the RESULT FILES deletion ..............................................................................................................7-16
Execution of the @EXAMP4 file deletion and the influence of this process on the memory space ........................7-17
Execution of the @EXAMP5 file deletion and the influence of this process on the memory space ........................7-17
LOGGER FILES selected to be deleted and the memory does not contain any file ................................................7-17
Display after the attempt to perform an unavailable operation during measurement in progress.............................7-18
Selection of the LOGGER FILES to be deleted.......................................................................................................7-18
Execution of the LOGGER FILES deletion .............................................................................................................7-18
Execution of the &LOG107 file deletion from the logger memory and its influence on the memory space
(LOGGER AVAILABLE) ............................................................................................................................7-19
Execution of the &LOG113 file deletion and the influence of this process on the memory space...........................7-19
SETUP FILES selected to be deleted and the instrument’s memory does not contain any file................................7-19
1-9
SVAN 956 USER MANUAL
_
Display after the attempt to perform an unavailable operation during measurement in progress............................. 7-20
Selection of the SETUP FILES to be deleted .......................................................................................................... 7-20
Execution of the RESULT FILES deletion.............................................................................................................. 7-20
Execution of the @SET3 file deletion and its influence on the memory space........................................................ 7-21
Execution of the @SET8 file deletion and the influence of this process on the memory space............................... 7-21
DELETE ALL text highlighted (displayed inversely) in the FILE list .................................................................... 7-21
RESULT FILES selected to the execution of the DELETE ALL operation............................................................ 7-21
Display after the attempt to perform an unavailable operation during measurement in progress............................. 7-22
Displays with the confirmation window during the execution of the DELETE ALL operation............................... 7-22
Execution of the DELETE ALL operation in the case of RESULT FILES selection.............................................. 7-22
LOGGER FILES selected to the execution of the DELETE ALL operation........................................................... 7-22
Display after the attempt to perform an unavailable operation during measurement in progress............................. 7-23
Displays with the confirmation window during the execution of the DELETE ALL operation............................... 7-23
Execution of the DELETE ALL operation in the case of LOGGER FILES selected .............................................. 7-23
SETUP FILES selected to the execution of the DELETE ALL operation............................................................... 7-23
Display after the attempt to perform an unavailable operation during measurement in progress............................. 7-24
Displays with the confirmation window during the execution of the DELETE ALL operation............................... 7-24
Execution of the DELETE ALL operation in the case of SETUP FILES selection................................................. 7-24
Execution of the DELETE ALL operation for all type files simultaneously............................................................ 7-24
DEFRAGMENTATION text highlighted (displayed inversely) in the FILE list..................................................... 7-25
FILES DEFRAGMENT. selected to the execution of the DEFRAGMENTATION operation ............................... 7-25
Confirmation windows during the execution of the FILES DEFRAGMENTATION operation ............................. 7-26
Display after the attempt to perform an unavailable operation during measurement in progress............................. 7-26
Message in the case when the execution of the DEFRAGMENTATION operation is unnecessary........................ 7-26
Execution of the DEFRAGMENTATION operation............................................................................................... 7-26
Result of the FILES DEFRAGMENTATION operation ......................................................................................... 7-27
LOGGER DEFRAGMENT. selected to the execution of the DEFRAGMENTATION operation ......................... 7-27
Confirmation windows during the execution of the LOGGER DEFRAGMENTATION operation........................ 7-27
Display after the attempt to perform an unavailable operation during measurement in progress............................. 7-27
Message in the case when the execution of the DEFRAGMENTATION operation is unnecessary........................ 7-28
Execution of the DEFRAGMENTATION operation............................................................................................... 7-28
Result of the LOGGER DEFRAGMENTATION operation ................................................................................... 7-28
CATALOGUE text highlighted (displayed inversely) in the FILE list.................................................................... 7-28
CATALOGUE window when the memory is empty................................................................................................ 7-29
Contents of the CATALOGUE window .................................................................................................................. 7-29
Exemplary result files associated with the same logger file &LOG2 in the CATALOGUE window ...................... 7-30
FREE SPACE text highlighted (displayed inversely) in the FILE list ..................................................................... 7-30
FREE SPACE window after the execution of the DELETE ALL operation ........................................................... 7-30
FREE SPACE window with the number depending on the measurements and operations performed .................... 7-31
SAVE SETUP text highlighted (displayed inversely) in the FILE list..................................................................... 7-31
SAVE SETUP window in the FILE list ................................................................................................................... 7-31
Display during the process of setting the character in the edited name.................................................................... 7-31
Display during the selection of the character’s position to be edited....................................................................... 7-32
Display during the selection of the character ........................................................................................................... 7-32
Displays in the FILE NAME edition after pressing the <SHIFT> and <
> push-buttons ..................................... 7-32
Displays in the FILE NAME edition after pressing the <SHIFT> and <
> push-buttons ...................................... 7-32
Displays during the attempt of overwriting the existing file, changing the name and saving data ........................... 7-33
Displays in the simplified edition of the setup file name and saving operation execution ....................................... 7-33
Displays in the simplified edition of the file name, saving and the “saturation” of that operation........................... 7-33
Displays after the attempt to perform unavailable saving operation; the return to the SAVE SETUP .................... 7-34
View of all displays during and after the execution of the SAVE operation............................................................ 7-34
Displays after the attempt to overwrite a file if the REPLACE is active ................................................................. 7-34
FILE list with the LOAD SETUP text highlighted (displayed inversely) ................................................................ 7-35
Display after the attempt to perform an unavailable operation during measurement in progress............................. 7-35
Display during the execution of the LOAD SETUP operation ................................................................................ 7-35
Exemplary contents of the LOAD SETUP window................................................................................................. 7-35
Displays after the execution of the LOAD SETUP operation.................................................................................. 7-36
FILE list with the DIRECTORY text selected (a) and the DIRECTORY window opened (b) ............................... 7-36
FILE list, the DIRECTORY window....................................................................................................................... 7-36
1-10
SVAN 956 USER MANUAL
FILE list with the COPY FILES TO USB text selected (a) and the COPY FILES window opened (b) ..................7-37
RESULT FILES selection to the execution of the COPY FILES TO USB operation (a); the RESULT,
LOGGER and SETUP files selected to the execution of the COPY FILES TO USB operation (b).............7-37
Display after the attempt to perform an unavailable operation during measurement in progress.............................7-37
Display after the execution of COPY FILES TO USB operation (a) and when the file exists already (b) ..............7-37
FILE list with the MOVE FILES TO USB text selected (a) and the MOVE FILES window opened (b)................7-38
RESULT FILES selection to the execution of the MOVE FILES TO USB operation (a) the RESULT,
LOGGER and SETUP files selected to the execution of the MOVE FILES TO USB operation (b) ...........7-38
Display after the attempt to perform an unavailable operation during measurement in progress.............................7-38
Display after the execution of MOVE FILES TO USB operation (a) and when the file already exists in the
USB memory (b)...........................................................................................................................................7-39
Display in the main list; the REPORT text highlighted (displayed inversely)............................................................8-1
SETUP list with the USB–HOST PORT selected and this window with the activated RS232..................................8-1
SETUP list with the RS232 selected and the exemplary contents of this window .....................................................8-1
REPORT list ..............................................................................................................................................................8-2
REPORT windows with the TITLE selected .............................................................................................................8-3
Displays in the text edition of the report’s header......................................................................................................8-3
Displays with all available characters ........................................................................................................................8-3
Displays with all available characters (cont.) .............................................................................................................8-3
REPORT windows with the PRINT RESULTS selected ...........................................................................................8-4
Display after the attempt to perform an unavailable operation during measurement in progress...............................8-4
Display in the REPORT list; the execution of the PRINT RESULTS .......................................................................8-4
Example of the printed results - A5 format ................................................................................................................8-5
Example of the printed results from the VLM mode - A4 format ..............................................................................8-6
Displays with the confirmation request of the paper ejection.....................................................................................8-6
Displays during the results printing when there is no transfer (a) and no data (b) .....................................................8-6
REPORT windows with the PRINT FILE selected....................................................................................................8-6
Display after the attempt to perform an unavailable operation during measurement in progress...............................8-7
Display in the REPORT list; the PRINT FILE position when no files were saved ....................................................8-7
Displays during the selection of the file to be printed ................................................................................................8-7
Display during the execution of the PRINT FILE operation......................................................................................8-7
Display during the file sending out when there is no data transfer .............................................................................8-7
Example of the printed file from the VIBRATION LEVEL METER mode - format A5 ..........................................8-8
REPORT windows with the PRINT LOGGER selected ............................................................................................8-9
PRINT LOGGER window opened - Function not available message........................................................................8-9
REPORT windows with the PRINT USER FILTERS selected .................................................................................8-9
Display after the attempt to perform an unavailable operation during measurement in progress...............................8-9
PRINT USER FILTERS windows; the user filter selection.......................................................................................8-9
Display in the REPORT list; the execution of the PRINT USER FILTERS............................................................8-10
Example of the printed coefficients of the user filter S1- format A4........................................................................8-10
Example of the printed coefficients of the user filter S2 - format A5.......................................................................8-11
REPORT windows with the PRINT CATALOGUE selected ..................................................................................8-11
Display after the attempt to perform an unavailable operation during measurement in progress.............................8-11
Display in the REPORT list; the execution of the PRINT CATALOGUE ..............................................................8-11
Displays with the confirmation request of the paper ejection...................................................................................8-12
Example of the printed catalogue - format A4 .........................................................................................................8-12
Example of the printed catalogue - format A5 .........................................................................................................8-12
Display during the catalogue printing when there is no data transfer.......................................................................8-13
REPORT windows with the OPTION selected ........................................................................................................8-13
OPTIONS windows; the selection of the format ......................................................................................................8-13
OPTIONS windows; the selection of the paper ejection ..........................................................................................8-14
Displays with the request for the confirmation of the paper ejection .......................................................................8-14
Display after a printing when there is not possible to eject a paper .........................................................................8-14
Display in the main list; the SETUP text highlighted (displayed inversely)...............................................................9-1
SETUP list .................................................................................................................................................................9-2
SETUP list; the LANGUAGE text highlighted (displayed inversely)........................................................................9-2
Language windows with all available languages ........................................................................................................9-2
Displays with the English version of the user interface..............................................................................................9-2
Displays with the Italian version of the user interface................................................................................................9-2
1-11
SVAN 956 USER MANUAL
_
Displays with the Polish version of the user interface................................................................................................ 9-3
Displays with the Hungarian version of the user interface......................................................................................... 9-3
Displays with the Flemish version of the user interface............................................................................................. 9-3
Displays with the French version of the user interface .............................................................................................. 9-3
Displays with the Spanish version of the user interface ............................................................................................. 9-3
Displays with the German version of the user interface............................................................................................. 9-3
Displays with the Turkish version of the user interface ............................................................................................. 9-3
Displays during the entering of the access code to the Russian version of the user interface .................................... 9-4
Displays with the Russian version of the user interface available only on some markets .......................................... 9-4
SETUP list; the CLEAR SETUP text highlighted (displayed inversely) ................................................................... 9-4
Displays with the request for the confirmation for the CLEAR SETUP execution.................................................... 9-4
Displays during and after the execution of the CLEAR SETUP function.................................................................. 9-4
SETUP list, the EXTERNAL I/O SETUP text highlighted ....................................................................................... 9-5
EXTERNAL I/O SETUP windows; the MODE selection ......................................................................................... 9-5
EXTERNAL I/O SETUP windows; D/A selection.................................................................................................... 9-5
EXTERNAL I/O SETUP windows; the source selection for D/A option.................................................................. 9-6
MEASURE TRIGGER windows; the EXT. I/O selection......................................................................................... 9-6
EXTERNAL I/O SETUP windows; the FUNCTION selection................................................................................. 9-6
EXTERNAL I/O SETUP windows; the POLARISATION selection........................................................................ 9-7
EXTERNAL I/O SETUP windows; the ACTIVE LEVEL selection......................................................................... 9-7
EXTERNAL I/O SETUP windows; the SOURCE selection ..................................................................................... 9-7
EXTERNAL I/O SETUP windows; the ALARM LEVEL setting............................................................................. 9-8
SETUP list, the HUMAN VIB. text highlighted (displayed inversely) ..................................................................... 9-8
Displays during the entering of the access code to a function.................................................................................... 9-8
SETUP list, the IEPE CURRENT text highlighted (displayed inversely) ................................................................. 9-8
IEPE CURRENT windows; the IEPE supply selection ............................................................................................. 9-9
SETUP list, the REFERENCE LEVELS text highlighted (displayed inversely) ....................................................... 9-9
REFERENCE LEVELS windows; the reference level setting of acceleration signal ................................................ 9-9
REFERENCE LEVEL windows; setting the reference level of velocity signal....................................................... 9-10
REFERENCE LEVELS windows; setting the reference level of displacement signal ............................................ 9-10
SETUP list, the REMOTE COMMUNICATION text highlighted (displayed inversely) ....................................... 9-10
REMOTE COMMUNICATION windows; the TYPE selection ............................................................................. 9-10
REMOTE COMMUNICATION windows; packet size selection ........................................................................... 9-11
SETUP list with the RMS INTEGRATION text highlighted (displayed inversely) ................................................ 9-11
Displays and with the available options of the RMS INTEGRATION.................................................................... 9-11
SETUP list, the RPM MEASUREMENT text highlighted (displayed inversely).................................................... 9-12
Displays during the entering of the access code to a function.................................................................................. 9-12
INPUT list after activation of the RPM MEASUREMENT function...................................................................... 9-12
SETUP list, the RS232 text highlighted (displayed inversely) ................................................................................ 9-12
RS232 windows; the possible settings of the BAUD RATE.................................................................................... 9-13
RS232 window; the setting of the TIME OUT with 1-second step.......................................................................... 9-13
RS232 window; the setting of the TIME OUT with 10-seconds step ...................................................................... 9-13
SETUP list, the RTC text highlighted (displayed inversely) ................................................................................... 9-13
RTC windows with the different parameters to be set ............................................................................................. 9-14
SETUP list, the SHIFT MODE text highlighted (displayed inversely) ................................................................... 9-14
SHIFT MODE windows; the available SHIFT settings ........................................................................................... 9-15
SHIFT MODE windows; the available ST/SP settings............................................................................................ 9-15
SETUP list, the SIGNAL GENERATOR selected (highlighted inversely) ............................................................. 9-15
Display in the opened SIGNAL GENERATOR window ........................................................................................ 9-15
SETUP list, the TIMER text highlighted (displayed inversely)............................................................................... 9-16
TIMER windows; the mode selection...................................................................................................................... 9-16
TIMER windows; setting day of the instrument’s switch on ................................................................................... 9-17
TIMER windows; setting hour and minute of the instrument’s switch on ............................................................... 9-17
TIMER windows; setting REPETITION parameter ................................................................................................ 9-18
Exemplary settings made for the desired execution of the TIMER function ........................................................... 9-18
Counting down during the warming up of the instrument after switching it on ....................................................... 9-18
Displays during the executing of the TIMER function (timer icon is active) .......................................................... 9-18
SETUP list, the USB–HOST PORT text highlighted (displayed inversely) ............................................................ 9-19
Displays in the USB–HOST PORT ......................................................................................................................... 9-19
1-12
SVAN 956 USER MANUAL
Displays during the entering of the access code to SRT RECORDING, WAVE RECORDING or
EVENT RECORDING .................................................................................................................................9-19
Displays with the different USB disk warnings........................................................................................................9-20
Contents of the DIRECTORY window ....................................................................................................................9-21
Displays during the IrDA interface connection ........................................................................................................9-21
SETUP list, the USER FILTERS text highlighted (displayed inversely).................................................................9-22
USER FILTERS windows, REAL TIME FILTERS selected (a), SPECTRUM BASED FILTERS selected (b)....9-22
USER FILTERS windows, REAL TIME FILTERS selected ..................................................................................9-22
Displays during the entering of the access code to REAL TIME FILTERS ............................................................9-22
REAL TIME FILTERS windows, the filter selection ..............................................................................................9-23
R1 filter windows, the TYPE selection ....................................................................................................................9-23
R1 filter windows, the HFC(3dB) selection for a LOWPASS filter.........................................................................9-23
R1 filter windows, the LFC(3dB) selection for a HIGHPASS filter ........................................................................9-23
R1 filter windows, the LFC(3dB) selection and the HFC(3dB) selection for BANDPASS filter ............................9-24
USER FILTERS windows, SPECTRUM BASED FILTERS selected ....................................................................9-24
SPECTRUM BASED FILTERS window, the VIEW text highlighted ....................................................................9-25
VIEW windows, the filter selection .........................................................................................................................9-25
S1 filter windows .....................................................................................................................................................9-25
SPECTRUM BASED FILTERS window, the EDIT text highlighted......................................................................9-25
EDIT windows, the filter selection...........................................................................................................................9-25
S1 filter windows; the coefficient selection..............................................................................................................9-26
SPECTRUM BASED FILTER window; the CLEAR position selected ..................................................................9-26
CLEAR windows, the selection of the filters to be cleared ......................................................................................9-26
Displays during and after the execution of CLEAR operation .................................................................................9-27
SETUP list, the VIBRATION UNITS text highlighted (displayed inversely) .........................................................9-27
VIBRATION UNITS windows with the available positions ...................................................................................9-27
SETUP list, the WARNINGS text highlighted (displayed inversely) ......................................................................9-27
WARNINGS windows; RESULTS NOT SAVED selected.....................................................................................9-28
Displays with LAST RESULTS NOT SAVE warning ............................................................................................9-28
WARNINGS windows; USB DISK FREE SP. selected ..........................................................................................9-28
WARNINGS windows; MIN FREE SPACE selection ............................................................................................9-28
Display with USB DISK FREE SPACE warning.....................................................................................................9-29
1-13
SVAN 956 USER MANUAL
1
INTRODUCTION
The SVAN 956 is digital, Type 1 vibration level meter along with analyser. The instrument is
intended to general vibration measurements, machinery condition monitoring, occupational health and
safety monitoring. It can be used by consutants, maintenance services and industry R&D departments etc.
Instrument provides parallel acceleration, velocity, displacement measurements. Three vibration
profiles allow parallel measurements with independently defined filters and RMS detector time constants.
Each profile provides significant number of results (like RMS, PEAK, Peak-Peak, VDV, MTVV or Max).
Advanced time history logging for each profile provides complete information about measured signal in
non-volatile 32 MB internal memory or external USB Memory Stick and can be easy downloaded to any
PC using the USB interface and SvanPC+ software.
All required weighting filters (e.g.: Wk, Wd, Wc, Wj, Wm, Wh for Human Vibration measurement,
Wg, Wb or VelMF for machine diagnostic measurements) including the latest ISO 2631-1&2 and ISO
10816 standards are available with this instrument. The RMQ detector enables direct measurement of the
Vibration Dose Value (VDV).
Using computational power of its digital signal processor the SVAN 956 instrument can,
simultaneously additionally perform real time FFT analysis, 1/1 OCTAVE analysis or 1/3 OCTAVE
analysis and sophisticated enveloping analysis. The SVAN 956 offers also RPM measurement with
Monarch laser tachometer parallel to the vibration measurement.
The time domain signal recording on the external USB memory stick is also available as an option.
The instrument can be controlled and the measuerement results can be also downloaded to any PC
using the RS232 or IrDA interfaces.
. The instrument is powered from four AA standard or rechargeable batteries (i.e. NiMH - separate
charger is required). The powering of the instrument from the External DC power source or the USB
interface is also provided. Robust case and light weight design accomplish the exceptional features of this
new generation instrument.
1.1
SVAN 956 as Vibration Meter & Analyser
•
General vibration measurements (acceleration, velocity and displacement) and optionally HVM
meeting ISO 8041:2005 and ISO 10816-1 standards in the frequency range depends on the
parameters of the attached accelerometer, i.e. with DYTRAN 3185D general purpose transducer
is equal to 2Hz ÷ 8 kHz
•
parallel RMS, VDV, MTVV (or MAX), PEAK, PEAK–PEAK
•
Z, HP1, HP3, HP10, KB, Wk, Wd, Wc, Wj, Wm, Wh (ISO 5349), Wg (ISO 2631), Wb weighting
filters
•
1/1 OCTAVE and 1/3 OCTAVE real time analysis (optional) - 15 filters with centre frequencies
1 Hz ÷16 kHz, Type 1 – IEC 61260 and 45 filters with centre frequencies 0.8 Hz ÷ 20 kHz, Type 1
– IEC 61260
•
optional FFT spectra calculation (1920 lines in real time up to 22.4 kHz with Hanning, rectangle,
flat top or Kaiser-Bessel window and linear averaging) parallel to the VLM operation
1.2
General features of SVAN 956
•
Advanced Data Logger including spectra's logging on the USB Memory Stick providing almost
unlimited logging capacity
•
Time domain signal recording (option)
•
Advanced trigger and alarm functions
•
USB 1.1 Host & Client interface (real time PC "front end" application supported)
1-1
SVAN 956 USER MANUAL
1.3
•
RS 232 and IrDA interfaces (options)
•
Built-in signal generator (option)
•
Integration time programmable up to 24 h
•
Power supply by four AA rechargeable or standard batteries
•
Hand held, light weight and robust case
•
Easy in use
Accessories included
• GRAS 40AE - prepolarised ½” microphone with nominal sensitivity 50 mV/Pa
• SV 3185D accelerometer with SC 27 cable
• SC 16 - USB 1.1 cable
• SC 59 - I/O cable
• SC 61 integrated connector
• four AA batteries
• SvanPC+ for windows 2000/XP software
1.4
Accessories available
• SA 17A - external battery pack
• SA 27/ 3185 – mounting magnet for the accelerometer
• SA 18 - Carrying bag for SVAN 95x and accessories (leather)
• SA 43 - carrying case for SVAN 95x and accessories
• SA 45 - carrying case for SVAN 9xx and accessories (waterproof)
• SA 46 - carrying belt-bag for SVAN 94x and SVAN 95x (leather)
• SA 47 - carrying bag for SVAN 95x and accessories (fabric material)
• SV 55 - RS 232 option for the SVAN 955
1.5
Software options available
SVAN956
Vibration Meter & FFT Analyser
SVAN956_WA
SVAN 956 without accelerometer and SC 27 cable
SVAN956_1
SVAN 956 including 1/1 & 1/3 octave
SVAN956_1WA SVAN 956_WA including 1/1 & 1/3 oct.
SV 956_3
1/1 & 1/3 octave analysis option
SV 956_8
Rotation measurement option including Laser Tachometer
SV 956_9
Human Vibration filters option
SV 956_11
Enveloping analysis option
SV 956_15
Time domain signal recording option
SV 956_16
User programmable second order band pass filters
1-2
_
SVAN 956 USER MANUAL
Notice: The software options can be purchased in any time as only the introduction of the
special code is required for their activation.
SVAN 956 instrument with the accelerometer and tachometer
1.6
Current list of SVAN 956 options and accessories
The current list of the SVAN 956 options and accessories are presented below:
SVAN956
Vibration Meter & FFT Analyser
SVAN956_WA
SVAN 956 without accelerometer and SC 27 cable
SVAN956_1
SVAN 956 including 1/1 & 1/3 octave
SVAN956_1WA SVAN 956_WA including 1/1 & 1/3 oct.
SV 956_3
1/1 & 1/3 octave analysis option
SV 956_8
Rotation measurement option including Laser Tachometer
SV 956_9
Human Vibration filters option
SV 956_11
Enveloping analysis option
SV 956_15
Time domain signal recording option
SV 956_16
User programmable second order band pass filters
SV 55
RS232 interface option for the SVAN 95x except SVAN 954
1-3
SVAN 956 USER MANUAL
SV 56
IrDA interface option for the SVAN 95x except SVAN 954
SV 3185D
100 mV/g, TNC top connector, 1/4-28 mounting hole, general purpose accelerometer
SC 27
TNC (plug) to TNC (plug) coil cable (2 m)
SC 59
LEMO 2 pin (plug) to 2 x BNC sockets
SA 18
Carrying bag for SVAN 95x and accessories (leather)
SA 27/3185D
Mounting magnet for the accelerometer
SA 45
Carrying case for SVAN 95x and accessories (waterproof)
SA 46
Carrying belt-bag for SVAN 95x (leather)
SA 47
Carrying bag for SVAN 95x and accessories (fabric material)
SA 48
Carrying case for SVAN 958 and accessories (waterproof) by PROTECTOR
1-4
_
SVAN 956 USER MANUAL
2
MANUAL CONTROL OF THE INSTRUMENT
The control of the instrument is developed in the fully conversational way. The user can operate
the instrument by selecting the proper position from the MENU list. Thanks to that, the number
of the control push-buttons of the instrument is reduced to nine.
2.1
Control push-buttons on the front panel
On the front panel of the instrument, there are located the following control push-buttons:
1. <ENTER>, (<MENU>), [<SAVE>],
2. <ESC>, (<CAL>), [<PAUSE>],
3. <SHIFT>, [Markers]
4. <ALT>, [Markers]
5. <
>,
6. <
>,
7. <
>,
8. <
>,
9. <START / STOP>.
The name given in (...) brackets denotes the second push-button function which is available
after pressing it in conjunction (or in sequence) with the <SHIFT> push-button. For the first two pushbuttons the name given in square brackets […] denotes also the third push-button function which
is available after pressing it in conjunction (or in sequence) with the <ALT> push-button.
Control push-buttons of the SVAN 956 instrument
<SHIFT>
The second function of a push-button (written in red colour on a push-button) can be used when
the <SHIFT> push-button is pressed. This push-button can be used in two different ways:
• as SHIFT in the keyboard (e.g. while typing the filename); both <SHIFT> and the second pushbutton must be pressed in parallel;
2-1
SVAN 956 USER MANUAL
•
_
as 2nd Fun; this push-button can be pressed and released before pressing the second one or
pressed in parallel (while operating in “2nd Fun” mode, see the following notice) with
the second push-button.
The <SHIFT> push-button pressed in conjunction with the <ALT> one enables the user to enter the
Markers on the plots during the measurement.
Notice: The operation of this push-button can be set as the “Shift” mode or the “2nd Fun.”
mode in the SHIFT position (path: MENU / SETUP /SHIFT MODE / SHIFT) - see description of the
SETUP list.
<ALT>
This push-button enables one to choose the third push-button function in case of [<SAVE>] and
[<PAUSE>] push-buttons. In order to select the third function the user must press the <ALT> and
the second push-button simultaneously.
The <ALT> push-button pressed together with the <SHIFT> one enables the user to enter the
Markers on the plots during the measurement.
Notice: The simultaneous pressing of the <ALT> and <START / STOP> push-buttons
switches the instrument on and off.
<START / STOP>
This push-button enables one to start the measurement process, when the instrument is not
measuring or to stop it, when the instrument is in course of the measurement. It is also possible to set
such mode of this push-button, in which in order to start or stop the measurements the user has to press
it simultaneously with the <SHIFT> one.
Notice: The change of the <START / STOP> push-button mode is performed in the
SHIFT MODE window of the SETUP list (see description of the SETUP list).
<ENTER>
This push-button enables one to enter the selected operation mode or to confirm the control
options. Some additional functions of this push-button will be described in the following chapters of this
manual.
(<MENU>)
This push-button (pressed together with the <SHIFT> one) enables the user to enter the main list
containing six sub-lists: FUNCTION, INPUT, DISPLAY, FILE, REPORT and SETUP. Each of
the mentioned above sub-lists consists of the sub-lists, elements and data windows. These main sub-lists
2-2
SVAN 956 USER MANUAL
will be described in details in the following chapters of the manual. Double pressed <MENU> push-button
enters the list containing eight last opened sub-lists. It often speeds up the control of the instrument as the
user has the faster access to the frequently used sub-lists.
[<SAVE>]
This push-button (pressed together with the <ALT> one) enables the user to save measurement
results as a file in the internal instrument’s memory or on the USB memory stick. There are two available
functions: SAVE NEXT - save a file with the name increased by one (e.g. 02JAN0, 02JAN1, 02JAN3) and
SAVE - save a file with the edited name.
<ESC>
This push-button closes the control lists, sub-lists or windows. It acts in opposite to the <ENTER>
push-button. When the window is closed pressing the <ESC> push-button, any changes made in it
are ignored in almost all cases.
([CAL])
This push-button (pressed together with the <SHIFT> one) enters the CALIBRATION sub-list in
which the user can enter one of the available sub-lists (BY SENSITIVITY, BY MEASUREMENT,
LAST CALIBRATION and TEDS).
[<PAUSE>]
This push-button enables one to break the measurement process temporarily. The subsequent
pressing of the <PAUSE> push-button deletes the measurement results from the last one second.
The indicator of the measurement time is counted down after each pressing and the measurement result
from the previous second appears on the display. Up to fifteen last seconds of the measurement
can be cancelled in this way.
<
>, <
>
•
•
•
•
•
•
These push-buttons enable one, in particular, to:
select the options in an active position in the "horizontal direction" (e.g. filter HP1, HP3, HP10,
Integration period: 1s, 2s, 3s, … etc.)
select the measurement result to be displayed (e.g. RMS, OVL, PEAK etc.) in one profile and
3 PROFILES modes of result’s presentation)
control the cursor in LOGGER and SPECTRUM mode of result’s presentation
select the position of the character in the text edition (i.e. in the FILE NAME menu)
switch on/ off the BACKLIGHT of the display (<
>+<
> pressed together)
activate markers 2 and 3
(<
>, <>)
The <>, <
> push-buttons pressed in conjunction (or in sequence) with the <SHIFT> enable one,
in particular, to:
2-3
SVAN 956 USER MANUAL
_
• speed up the changing of the numerical values of the parameters (i.e. the step is increased
from 1 to 10 in the setting of START DELAY - path: MENU / INPUT / MEASUREMENT SETUP /
START DELAY)
• insert or delete a character in the text edition modes
Some other possible reactions of the instrument on the pressing of these push-buttons
will be described in details in the following chapters.
<
>, <
>
•
•
•
•
•
The <
>, <
> push-buttons enable one, in particular, to:
change the mode of result’s presentation
select the proper character from the list in the text edition mode
switch the active sub-list in a list
programme the Real Time Clock (RTC) and TIMER
activate markers 1 and 4
Some other possible reactions of the instrument on the pressing of these push-buttons
will be described in details in the following chapters.
(<
>, <
>)
The <
>, <
> push-buttons pressed in conjunction (or in sequence) with the <SHIFT> enable
one, in particular, to:
• change the relation between the Y-axis and X-axis of all plots presented on the screen
• switch the active profile in 3 PROFILES mode of result’s presentation
Some other possible reactions of the instrument on the pressing of these push-buttons
will be described in details in the following chapters.
[Markers]
The Markers enable the user to mark special events, which occurred during the performed
measurements (i.e. the airplane flight, the dog’s barking, the train’s drive etc.). The logger has to be
switched on (path: MENU / INPUT / MEASUREMENT SETUP / LOGGER On) in order to activate the
markers and one or more logger options (LOGGER PEAK, LOGGER P–P, LOGGER MAX,
LOGGER RMS) in profiles have to be chosen (path: MENU / INPUT / PROFILE x). In order to enter the
marker the user must press <SHIFT> and <ALT> push-buttons simultaneously during the measurement.
The ENTER MARKER window opens and there are four available marker numbers. To choose marker
number 1 the user must press <
> push button (number 2 - <
>, number - 3 <
> and number 4 - <
>).
The ENTER MARKER window closes automatically and chosen marker is activated (after pressing
<SHIFT> + <ALT> again active marker number will be highlighted). In order to switch off the marker,
the user has to open the ENTER MARKER window and press this push-button, which refers to the marker
to be switched off.
The current state of the markers is indicated in the logger’s file (cf. App. B for details) and can be
used to show them using dedicated presentation software.
2-4
SVAN 956 USER MANUAL
Display with the “MARKERS” (after pressing <ALT> and <SHIFT> together)
Displays with the activated markers
The exemplary presentation of the markers on the time history plot is shown below (to view a plot
with markers the user has to transfer data to the proper software).
80
70
60
50
Leq
Marker 1
40
Marker 2
Marker 3
30
Marker 4
20
13:30:00 13:30:09 13:30:17 13:30:26 13:30:35 13:30:43 13:30:52
Time history plot with the indication of the active markers
2-5
SVAN 956 USER MANUAL
2.2
_
Input and output sockets of the instrument
The instrument inputs, called Acceler. and Probe are placed in the centre of the instrument’s top
cover. The accelerometer have to be connected to the instrument using the TNC connector. After plug in
the accelerometer to the measurement input, the screw should be twisted to the light resistance. The full
description of the signals connected to the sockets is given in the Appendix C.
Top cover of the SVAN 956 instrument in 1:1 scale
In the bottom cover there are four sockets, placed from the right to the left as follows: Ext. Pow.,
USB Host, USB Device (USB Client) and I/O.
Bottom cover of the SVAN 956 instrument in 1:1 scale
The USB Device 1.1 interface is the serial interface working with 12 MHz clock. Thanks to its
speed, it is widely used in all PC. In the instrument, the standard 4-pins socket is used described in details
in Appendix C.
The USB Host interface can be used to connect the external USB Memory Stick or USB hard disk,
enabling the device to register virtually infinite sequence of measurement results.
The additional multi purpose input / output socket, called I/O, is a two-pins LEMO socket. On this
socket, in the case when the Analogue Output functionality is selected, the signal from the input of the
analogue / digital converter (before the correction) is available. This signal can be registered using
magnetic recorder or observed on the oscilloscope. The Digital Input as another functionality serves
as the external trigger, while the Digital Output is used to generate the trigger pulse or alarm pulse
from the instrument.
To the Ext. Pow. socket located on the bottom cover of the instrument, dedicated for the connector
type 5.5 / 2.1 mm, the user can connect the external power (110 V / 220 V mains) adapter.
The instrument can be charged from the external DC source (from 6 V to 15 V). The current consumption
depends on the voltage of the power supplier.
Notice: Switch the power off before connecting the instrument to any other device
(e.g. a printer or a Personal Computer).
2-6
SVAN 956 USER MANUAL
Front panel of the SVAN 956 instrument in 1:1 scale
2-7
SVAN 956 USER MANUAL
_
Rear panel of the SVAN 956 instrument in 1:1 scale
2-8
SVAN 956 USER MANUAL
3
SETTING THE INSTRUMENT
In order to perform the measurements using the instrument the user has only to plug-in
the proper transducer and to switch the power on.
Notice: The user has to press the <ALT> and <START / STOP> push-buttons
in parallel in order to switch the power On/Off.
3.1 Basis of the instrument’s control
The instrument is controlled by means of nine push-buttons of the keyboard. Using these pushbuttons one can access all available functions. The functions are placed in the system of lists and sublists. The main list contains the headers of six lists, which also contain sub-lists or positions (elements).
The main list is opened after pressing the <MENU> push-button. This list contains the following lists:
FUNCTION, INPUT, DISPLAY, FILE, REPORT and SETUP. The elements of each list are described
in details in Chapters 4 ÷ 9. Only one list can be accessed at a time, the one which name is highlighted
(displayed inversely). The change of the highlighted line is done after pressing the <>, <> (or <>,
<>) push-buttons.
Displays with the highlighted elements of the main list
After double pressing of the <MENU> push-button the scrolled list of recently accessed menu items
appears on the display. The example of this list is presented below. Such solution enables one
to access the most frequently used lists quickly, without the necessity of passing the whole path.
Display with the recently accessed menu items (after double pressing of the <MENU> push-button)
After the selection of the desired list (the <
> or <
> push-buttons), the user has to press
the <ENTER> push-button in order to enter it. After this new sub-lists, positions (elements) or various data
specification appear on the display.
3-1
SVAN 956 USER MANUAL
_
a)
b)
Displays with the main list (a) and the elements of the INPUT list (b)
Next pressing of the <ENTER> push-button enables one to access mentioned above sub-lists.
MEASUREMENT SETUP window opened (path: MENU / INPUT / MEASUREMENT SETUP)
The desired position of a list is accessed after pressing the <
> or <
> push-button.
MEASUREMENT SETUP window; the INTEGR. PERIOD position accessible
The change of the value in a selected position is performed by pressing the <
> or <
> pushbuttons.
Displays with the accessed INTEGR. PERIOD position after pressing the <
> or <
> push-buttons,
respectively
The <ENTER> push-button is used for the confirmation of the selection in a position and
for closing the opened sub-list. The sub-list is closed ignoring any changes made in a sub-list by pressing
the <ESC> push-button.
Displays after three consecutive pressing of the <ESC> push-button from the MEASUR. SETUP sub-list
As it was mentioned, some of the sub-lists end with the windows informing the user about the state
of the instrument, available memory, not existing files or loggers, standards fulfilled by the unit, etc.
In order to close such window the user has to press the <ESC> push-button.
3-2
SVAN 956 USER MANUAL
Displays during and after the accessing the FREE SPACE window (path: MENU / FILE / FREE SPACE)
In the instrument, there are also windows, which are used for entering text (i.e. the name of the file,
the header for the printed reports from the measurements).
Displays during the edition of the text, which has to be printed as a header in the measurement reports
(path: MENU / REPORT / TITLE)
Below the structure of the elements of the main list is presented. The more detailed description
of the FUNCTION, INPUT, DISPLAY, FILE, REPORT and SETUP lists is given in the following chapters.
FUNCTION (one of the main lists available after pressing the <MENU> push-button)
MODE
ACCELERATION; available values: [ ] / [*]
VOLTAGE ; available values: [ ] / [*]
MEASUREMENT FUNCTION (sub-list)
LEVEL METER; available values: [ ] / [*]
1/1 OCTAVE; available values: [ ] / [*]
1/3 OCTAVE; available values: [ ] / [*]
FFT; available values: [ ] / [*]
ENVELOPING; available values: [ ] / [*]]
CALIBRATION (sub-list)
BY SENSITIVITY
• SENSITIVITY; available values of sensitivity in mV/Pa:
2
2
o 10 µV / ms- .. 10 V / ms• CAL. FACTOR; it displays calculated calibration factor
BY MEASUREMENT (sub-list)
• CAL. LEVEL; available values of calibration level:
2
2
o 100 mm / s .. 1 km / s in the case of vibration measurements(or 100 dB .. 180 dB if
2
the reference level was set to 1 µm / s and the LOGARITHM scale was selected in
the DISPLAY SCALE sub-list)
• CAL. FACTOR; it displays calculated calibration factor after the measurement
LAST CALIBRATION; it enables the user to view the last calibration records
TEDS - automatical reading of the transducer parameters by the instrument, this function will
be available soon, NO DATA AVAILABLE message appears on the display
3-3
SVAN 956 USER MANUAL
_
Control diagram of the FUNCTION list
INPUT (one of the main lists available after pressing the <MENU> push-button)
3-4
MEASUREMENT SETUP (sub-list)
START DELAY; available values of the delay before starting the execution of the
measurements: 1s .. 60s
INTEGR. PERIOD; available values of the integration time: Inf, 1s .. 24h
REP. CYCLE; available values for the measurement cycles, which has to be repeated: Inf,
1 .. 1000
LOGGER off/ on; saving measurement results in instrument’s logger memory
• LOGGER STEP; available values of the step with which the measurement results
are saved in an instrument’s logger: 2 ms .. 1 h
• LOGGER NAME; editing the name of the logger’s file
MEASUREMENT RANGE; range of the vibration level measurements
LOW
2
2
2
2
• RMS (HP): 1.41 mm/s ÷ 100 m/s , PEAK: 31.6 mm/s ÷ 141 m/s in the case of
vibration measurements
HIGH
SVAN 956 USER MANUAL
•
2
2
2
2
RMS (HP): 10 mm/s ÷ 708 m/s , PEAK: 316 mm/s ÷ 1 km/s in the case of vibration
measurements
PROFILE 1 (sub-list)
FILTER; available digital weighting filters used in the first profile during the measurements:
o R3, R2, R1, Z, HP1, HP3, HP10, Vel1, Vel3, Vel10, VelMF, Dil1, Dil3, Dil10, W–Bxy,
W–Bz, H–A, W–Bc, KB, Wk, Wd, Wc, Wj, Wm, Wh, Wg, Wb; available filters in
vibration measurements
DETECTOR; available values of the detector time constant used in the first profile:
o 100ms, 125ms, 200ms, 500ms, 1.0s, 2.0s, 5.0s, 10.0s; available detector time
constants
LOGGER; available measurement results which has to be saved in the instrument’s logger
from the first profile (setting possible only when LOGGER is switched on (path: MENU /
INPUT / MEASUREMENT SETUP / LOGGER On)
o PEAK, P–P, MAX, RMS
PROFILE 2 (sub-list)
FILTER; available digital weighting filters used in the second profile during
the measurements:
o R3, R2, R1, Z, HP1, HP3, HP10, Vel1, Vel3, Vel10, VelMF, Dil1, Dil3, Dil10, W–Bxy,
W–Bz, H–A, W–Bc, KB, Wk, Wd, Wc, Wj, Wm, Wh, Wg, Wb
DETECTOR; available values of the detector time constant used in the second profile:
o 100ms, 125ms, 200ms, 500ms, 1.0s, 2.0s, 5.0s, 10.0s
LOGGER; available measurement results which has to be saved in the instrument’s logger
from the second profile
o PEAK, P–P, MAX, RMS
PROFILE 3 (sub-list)
FILTER; available digital weighting filters used in the third profile during the measurements:
o R3, R2, R1, Z, HP1, HP3, HP10, Vel1, Vel3, Vel10, VelMF, Dil1, Dil3, Dil10, W–Bxy,
W–Bz, H–A, W–Bc, KB, Wk, Wd, Wc, Wj, Wm, Wh, Wg, Wb
DETECTOR; available values of the detector time constant used in the third profile:
o 100ms, 125ms, 200ms, 500ms, 1.0s, 2.0s, 5.0s, 10.0s
LOGGER; available measurement results which has to be saved in the instrument’s logger
from the third profile
o PEAK, P–P, MAX, RMS
SPECTRUM (sub-list); this sub-list is not available in the case of the VLM; it appears on the
display in the case of 1/1 OCTAVE or 1/3 OCTAVE analyser
•
FILTER (position); only Z filter is available for 1/1 OCTAVE or 1/3 OCTAVE analysis
•
BAND: FULL
•
LOGGER (position); it enables the user to save RMS results from 1/1 OCTAVE or
1/3 OCTAVE measurement function; available values: [ ] or [√
√]
FFT (sub-list) this sub-list appears on the display in the case of the FFT analyser
AVERAGING (position); it informs the user about the available averaging during FFT analysis:
•
LINEAR
FILTER (position); available types of the digital weighting filter used during FFT analysis
BAND (position); available values of the bands of the FFT analysis: 87.5Hz, 175Hz, 350Hz,
700Hz, 1.4kHz, 2.8kHz, 5.6kHz, 11.2kHz, 22.4kHz
WINDOW (position), it informs the user about the available coefficients of time window:
HANNING, RECTANGLE, FLAT TOP, KAISER-BESSEL
3-5
SVAN 956 USER MANUAL
LINES; available values: 480, 960, 1920
LOGGER; available values: [ ] or [√
√]
_
RPM (sub-list) this sub-list appears on the display after activation of RPM MEASUREMENT
option in SETUP list
RPM; it enables the user to switch on the rotation measurement option, available [ ] or [√
√]
PULSE/ROT.; it enables the user to select the number of pulses / rotations, available values:
1, 2, .. 360
UNIT; available values: commonly used RPM (revolutions per minute) or RPS (revolutions per
second)
ENVELOPING(sub-list) this sub-list appears on the display in the case of the ENVELOPING
mode
FILTER (position); available values of the filter in ENVELOPING mode: 800Hz .. 20kHz
BAND (position); available values of the band of the ENVELOPING mode: 22Hz .. 22.4kHz
LINES; available values: 480, 960, 1920
TRIGGER SETUP (sub-list) (in LEVEL METER
MEASUREMENT FUNCTION / LEVEL METER)
mode,
path:
MENU
/
/
MEASURE TRIGGER; it enables the user to switch on or off the triggering
o TRIGGER; available options: SLOPE+, SLOPE–, LEVEL+, LEVEL–, GRAD+
o SOURCE; available sources are RMS (1) and EXT. I/O (for SLOPE)
o LEVEL; available values 24 .. 136 dB
LOGGER TRIGGER; it enables the user to switch on or off the triggering in logger
o TRIGGER; available values LEVEL+, LEVEL–
o SOURCE: RMS (1)
o LEVEL; available values 24 .. 136 dB
o PRE; available values 0 .. 50, (for LOGGER STEP equal to 100 ms => 0.0 .. 5.0 s)
o POST; available values 0 .. 200, (for LOGGER STEP equal to 100 ms => 0.0 .. 20.0 s)
RECORDER TRIGGER; it enables the user to switch on or off the trigger of recording
o TRIGGER; available options: SLOPE+, SLOPE–, LEVEL+, LEVEL–, GRAD+
o SOURCE; available sources are RMS (1) and EXT. I/O (for SLOPE)
2
2
o LEVEL; available values 24 .. 136 dB, 1 mm / s .. 10 km / s
o GRADIENT (for GRAD+); available values 1 dB / ms .. 100 dB / ms
Control diagram of the INPUT list in the 1/1 OCTAVE and 1/3 OCTAVE mode
3-6
FUNCTION
SVAN 956 USER MANUAL
Control diagram of the INPUT list in the FFT mode
Control diagram of the INPUT list in the ENVELOPING mode
3-7
SVAN 956 USER MANUAL
Control diagram of the INPUT list in the LEVEL METER mode
3-8
_
SVAN 956 USER MANUAL
DISPLAY (one of the main lists available after pressing the <MENU> push-button)
DISPLAY MODES (sub-list); it enables the user to activate ([√
√]) or switch off ([ ]) the available
modes of result’s presentation
SPECTRUM; available values: [√
√] or [ ]; this position is active only for 1/1 OCTAVE,
1/3 OCTAVE and FFT mode
3 PROFILES; available values: [√
√] or [ ]
LOGGER; available values: [√
√] or [ ]
FILE INFO; available values: [√
√] or [ ]
DISPLAY SETUP (sub-list)
•
SCALE; available values: LIN, LOG
•
X-ZOOM; it informs the user about the multiplier for the horizontal axis of the graphical
modes of the result’s presentation; available values in 1/1 OCTAVE and 1/3 OCTAVE
analyser: 3x, 4x, 5x
•
GRID; available values [ ] or [√
√]
SPECTRUM VIEW (in the case of 1/1 OCTAVE, 1/3 OCTAVE or FFT analysis)
•
VIEW; available spectrum views: NORMAL, FULL, EXTENDED
•
TYPE available types of spectrum views: AVERAGED, INSTANTANEOUS, MAX, MIN
•
MAX; position is accessible if in TYPE position AVERAGED or INSTANTANEOUS were
selected; available values: [ ] or [√
√]
•
MIN; position is accessible if in TYPE position AVERAGED or INSTANTANEOUS were
selected; available values [ ] or [√
√]
SPECTRUM TYPE;available spectrum types (in the case of vibration only: ACCELERATION,
VELOCITY, DISPLACEMENT
TOTAL VALUES (in the case of 1/1 OCTAVE or 1/3 OCTAVE vibration analysis)
DISPLAY SCALE
•
TOTAL 1; available positions in the case of vibration measurements:
o FILTER; available values: Z, S1, S2, S3
o TYPE; it appears when FILTER different than Z; available values: ACC, VEL, DIL
o CAL. F. ; it appears as above; available values: –60 dB, .., 60 dB
•
TOTAL 2; available positions:
o FILTER; available values: PR 2, S1, S2, S3
o TYPE; it appears when FILTER different than PR 2; available values: ACC, VEL, DIL
o CAL. F.; it appears as above; available values: –60 dB, .., 60 dB
•
TOTAL 3; available positions:
o FILTER; available values: PR 3, S1, S2, S3
o TYPE; it appears when FILTER different than PR 3; available values: ACC, VEL, DIL
o CAL. F.; it appears as above; available values: –60 dB, .., 60 dB
LOGGER VIEW;
•
VIEW; available logger views: NORMAL, FULL, EXTENDED
•
TIME; available time settings for logger: REAL TIME, AVAILABLE TIME
LOGGER VIEW (sub-list)
FILE NO.; number of the files in the instrument’s logger containing the results
of the measurements
LOG. FILE; name of the viewed logger’s file
3-9
SVAN 956 USER MANUAL
RECORDS; number of records in the viewed logger’s file
P(1); settings for logger in PROFILE 1 (INPUT list), available values PEAK, P–P, MAX, RMS
P(2); settings for logger in PROFILE 2 (INPUT list), available values PEAK, P–P, MAX, RMS
P(3); settings for logger in PROFILE 3 (INPUT list), available values PEAK, P–P, MAX, RMS
FREE; it informs the user about the size of remaining free memory for logger files
AVAILABLE; it informs the user about the size of the available memory for logger files
_
SCREEN SETUP (sub-list)
CONTRAST; it enables the user to select one from twenty one possibilities of the contrast
level of the instrument’s display
BACKLIGHT TIMEOUT, available values [√
√] or [ ]; if [√
√] is chosen it will cause the self-made
backlight switching off in the case when the keyboard is not used during the last 30 seconds.
If it happened the first pressing of any push-button switches the backlight on
BATTERY; it informs the user about the source of powering of the instrument and current power
supply voltage; available sources: BATTERY, USB POWER and EXTERNAL POWER
UNIT LABEL; it informs the user about the type of the instrument, the serial number of the unit,
the internal memory size, available measurement modes and it’s software version and
the standards which the instrument fulfils
3-10
SVAN 956 USER MANUAL
Control diagram of the DISPLAY SETUP sublist in 1/1 OCTAVE and 1/3 OCTAVE analysis of vibration
3-11
SVAN 956 USER MANUAL
_
Control diagram of the DISPLAY list
3-12
SVAN 956 USER MANUAL
FILE (one of the main lists available after pressing the <MENU> push-button)
SAVE: [name of the file]; available values: SAVE NEXT, SAVE
SAVE NEXT option simplifies the way of saving the file, the file name is generated
automatically, basing on the date set in the instrument or on the last name given for the file,
next result is saved as a file with the name increased by one (e.g. 11JAN0, 11JAN1, 11JAN2)
In the SAVE option the name of the file can be fully edited in the FILE NAME window
after pressing the <> push-button. The cursor is moved with <>, <> push-buttons.
The current character is changed with <SHIFT>+<>, <SHIFT>+<> push-buttons.
The combination <SHIFT>+<> deletes the character currently pointed by the cursor
The combination <SHIFT>+<> inserts a new character in the position of the cursor
No results! text will be displayed if the instrument did not perform any measurement in prior
to choosing the SAVE option
SAVE OPTIONS (sub-list)
RAM FILE; (only in LEVEL METER mode) gives the user a possibility to save data in RAM
file. Each time the data are saved, the previous file is overwritten, available values [√
√] or [ ]
REPLACE; it enables the user to replace the existing files in the instrument’s memory
by the files having the same name; available values: [√
√] or [ ]
SAVE STATISTICS; it enables the user to save or not the calculated statistics along with
the measurement results; available values: [√
√] or [ ]
AUTO SAVE; it enables the user to save the measurement results in the instrument’s
memory automatically without entering SAVE or SAVE NEXT position (in order to perform this
operation the INT. PERIOD should be set to at least 10 s); available values: [√
√] or [ ]
DIRECT SAVE; this option enables saving the results with the automatically incremented
name after pressing the <ENTER> and <ALT> push-buttons together
SAVE MAX SPECT.; it enables the user to save the maximal values of the spectrum occurred
during the performed analysis; available values: [√
√] or [ ]
SAVE MIN SPECT.; it enables the user to save the minimal values of the spectrum occurred
during the performed analysis; available values: [√
√] or [ ]
LOAD; enables one to load to the working space of the instrument’s memory the measurement
results saved in a file; the NO FILES text is displayed in the case when the instrument’s memory
is empty
DELETE; it enables the user to verify the list of files in the memory and to delete the selected one
from RESULT FILES, LOGGER FILES, SETUP FILES lists; the NO FILES text is displayed in the
case when the instrument’s memory is empty
DELETE ALL; it enables the user to delete all files saved in the instrument’s memory; user can
choose to delete either RESULT FILES, LOGGER FILES or SETUP FILES; the confirmation
is required before the erasing of all files: „Are you sure?”
DEFRAGMENTATION;(sub list)
FILES DEFRAGMENT.; it enables the user to recover the memory, which was previously
used by the deleted files; the confirmation is required before the execution of this operation:
“Are you sure?”
LOGGER DEFRAGMENT.; it enables the user to recover the memory, which was previously
used by the deleted logger files; the confirmation is required before the execution
of this operation: “Are you sure?”
3-13
SVAN 956 USER MANUAL
_
The text DEFRAGMENTATION .. unnecessary PRESS ANY KEY is displayed when the
instrument’s memory was empty before trial of the defragmentation or when there were
no deleted files
CATALOGUE; it enables the user to verify the list of files in the memory; the NO FILES text
is displayed in the case when the instrument’s memory is empty
FREE SPACE; it informs the user about the size of the available memory for saving
the measurement results in the file (FILES FREE SPACE), the TOTAL AVAILABLE bytes
of the memory (the number displayed in the FILES FREE SPACE increased by the memory which
was previously used by the deleting files), the next two numbers given
in the FREE SPACE window, named LOGGER FREE SPACE and LOGGER AVAILABLE
characterize the logger files memory in the same way
SAVE SETUP; saves the current settings of the instrument; with <>, <> push-buttons one can
choose between two modes: SAVE NEXT and SAVE. These are similar to the options available
while saving result files. The SAVE mode enables to choose the file name manually.
In the SAVE NEXT mode the file name will be set automatically
LOAD SETUP; it enables the user to verify the list of setup files in the memory and to load
the previously saved settings of the instrument; the NO FILES text is displayed in the case when
there is no setup files
3-14
SVAN 956 USER MANUAL
Control diagram of the FILE list
REPORT (one of the main lists available after pressing the <MENU> push-button, to use option
from this list the instrument has to be connected to RS232 or to a PC connected to a printer)
TITLE; it enables the user to give the header to the printed report
PRINT RESULTS; it enables the user to print measurement results on the attached printer,
the No results text is displayed in the case when there is no results to be printed
PRINT FILE, it enables the user to print out on a printer connected directly to the instrument the
selected file with the measurement results; the NO FILES text is displayed in the case when the
file memory is empty
PRINT LOGGER; it enables the user to print out on a printer connected directly to the instrument
the measurement results in a selected file from the logger; the NO LOGGERS text is displayed in
the case when the instrument did not perform any measurement and the logger is empty; this
function is currently under development and FUNCTION NOT AVAILABLE message appears on
the display
PRINT USER FILTERS; it enables the user to print out on a printer connected directly to the
instrument the values of the user filters introduced in the instrument: S1, S2, S3
3-15
SVAN 956 USER MANUAL
_
PRINT CATALOGUE; it enables the user to print the catalogue of the files stored
in the instrument’s memory
OPTIONS
FORMAT; available values: A4, A5
EJECT P.; available values: None, Prompt, Auto
Control diagram of the REPORT list
3-16
SVAN 956 USER MANUAL
SETUP (one of the main lists available after pressing the <MENU> push-button)
LANGUAGE; it allow the user to choose the instrument’s interface language; available values:
GERMAN, ENGLISH, SPANISH, ITALIAN, FLEMISH, FRENCH, HUNGARIAN, POLISH,
RUSSIAN, TURKISH
CLEAR SETUP; it enables the user to return to the factory settings of the instrument;
the confirmation has to be done before the execution of this function
Are you sure?
EXTERNAL I/O SETUP
MODE;
• ANALOG OUT
- DIRECT or
- D/A; if set to active the next line appears
- SOURCE; available sources: A, C, Z, R1, R2, R3, 1.00 Hz, 2.00 Hz, 4.00 Hz, .. ,
20 kHz)
• DIGITAL IN;
FUNCTION: EXT. TRIGGER
• DIGITAL OUT;
FUNCTION:
- TRIG. PULSE (POLARISATION: POS. / NEG.)
- ALARM PULSE (ACTIVE LEVEL: LOW / HIGH, SOURCE: PEAK(1), SPL(1),
LEQ(1), ALARM LEVEL available values: 30.0 dB .. 140 dB)
HUMAN VIB. FILT.; it enables the user to activate human vibration filters with a special code ,
after activation of human vibration filter this position is taken off from the menu
IEPE CURRENT; it enables the user to select current IEPE supply, available values 1.5 mA or
4.5 mA
REFERENCE LEVELS:
in the case of vibration measurements:
• ACC: - it enables the user to set the reference level of the acceleration for the logarithmic
2
scale (the results expressed in dB - decibels), available levels are from 1 µm/s to
2
100 µm/s
• VEL: - it enables the user to set the reference level of the velocity for the logarithmic scale
(the results expressed in dB - decibels), available levels are from 1 nm/s to 100 nm/s
• DIL: - it enables the user to set the reference level of the displacement for the logarithmic
scale (the results expressed in dB - decibels), available levels are from 1 pm to 100 pm
REMOTE COMMUNICATION
TYPE; available values: OFF, CONTINUOUS, PACKET
PACKET; available values: 64, 128, 256, 512, 1024
RMS INTEGRATION
RMS INTEGRATION; available values of detector’s type: LINEAR or EXPONENTIAL
RPM MEASUREMENT, it enables the user to activate rotation measurement option; once
activated the option is any longer present in the SETUP list
RS232;
BAUD RATE; it enables the user to set the baud rate: 1200, 2400, 4800, 9600, 19200, 38400,
57600, 115200
TIME OUT; it enables the user to set the time out: 1 s .. 60 s
RTC
RTC; it enables the user to set the internal real time clock and date of the instrument
SHIFT MODE
SHIFT; available modes of the <SHIFT> push-button: Shift or 2nd Fun.
ST/SP; available modes of the <START / STOP> push-button: Normal or Inverse
SIGNAL GENERATOR
function under development , Function not available message appears on the display
3-17
SVAN 956 USER MANUAL
_
TIMER (sub-list); it enables the user to set time of the self switching on of the instrument
MODE; specifies the mode of automatic power on; available values:
• Off
• SINGLE; (START DAY; specifies the date of automatic power on; START HOUR;
specifies the time of automatic power on)
• REGULAR; (START DAY; specifies the date of automatic power on; START HOUR;
specifies the time of automatic power on, REPETITION; specifies time after which next
automatic measurement will be executed)
• IRREGULAR; (START DAY; specifies the date of automatic power on; TIMEx; enables
the user to specify four times of automatic measurements)
USB–HOST PORT; it enables the user to choose with [*] proper functionality of USB–HOST
socket for connection of the instrument to RS232, USB IRDA, USB DISK, SRT RECORDING,
WAVE RECORDING, EVENT RECORDING
USER FILTERS; it enables the user to introduce the coefficients of the filters
REAL TIME FILTERS
• Rx (R1, R2, R3)
o TYPE; available values: HIGHPASS, BANDPASS, LOWPASS
o LFC(3 dB); low frequency corner at 3 dB; available for HIGHPASS and BANDPASS
with the values: 100.00 Hz .. 10.00 kHz
o HFC(3 dB); high frequency corner at 3 dB; position available only for BANDPASS and
LOWPASS with the values: 100.00 Hz .. 10.00 kHz
SPECTRUM BASED FILTER
• VIEW it enables the user to select which filter used in 1/1 OCTAVE or 1/3 OCTAVE
analysis should be viewed; the available options are S1, S2, S3 and any other transmitted
to the instrument from a PC by means of the interface
• EDIT it enables the user to select which filters used in 1/1 OCTAVE or 1/3 OCTAVE
analysis should be edited; the available options are as follows: S1, S2, S3 or any other
transmitted to the instrument from a PC by means of the interface
After pressing the <ENTER> push-button the Sx (S1, S2, S3) sub-list is opened
containing the values of the filters; the user can set the values of correcting coefficients
for all 1/3 OCTAVE filters:
0.80 Hz: available values of 0.8 Hz centre frequency filter: -100.0dB .. 100.0dB
...
…
20.0 kHz: available values of 20 kHz centre frequency filter: -100.0dB .. 100.0dB
•
CLEAR, enables the user to select which filters should be cleared; the available options
are as follows: ALL, S1, S2, S3 or any other
VIBRATION UNITS (sub-list which has the meaning only for vibration measurements)
2
METRIC (e.g. m/s , m/s, m) (position); available values: [ ] / [*]
NON-METRIC (e.g. g, ips, mil) (position); available values: [ ] / [*]
WARNINGS
RESULTS NOT SAVE; it enables the user to switch on or off the warning that the results
of the measurement were not saved in the memory; available values: [√
√] or [ ]
USB DISK FREE SP.; it enables to generate a warning after checking free space on the USB
disk
MIN FREE SPACE; specifies the limit of available memory for warning; if the available
memory is not greater than that limit the warning will be displayed; available values: 1 MB ..
1024 MB
3-18
SVAN 956 USER MANUAL
3-19
SVAN 956 USER MANUAL
3-20
_
SVAN 956 USER MANUAL
Control diagram of the SETUP list
3.2 Powering of the instrument
The SVAN 956 can be powered by one of the following sources:
• External DC power source – 6 V DC÷15 V DC (1.5 W)
• SA 17A external battery pack – operation time > 24 h (option)
• Four AA standard internal batteries. In the case of alkaline type, fully charged set can operate more
than 12 h (6.0 V / 1.6 Ah). Instead of the ordinary, four AA rechargeable batteries can be used
(for charging them the separate charger is required). In this case, using the best NiMH type,
the operation time can be increased up to 16 h (4.8 V / 2.6 Ah)
• USB interface – 500 mA HUB
The BATTERY window (path: MENU / DISPLAY / BATTERY) looks differently, depending on the
current powering source
a)
b)
c)
d)
BATTERY windows with different sources powering the instrument: SA 15 external DC power adapter (a),
SA 17A external battery pack (b), internal batteries (c) and USB power (d)
3-21
SVAN 956 USER MANUAL
_
For the external powering the SA 15 adapter should be connected to the Power socket located
on the bottom cover of the instrument. When the instrument is powered from the external power supply or
by the USB interface, the red diode on the right corner of the front panel bottom of the device switches on.
In the case of SA 15 the EXTERNAL POWER message appears in the BATTERY window (path: MENU /
DISPLAY / BATTERY).
When the instrument is powered from batteries, the “Battery” icon is presented on the top
of the display. When voltage of the batteries is too low, the icon is flashing and during attempt of switching
on the LOW BATTERY message occurs on the display for 2 seconds and the instrument switches off by
itself. To change the batteries the user has to:
• switch off the instrument,
• take off the black bottom cover of the instrument,
• unscrew battery cover,
• change the batteries and
• reassemble the parts of the instrument.
The fully charged battery ensures more than 12 hours of the continuous work of the instrument
(with the backlight off). The operation time is decreased about 20 % with the backlight switched on. The
battery condition can be checked by means of the POWER SUPPLY function. It is also presented
continuously on the display by means of the “Battery” icon.
a)
b)
Displays with the “Battery” icon (a) and in the BATTERY window (path: MENU / DISPLAY / BATTERY) (b)
Display with LOW BATTERY message
When there is a connection to the USB interface (USB Device socket is connected by means
of the cable to a PC), the “Computer” icon is presented on the top of the display and in the BATTERY
window, there is the USB POWER 5.0 V message.
a)
b)
Displays with the “Computer” icon (a) and in the BATTERY window (b)
Notice: In the case when “Battery” icon is flashing, it is strongly recommended to use
as soon as possible the external power adapter or USB interface. In the other case the instrument
after a while will be switched off by itself!
3-22
SVAN 956 USER MANUAL
The backlight of the display can be activated by means of the <> + <> push-buttons pressed
together. For saving the power of the battery, in the normal "day-light" operation it is recommended
to keep the backlight off. The user can set the BACKLIGHT TIMEOUT (path: MENU / DISPLAY /
SCREEN SETUP / BACKLIGHT TIMEOUT), which will cause the self-made backlight switching off in the
case when the keyboard is not used during the last 30 seconds. If it happened the first pressing of any
push-button switches the backlight on.
SCREEN SETUP windows; BACKLIGHT TIMEOUT activation
3.3 Initial setup of the instrument
The instrument passes the self-test after switching on (in this time the producer and the name
of the instrument is displayed on the display) and then it enters the vibration mode. The default display
mode for result’s presentation is one profile.
Displays after switching on the instrument
To start the measurements the user has to press the <START /STOP> push-button. The result
of the measurement is displayed with the unit of the measurement in so-called one profile mode.
On the left side of the display, the analogue-like indicator is presented. On the bottom of the display, there
is a profile from which comes the measurement (Profile (1), Profile (2) or Profile (3)). On the top of the
display (under the icons line) there are the following data: the function name (RMS, VDV, OVL, PEAK, P–
P, MTVV ), the detector time constant (100 ms, 125 ms, .. 10.0 s, .. - when the detector is exponential or
Lin when the detector is linear) and the weighted filter (HP1, HP3, HP10, Vel1, Vel3, Vel10, VelMF, Dil1,
Dil3, Dil10, KB, Wk, Wd, Wc, Wj, Wm, Wh, Wg, Wb, R1, R2, R3). The real time clock / time of the
measurement are presented on the right side of the bottom.
Displays in one profile (a) and 3 PROFILES display mode (b) with the VLM measurement results
The results of the measurements can be presented in one profile, in 3 PROFILES and in LOGGER
(these are the available display modes set by the producer; cf. path: MENU / DISPLAY /
DISPLAY MODES). It is also possible to activate FILE INFO display mode (path: MENU / DISPLAY /
DISPLAY MODES / FILE INFO). It is possible to change the display mode pressing the <
> or <
> pushbuttons together with the <SHIFT> one. In so-called 3 PROFILES display mode the results of the
measurement from all profiles are displayed simultaneously. The units, weighted filter and detector time
constant are also shown. The default settings (set up by the producer) for the profiles are as follows:
3-23
SVAN 956 USER MANUAL
_
PROFILE 1 - HP1 weighting filter (FILTER: HP1); 1.0s type of the RMS detector (DETECTOR: 1.0s),
the results of the measurements are not stored in the logger’s file (LOGGER PEAK: [ ],
LOGGER P–P: [ ], LOGGER MAX: [ ], LOGGER RMS: [ ]);
PROFILE 2 - HP3 weighting filter (FILTER: HP3), 1.0s type of the RMS detector (DETECTOR: 1.0s),
the results of the measurements are not stored in the logger’s file (LOGGER PEAK: [ ],
LOGGER P–P: [ ], LOGGER MAX: [ ], LOGGER RMS: [ ]);
PROFILE 3 - HP10 weighting filter (FILTER: HP10), 1.0s type of the RMS detector (DETECTOR: 1.0s),
the results of the measurements are not stored in the logger’s file (LOGGER PEAK: [ ],
LOGGER P–P: [ ], LOGGER MAX: [ ], LOGGER RMS: [ ]);
The user can change all mentioned above settings using PROFILE x sub-list of the INPUT list. The
instrument remembers all changes. The return to the default settings (set up by the producer)
is possible after the execution of the CLEAR SETUP position available in the SETUP list.
The instrument can be used not only as the vibration level meter (VLM) but also as 1/1 OCTAVE
and 1/3 OCTAVE analyser, FFT analyser and perform ENVELOPING function. In order to distinguish the
LEVEL METER function from the others, which are available in 3 PROFILES display mode, two
continuous horizontal lines are used to separate the measurement results from different profiles. In other
modes than VLM the mentioned above lines are dotted.
b)
a)
Displays in 3 PROFILES display mode with the measurements results, which are from LEVEL METER
mode (continuous lines) (b) and with the results, which are not from the LEVEL METER (dotted lines)
Notice: See next chapters for more details concerning different settings.
More data about the instrument’s state are given by means of the icon’s row visible in the top
of the display (“Paper sheet”, “Battery”, “Computer”, “Antenna” (“Tree”), “Loudspeaker”,
“Headphone”, “Envelope”, “Bell”, “Timer” and “Arrows”). The meanings of the icons are as follows:
Display with all available icons
“Paper sheet” icon is displayed when the USB disk or IrDA is connected to the instrument.
Display with “Paper sheet” icon
“Battery” is displayed when the instrument is powered from the batteries, icon corresponds
to the batteries state (three, two, one or none vertical bars in side of the icon). When voltage of batteries
is too low, the icon is flashing.
3-24
SVAN 956 USER MANUAL
Display with “Battery” icon
“Computer” is displayed when there is the USB connection with the PC; the icon is flashing during
RT (Real Time) transmission.
Display with “Computer” icon
“Antenna” (“Tree”) icon is displayed in a flashing mode together with the “Loudspeaker” when
the measurement is started, the trigger is switched on and the level of the signal is too low to start
the registration.
Display with “Antenna” (“Tree”) icon
“Loudspeaker” icon is displayed when the measurement is started and executed. The crossed out
loudspeaker means measurement is paused (Pause).
Display with “Loudspeaker” icon
“Headphone” is displayed when RS 232 (SV 55) interface is connected to the instrument.
Display with “Headphone” icon
“Envelope” icon is presented when the current measurement results are logged
in the instrument’s logger file. Together with this icon, the “Loudspeaker” icon is always displayed.
In the case when the “Envelope” icon starts flashing, it means that the whole logger memory
of the instrument is filled out. The new measurement result is not saved in it. If the user wants to save
these results, he has to DELETE some logger files and execute LOGGER DEFRAGMENTATION (path:
MENU / FILE / DEFRAGMENTATION / LOGGER DEFRAGMENTATION).
3-25
SVAN 956 USER MANUAL
_
Display with “Envelope” icon
“Bell” is displayed when overload has taken place during the last measurement cycle (the icon
is displayed also after the measurement and after loading the file with the overloaded results).
Display with “Bell” icon
“Timer” icon flashing means that the instrument’s Timer is switched on and the instrument
is waiting for the set time of the measurement. When the measurement was started by the Timer,
the icon is presented without flashing.
Display with “Timer” icon
“Arrows” are flashing after pressing the <ALT> or <SHIFT> push-button when the 2nd Fun
is selected in the SHIFT MODE (path: MENU / SETUP / SHIFT MODE / SHIFT / 2nd FUN), that means
other push-buttons have second or third meaning (i.e. after pressing the <SHIFT> the meaning of
<ENTER> push-button is <MENU>; after pressing the <ALT> the meaning of <ESC> push-button is
changed into <PAUSE>).
Display with “Arrows” icon
Notice: The time of the measurement is displayed in minutes and seconds in the range
from 1 sec. to 39 minutes and 59 seconds. After this limit, the hours and minutes are shown (i.e. 00:40).
Notice: THE USER DYNAMICALLY MODIFIES THE DEFAULT SETUP. The last set-up
of the instrument (during the power off) is stored and is available after power on.
3-26
SVAN 956 USER MANUAL
3.4 Selection of the working mode- MODE
The device can work in two modes – acceleration and voltage. A mode is selected by placing the
special character in the line with the mode’s name. The position of the character can be changed using
the <>, <> push-buttons. After placing the character in the line with the option’s name the user has to
press the <ENTER> push-button.
a)
c)
b)
Displays with the FUNCTION list opened, MODE selected (a) and MODE sub-list opened with
ACCELERATION (b) and VOLTAGE (c) mode selected
3.5 Activation of optional functions
The 1/1 OCTAVE, 1/3 OCTAVE, FFT, ENVELOPING and time history data LOGGER, time
domain signal recording, human vibration filters, RPM, SIGNAL GENERATOR are the optional
functions broadening the applications of the instrument. Some of the additional functions are specified in
the MEASUR. FUNCTION (path: MENU / FUNCTION) others – in the other lists.
<ENTER>
a)
c)
b)
d)
e)
f)
Displays with the FUNCTION list opened, MEASUREMENT FUNCTION selected (a) and
MEASUR. FUNCTION sub-list opened with all available options (b), (c), (d), (e), (f)
A function is selected by placing the special character in the line with the function’s name.
The position of the character can be changed using the <>, <> push-buttons. After placing
the character in the line with the function’s name the user has to press the <ENTER> push-button.
The window for entering the access code to a function is opened in the first essay of its execution
(after pressing the <ENTER> push-button) in the case when a function was not purchased together
with the instrument.
3-27
SVAN 956 USER MANUAL
_
Displays during the entering of the access code to a function
Notice: The number of the attempts for the access code entering is limited. After three
unsuccessful essays, the possibility is blocked.
The introduction of the access code is performed in the same way as the edition of the other text
variables using the <>, <> push-buttons (the selection of the character's position), the <SHIFT> and
<> push-buttons (the Insert function), the <SHIFT> and <> push-buttons (the Delete function) and the
<>, <> push-buttons (the codes of characters). The verification is made after pressing
the <ENTER> push-button. If the entered code was wrong, the message is displayed and the instrument
waits for the reaction of the user. After pressing the <ENTER> or the <ESC> push-button the information
that the function is not available is displayed and the instrument once more waits for the reaction
of the user.
Display after the unsuccessful verification of the access code
After pressing the <ENTER> or the <ESC> push-button the instrument returns to the FUNCTION
list displaying the list of the functions implemented in the unit (cf. the first Figure in this chapter).
After successful verification of the access code, the windows described above are no more displayed.
Once activated function is always available.
3.6 Memory organisation
All available measurement results can be stored in the internal FLASH type memory
of the instrument (32 MB) or in the external USB Memory Stick (when the optional USB–HOST controller
is installed in the instrument).
The internal memory of the instrument is divided into two separate parts. One part is dedicated
for saving the result and setup files and its size is equal to 16 252 428 bytes. The second part is used
for saving the logger files and its size is equal to 15 859 224 bytes. To save a result file the user
has to choose one of the available options: SAVE NEXT (path: MENU / FILE / SAVE or pressing
<ENTER> and <ALT> together), SAVE (path: MENU / FILE / SAVE or pressing <ENTER> and <ALT>
together), AUTO SAVE (path: MENU / FILE / SAVE OPTIONS) or DIRECT SAVE (path: MENU / FILE /
SAVE OPTIONS). To save a setup file the user has to choose SAVE SETUP option from the FILE list.
The logger files are created automatically (the usage of the SAVE is not required). The scheme of the
instrument’s memory organisation without the USB–HOST controller is presented below.
3-28
SVAN 956 USER MANUAL
setup files
each
repetition
cycle
23MAR.svn
car1.svn
car2.svn
@save1.svn
@save2.svn
@save3.svn
……..
@savexxx.svn
and
main result files
signal
samples
logger
step
time
domain
logging
load/save
set.svn
HV_HA.svn
HV_WH.svn
save next
last
repetition
cycle
short
results
&log1.svn
&log2.svn
&log3.svn
&log4.svn
……..
……..
……..
……..
- avaliable only for
particular models
like SVAN 959 etc.
- only with external
USB flash memory
……..
……..
……..
……..
……..
……..
……..
&logxxx.svn
INTERNAL LOGGER
MEMORY
INTERNAL FLASH
DISK MEMORY
integration time
results
auto save
instrument
settings
load/save setup
RAM
MEMORY ORGANIZATION OF THE SVAN 95x instrument series without USB HOST
time history files
Scheme of the instrument’s memory organisation without the USB–HOST
Notice: The instrument’s logger memory is independent from the results and setup
memory. The capacity of the available memory is equal to 32 MB and is divided between logger
(15 859 224 bytes) and results and setup settings (16 252 428 bytes).
Notice: The logger files are created automatically (the usage of the SAVE is not required).
When the user connects to the instrument the USB memory stick, the data storing in the internal
instrument’s memory is not available any more. The user can only copy or move data from the internal
memory of the device and store new data in the USB memory stick. The scheme of the memory
organization of the instrument with the USB memory stick connected is presented below.
3-29
SVAN 956 USER MANUAL
_
EXTERNAL USB
FLASH DISK
set.svn
HV_HA.svn
HV_WH.svn
setup files
23MAR.svn
car1.svn
car2.svn
logger
step
time
domain
OR
SVAN 956/8/9 ONLY
each
repetition
cycle
signal
samples
recording
save next
load/save
last
repetition
cycle
short
results
logging
integration time
results
auto save
instrument
settings
load/save setup
RAM
MEMORY ORGANIZATION OF THE SVAN 95x instrument series with USB HOST
&time1.srt
&log2.svn
&time2.wav
@save1.svn
@save2.svn
@save3.svn
……..
@savexxx.svn
main result files
&log4.svn
……..
……..
……..
&logxxx.svn
……..
……..
……..
time history or time domain
Scheme of the instrument’s memory organisation with the USB–HOST and memory stick connected
Notice: The connection to the USB Host socket the USB disk switches off the instrument’s
internal flash memory. Only copying and moving the files to the USB stick is possible. All file functions and
remote commands are redirected to the USB disk. The internal flash memory is activated
after disconnecting the USB disk from the instrument.
Notice: The disconnection of the USB disk during the data transmission can cause the lost of
data saved in the USB disk as well as in the instrument’s internal flash memory.
3-30
SVAN 956 USER MANUAL
4
FUNCTIONS OF THE INSTRUMENT - FUNCTION
In order to select the FUNCTION list one has to press the <MENU> push-button, select by means
of the <>, <> (or <>, <>) push-buttons the FUNCTION text and press the <ENTER>.
The FUNCTION list contains three elements: MODE, MEASUREMENT FUNCTION and CALIBRATION.
The list is closed and the instrument returns to the presentation mode after pressing the <ESC> pushbutton.
a)
b)
c)
d)
Displays with the main list; the FUNCTION text selected (a) and the FUNCTION list opened;
the MODE selected (b) the MEASUREMENT FUNCTION selected (c) and the CALIBRATION selected (d)
4.1 Selecting the mode of the instrument - MODE
In order to select the required mode the user has to enter the MODE position in the FUNCTION
sub-list using <>, <> push-buttons and press the <ENTER> one. A mode is selected by placing the
special character in the line with the mode’s name. The position of the character can be changed using
the <>, <> push-buttons. After placing the character in the line with the option’s name the user has to
press the <ENTER> push-button.
a)
b)
c)
FUNCTION list opened; MODE selected (a) and MEASUR. FUNCTION sub-list opened with all available
modes b), (c)
4.2 Measurement functions of the instrument - MEASUREMENT FUNCTION
In order to select the required function the user has to enter the MEASUREMENT FUNCTION sublist (to select the MEASUREMENT FUNCTION text using the <>, <> or <>, <> push-buttons
and press the <ENTER> one, when this text is displayed inversely).
After entering the MEASUREMENT FUNCTION sub-list, the set of the available functions appears
on the display (LEVEL METER, 1/1 OCTAVE, 1/3 OCTAVE, FFT, ENVELOPING). The special character
marks currently active function.
4-1
SVAN 956 USER MANUAL
_
a)
b)
…
…
MEASUREMENT FUNCTION windows opened (a) and the activation of the optional function (b)
The main function of the instrument is the measurement of vibration level. The other functions
are optional and they broaden the applications of the instrument. They can be supported
by the producer or purchased later. The producer activates the optional function bought
with the instrument. The user should activate by himself the function purchased later.
The vibration LEVEL METER (VLM) mode provides the user with the functions of the functions of
VLM meeting the ISO 8041:2005 standard. The instrument can also be used for the long-term acoustic
monitoring using for this purpose the huge logger, in which the measurement results are stored.
The required function is selected by placing the special character in the line with the proper text.
The position of the character can be changed using the <>, <> (or <>, <>) push-buttons.
After placing the character in the line with the function’s name the user has to press the <ENTER> pushbutton, which closes the MEASUR. FUNCTION sub-list.
Notice: It is not possible to change the measurement function during the measurements.
The instrument displays in this case for about 3 seconds the text: “MEASUREMENT IN PROGRESS”.
In order to change the mode of the instrument the measurement must be finished!
4.3 Instrument’s calibration - CALIBRATION
The instrument is factory calibrated with the supplied microphone for the standard environmental
conditions. Because the microphone sensitivity is a function of the temperature, ambient pressure
and humidity, when the absolute sound pressure level value is important, the calibration
of the measurement channel has to be done. In order to select a calibration function the user has to enter
the CALIBRATION sub-list (to select the CALIBRATION text using the <>, <> or <>, <> pushbuttons and press the <ENTER> one, when this text is displayed inversely).
The CALIBRATION sub-list consists of four positions: BY SENSITIVITY, BY MEASUREMENT,
which are used to perform the calibration, LAST CALIBRATION, which contains the list of the performed
in the past the calibration measurements and the obtained results and TEDS, which is used for
automatical reading of vibration transducer parameters.
a)
b)
Displays with the main list; the FUNCTION text selected (a), the FUNCTION list opened,
the CALIBRATION text selected (b)
4-2
SVAN 956 USER MANUAL
Note: The calibration level and the calibration result is expressed in different units depending
on the settings of the instrument. The metric or non-metric vibration units are set in the
VIBRATION UNITS (path: MENU / SETUP / VIBRATION UNITS). Additionally, the linear or logarithmic
units are set in the DISPLAY SCALE (path: MENU / DISPLAY / DISPLAY SETUP / DISPLAY SCALE).
4.3.1
Calibration BY SENSITIVITY
The calibration by the accelerometer’s sensitivity introduction can be conducted in the following
way:
1. Select this type of the calibration (highlight the BY SENSITIVITY text) from the CALIBRATION
sub-list and press the <ENTER> push-button.
Displays with the selected calibration mode and after entering this mode
Notice: It is not possible to calibrate the instrument during the execution
of the measurements. It is possible to open different lists and sub-lists but the positions in these lists
are not displayed inversely and so - not accessible. The “Loudspeaker” icon indicates that
the instrument is in the measurement process. In order to change the sensitivity the measurement
must be finished!
Displays with the SENSITIVITY positions (path: MENU / FUNCTION / CALIBRATION /
BY SENSITIVITY) not accessible
2. Set the sensitivity of the accelerometer taken from its calibration certificate using the <>, <>
push-buttons and then press the <ENTER> one.
The calibration factor is calculated, after pressing the <ENTER> push-button, in the relation
-2
to 10.0 mV / ms . In order to avoid the calculation the user has to leave the CALIBRATION without
-2
pressing <ENTER>. For the sensitivity of the accelerometer higher than 10.0 mV / ms the calibration
factor is negative.
a)
b)
Displays during setting the sensitivity higher than 10.0 mV / ms-2 (a) and after pressing
the <ENTER> push-button with the calibration factor calculated (b)
4-3
SVAN 956 USER MANUAL
_
-2
For the sensitivity of the accelerometer lower than 10.0 mV / ms the calibration factor is positive.
a)
b)
Displays during setting the sensitivity lower than 10.0 mV / ms-2 (a) and after pressing
the <ENTER> push-button with the calibration factor calculated (b)
The lowest applicable value of the sensitivity to be introduced is equal to 10.0 µV / ms (it conforms
-2
to the calibration factor equal to 60.0 dB) and the highest one – 10.0 V / ms (calibration factor equal
to -60.0 dB).
-2
In order to return to the CALIBRATION sub-list the user has to press the <ESC> push-button.
a)
b)
Displays with the lowest possible sensitivity and the highest calibration factor (a)
and the highest sensitivity and the lowest calibration factor (b)
Note: The calibration factor is always added to the results in the VIBRATION
LEVEL METER mode (VLM), 1/1 OCTAVE, 1/3 OCTAVE and the FFT analysis modes.
4.3.2
The calibration BY MEASUREMENT in the case of vibration signal
The calibration by measurements can be conducted in the following way:
1. Select the calibration by measurement (highlight the BY MEASUREMENT
the CALIBRATION sub-list and press the <ENTER> push-button.
text)
from
Displays with the selected calibration mode and after entering this mode
2. Attach the vibration calibrator to the instrument’s accelerometer.
3. Switch on the calibrator and wait approximately 30 seconds before starting the calibration
measurement.
4. Start the calibration measurement by pressing the <START / STOP> push-button.
The measurement starts after 5 seconds delay. The measurement time is also predefined to
5 seconds. During the calibration period, the <ESC> and <PAUSE> push-buttons do not operate but it is
4-4
SVAN 956 USER MANUAL
possible to stop the measurement using the <START / STOP> push-button. Waiting for the calibration
measurement to begin, a DELAY is counted down.
Displays while the instrument is waiting for the calibration measurement to commence
At the end of the measurement, the result is displayed on the display in the bottom line.
Displays during the calibration measurements
Displays after the calibration measurements
The calibration procedure should be repeated a few times to ensure the integrity of the calibration.
The obtained results should be almost identical (with ±0.1 dB difference). The reasons for unstable results
are as follows:
• the calibrator is not properly attached to the instrument,
• there are external disturbances,
• the calibrator or the measurement channel (the accelerometer or the instrument itself) are damaged.
Note: During the calibration period, external disturbances (vibrations or acoustic noise)
should not exceed 100 dB.
5. Press the <ENTER> push-button in order to accept the measurement result.
The calibration factor is calculated, stored and displayed (cf. Fig. below for logarithmic and linear
scale – path: MENU / DISPLAY /DISPLAY SETUP / DISPLAY SCALE / SCALE) after pressing
the <ENTER> push-button.
=><ENTER>=>
=><ENTER>=>
4-5
SVAN 956 USER MANUAL
_
Displays after pressing the <ENTER> push-button (after calculation of the calibration factor value)
Note: The calibration factor is always added to the measurement results in the
LEVEL METER mode and to those coming from the frequency analysis (1/1 OCTAVE, 1/3 OCTAVE, FFT
and ENVELOPING).
4.3.3
History of the calibration - LAST CALIBRATION
In order to enter the LAST CALIBRATION window in which up to last ten calibration records are
remembered, the user has to select the proper text in the CALIBRATION window using the <>, <>
push-buttons and press the <ENTER> one.
a)
b)
Displays in the CALIBRATION window; the LAST CALIBRATION text selected (a)
the LAST CALIBRATION window opened with ten calibration records (b)
In order to review the calibration record, the user has to select the required line
in the LAST CALIBRATION window using the <>, <> push-buttons and press the <ENTER> one.
The opened window contains the date and time of the performed calibration measurement, the way
the calibration was done (BY MEASUREMENT or BY SENSITIVITY), the desired calibration level
(CAL. LEVEL) in the case of the measurements and the obtained calibration factor (CAL. FACTOR).
=><ENTER>=>
Displays with the LAST CALIBRATION record
In the case when the calibration measurements were not performed, the LAST CALIBRATION
window does not contain any record. The contents of this window is cleared after the CLEAR SETUP
operation.
Display with the empty LAST CALIBRATION window
4.3.4
Automatic reading of a vibration transducer parameters - TEDS
The TEDS (Transducer Electronic Data Sheet) function enables automatic reading
by the instrument the sensitivity and other electronics parameters of vibration transducer. This function will
4-6
SVAN 956 USER MANUAL
be available soon. In order to enter the TEDS window the user has to select the TEDS text
in the CALIBRATION list using <>, <> push-buttons and press the <ENTER> one.
CALIBRATION window; TEDS text highlighted
TEDS window opened; NO DATA AVAILABLE message
4-7
SVAN 956 USER MANUAL
5
MEASUREMENT PARAMETERS SETTING - INPUT
The profile parameters can be set in the INPUT list, which can be entered after pressing
the <MENU> push-button, then selecting by means of the <
>, <
> (or <
>, <
>) push-buttons
the INPUT text and finally pressing the <ENTER> one.
Main list with the INPUT text selected
The INPUT list in the LEVEL METER contains the elements which enable one the independent
programming of the measurement parameters (MEASUREMENT SETUP), the input range
(MEASUREMENT RANGE), parameters of three profiles (PROFILE 1, PROFILE 2 and PROFILE 3) and
the trigger function (TRIGGER SETUP). In the case of 1/1 OCTAVE and 1/3 OCTAVE on the display
appears SPECTRUM position. In the case of FFT analyser on the display appears FFT position and in
the case of ENVELOPING – the ENVELOPING position. After activation (with a special code) of RPM
option in the SETUP list on the display appears additionally RPM position.
a)
b)
c)
d)
e)
INPUT list in the LEVEL METER (a), in 1/1 OCTAVE and 1/3 OCTAVE analyser (b)
in FFT analyser (c) in ENVELOPING (d) and after activation of RPM option (e)
Notice: Any parameter in the INPUT list can be changed only when the instrument
does not execute a measurement. The possibility of a change is signalled by displaying inversely
a parameter’s field. Moreover, normally displayed field means that the parameter cannot be
changed. The “Loudspeaker” icon indicates that the instrument is performing the measurements.
Displays with not active sub-lists of INPUT list during measurement
5-1
SVAN 956 USER MANUAL
_
Notice: The parameters can be presented in LOGARITHMIC (decibels) or LINEAR
2
(m/s ) units. It depends on the DISPLAY SCALE position (path: MENU / DISPLAY / DISPLAY SETUP
2
/ DISPLAY SCALE/ LOG or LIN), e.g. 10 m/s can be presented as 140 dB.
5.1 Selection of measurement parameters - MEASUREMENT SETUP
The MEASUREMENT SETUP is opened after the selection of the MEASUREMENT SETUP text
from the INPUT list by means of the <
>, <
> (or <
>, <
> with <SHIFT>) push-buttons and pressing
the <ENTER> one. The MEASUREMENT SETUP consists of the parameters, which can be set or
switched on / off, namely: the delay of the start of measurements (START DELAY), the integration period
(INTEGR. PERIOD), the repetition of the measurement cycles (REP. CYCLE) and the logger activation or
deactivation (LOGGER). If the logger is active, the user can set the logging period (LOGGER STEP) and
give a name to the logger’s file (LOGGER NAME). In order to change the displayed inversely parameter
the user has to press the <
>, <
> push-buttons. The confirmation of any change made in the sub-list
requires pressing the <ENTER> push-button, which simultaneously closes the sub-list.
The MEASUREMENT SETUP is closed ignoring any changes made in there, after pressing any time
the <ESC> push-button.
Displays with the MEASUREMENT SETUP window
5.1.1
Setting time delay before the start of measurements - START DELAY
The START DELAY defines the delay period from the <START / STOP> push-button pressing to
the start of the measurements (the digital filters of the instrument analyse constantly the input signal even
when the measurements are stopped). This delay period can be set from 0 second to 60 seconds (with
1 second step by means of the <
>, <
> push-buttons and with 10 seconds step with the <
>, <
>
push-buttons pressed together with the <SHIFT> one). The <ENTER> push-button must be pressed for
the confirmation of the selection, which closes simultaneously the MEASUREMENT SETUP window.
<
>
<
>
MEASUREMENT SETUP windows; the setting of the START DELAY with 1-second step
<SHIFT>+<
>
...
MEASUREMENT SETUP windows; the setting of the START DELAY with 10-seconds step
Notice: The minimum delay period is equal to 0 second. In the CALIBRATION mode, the
delay period is equal to 5 seconds.
5-2
SVAN 956 USER MANUAL
5.1.2
Setting the integration period - INTEGR. PERIOD
The INTEGR. PERIOD defines the period in which the signal is being averaged during the
measurements. The definitions of the measurement results in which the integration period is used is given
in App. D. The required value of this parameter can be set by means of the <
>, <
> and confirmed by
the <ENTER> push-button.
The integration period (INTEGR. PERIOD) can be set (by pressing the <
> (or <
> with <SHIFT>)
push- button):
- From 1 s to 59 s (with 1 second or 10 seconds step).
<
>
<
>
MEASUREMENT SETUP windows; the setting of the INTEGR. PERIOD with 1-second step
<SHIFT>+<
>
<SHIFT>+<
>
MEASUREMENT SETUP windows; the setting of the INTEGR. PERIOD with 10-seconds step
- From 1 m (min) to 59 m (with 1 minute or 10 minutes step).
...
MEASUREMENT SETUP windows; the setting of the INTEGR. PERIOD with 1 and 10-minutes step
- From 1 h to 24 h (with 1 hour or 10 hours step). It is also possible to set Inf value.
...
MEASUREMENT SETUP windows; the setting of the INTEGR. PERIOD with 10-hours step
Additionally, the predefined periods: 1 m, 5 m, 15 m, 1 h, 8 h and 24 h, which are enumerated
in the standards, are also available (by pressing the <
> push-button or <
> with <SHIFT>; these values
are placed in the mentioned above sequence on the left in relation to 1 s).
5-3
SVAN 956 USER MANUAL
_
Displays during setting the predefined INTEGR. PERIOD sequence
Notice: In the case of switching on the AUTO SAVE function, the minimum value
of the integration period should be equal to 10 seconds.
If the user wants to switch on AUTO SAVE option (path: MENU / FILE / SAVE OPTIONS /
AUTO SAVE) the integration period value has to be greater or equal than 10 seconds. When AUTO SAVE
option was switched on and new entered integration period value is less than 10 seconds AUTO SAVE
option switches off and INT.PERIOD TOO SHORT / AUTO SAVE DISABLED message appears on the
display.
Display, when the INT.PERIOD is too short for AUTO SAVE option
5.1.3
Setting the number of repetition of measurement cycles - REP. CYCLE
The REP. CYCLE defines the number of cycles (with the measurement period defined
in the INTEGR. PERIOD) which should be performed by the instrument. The required parameter can
be set by means of the <>, <> push-buttons (with the step equal to 1) or by means of the <>, <>
push-buttons pressed together with the <SHIFT> one (with the step equal to 20). The selected value
is accepted by pressing the <ENTER> push-button, which closes the MEASUREMENT SETUP window.
The Inf value denotes the infinite repetition of the measurements (until the pressing the <START / STOP>
push-button or after receiving the remote control code). The REP. CYCLE number values are within the
limits [1, 1000].
REP. CYCLE setting with the step equal to one
...
REP. CYCLE setting with the step equal to 20
5.1.4
5-4
Logger functionality switching On / Off - LOGGER
SVAN 956 USER MANUAL
The LOGGER switches on and off the functionality, which enables the user to save in a file
the selected results from three profiles with the defined period. The LOGGER can be activated and
deactivated by means of the <>, <> push-buttons and accepted by the <ENTER> one.
The acceptation closes simultaneously the MEASUREMENT SETUP window. Any changes are ignored
after pressing the <ESC> push-button.
Displays with the LOGGER deactivated and activated
The LOGGER functionality is not included in the standard set of the instrument. It can be bought
together with the instrument ordering the proper option or can be purchased by the user in the future.
In the latter case, after selecting On value, the user has to introduce special code activating
the functionality. After successful activation, the logger remains available and the instrument never more
asks for the code.
=>
Displays during setting the LOGGER STEP; available values in a sequence 1, 2, 5
5.1.5
Setting time period between two writings to the logger’s file - LOGGER STEP
The LOGGER STEP defines the period of the data logging in a file. It can be set from 2 ms
to 1 s in 1, 2, 5 sequence, the values from 1 second to 59 seconds, the values from 1 minute to 59 minute
and 1 hour. The required parameter can be set by means of the <>, <> push-buttons with the single
step and by means of the <>, <> with <SHIFT> with the incremented one. The selection is accepted by
the <ENTER> one, which closes simultaneously the MEASUREMENT SETUP window. Any changes are
ignored after pressing the <ESC> push-button.
LOGGER STEP setting; available values in milliseconds
...
...
5-5
SVAN 956 USER MANUAL
_
...
LOGGER STEP setting; available values from 500 milliseconds to 1 hour
5.1.6
Logger file name edition - LOGGER NAME
The LOGGER NAME enables the user to name the logger file. The default one is &LOG.
The name cannot be longer than eight characters including not edited first one character &. After entering
this line, the special help is displayed in the display’s last line. The name edition is performed similarly to
the name edition in the FILE NAME line of the SAVE or SAVE SETUP window. The edition process is
presented below. The displayed inversely character is currently edited. The <>, <>, <>, <> and
<SHIFT> push-buttons are used for editing the name. One can select the proper position of the character
in the edited text using the <>, <> push-buttons. The available ASCII characters can be changed using
the <> (or <>) push-button pressed together with the <SHIFT> one. The subsequent digits, underline,
big letters and space appear on the display in the inversely displayed position after each pressing of the
mentioned above push-buttons.
LOGGER NAME edition in MEASUREMENT SETUP
The edited name is accepted and the file is saved after pressing the <ENTER> push-button.
The special warning is displayed in the case the file with the edited name already exists in the memory.
The instrument waits then for a reaction of the user (any push-button should be pressed except
the <SHIFT> or the <ALT> one).
=>
=>
Displays during the attempt of overwriting the existing file
The main measurement results (cf. App. B) (RMS, VDV, OVL, PEAK, P–P, MTVV (or MAX), for
LEVEL METER, 1/1 OCTAVE, 1/3 OCTAVE, FFT and ENVELOPING are calculated in the period set in
the INTEGR. PERIOD. These results can be saved in the result files of the instrument’s memory by
means of the SAVE or SAVE NEXT function (path: MENU / FILE / SAVE). In the case the
INTEGR. PERIOD is greater than 9 seconds, it can be done also by means of the AUTO SAVE operation.
The name of the file for that operation is set in the FILE NAME window (path: MENU / FILE / AUTO SAVE
/ FILE NAME). In the case the REP. CYCLE is greater than one, the AUTO SAVE operation will be
performed after the period set in the INTEGR. PERIOD. The name of the file with the main results is
changed after each saving.
In the same, when the LOGGER is On, the partial measurement results are calculated in the period
set in the LOGGER STEP. Up to 12 results can be logged simultaneously from three independent profiles
of the instrument (PEAK/ P–P/ MAX/ RMS) from each profile (path: MENU / INPUT / PROFILE x, where
x = 1, 2 and 3)) with time step down to 2 ms. These results are saved in one logger’s file memory of the
instrument in the LEVEL METER as well as for other functions. The name of the file is set in the
LOGGER NAME position. The registration in the logger’s memory is stopped after the period, which is
5-6
SVAN 956 USER MANUAL
equal to INTEGR. PERIOD multiplied by REP. CYCLE, after pressing the <START/STOP> push-button or
after stopping the measurements remotely.
REP. CYCLE
n=1
0
REP. CYCLE
n=1
T
2T
INTEGR. PERIOD INTEGR. PERIOD
T
T
start
AUTO SAVE
@sig1.svn
time history
main results
integration period
from 0 to T
PEAK, MAX, MIN or RMS
REP. CYCLE
n=N-1
AUTO SAVE
@sig2.svn
main results
integration period
from T to 2T
(N-2)T
REP. CYCLE
n=N
(N-1)T
NT
measurements
end
INTEGR. PERIOD INTEGR. PERIOD
T
T
AUTO SAVE
@sigN-1.svn
AUTO SAVE
@sigN.svn
main results
integration period
from (N-2)T
to (N-1)T
time
main results
integration period
from (N-1)T
to NT
main results
files
signal amplitude
Measurements started by <START/STOP> push-button, ended by last repetition cycle
LOGGER: ON
&logger1.svn
RMS results logged
with LOGGER STEP.
Number of results
equal NT / LS
0
LS
LOGGER STEP
NT
time
Relations between INTEGR. PERIOD and LOGGER STEP
5.2 Measurement range setting - MEASUREMENT RANGE
The MEASUREMENT RANGE is used to set one of the available measurement ranges in the
instrument. In order to open this window the user has to select the MEASUREMENT RANGE text in the
INPUT list by means of the <>, <>push-buttons and press the <ENTER> one.
INPUT list with the MEASUREMENT RANGE selected
There are two ranges available HIGH and LOW. The detailed description of the measurement
ranges parameters is given in App. C. The change of the input range is made by means of the <
>, <
>
push-buttons. After pressing the <ENTER> push-button the change is confirmed and the window closes.
The return to the INPUT list ignoring any changes made in the sub-list is made after pressing the <ESC>
push-button.
5-7
SVAN 956 USER MANUAL
_
MEASUREMENT RANGE windows, the RANGE selection
The range values change due to the calibration factor.
=>
Displays with change of the default range values caused by the calibration factor
5.3 Setting parameters in a profile - PROFILE x
The user enters the PROFILE x sub-list after pressing the <ENTER> push-button on the displayed
inversely PROFILE x text, which has to be selected by means of the <
>, <
> push-buttons.
In the PROFILE x sub-list the following parameters can be programmed independently for each profile:
weighting filter (FILTER), RMS detector type (DETECTOR) and profile's results logged in a file
(LOGGER PEAK, LOGGER P–P, LOGGER MAX and LOGGER RMS).
INPUT list with the PROFILE 1, PROFILE 2 and PROFILE 3 selected
Notice: The change of the profile parameters is not possible when the measurement
is performed. The user has to finish the current measurement.
5.3.1
Weighting filter selection in a profile - FILTER
The following weighting filters are available in a profile of the instrument:
- in the case of acceleration measurements: HP1, HP3, HP10, KB, Wk, Wd, Wc, Wj, Wm, Wh, Wg
and Wb
5-8
SVAN 956 USER MANUAL
PROFILE(1) windows; the selection of the weighting filter in acceleration measurements
- in the case of velocity measurements: Vel1, Vel3, Vel10 and VelMF
PROFILE(1) windows; the selection of the weighting filter in velocity measurements
- in the case of displacement measurements: Dil1, Dil3 and Dil10
PROFILE(1) windows; the selection of the weighting filter in displacement measurements
-
for all types of signal it is possible to use real time filters R1, R2, R3 if they are activated
in the SETUP list (path: SETUP/USER FILTERS/ REAL TIME FILTERS)
PROFILE(1) windows; the selection of the R1, R2, R3 weighting filter
The characteristics of the filters are given in App. D. The selection of the required filter is made
with the <
>, <
> push-buttons. The user can enter the FILTER line in the PROFILE x sub-list pressing
the <
>, <
> push-buttons. After pressing the <ENTER> push-button any changes made
in the sub-list are confirmed and it is closed. The return to the INPUT list ignoring any changes made
in the sub-list is made after pressing the <ESC> push-button.
5.3.2
RMS detector selection - DETECTOR
In the instrument the following RMS detectors are available: 100ms, 125ms, 200ms, 500ms, 1.0s,
2.0s, 5.0s, 10.0s. The selection of the required detector is made with the <
>, <
> push-buttons. The
user can enter the DETECTOR line in the PROFILE x sub-list pressing the <
>, <
> push-buttons. After
5-9
SVAN 956 USER MANUAL
_
pressing the <ENTER> push-button any changes made in the sub-list are confirmed and it is closed. The
return to the INPUT list ignoring any changes made in the sub-list is made after pressing the <ESC> pushbutton.
PROFILE(1) windows; the selection of the RMS detector
5.3.3
PEAK result selection for saving in a logger’s file - LOGGER PEAK
Up to four measurement results from each profile can be saved in the logger’s file
of the instrument. In order to save the PEAK result (cf. the definition in App. D) the user has to activate
this line (by means of the <
>, <
> push-buttons) and place a special character in the brackets using the
<
>, <
> push-buttons. After pressing the <ENTER> push-button any changes made in the window are
confirmed and it is closed. The return to the INPUT list ignoring any changes made in the window
is made after pressing the <ESC> push-button.
...
...
PROFILE(x) windows; the PEAK result to be not saved or saved in a logger’s file
5.3.4
MAX result selection for saving in a logger’s file - LOGGER MAX
In order to save the MAX result (cf. the definition in App. D) the user has to activate this line
(by means of the <
>, <
> push-buttons) and place a special character in the brackets using the <
>,
<
> push-buttons. After pressing the <ENTER> push-button any changes made in the window
are confirmed and it is closed. The return to the INPUT list ignoring any changes made in the window
is made after pressing the <ESC> push-button.
...
5-10
SVAN 956 USER MANUAL
PROFILE(x) windows ; the MAX result to be not saved or saved in a logger’s file
5.3.5
P–P result selection for saving in a logger’s file - LOGGER P-P
In order to save the P–P result (cf. the definition in App. D) the user has to activate this line
(by means of the <
>, <
> push-buttons) and place a special character in the brackets using the <
>,
<
> push-buttons. After pressing the <ENTER> push-button any changes made in the window
are confirmed and it is closed. The return to the INPUT list ignoring any changes made in the window
is made after pressing the <ESC> push-button.
...
PROFILE(x) windows; the P-P result to be not saved or saved in a logger’s file
5.3.6
RMS result selection for saving in a logger’s file - LOGGER RMS
In order to save the RMS result (cf. the definition in App. D) the user has to activate this line
(by means of the <
>, <
> push-buttons) and place a special character in the brackets using the <
>,
<
> push-buttons. After pressing the <ENTER> push-button any changes made in the window
are confirmed and it is closed. The return to the INPUT list ignoring any changes made in the window
is made after pressing the <ESC> push-button.
..
PROFILE(x) windows; the RMS result to be not saved or saved in a logger’s file
5.4 Triggering mode and parameters selection - TRIGGER SETUP
The TRIGGER SETUP sub-list enables the user to set the triggering parameters. It is not present
for the DOSE METER function. This sub-list is opened after the selection of the TRIGGER SETUP text
from the INPUT list by means of the <
>, <> (or <
>, <
> with <SHIFT>) push-buttons and pressing
the <ENTER> one. The TRIGGER SETUP consists of the MEASURE TRIGGER, LOGGER TRIGGER
and RECORDER TRIGGER sub-lists. The return to the INPUT list is made after pressing the <ESC>
push-button.
5-11
SVAN 956 USER MANUAL
_
=> <ENTER> =>
=> <ESC> =>
TRIGGER SETUP selected in the INPUT list and the TRIGGER SETUP window
5.4.1
Trigger parameters setting - MEASURE TRIGGER
The MEASURE TRIGGER is a contexts sub-list in which the triggering can be switched off or on
(TRIGGER), in the case when on - the source of the triggering signal can be determined (SOURCE),
its level (LEVEL) and sometimes also the speed of changes (GRADIENT). In order to enter this sub-list
the user has to select by means of the <
>, <
> push-buttons the MEASURE TRIGGER text
in the TRIGGER SETUP sub-list and press the <ENTER> one.
...
...
...
MEASURE TRIGGER windows
In order to change the displayed inversely parameter the user has to press the <
>, <
> pushbuttons. The confirmation of any change made in the window requires pressing the <ENTER> pushbutton, which simultaneously closes the current display. The MEASURE TRIGGER window is closed
ignoring any changes made, after pressing any time the <ESC> push-button.
5.4.1.1 Switching the triggering on and off - TRIGGER
The triggering of the measurements (TRIGGER) can be switched off using the <
> push-button.
MEASURE TRIGGER window; TRIGGER switched off
The triggering is switched on if one of its five modes is selected: SLOPE +, SLOPE –, LEVEL +,
LEVEL – or GRAD +. The selection of the triggering mode is performed using the <
>, <
> pushbuttons. If the instrument works with the triggering switched on, the “Antenna” icon is flashing on the
display in the case when the triggering condition was not fulfilled.
Displays during the measurements while the triggering condition is not fulfilled
In the case when the SLOPE + is selected, the measurement starts when the arising signal will
pass the level determined in the LEVEL. In the case when the SLOPE – is selected, the measurement
starts when the falling down signal will pass the level determined in the LEVEL. The measurement
5-12
SVAN 956 USER MANUAL
is stopped when the conditions set in the MEASUREMENT SETUP sub-list are fulfilled, after pressing
the <START / STOP> push-button or after receiving the proper control code remotely.
MEASURE TRIGGER windows with the SLOPE modes selected
In the case when the LEVEL + is selected, in each second of the measurement the triggering
condition is checked; the measurement is registered only when the signal has the greater level than this
determined in the LEVEL and in the other case the measurement result is skipped.
In the case when the LEVEL – is selected, in each second of the measurement the triggering
condition is checked; the measurement is registered only when the signal has the lower level than this
determined in the LEVEL and in the other case the measurement result is skipped.
MEASURE TRIGGER windows with the LEVEL modes selected
In the case when the GRAD + is selected, in each second of the measurement the triggering
condition is checked; the measurement is registered only when the signal has the greater level than this
determined in the LEVEL and the speed of the signal changes is not less than that selected
in the GRADIENT. In the other case the measurement result is skipped.
MEASURE TRIGGER window with the GRAD + mode selected
5.4.1.2 Selection of the triggering signal - SOURCE
It is assumed that only one measured result can be used as a source of the triggering signal
in the LEVEL METER mode, namely the output signal from the RMS detector coming from the first profile
which is denoted here as RMS(1). This position does not become active (it is not displayed inversely) and
the text stated here remains unchanged in the case of LEVEL +, LEVEL – or GRAD + triggering mode.
After pressing there the <
> push-button, the SOURCE line is skipped.
=> <> =>
<>
...
<>
MEASURE TRIGGER windows with not active SOURCE signal line
5-13
SVAN 956 USER MANUAL
_
In the case of SLOPE + and SLOPE – as a source of the triggering signal can be used the signal
connected to the external input/output socked named I/O. The selection of the source of the triggering
signal is performed using the <
>, <
> push-buttons.
...
MEASURE TRIGGER windows with the SOURCE signal selection
Notice: Only one signal measured in the instrument - the RMS detector in the first profile can be used as the triggering signal. Additionally, the signal from Ext.I/O can be also used as the trigger
source in the SLOPE + and SLOPE – modes.
5.4.1.3 Setting the level of the triggering signal - LEVEL
The level of the triggering signal (LEVEL) can be set in 1 dB step (or 10 dB steps) from 1 mm/s2 to
10.0 km/s2 (60 dB to 140 dB) range using the <
>, <
> push-buttons (or <
>, <
> with <SHIFT>).
...
...
MEASURE TRIGGER windows with the LEVEL selection in the SLOPE + mode
Notice: The LEVEL value of the triggering signal refers to the instantaneous value of the
RMS result from the first profile calculated during the period depending on selected DETECTOR (path:
MENU / INPUT / PROFILE 1 / DETECTOR).
<
>+<SHIFT>
<
>+<SHIFT>
MEASURE TRIGGER windows with the LEVEL selection in the SLOPE – mode (10 dB step down)
<
>
<
>
MEASURE TRIGGER windows with the LEVEL selection in the LEVEL + mode (1 dB step up)
5-14
SVAN 956 USER MANUAL
MEASURE TRIGGER windows with the LEVEL selection in the GRAD + mode (1 dB step down)
5.4.1.4 Setting the speed of the triggering signal changes - GRADIENT
The speed of the triggering signal changes (GRADIENT) can be set in 1 dB/millisecond step
(or 10 dB/millisecond steps) from 1 dB/ms to 100 dB/ms range using the <
>, <
> push-buttons
(or <
>, <
> with <SHIFT>).
<
>
<
>+<SHIFT>
MEASURE TRIGGER windows with the GRADIENT selection (1 dB/ms and 10 dB/ms step up)
5.4.2
Trigger parameters in logger setting - LOGGER TRIGGER
The LOGGER TRIGGER parameters influence the way the measurement results are saved
in the logger. It is a contexts sub-list in which the triggering in logger can be switched off or on
(TRIGGER), in the case when on (LEVEL +) - the source of the triggering signal is determined
(SOURCE), its level can be selected (LEVEL), the number of the results saved in the logger before
the fulfilment of the triggering condition (PRE) and the number of the results saved in the logger after
the fulfilment of the triggering condition (POST). If the triggering signal is greater than the selected
in the LEVEL, the logger contains:
• the measurement results registered directly before the fulfilment of the triggering condition; time
of the registration can be calculated by multiplying the value set in the PRE by the time period taken
from the LOGGER STEP (path: MENU / INPUT / MEASUREMENT SETUP / LOGGER STEP);
• all measurement results up to the moment the triggering signal falls down the LEVEL;
• the results registered directly after the fulfilment of the triggering condition; time of the registration can
be calculated by multiplying the value set in the POST by the time period taken from
the LOGGER STEP (path: MENU / INPUT / MEASUREMENT SETUP / LOGGER STEP).
In order to change the displayed inversely parameter the user has to press the <
>, <
> pushbuttons. The confirmation of any change made in the window requires pressing the <ENTER> pushbutton, which simultaneously closes the current display. The LOGGER TRIGGER window is closed
ignoring any changes made, after pressing any time the <ESC> push-button.
5.4.2.1 Switching the logger triggering on and off - TRIGGER
The logger triggering of the measurements (TRIGGER) can be switched off using the <> pushbutton (or <> with <SHIFT>). The triggering is switched on if the LEVEL + or LEVEL – mode
is selected using the <> push-button (or <> with <SHIFT>).
=><
>=>
=><
>=>
5-15
SVAN 956 USER MANUAL
_
LOGGER SETUP windows, trigger mode selection
5.4.2.2 Selection of the triggering signal in logger - SOURCE
It is assumed that only one measured result can be used as a source of the triggering signal
in the logger, namely the output signal from the RMS detector coming from the first profile which is
denoted here as RMS(1). This position does not become active (it is not displayed inversely) and the text
stated here remains unchanged. After pressing the <> push-button, the SOURCE line is skipped.
=><
>=>
LOGGER TRIGGER windows with the not active SOURCE signal line
5.4.2.3 Setting the level of the triggering signal in the logger - LEVEL
The 2level of the triggering
signal in logger (LEVEL) can be set in 1 dB step (or 10 dB steps) from
2
1.00 mm/s to 10.0 km/ s (24 dB to 136 dB) range using the <>, <> push-buttons (or <>, <> with
<SHIFT>).
LOGGER TRIGGER windows with the LEVEL selection (1 dB step up)
LOGGER TRIGGER windows with the LEVEL selection (1 dB step up, cont.)
Notice: The LEVEL value of the triggering signal in logger refers to the instantaneous value
of the RMS result from the first profile calculated during the period depending on selected DETECTOR
(path: MENU / INPUT / PROFILE 1 / DETECTOR).
<>+<SHIFT>
5-16
<>+<SHIFT>
SVAN 956 USER MANUAL
<>+<SHIFT>
<>+<SHIFT>
<>+<SHIFT>
<>+<SHIFT>
LOGGER TRIGGER windows with the LEVEL selection (10 dB step up)
5.4.2.4 Selection of the number of the results to be saved in the logger before the fulfilment of the
triggering condition - PRE
In the PRE line the number of the results registered in the logger’s file before the fulfilment
of the triggering condition can be set. This number is within the limits 0..50 and can be set with the step
equal to one using the <>, <> push-buttons or with the step equal to 10 using the <>, <> with
<SHIFT>.
=>
<>
...
LOGGER TRIGGER windows with the PRE selection
Time period of the measurements which are saved in the logger before the fulfilment
of the triggering condition can be calculated multiplying the value set in the PRE by the value set
in the LOGGER STEP (path: MENU / INPUT / MEASUREMENT SETUP). The result of the calculation
is presented in the same line, at the right side of the display.
=>
...
=>
=>
LOGGER TRIGGER windows with the PRE selection for different LOGGER STEPS
The value set in the PRE is confirmed and the window is closed after pressing the <ENTER> pushbutton. After pressing the <ESC> push-button the window is closed ignoring the settings made
in the PRE.
5.4.2.5 Selection of the number of the results to be saved in the logger after the fulfilment of the
triggering condition - POST
5-17
SVAN 956 USER MANUAL
_
In the POST line the number of the results registered in the logger’s file after the fulfilment
of the triggering condition can be set. This number is within the limits 0..200 and can be set with the step
equal to one using the <>, <> push-buttons or the step equal to 10 using the <>, <> with
<SHIFT>.
<
>
=>
...
LOGGER TRIGGER windows with the POST selection
Time period of the measurements which are saved in the logger after the fulfilment of the triggering
condition can be calculated multiplying the value set in the POST by the value set in the LOGGER STEP
(path: MENU / INPUT / MEASUREMENT SETUP). The result of the calculation is presented in the same
line, at the right side of the display.
=>
...
=>
=>
LOGGER TRIGGER windows with the POST selection for different LOGGER STEPS
=>
...
=>
=>
...
LOGGER TRIGGER windows with the POST selection for different LOGGER STEPS
The value set in the POST is confirmed and the window is closed after pressing the <ENTER>
push-button. After pressing the <ESC> push-button the window is closed ignoring the settings made
in the POST.
5.4.3
Trigger parameters for recorder setting - RECORDER TRIGGER
The RECORDER TRIGGER enables the user to set the parameters of time domain signal
recording on the external USB memory stick (path: MENU / SETUP / USB-HOST PORT /
SRT RECORDING or WAVE RECORDING or EVENT RECORDING). In order to enter
5-18
SVAN 956 USER MANUAL
RECORDER TRIGGER window the user has to select the RECORDER TRIGGER text in the
TRIGGER SETUP window using the <
>, <
> push-buttons and press <ENTER>.
TRIGGER SETUP window; the RECORDER TRIGGER text highlighted
5.4.3.1 Selecting trigger mode - TRIGGER
In the TRIGGER position following options are available: Off, SLOPE +, SLOPE –, LEVEL +,
LEVEL –, GRAD +. The selection is made by pressing <
>, <
> push-buttons and <ENTER> one.
The RECORDER TRIGGER window is closed ignoring any changes made in there, after pressing any
time the <ESC> push-button.
RECORDER TRIGGER windows; the TRIGGER selection
5.4.3.2 Selecting the triggering signal - SOURCE
In the case when in the TRIGGER position SLOPE + or SLOPE – is selected it is possible
to choose the SOURCE. Available sources are RMS(1) and EXT.I/O. The selection is made using <
>,
<
> push-buttons and pressing <ENTER> one. The RECORDER TRIGGER window is closed ignoring
any changes made in there, after pressing any time the <ESC> push-button.
a)
b)
RECORDER TRIGGER windows; the source selection for SLOPE + (a) and SLOPE – (b)
5.4.3.3 Selecting level for recording trigger- LEVEL
The level of the triggering signal for recording (LEVEL) can be set in 1 dB step (or 10 dB steps)
from 1 mm/s2 to 10 km/s2 (60 dB to 140 dB) range using the <
>, <
> push-buttons (or <
>, <
> with
<SHIFT>). The level can be expressed not only in in linear units (path: MENU / DISPLAY / DISPLAY
SETUP / SCALE / LIN) but also in decibels (placing in the path LOG instead of LIN).
5-19
SVAN 956 USER MANUAL
_
a)
b)
RECORDER TRIGGER windows with the LEVEL selection, level expressed in linear units, 1 dB step up (a)
and 10 dB step up (b)
5.4.3.4 Setting the speed of the triggering signal changes - GRADIENT
GRADIENT appears on the display when in the TRIGGER position the GRAD + option is selected.
In the GRADIENT position it is possible to select the GRADIENT value. The available values are from
1 dB/ms to 100 dB/ms. The selection is made by pressing <
>, <
> push-buttons and <ENTER> one.
The RECORDER TRIGGER window is closed ignoring any changes made in there, after pressing any
time the <ESC> push-button.
RECORDER TRIGGER windows with the GRADIENT selection (1 dB step up)
RECORDER TRIGGER windows with the GRADIENT selection (10 dB step up)
5.5 Selection of FFT analysis parameters - FFT
The FFT is accessible in the INPUT list when the FFT function is selected in
MEASUREMENT FUNCTION window (path: MENU / FUNCTION / MEASUREMENT FUNCTION / FFT).
This sub-list is opened after the selection of the FFT text from the INPUT list by means of the <
>, <
>
(or <
>, <
>) push-buttons and pressing the <ENTER> one.
The FFT consists of the parameters, which influence the calculation and logging the results
of the FFT analysis: AVERAGING, FILTER, BAND, WINDOW, LINES and LOGGER. The FFT window
is closed ignoring any changes made in there, after pressing any time the <ESC> push-button.
=> <ENTER> =>
5-20
SVAN 956 USER MANUAL
FFT selected in the INPUT list and the FFT window opened
5.5.1
The averaging of spectra in the FFT analysis - AVERAGING
The AVERAGING influences the way in which the spectra in the FFT analysis are averaged.
Up to the internal software version named as 6.04 only LINEAR is available (this position can not be
accessed and changed).
5.5.2
Weighting filter during the FFT analysis - FILTER
During the FFT analysis only Z filter (type 1 according to the IEC 61672-1 standard) is available.
5.5.3
Selecting the analysis band of the signal - BAND
The BAND position enables the user to select the band in which the narrow-band analysis
of the signal has to be performed. The user has the following possibilities: 22.4 kHz, 11.2 kHz, 5.6 kHz,
2.8 kHz, 1.4 kHz, 700 Hz, 350 Hz, 175 Hz and 87.5 Hz.
The selection of the required value is made by means of the <
>, <
> push-buttons.
The confirmation of the change made in the line requires pressing the <ENTER> push-button, which
simultaneously closes the window. The FFT window is closed ignoring any changes made in there, after
pressing any time the <ESC> push-button.
FFT window; the BAND selection
5.5.4
Selecting the time window for the FFT analysis - WINDOW
The WINDOW position enables the user to select the coefficients of time window which are used
in the FFT analysis. Available time windows of the FFT analysis are as follows: HANNING, RECTANGLE,
FLAT TOP, KAISER-BESSEL.
The selection of the window is made by means of the <
>, <
> push-buttons. The confirmation
of the change made in the line requires pressing the <ENTER> push-button, which simultaneously closes
the window. The FFT window is closed ignoring any changes made in there, after pressing any time
the <ESC> push-button.
5-21
SVAN 956 USER MANUAL
_
FFT sublist; the WINDOW selection
5.5.5
Selecting the number of the lines of FFT analysis - LINES
The LINES position enables the user to select the number of lines of the FFT analysis. There are
three values available: 1920, 960 and 480. The selection of the value is made by means of the <
>, <
>
push-buttons. The confirmation of the change made in the position requires pressing the <ENTER> pushbutton, which simultaneously closes the window. The FFT window is closed ignoring any changes made in
there, after pressing any time the <ESC> push-button.
FFT window; the LINES selection
5.5.6
Enabling the FFT spectra time history logging - LOGGER
The LOGGER enables to record spectra of the FFT analysis in the logger file. The activation
of the logger is possible only if LOGGER functionality has been activated in the MEASUREMENT SETUP
sublist (path: MENU / INPUT / MEASUREMENT SETUP / LOGGER ON). In order to switch on the logger
of the FFT analysis the user has to press the <
> push-button and the <ENTER> one. If, instead
of the <ENTER> push-button the <ESC> one is pushed, the selection is ignored and the FFT sub-list
is closed.
FFT window; the LOGGER activation
5.6 Selection of 1/1 octave and 1/3 octave spectrum parameters - SPECTRUM
The SPECTRUM appears in the INPUT list when the 1/1 OCTAVE or 1/3 OCTAVE function
is
selected
in
the
MEASUREMENT FUNCTION
(path:
MENU
/
FUNCTION
/
MEASUREMENT FUNCTION / 1/1 OCTAVE or 1/3 OCTAVE). This sub-list is opened after the selection
of the SPECTRUM text from the INPUT list by means of the <
>, <
> (or <
>, <
>) push-buttons and
pressing the <ENTER> one.
The SPECTRUM consists of the parameters, which influence the calculation and logging the results
of 1/1 OCTAVE or 1/3 OCTAVE analysis: FILTER, BAND and LOGGER. The SPECTRUM window
is closed ignoring any changes made in there, after pressing any time the <ESC> push-button.
5-22
SVAN 956 USER MANUAL
=> <ENTER> =>
SPECTRUM selected in the INPUT list and the SPECTRUM window opened
5.6.1
Selecting the weighting filter during 1/1 OCTAVE or 1/3 OCTAVE analysis - FILTER
During 1/1 OCTAVE or 1/3 OCTAVE analysis only Z filter (type 1 according to the IEC 61672-1
standard) is available.
5.6.2
Selecting the band during the 1/1 OCTAVE or 1/3 OCTAVE analysis - BAND
The BAND position enables the user to select the band in which the 1/1 OCTAVE or 1/3 OCTAVE
analysis of the signal has to be performed. In 956 instrument only FULL band is available. The selection
of this parameter is made by means of the <>, <> push-buttons. The confirmation of the change made
in the line requires pressing the <ENTER> push-button, which simultaneously closes the window. The
SPECTRUM window is closed ignoring any changes made in there, after pressing any time
the <ESC> push-button.
5.6.3
Activation of logger for 1/1 OCTAVE or 1/3 OCTAVE analysis results - LOGGER
The RMS result from 1/1 OCTAVE or 1/3 OCTAVE analysis can be saved in the logger’s file
of the instrument (or on the USB memory stick).
The activation is made by placing a special character in the LOGGER position. The activation
is possible when the LOGGER functionality is switched on in the MEASUREMENT SETUP window (path:
MENU / INPUT / MEASUREMENT SETUP / LOGGER).
If the LOGGER functionality is switched off, the position is not accessible. The confirmation
of the change made in the position requires pressing the <ENTER> push-button, which simultaneously
closes the window. The SPECTRUM window is closed ignoring any changes made in there, after pressing
any time the <ESC> push-button.
SPECTRUM window; the LOGGER selection
5.7 Selection of enveloping parameters - ENVELOPING
The ENVELOPING appears in the INPUT list when the ENVELOPING function is selected (path:
MENU / FUNCTION / MEASUREMENT FUNCTION / ENVELOPING). This sub-list is opened after the
selection of the ENVELOPING text from the INPUT list by means of the <
>, <
> (or <>, <>) pushbuttons and pressing the <ENTER> one.
5-23
SVAN 956 USER MANUAL
_
The ENVELOPING consists of the parameters, which influence the calculation and saving
the results of the ENVELOPING: FILTER, BAND and LINES. The ENVELOPING window is closed
ignoring any changes made in there, after pressing any time the <ESC> push-button.
ENVELOPING selected in the INPUT list and the ENVELOPING window opened
5.7.1
Selecting the weighting filter during the enveloping calculation - FILTER
The FILTER influences the calculations of ENVELOPING function. The selection of this parameter
is made by means of the <>, <> push-buttons.
The proper BAND value changes (decreases) automatically when selected band width is too wide
for the selected centre frequency value.
The confirmation of the change made in the line requires pressing the <ENTER> push-button,
which simultaneously closes the window.
The following weighting filters are available in case of enveloping function: 20.0kHz, 16.0kHz,
12.5Hz, 10.0kHz, 8.00kHz, 6.30kHz, 5.00kHz, 4.00Hz, 3.15Hz, 2.50kHz, 2.00kHz, 1.60kHz, 1.25kHz,
1600Hz, 800Hz.
ENVELOPING window; the FILTER selection
5.7.2
Selecting the band during the enveloping analysis - BAND
The BAND position enables the user to select the band in which the ENVELOPING of the signal
has to be calculated.
Available values of the bands of the ENVELOPING are as follows: 22.4kHz, 11.2kHz, 5.6kHz,
2.8kHz, 1.4kHz, 700Hz, 350Hz, 175Hz, 87.5Hz, 44Hz, 22Hz. This parameter changes (decreases)
automatically due to the centre frequency value selected in the FILTER position.
5-24
SVAN 956 USER MANUAL
The selection of this parameter is made by means of the <>, <> push-buttons.
The confirmation of the change made in the line requires pressing the <ENTER> push-button, which
simultaneously closes the window. The FFT window is closed ignoring any changes made in there, after
pressing any time the <ESC> push-button.
ENVELOPING window; the BAND selection
5.7.3
Selecting the number of the lines in enveloping spectrum - LINES
The LINES position enables the user to select the number of lines in the spectrum of enveloping.
There are three values available: 400, 800 and 1600.
The selection of the value is made by means of the <>, <> push-buttons. The confirmation
of the change made in the position requires pressing the <ENTER> push-button, which simultaneously
closes the window. The ENVELOPING window is closed ignoring any changes made in there, after
pressing any time the <ESC> push-button.
ENVELOPING window; the LINES selection
5.8 Selection of RPM measurements parameters - RPM
The RPM (Revolutions Per Minute) position appears in the INPUT list when the RPM function was
activated with a special code in the SETUP list (path: MENU / SETUP / RPM).
This sub-list is opened after the selection of the RPM text from the INPUT list by means
of the <>, <> (or <>, <>) push-buttons and pressing the <ENTER> one. The RPM consists of three
positions: RPM, PULSE/ROTATION and UNIT. The RPM window is closed ignoring any changes made in
there, after pressing any time the <ESC> push-button.
RPM selected in the INPUT list and the RPM window opened
5-25
SVAN 956 USER MANUAL
5.8.1
_
Switching on the RPM measurement - RPM
The placing a special character [√
√] in the line with RPM text enables the RPM function.
The selection is made by means of the <>, <> push-buttons. The confirmation of the activation
requires pressing the <ENTER> push-button, which simultaneously closes the window.
The ENVELOPING window is closed ignoring any changes made in there, after pressing any time
the <ESC> push-button.
RPM window; the RPM selection
5.8.2
Selecting the number of pulses / rotations - PULSE / ROTATION
The PULSE / ROTATION enables the user to select the number of pulses / rotations. Available
values are as follows: 1, 2, .. 360. The required parameter can be set by means of the <>, <> pushbuttons (with the step equal to 1) or by means of the <>, <> push-buttons pressed together
with the <SHIFT> one (with the step equal to 10). The confirmation of the change made in the position
requires pressing the <ENTER> push-button, which simultaneously closes the window. The RPM window
is closed ignoring any changes made in there, after pressing any time the <ESC> push-button.
RPM window; the PULSES/ROTATIONS selection with 1 unit step
RPM window; the PULSES/ROTATIONS selection with 10 unit step
5.8.3
Selecting the unit of RPM measurement - UNIT
The UNIT enables the user to select the unit of the measurement. In this position two option
are available RPM – revolutions per minute and RPS – revolutions per second. The selection
of the unit is made by means of the <>, <> push-buttons. The confirmation of the change made
in the position requires pressing the <ENTER> push-button, which simultaneously closes the window.
The RPM window is closed ignoring any changes made in there, after pressing any time the <ESC> pushbutton.
RPM window; the UNIT selection
5-26
SVAN 956 USER MANUAL
6
DATA AVAILABLE ON THE DISPLAY - DISPLAY
In order to open the DISPLAY list the user has to:
• press the <MENU> push-button,
• select from the main list, using the <
>, <
> (or <
>, <
>)push-buttons, the DISPLAY text (highlight
it inversely),
• press the <ENTER> push-button.
Pressing the <SHIFT> and <
> (or <SHIFT> and <
>) results in a movement to the first position of
the opened list and pressing the <SHIFT> and <
> (or <SHIFT> and <
>) results in a movement
to the last position of the opened list.
Display in the main list; the DISPLAY text highlighted (displayed inversely)
The DISPLAY list is used for setting the various parameters, which are mainly dedicated
for the control of the display. The following items are present on this list:
DISPLAY MODES
enables one to select the mode of the measurement results presentation;
DISPLAY SETUP
enables one to change the scale in the graphical modes of result’s presentation
and the parameters of the logger’s result presentation;
LOGGER VIEW
enables one to select and present the results stored in the logger’s files;
SCREEN SETUP
enables one to set the contrast and the switch on/off the backlight timeout
of the instrument’s display;
BATTERY
it informs the user about the source of powering of the instrument and current
power supply voltage;
UNIT LABEL
informs the user about the serial number of the instrument, the version of
the internal software and the standards to which conform the measurement
results.
In each available position any change is performed by means of the <
>, <
> and <
>, <
>
push-buttons. In order to confirm the selection the <ENTER> push-button has to be pressed. After this
confirmation, the opened window or list is closed. In order to ignore any changes made in the opened
window or list the user has to press the <ESC> push-button.
Display with the DISPLAY list
6.1 Selection of the modes of measurement results presentation DISPLAY MODES
The DISPLAY MODES sub-list enables one the selection of the currently available modes of
displaying the results of measurement. The selection is made by placing or replacing the special
6-1
SVAN 956 USER MANUAL
_
character in the inversely displayed position of the DISPLAY MODES sub-list by means of the <
>, <
>
push-buttons. In order to confirm the selection the user has to press the <ENTER> push-button.
The mode of the results presentation is related with the selection of the instrument’s function (VLM,
1/1 OCTAVE, 1/3 OCTAVE, FFT analyser etc.). Only One Profile mode cannot be switched off
independently from the current mode of the instrument.
For the Vibration Level Meter the following possibilities of the measurement results presentation
are available:
- One Profile,
-
3 PROFILES,
-
LOGGER (time history)
-
FILE INFO.
a)
b)
c)
DISPLAY MODES windows in VM
The LOGGER mode of results presentation is available if, and only if, the data from at least
one profile are logged in the logger’s file. If the LOGGER position is switched on ([√
√]) but there was
nothing stored in the logger’s file (in the selected profile there were selected results (PEAK, P–P, MAX
or RMS in the case of VM) but the instrument still waits for the logger results, i.e. the LOGGER STEP is
long, the NO RESULTS text is displayed. When the LOGGER is selected as active and the LOGGER
positions in all profiles are not selected, the LOGGER mode of results presentation is skipped.
Display in the LOGGER mode when there is nothing in the logger to be displayed (after setting LOGGER as
active)
The display with the measurement result in so-called one profile mode is presented below.
On the top of the display (under the icons line) there are the following data: the function name (RMS,
VDV, OVL, PEAK, P–P, MTVV in the case of vibration measurements), the detector time constant (in VM
when the detector is exponential: 100 ms, 125 ms, .. 10.0 s, .. or Lin (for RMS result) when the detector
is linear)
Notice: In the case of LINEAR RMS INTEGRATION (path: MENU / SETUP /
RMS INTEGRATION / LINEAR) for RMS result on the display appears Lin. instead of detector time
constanst.
Notice: There is not any indication of the detector in the case of PEAK and OVL results.
The name of the implemented filter (path: MENU / INPUT / PROFILE x / FILTER) is presented as
the last element of the first line (HP1, HP3, HP10, Vel1, Vel3, Vel10, VelMF, Dil1, Dil3, Dil10, KB, Wk,
Wd, Wc, Wj, Wm, Wh, Wg, Wb in VM).
6-2
SVAN 956 USER MANUAL
2
The result of the measurement together with its unit (dB or m/s for almost all results and % only
for OVL) is given in the second line. The profile, the results are coming from, is visible in the bottom
of the display (Profile(1), Profile(2) or Profile(3)). The vertical line showing the value of the result in the
analogue-like form together with the scale is presented at the left side of the display. The real time clock is
visible in the bottom right corner of the display. The selection of the result is made pressing the <>, <>
push-buttons.
Measurement results in VM presented in one profile mode
The profile is changed after pressing the <SHIFT> and <> or <SHIFT> and <> push-buttons.
The same result can be achieved after pressing the <ALT> and <> or <ALT> and <> push-buttons.
There is also possible to present differently the measurement data in one profile after pressing
the <ALT> and <> or <ALT> and <> push-buttons. In this case, the result is displayed
with the biggest possible fonts. The name of the result together with the units is given in the bottom line.
The current result from a selected profile is changed after pressing the <> or the <> push-buttons. The
profile the results are coming from is changed after pressing the <SHIFT> and <> or <SHIFT> and <>
but the profile’s number is not visible on the display.
The same result can be achieved after pressing the <ALT> and <> or <ALT> and <> pushbuttons. When the statistics level Lxx is presented, the another levels from the set of ten values
are available after pressing the <SHIFT> and <> or <SHIFT> and <> push-buttons.
The presentation mode is changed (to 3 PROFILES and LOGGER
if all of them are currently available) after pressing the <> or <> push-buttons.
or
FILE INFO
Measurement results in VM and unknow profile presented with the biggest fonts in one profile mode
6-3
SVAN 956 USER MANUAL
_
When the measurements are performed, what is indicated on the display by the loudspeaker icon,
the clock displayed in the right bottom shows the current second of the measurement. The value
presented there belongs to the range [1, INTEGRATION PERIOD].
The envelope icon visible above and below indicates that the selected results from the profiles
(path: MENU / INPUT / PROFILE x) are logged.
Displays during the measurement performed in VM with the active LOGGER (an envelope icon)
The results can be saved using SAVE, SAVE NEXT or AUTO SAVE functions after the end
of the measurements caused by the any reason (remote control, pressed <STOP> push-button or
fulfilment of the INTEGR. PERIOD / REP.CYCLE condition).
It is not possible to save the results during the execution of the measurements.
6.1.1
Switching on/off spectrum view - SPECTRUM
The SPECTRUM position is accesible only in 1/1 OCTAVE, 1/3 OCTAVE and FFT function (path:
MENU / FUNCTION / MEASUREMENT FUNCTION). The possibility of the measurement results
presentation in SPECTRUM can be switched on or off placing or replacing the special character
in the displayed inversely line with the SPECTRUM text by means of the <>, <> push-buttons.
In order to confirm the selection the user has to press the <ENTER> push-button. This confirmation
closes also the DISPLAY MODES sub-list. The sub-list can be also closed after pressing the <ESC>
push-button but the settings made there are ignored.
DISPLAY MODES windows, SPECTRUM position accessible
a)
b)
c)
Displays in SPECTRUM mode for 1/1 OCTAVE (a), 1/3 OCTAVE (b) and FFT (c)
6.1.2
6-4
Switching on/off three profiles view - 3 PROFILES
SVAN 956 USER MANUAL
The possibility of the measurement results presentation in 3 PROFILES can be switched on or off
placing or replacing the special character in the displayed inversely line with the 3 PROFILES text
by means of the <>, <> push-buttons. In order to confirm the selection the user has to press
the <ENTER> push-button. This confirmation closes also the DISPLAY MODES sub-list. The sub-list can
be also closed after pressing the <ESC> push-button but the settings made there are ignored.
Setting on and off the accessibility of three profiles presentation mode
The exemplary measurement results presented in the 3 PROFILES mode when the results from
three profiles are on the display are given below. In the case of the 3 PROFILES in three consecutive
lines the following data are seen: the name of the function, the result together with the units and the profil
number (P(1), P(2), P(3)). The current real time, the profile from which the result is displayed inversely
and the name of the file, in which the results are saved, are displayed at the bottom. At the right bottom,
there is another clock, which displays real time in the case when the measurements
are performed and the current second of the measurement – in the opposite case.
Measurement results in 3 PROFILES mode
The presented result in a selected profile is changed using the <>, <> push-buttons
as presented below.
<>
<>
Results in 3 PROFILES mode; selection of the result in a profile
The change of the selected (displayed inversely) profile is done pressing the <SHIFT> and <> or
<SHIFT> and <> push-buttons. The same result can be achieved after pressing the <ALT> and <> or
<ALT> and <> push-buttons.
<SHIFT>+<
>
<SHIFT>+<
>
Results in 3 PROFILES mode; selection of the profile
During the measurements, which are indicated by the loudspeaker icon, the current time
from the range [1, INTEGRATION PERIOD] is displayed on the right bottom clock. The envelope icon
indicates that results selected in the profiles (path: MENU / INPUT / PROFILE x) are logged.
6-5
SVAN 956 USER MANUAL
_
Displays during the measurement performed with the active LOGGER (envelope icon)
There is also possible to present differently the measurement data in 3 PROFILES after pressing
the <ALT> and <> or <ALT> and <> push-buttons. In this case, at the left side of the display three
analogue-like indicators are shown, each one for the selected result from a profile. The currently active
profile is marked by the cursor and inversely displayed name of the function. The filter selected in that
profile and the integration type (in the case of the linear one) or the detector type (in the case
of exponential) are written below the measurement results. During the measurements, the bottom right
clock displays the current time from the range [1, INTEGRATION PERIOD]. The current result from
a selected profile is changed after pressing the <> or the <> push-buttons. The profile the results
are coming from is changed after pressing the <SHIFT> and <> or <SHIFT> and <>. The same result
can be achieved after pressing the <ALT> and <> or <ALT> and <> push-buttons. When
the statistics level Lxx is presented, the another levels from the set of ten values are available after
pressing the <SHIFT> and <> or <SHIFT> and <> push-buttons. The results can be saved using
SAVE, SAVE NEXT or AUTO SAVE functions after the end of the measurements caused by the selected
reasons. It is not possible to save the results during the execution of the measurements. In the case when
the saving was done, the name of the logger’s file is presented in the bottom line of one profile display and
the clock starts to show the real time. The presentation mode is changed (to one profile, STATISTICS and
LOGGER or FILE INFO if all of them are currently available) after pressing the <> or <> push-buttons.
Displays during the measurement performed in LEVEL METER mode with the active LOGGER (the first
three) and after saving the results (the last one)
6.1.3
Setting on/off logger view - LOGGER
The possibility of the presentation of the measurement results, which are saved in the logger,
on the instrument’s display can be switched on or off placing or replacing the special character
in the displayed inversely line with the LOGGER text by means of the <>, <> push-buttons. In order
to confirm the selection the user has to press the <ENTER> push-button. This confirmation closes also
the DISPLAY MODES sub-list. The sub-list can be also closed after pressing the <ESC> push-button but
the settings made there are ignored.
Setting on and off the accessibility of LOGGER presentation mode
The results saved in the logger can be presented in three different modes which differ slightly each
other. These modes are changed after pressing the <ALT> and <> or the <ALT> and <> pushbuttons or they can be set in the VIEW (path: MENU / DISPLAY / DISPLAY SETUP / LOGGER VIEW /
VIEW).
6-6
SVAN 956 USER MANUAL
Exemplary displays with the measurement results saved in the logger
6.1.4
Setting on/off the view of the file description - FILE INFO
The possibility of the additional file description presented on the instrument’s display can
be switched on or off placing or replacing the special character in the displayed inversely line
with the FILE INFO text by means of the <>, <> push-buttons. In order to confirm the selection
the user has to press the <ENTER> push-button. This confirmation closes also the DISPLAY MODES
sub-list. The sub-list can be also closed after pressing the <ESC> push-button but the settings made
there are ignored.
Setting on and off the file description presentation mode
In the FILE INFO window the file name, its size, date and time of the registration of the main results
(cf. App. B) and time (so-called ELAPSED TIME) during which the main results saved in the logger were
measured. The value presented there belongs to the range [1, INTEGRATION PERIOD] and depends on
the moment and the way the measurements were stopped.
Exemplary contents of the FILE INFO window
6.2 Setting the parameters of the graphical modes - DISPLAY SETUP
The DISPLAY SETUP sub-list enables the user to change several parameters of the graphical
results presentations. Using the DISPLAY SCALE sub-list for example, one can select the scale
in the available modes of graphical presentation of the measurement results (time history in the LOGGER
and spectra in the SPECTRUM). Using the TOTAL VALUES sub-list it is possible to select the weighting
filters used in the calculation of the Total values. This sub-list appears on the display only in the case
of 1/1 OCTAVE or 1/3 OCTAVE analyser. Using the SPECTRUM TYPE sub-list, which appears
on the display only in VM, it is possible to select the spectrum type which has to be presented during
the vibration measurements. In order to enter the DISPLAY SETUP list one has to press the <ENTER>
push-button on the inversely displayed DISPLAY SETUP text of the DISPLAY list. The DISPLAY SETUP
sub-list is closed and the instrument returns to the DISPLAY after pressing the <ESC> push-button, which
ignores any changes in the positions of the sub-list or the <ENTER> push-button, which confirms
the changes.
6-7
SVAN 956 USER MANUAL
_
DISPLAY list with the DISPLAY SETUP selected
6.2.1
Setting the scale of the presentation and the display’s grid - DISPLAY SCALE
The DISPLAY SCALE sub-list enables the user to change the scale in the available modes
of graphical presentation of the measurement results and switch on/off the grid. In order to enter this list
one has to press the <ENTER> push-button on the inversely displayed DISPLAY SCALE text
of the DISPLAY SETUP sub-list. The DISPLAY SCALE sub-list is closed and the instrument returns
to the DISPLAY SETUP sub-list after pressing the <ESC> (the settings made there are not confirmed) or
the <ENTER> push-button (the settings are confirmed).
b)
c)
a)
DISPLAY SETUP windows in VLM (a) in 1/1 and 1/3 OCTAVE (b) and in FFT (c)
6.2.1.1 Setting the scale of the measurement results presentation - SCALE
In the SCALE position two options are available: LIN (linear) and LOG (logarithmic).
In the case of the first one the graphical presentation and the units both are linear. In the latter case
the graphical presentation is given in the logarithmic scale and the measurement results are expressed in
decibels (the result is related to the values set in the REFERENCE LEVEL – path: MENU / SETUP /
REFERENCE LEVEL). It is possible to set the required option using the <>, <> push-buttons.
The confirmation of the selection is made by pressing the <ENTER> push-button. The return without
taking into account any change is made after pressing the <ESC> push-button.
Displays with the possible options of the vibration SCALE
a)
b)
Measurement results presented in linear [mm/s2] (a) and logarithmic [dB] (b) scale
6.2.1.2 Scaling the vertical axis of the graphical mode presentation - DYNAMIC
The DYNAMIC position appears on the display when logarithmic (LOG) scale is selected in SCALE
position. It enables the user to select the proper scaling of the graphical mode presentation. In the case of
the vertical axis one can obtain the double, four times and eight times expansion (as the default the
vertical axis corresponds to 80 dB, after expansion it corresponds to 40 dB, 20 dB and 10 dB –
respectively) using the <>, <> push-buttons and pressing the <ENTER> for the confirmation.
6-8
SVAN 956 USER MANUAL
Displays with the possible values of the DYNAMIC parameter
Displays with the results stored in the logger presented with different DYNAMIC parameter
6.2.1.3 Scaling the horizontal axis of the graphical presentation - X–ZOOM
The X–ZOOM enables the user to change the horizontal axis in the SPECTRUM presentation
mode by means of the <>, <> push-buttons. In order to confirm the selection the user has to press the
<ENTER> push-button, which closes also the DISPLAY SCALE sub-list. The sub-list can be also closed
after pressing the <ESC> push-button but the settings made there are ignored. In 1/1 OCTAVE mode
available values are 3x, 4x and 5x. In 1/3 OCTAVE mode available values are 2x, 3x, 5x. In 1/1 OCTAVE
and 1/3 OCTAVE in spectrum presentation mode the X-ZOOM can be changed by pressing SHIFT and
<> push-buttons.
DISPLAY SCALE windows; the X–ZOOM selection
<SHIFT> +<
>
<SHIFT> +<
>
Displays in 1/1 OCTAVE SPECTRUM 3x, 4x, and 5x X–ZOOM
Displays in 1/3 OCTAVE SPECTRUM 2x, 3x, 4x, and 5x X–ZOOM
6-9
SVAN 956 USER MANUAL
_
Displays in FFT SPECTRUM 1x, 2x, 3x, 4x, and 5x X–ZOOM
6.2.1.4 Switching on/off the grid in the graphical mode presentation - GRID
The GRID enables the user to switch on or off the grid in any graphical presentation placing or
replacing the special character in the displayed inversely line with the GRID text by means of the <>,
<> push-buttons. In order to confirm the selection the user has to press the <ENTER> push-button. This
confirmation closes also the DISPLAY SCALE sub-list. The sub-list can be also closed
after pressing the <ESC> push-button but the settings made there are ignored.
Displays with the grid switched on and off
Displays with the grid switched on and off
6.2.2
Selection of the Spectrum Type in VM - SPECTRUM TYPE
The SPECTRUM TYPE enables the user to change the spectrum type. This sub-list contains three
positions: ACCELERATION, VELOCITY and DISPLACEMENT.
In order to enter this sub-list one has to press the <ENTER> push-button on the inversely displayed
SPECTRUM TYPE text of the DISPLAY SETUP sub-list. The user can selected the required type
of the spectrum presented on the display by means of the <>, <> push-buttons.
The SPECTRUM TYPE window is closed and the instrument returns to the DISPLAY SETUP list after
pressing the <ESC> push-button, which ignores any changes in the positions of the sub-list or
the <ENTER> push-button, which confirms the changes.
DISPLAY SETUP window; the SPECTRUM TYPE text highlighted
6-10
SVAN 956 USER MANUAL
SPECTRUM TYPE windows with the available values
6.2.3
Setting the parameters of the logger files presentation - SPECTRUM VIEW
The SPECTRUM VIEW enables the user to change the shape of the graphical presentation (VIEW)
and a TYPE parameter as well as to activate the presentation on the display the MAX and MIN spectrum.
In the VIEW position the EXTENDED, FULL and NORMAL views are available (by means
of the <>, <> push-buttons).
In the TYPE position the AVERAGED, INSTANTENOUS, MAX and MIN texts are available
(by means of the <>, <> push-buttons).
In order to enter this window one has to press the <ENTER> push-button on the inversely displayed
LOGGER VIEW text of the DISPLAY SETUP sub-list. The LOGGER VIEW window is closed and
the instrument returns to the DISPLAY SETUP sub-list after pressing the <ESC> (the settings made there
are not confirmed) or the <ENTER> push-button (the settings are confirmed).
DISPLAY SETUP window; the SPECTRUM VIEW text highlighted
6.2.3.1 Selection of the graphical presentation type - VIEW
In the VIEW position the EXTENDED, FULL and NORMAL texts are available after pressing
the <
>, <
> push-buttons. These texts correspond to the slightly different data presented
on the display in the graphical presentation modes.
SPECTRUM VIEW windows; the VIEW selection
6.2.3.2 Selection of the spectrum type for the presentation - TYPE
In the TYPE position the AVERAGED, INSTANTENOUS, MAX and MIN texts are available
after pressing the <
>, <
> push-buttons. Each text corresponds to the different spectrum type
to be presented on the display in the graphical presentation modes.
SPECTRUM VIEW windows; the TYPE selection
6.2.3.3 Selection of the MAX spectrum for the presentation – MAX
6-11
SVAN 956 USER MANUAL
_
In the MAX position the corresponding spectrum can be selected (by means of the <
>, <
> pushbuttons) to be presented on the display in the graphical presentation modes.
SPECTRUM VIEW windows, the MAX selection
6.2.3.4 Selection of the MIN spectrum for the presentation - MIN
In the MIN position the corresponding spectrum can be selected (by means of the <
>, <
> pushbuttons) to be presented on the display in the graphical presentation modes.
SPECTRUM VIEW windows; the MIN selection
6.2.4
Selection of the Weighting Filters - TOTAL VALUES
The TOTAL VALUES, which is available only in 1/1 OCTAVE or 1/3 OCTAVE analysis, enables
the user to select the weighting filter.
In order to enter this window one has to press the <ENTER> push-button on the inversely displayed
TOTAL VALUES text of the DISPLAY SETUP sub-list. The TOTAL VALUES window is closed and
the instrument returns to the DISPLAY SETUP sub-list after pressing the <ESC> (the settings made there
are not confirmed) or the <ENTER> push-button (the settings are confirmed).
DISPLAY SETUP window; the TOTAL VALUES text highlighted
TOTAL VALUES windows; the weighting filters selection in SM
6-12
SVAN 956 USER MANUAL
In the case of vibration mode after entering the TOTAL VALUES position on the display appears
sub-list with the TOTAL 1, TOTAL 2 and TOTAL3 positions. The slection of the position is made by <
>,
<
> push-buttons and pressing <ENTER> for the confirmation.
TOTAL VALUES windows in VM; the TOTALx selected
In the TOTALx window for user filters (S1, S2, S3) selected in the FILTER position, the TYPE and
CAL. F. positions appear on the display.
TOTAL x windows; the weighting filters selection in VM
6.2.4.1 Selecting the type of the spectrum in VM to be presented - TYPE
In the TYPE three options are available: ACC (acceleration), VEL (velocity) and DIL
(displacement). The selection is made by <
>, <
> push-buttons and pressing <ENTER> to confirm.
TOTALx windows; the TYPE selection
6.2.4.2 Setting the calibration factor for the presented spectrum in VM - CAL. F.
In the CAL. F. the user can introduce CALIBRATION FACTOR value from -60.0 dB to 60.0 dB
using <
>, <
> push-buttons with 0.1 dB step, or using <
>, <
> push-buttons with the <SHIFT>
with 1 dB step. In order to confirm all changes made in this window the user has to press the <ENTER>.
After pressing <ESC> the settings made there are ignored and the instrument returns
to the TOTAL VALUES window.
6-13
SVAN 956 USER MANUAL
_
TOTALx windows; CALIBRATION FACTOR setting
6.2.5
Setting the parameters of the logger files presentation - LOGGER VIEW
The LOGGER VIEW enables the user to change the shape of the graphical presentation and
a TIME parameter. In order to enter this window one has to press the <ENTER> push-button
on the inversely displayed LOGGER VIEW text of the DISPLAY SETUP sub-list. The LOGGER VIEW
window is closed and the instrument returns to the DISPLAY SETUP sub-list after pressing the <ESC>
(the settings made there are not confirmed) or the <ENTER> push-button (the settings are confirmed).
DISPLAY SETUP windows, the LOGGER VIEW text highlighted
6.2.5.1 Selecting the shape of the graphical presentation - VIEW
LOGGER VIEW windows with the possible values of the VIEW parameter
The VIEW enables the user to select the shape of the graphical mode presentation. Three different
views are available which are called as NORMAL, FULL and EXTENDED. The selection is made
by means of <
>, <
> push-buttons and pressing the <ENTER> for the confirmation. The user can
achieve the same effect after pressing the <ALT> and <> or the <ALT> and <
> push-buttons.
Displays with the possible values of the VIEW parameter
6.2.5.2 Setting the time to be presented - TIME
LOGGER VIEW windows with the possible values of the TIME parameter
6-14
SVAN 956 USER MANUAL
The TIME enables the user to select the time to be presented with the logger’s file results.
The REAL TIME selection means that on the display the real time is visible, while AVAILABLE TIME
means that time after which the logger’s memory will be filled up by the current measurement result
is given there. The selection is made using the <
>, <
> push-buttons and pressing the <ENTER>
for the confirmation.
Displays with the possible values of the TIME parameter
6.3 Selection of the logger’s file to the display presentation - LOGGER VIEW
The LOGGER enables the user to examine the contents of the logger files. In order to open
this window the user has to press the <ENTER> push-button when the LOGGER VIEW text is displayed
inversely.
DISPLAY list; the LOGGER VIEW text highlighted
•
•
•
•
•
•
•
•
•
In the first line the available still logger’s memory is displayed followed by:
The selected number of the logger’s file and the number of all saved files (FILE NO.:).
The name of the logger’s file (LOG.FILE:).
The number of the records in the file, which name is displayed in the previous line (RECORDS:).
The results saved (if any are present) in the logger from the first profile (P(1):).
The results saved (if any are present) in the logger from the second profile (P(2):).
The results saved (if any are present) in the logger from the third profile (P(3):).
The type of spectrum (if 1/1 OCTAVE , 1/3 OCTAVE or FFT ).
The size of the remaining free memory for logger files (FREE:).
The size of the available memory for logger file (AVAILABLE:).
Displays in the LOGGER VIEW sub-list
The change of the number of the logger’s file is done by pressing the <
>, <
> push-buttons.
6-15
SVAN 956 USER MANUAL
_
Displays in the LOGGER VIEW sub-list; the selection of the file to be seen
The size of the FREE memory for logger files is equal to the size of the AVAILABLE memory for
logger file in the case when the logger files were not deleted from the memory. If it has happened,
the FREE memory is always smaller than AVAILABLE.
In order to increase the free memory space and achieve the available one, the user has to perform
the defragmentation (path: MENU / FILE / DEFRAGMENTATION / LOGGER DEFRAGMENT.).
Displays in the LOGGER VIEW sub-list; the scrolling of the file to be seen
The display of the instrument after entering the LOGGER VIEW looks as on the figure below
in the case when the logger’s file does not exist (there was no measurement or the measurements were
performed but with the settings LOGGER: Off (path: MENU / INPUT / MEASUREMENT SETUP).
Display in the LOGGER VIEW sub-list in the case when the files do not exist
The contents of the selected logger’s file is displayed after pressing the <ENTER> push-button.
The cursor position is changed after pressing the <
>, <
> push-buttons. The left end of the graphical
presentation is reached immediately after pressing the <SHIFT> and <
> while the right end - after
pressing the <SHIFT> and <
> push-buttons.
The type of the registered result, the number of the profile the result is coming from, the related
time from the beginning of the registration, the value with the units and the indicator of the filter
are presented in the NORMAL and EXTENDED logger’s view mode on the right side of the display.
Displays with the selected logger’s file; the change of the cursor position
The scrolling of the display to the right/left is made when the cursor is at the left/right end of the
graphical presentation space and the <
>/ <
> push-button is still pressed and in the file there are still
the results.
<
>
<
>
Display with the selected logger file the scrolling to the left
The position of the horizontal axis in relation to the vertical one can be changed after pressing
the <
>, <
> push-buttons together with the <SHIFT> one.
6-16
SVAN 956 USER MANUAL
Displays with the selected logger’s file; the change of the axis relation
The results from logger’s file, coming from different profiles, are changed after pressing the <
> or
<
> push-buttons – after each pressing the result from the next profile is displayed.
<
>
<
>
Displays with the selected logger’s file; the change of the profile
The results from logger’s file, coming from the same profile, are displayed after each pressing
of the <ALT> and <> or <ALT> and <> push-buttons.
<ALT>+<
>
Displays with the selected logger’s file; the change of the result from a profile
6.4 Setting the parameters of the display - SCREEN SETUP
The SCREEN SETUP window enables the user to set the proper contrast of the display and switch
on the backlight’s automatic switch off after a certain period (30 seconds). In order to enter the window
one has to press the <ENTER> push-button on the inversely displayed SCREEN SETUP text
of the DISPLAY list. The SCREEN SETUP window is closed and the instrument returns to the DISPLAY
list after pressing the <ESC> or the <ENTER> push-button.
DISPLAY list; the SCREEN SETUP text highlighted
6.4.1
Setting the contrast of the display – CONTRAST
The CONTRAST enables the user to set the proper contrast of the display (by means of the <>,
<> push-buttons). The position is opened after pressing the <ENTER> push-button on the highlighted
(displayed inversely) CONTRAST text. The user can select 21 different values of this parameter.
Notice: The new value of the contrast is confirmed after each pressing of the <> or <>
push-buttons (new value is selected without any confirmation from the <ENTER> push-button).
6-17
SVAN 956 USER MANUAL
_
The window is closed and the instrument returns to the DISPLAY list after pressing the <ESC> or
<ENTER> push-button.
SCREEN SETUP windows; the change of the contrast
6.4.2
Automatic switch off of the backlight - BACKLIGHT TIMEOUT
Taking into account the saving of the internal source of the instrument’s power the backlight should
be used relatively rare. It is possible to set the backlight’s automatic switch off. In the case when
this option is set, after 30 seconds from pressing any push-button the backlight is switched off.
If it happened, the first pressing of any push-button would cause the switch on of the backlight.
The confirmation of the selection is made by pressing the <ENTER> push-button. The return without
taking into account any change is made after pressing the <ESC> push-button.
b)
a)
SCREEN SETUP windows; the BACKLIGHT TIMEOUT active (a), and not active (b)
6.5 Checking the state of the internal battery – BATTERY
The BATTERY enables the user to check the internal battery condition. In order to enter
the window one has to press the <ENTER> push-button on the inversely displayed BATTERY text
of the DISPLAY list.
The BATTERY window is closed and the instrument returns to the DISPLAY list after pressing the
<ESC> or the <ENTER> push-button.
DISPLAY list; the BATTERY text highlighted
The instrument can be powered from the external power supplier, from the external battery pack,
from four AA standard or AA rechargeable batteries or from the USB interface when its USB Device
socket is connected by means of the cable to a PC. The view presented on the display in each case is
different. The current battery voltage is displayed together with its approximate state (in the graphical
form).
6-18
SVAN 956 USER MANUAL
BATTERY windows for different sources powering the instrument
6.6 Checking specification of the instrument - UNIT LABEL
The UNIT LABEL enables the user to check the type of the instrument, its serial number,
the current software versions installed in it and the standards, which the instrument fulfils. In order
to enter the list one has to press the <ENTER> push-button on the inversely displayed UNIT LABEL text
of the DISPLAY list. The UNIT LABEL sub-list is closed and the instrument returns to the DISPLAY list
after pressing the <ESC> or the <ENTER> push-button.
DISPLAY list; the UNIT LABEL text highlighted
After pressing the <>, <> (or <>, <> ) push-buttons the displayed text is scrolled on the
display and the user can check the number of the standard fulfilled by the instrument and the current
software version. The window is closed and the instrument returns to the DISPLAY list after pressing the
<ESC> or <ENTER> push-button.
UNIT LABEL windows opened and after scrolling with the <
>, <
> push-buttons
Notice: The contents of the UNIT LABEL should be always transmitted to the Svantek’s
service in the case of any problems faced by the user during the instrument’s operation.
6-19
SVAN 956 USER MANUAL
7
SAVING THE MEASUREMENT RESULTS - FILE
The registration of the measurement results is an essential task for the efficient use
of the instrument. All available measurement results can be stored in the FLASH type memory
of the instrument or on the USB memory stick.
There are two main ways for storing the measurement data in the instrument:
1. Save files containing the main results and setup settings using the FILE list.
2. Save data in the logger’s file.
Notice: The instrument’s logger memory is independent from the results and setup
memory. The capacity of the available memory is equal to 32 MB and is divided between logger
(16 252 428 bytes) and results and setup settings (15 859 224 bytes).
Notice: All of the options (except DEFRAGMENTATION) from the FILE list can be used for
the USB memory stick.
Saving files
•
•
•
•
•
•
In the case of the SVAN 956 instrument there are files containing data:
from Vibration LEVEL METER;
from 1/1 OCTAVE analysis;
from 1/3 OCTAVE mode;
from FFT analysis;
from ENVELOPING mode;
stored in the instrument’s logger (accessible in the DISPLAY / LOGGER VIEW window).
Notice: The logger files are created automatically (the usage of the SAVE is not
required).
•
•
•
•
•
•
Each file consists of some elements, which are the same for all kind of files:
a file header;
the unit and software specification;
the user’s text stored together with the measurement data;
the parameters and global settings;
the special settings for profiles;
the marker of the end of the file.
The other elements of the file structure depend on the type of the file ( VLM, 1/1 OCTAVE,
1/3 OCTAVE, FFT, ENVELOPING, logger). These elements are as follows:
• the main results;
• the results coming from 1/1 OCTAVE analysis;
• the results coming from 1/3 OCTAVE analysis;
• the header of the FFT analysis performed in the selected band;
• the FFT analysis results;
• the results coming from ENVELOPING mode;
• the header of the file from the logger;
• the data stored during the measurements in the logger’s file.
7-1
SVAN 956 USER MANUAL
_
Notice: The detailed description of all types of file structures is given in the Appendix B.
Storing the vibration measurement results as files in the instrument’s FLASH DISC can be done
by means of the FILE list. In order to open, the FILE list the user has to:
• press the <MENU> push-button,
• select from the main list, using the <
>, <
> (or <
>, <
>) push-buttons, the FILE text (highlight
it inversely),
• press the <ENTER> push-button.
Main list; the FILE text highlighted (displayed inversely)
The FILE list contains the following items:
SAVE
SAVE OPTIONS
LOAD
enables one to save the measurement results as a file in the instrument’s
memory;
enables one to set the options of the measurement result savings;
DELETE
enables one to load to the working space of the instrument’s memory
the measurement results saved in a file;
enables one to delete a selected file from the instrument’s memory;
DELETE ALL
enables one to delete all files from the instrument’s memory;
DEFRAGMENTATION
enables one to consolidate the flash memory after deleting some files from it;
enables one to overview the catalogue of the files saved in the instrument’s
memory;
informs the user about the capacity of the instrument’s memory still available
for storing the measurement results:
enables one to save the setup as a file in the instrument memory;
CATALOGUE
FREE SPACE
SAVE SETUP
LOAD SETUP
enables one to load to the working space of the instrument’s memory the selected
setup saved in a file;
DIRECTORY
this position appears only in case when external USB memory stick is connected
to the instrument; it informs the user about connected memory stick, the free
space on USB memory stick, number of directory, the number of files, enables
also to edit the name of the directory;
COPY FILES TO USB this position appears only in when the external USB memory stick is connected
to the instrument; it enables to copy files from the internal memory
of the instrument to the connected USB memory stick;
MOVE FILES TO USB this position appears only in case when USB memory stick is connected
to the instrument; it enables the user to move files from the internal memory
of the instrument to the connected USB memory stick.
Pressing the <SHIFT> and <
> (or <SHIFT> and <
>) results in a movement to the first position of
the opened list and pressing the <SHIFT> and <
> (or <SHIFT> and <
>) results in a movement
to the last position of the opened list.
7-2
SVAN 956 USER MANUAL
FILE list of the instrument
In each available position any change is performed by means of the <
>, <
> push-buttons.
In order to confirm the selection the <ENTER> push-button has to be pressed. After this confirmation,
the opened window or list is closed. In order to ignore any changes made in the opened window or list
the user has to press the <ESC> push-button.
7.1
Saving files in the instrument’s memory - SAVE and SAVE NEXT
The SAVE is used for storing data in the internal non-volatile (FLASH DISC) memory (files
are always written at the beginning of a free continuous space) as a file (see Appendix B for the file
formats). In order to enter the window the user has to select the SAVE text in the FILE list, using
the <
> (or <
>) push-button and press the <ENTER> push-button. There are two available functions:
the SAVE NEXT – save a file with the name increased by one, and SAVE – save a file with the edited
name. These functions are available after pressing the <
>, <
> push-buttons.
SAVE window in the FILE list
The name of the file, in which the measurements results are to be saved, is displayed above
the SAVE or SAVE NEXT text. The default name for a file is displayed in the case of the first entering
to this position (after power on). The default name consists of the day and the month’s abbreviation.
The line of the file’s name edition (FILE NAME) is opened after pressing the <
> push-button.
The user can skip the file’s name edition and start saving file pressing the <ENTER> push-button
or return to the FILE list pressing the <ESC> one.
The edition process is presented on the Figure below. The displayed inversely character
is currently edited. The <
>, <
>and <
>, <
> pressed together with <SHIFT> push-buttons are used
for editing the name which cannot exceed eight characters.
Display during the process of setting the character in the edited name
One can select the position of the character in the edited text using the <
>, <
> push-buttons.
7-3
SVAN 956 USER MANUAL
_
Display during the selection of the character’s position to be edited
The available ASCII characters can be changed using the <
> (or <
>) push-button pressed
together with the <SHIFT> one. The subsequent digits, underline, big letters and space appear on
the display in the inversely displayed position after each pressing of the mentioned above push-buttons.
...
...
Display during the selection of the character
FILE NAME edition after pressing the <SHIFT> and <> push-buttons
FILE NAME edition after pressing the <SHIFT> and <> push-buttons
The edited name is accepted and the file is saved after pressing the <ENTER> push-button.
The special warning is displayed in the case the file with the edited name already exists in the memory.
The instrument waits then for a reaction of the user (any push-button should be pressed except
the <SHIFT> or the <ALT> one).
7-4
SVAN 956 USER MANUAL
Displays during the attempt of overwriting the existing file, changing the name and saving data
All changes introduced to the file name during the edition are ignored after pressing the <ESC>
push-button. This pressing causes the return to the list from which the SAVE option was entered.
The return after the edition to the line with the SAVE or SAVE NEXT text is possible after pressing
the <
> push-button.
The simplified edition consists in the addition at the end of the file name the natural number.
The increase by one of the number is made automatically. After the execution of the saving operation the
new file name is displayed and the instrument waits then for a reaction of the user (any push-button
should be pressed except the <SHIFT> or the <ALT> one). In the next attempt of saving data, the new
name is displayed in the FILE NAME line and that name is increased by one during the saving operation.
Displays in the simplified edition of the file name and the execution of the saving operation
The number can be changed from 0 to N. The only limitation of the N value is the length of the file
name, which cannot be longer than eight characters. In the case, when such limitation is achieved and
the instrument can not change automatically the file’s name the only possibility is to edit new file name.
Notice: The files can be overwritten (the use of the same file name) without any warning
if the REPLACE option is switched on (path: MENU / FILE / SAVE OPTIONS / REPLACE).
Displays in the simplified edition of the file name, saving and the “saturation” of that operation
As it was already written, the instrument attempts to save a file after pressing the <ENTER> pushbutton. The saving is not possible in the case when the instrument is measuring the signal. The special
message is displayed for about 3 seconds in this case and the instrument returns to the SAVE window.
Displays after the attempt to perform unavailable saving operation and the return to the SAVE NEXT
The presented below message is displayed after trying to execute the save operation in the case
when no measurements were performed and there are no results to be saved. The instrument then waits
for the reaction of the user (any push-button should be pressed except the <SHIFT> or the <ALT> one)
and after pressing a push-button it returns to the SAVE window.
7-5
SVAN 956 USER MANUAL
_
Display after the SAVE operation when there were no results for storing
Notice: During the execution of the SAVE or SAVE NEXT function an additional window
is displayed informing about the operation performed. In the case of short files, this window can
be unnoticed by the user.
View of all displays during and after the execution of the SAVE operation
As it was already written, it is not possible to store the data in the file, which already exists, when
the REPLACE is not active ([ ]) (path: MENU / FILE / SAVE OPTIONS / REPLACE). The presented
below sequence of displays illustrates the situation when during the name edition process the user
selected the name, which was used before. The instrument displays a special message and waits for the
reaction of the user (any push-button should be pressed except the <SHIFT> or the <ALT> one) and
after pressing a push-button it returns to the FILE list.
Displays after the attempt to overwrite a file if the REPLACE is not active
Notice: The direct access to the SAVE / SAVE NEXT function is possible after pressing
simultaneously the <ENTER> and <ALT> push-buttons if the DIRECT SAVE option is switched off
(path: MENU / FILE / SAVE OPTIONS / DIRECT SAVE). In another case, (DIRECT SAVE option is
switched on) the results are saved, after pressing these push-buttons, in the file with the automatically
incremented name.
Notice: After the usage of the <ENTER> and <ALT> push-buttons (if the DIRECT SAVE
option is switched on) the measurement results are saved only once. The following pressing
will not cause any instrument’s reaction unless next measurement is performed. The same result
can be saved in the multiply number of files only using the SAVE / SAVE NEXT function.
7-6
SVAN 956 USER MANUAL
7.2
Controlling the data storing in the instrument’s memory - SAVE OPTIONS
The SAVE OPTIONS sub-list is used for the selection of the options of data storing in the
FLASH DISC memory of the instrument. The sub-list is opened after pressing the <ENTER> push-button
when the SAVE OPTIONS text in the FILE list is displayed inversely (selected using the <
>, <
>
(or <
>, <
>) push-buttons). The return to the FILE list is possible after pressing the <ESC> push-button.
FILE list with the SAVE OPTIONS text highlighted (displayed inversely)
It is possible to write data into the same part of the memory starting all the time with the same
address (RAM FILE), to replace the existing in the memory file by the new with the same name
(REPLACE), to save automatically the results of the measurements (AUTO SAVE), to save the results of
measurements directly (DIRECT SAVE), to save maxima/ minima from the spectrum (SAVE MAX
SPECT., SAVE MIN SPECT.) . The position of the sub-list is changed after pressing the <
>, <
> pushbuttons. In order to confirm the selection the <ENTER> push-button has to be pressed. Such pressing
closes also the opened sub-list.
7.2.1
Saving data starting from the same address - RAM FILE
The measurement data usually are saved in the different files in the flash memory
of the instrument. There is also possibility to save data in RAM file starting from the same address.
It means that each time the data are saved the previous file is overwritten. This option is useful
for the permanent monitoring and remote reading data from the instrument by means of any available
interface with the proper period. In order to read data saved in a RAM file one has to use #4,3 function
described in details in App. A.
The RAM FILE is switched on after placing the special character ([√
√]) in the inversely displayed
position in the line with the RAM FILE text. The activation or deactivation of the RAM FILE is done
by pressing the <
>, <
> push-buttons.
SAVE OPTIONS sub-list; the selection of the RAM FILE
After pressing the <ENTER> push-button the selections made in any position of the sub-list
(in particular also in the RAM FILE) are confirmed and the sub-list is closed. In the case when
the AUTO SAVE was active ([√
√]), after pressing the <ENTER> push-button the FILE NAME window
is opened for editing the names for the AUTO SAVE files. The SAVE OPTION is closed ignoring
all settings made in it after pressing the <ESC> push-button.
The RAM FILE functionality is available only in the LEVEL METER, 1/1 OCTAVE and 1/3 OCTAVE
mode. In the FFT and ENVELOPING modes the line with the RAM FILE text does not appear on the
display after entering the SAVE OPTIONS sub-list.
7.2.2
Replacement of the existing files by the new ones - REPLACE
7-7
SVAN 956 USER MANUAL
_
The result of the attempt to save the file with the name, which already exists in the memory,
depends on the setting of the REPLACE. It is possible to erase the old file and to save the new one
with the same name if the position is active ([√
√]). The activation or deactivation of the REPLACE is done
by pressing the <
>, <
> push-buttons.
SAVE OPTIONS sub-list; the selection of the REPLACE
The message is displayed that such operation is not available in the case when this position is not
active ([ ]) – cf. the description of the SAVE. In the other case, the existing file is overwritten.
Displays during the file saving when the REPLACE is switched off and on
After pressing the <ENTER> push-button the selections made in any position of the sub-list
(in particular also in the REPLACE) are confirmed and the sub-list is closed. In the case when
the AUTO SAVE was active ([√
√]), after pressing the <ENTER> push-button the FILE NAME window
is opened for editing the names for the AUTO SAVE files. The SAVE OPTION sub-list is closed ignoring
all settings made in it after pressing the <ESC> push-button.
7.2.3
Controlling the measurement results savings - AUTO SAVE
Using the AUTO SAVE one can set the self-saving of the measurement results ([√
√]) or to switch off
([ ]) this possibility. The activation or deactivation of the AUTO SAVE is done by pressing the <
>, <
>
push-buttons. This position was also established in order not to waste too much memory
of the instruments when the self-saving is not necessary.
SAVE OPTIONS sub-list; the selection of the AUTO SAVE
Notice: The AUTO SAVE function can be performed only in the case when
the INTEGR. PERIOD (path: MENU / INPUT / MEASUREMENT SETUP) is not less than 10 seconds.
If it is less than 10 seconds, the measurement results are not saved without any indication of that fact!
There is only one exception - when the REP. CYCLE (path: MENU / INPUT / MEASUREMENT SETUP)
is equal to one, the AUTO SAVE function is executed disregarding the value of the integration period.
The FILE NAME window is opened after switching on the AUTO SAVE function and pressing
the <ENTER> push-button. After pressing the <ESC> push-button the FILE NAME window is closed and
the instrument returns to the SAVE OPTION, but with the AUTO SAVE function switched off.
7-8
SVAN 956 USER MANUAL
Displays during the execution of the AUTO SAVE switching on; the FILE NAME skipping and return to the
SAVE OPTION sub-list
When the integration period is too short for switching on the AUTO SAVE option the following
message appears on the display:
Display after attempt of switching on AUTO SAVE option with too short INT. PERIOD
The FILE NAME window is closed after pressing the <ENTER> push-button with the confirmation
of the AUTO SAVE function switched on and the user interface returns to the FILE list.
Displays during the execution of the AUTO SAVE switching on; the FILE NAME confirmation and return to
the FILE list
The edition of the file name in the FILE NAME window is performed almost in the same way
as it was described in the case of the SAVE / SAVE NEXT function. The displayed inversely character
is currently edited. The <
>, <
>, <
>, <
> and <SHIFT> push-buttons are used for editing the name
which cannot exceed eight characters including the starting special character @ which cannot be edited.
One can select the proper position of the character in the edited text using the <
>, <
> push-buttons.
The available ASCII characters can be changed using the <
> (or <
>) push-button pressed together
with the <SHIFT> one. Additionally, the character can be also changed using the <
> (or <
>) pushbutton (this functionality is not available in the SAVE / SAVE NEXT function). The subsequent digits,
underline, big letters and space appear on the display in the inversely displayed position after each
pressing of the mentioned above push-buttons.
The edition is finished after pressing the <ENTER> push-button. The edited name is compared
with the file names existing in the catalogue. In the case when the file with the same name already exists,
the special message is displayed and after pressing any character except the <SHIFT> or <ALT> one,
the instrument returns once more to the FILE NAME window.
Displays after the incorrect file name edition
When the AUTO SAVE option is active ([√
√]), after starting the measurements by pressing
the <START/STOP> push-button the results are saved in the file with the selected name. Depending on
7-9
SVAN 956 USER MANUAL
_
the instrument’s mode and selected options the sequence of the displays available after each pressing
of the <
> or <
> could be as presented below.
Measurement results presented after pressing the <> or <> push-buttons
In the case when from a profile more than one result was saved in the logger’s file, the other results
are presented after pressing the <
>, <
> push-buttons together with the <ALT> one.
Results saved from a profile presented after pressing the <> or <> and <ALT> push-buttons
After pressing the <
> or <
> and <ALT> push-buttons the VIEW is changed (path: MENU /
DISPLAY / DISPLAY SETUP / LOGGER VIEW / VIEW). So, after pressing these push-buttons and then
repeating the previous sequence (the <
>, <
> push-buttons together with the <ALT> one) the user can
observe the displays presented below.
?
Results saved from a profile presented after pressing the <> or <> and <ALT> push-buttons
Another measurement is started after next pressing of the <START/STOP> push-button.
The measurement is stopped after the selected INTEGR. PERIOD (path: MENU / INPUT /
MEASUREMENT SETUP / INTEGR. PERIOD) names of the next saved files are automatically
incremented by one. The same remarks are valid in this case as it was already stated in the description
of the SAVE NEXT function.
7.2.4
Direct access to the SAVE / SAVE NEXT function - DIRECT SAVE
The DIRECT SAVE enables one to select the instrument’s reaction on the simultaneous pressing
of the <ENTER> and <ALT> push-buttons. If this option is not active ([ ]), after pressing these pushbuttons the SAVE window is accessed (if the measurements are not performed). If the option is active
([√
√]), after pressing the <ENTER> and <ALT> push-buttons the results are saved in the file with
the automatically incremented name and the proper message is displayed for a few seconds. The proper
setting of the DIRECT SAVE is done by pressing the <
>, <
> push-buttons.
7-10
SVAN 956 USER MANUAL
SAVE OPTIONS sub-list; the selection of the DIRECT SAVE
After pressing the <ENTER> push-button the selections made in any position of the sub-list
(in particular also in the DIRECT SAVE) are confirmed and the sub-list is closed. In the case when
the AUTO SAVE was active ([√
√]), after pressing the <ENTER> push-button the FILE NAME window
is opened for editing the names for the AUTO SAVE files. The SAVE OPTION sub-list is closed ignoring
all settings made in it after pressing the <ESC> push-button.
During the execution of the measurements pressing the <ENTER> and <ALT> push-buttons
causes, disregarding the option set in the DIRECT SAVE, that the message presented below
is displayed.
Display after the attempt to perform an unavailable operation during measurement in progress
The presented below displays illustrates the difference in the user interface execution
after pressing the <ENTER> and <ALT> push-buttons in the case when the measurements are not
performed and the DIRECT SAVE is not active ([ ]) and active ([√
√]).
=> <ENTER> =>
Exemplary executions of the software with the DIRECT SAVE not active
Exemplary executions of the software with the DIRECT SAVE active
7.2.5
Saving maximum values in the spectrum - SAVE MAX SPECT.
The SAVE MAX SPECT. enables the user to save the highest values of the INSTANTENEOUS
spectra (calculated with 100-milliseconds time step) in 1/1 OCTAVE or 1/3 OCTAVE analysis, which
occured during the INTEGR. PERIOD set in the INPUT list (path: MENU / INPUT /
MEASUREMENT SETUP / INTEGR. PERIOD).
The activation or deactivation of the SAVE MAX SPECT. is done by pressing the <
>, <
> pushbuttons. After pressing the <ENTER> push-button the activation is confirmed. The SAVE OPTION sub-list
is closed ignoring all settings made in it after pressing the <ESC> push-button.
7-11
SVAN 956 USER MANUAL
_
SAVE OPTIONS sub-list; the selection of the SAVE MAX SPECT.
To see the MAX values on the display during the the real time 1/1 OCTAVE or 1/3 OCTAVE
analysis measurement the user has to activate the option in the DISPLAY list (path: MENU / DISPLAY /
DISPLAY SETUP / SPECTRUM VIEW / MAX or path: MENU / DISPLAY / DISPLAY MODES /
SPECTRUM).
7.2.6
Saving the lowest values in the spectrum - SAVE MIN SPECT.
The SAVE MIN SPECT. enables the user to save the lowest values of the INSTANTANEOUS
spectra (calculated with 100-milliseconds time step) in 1/1 OCTAVE or 1/3 OCTAVE analysis, which
occured during the INTEGR. PERIOD set in the INPUT list (path: MENU / INPUT /
MEASUREMENT SETUP / INTEGR. PERIOD).
The activation or deactivation of the SAVE MIN SPECT. is done by pressing the <
>, <
> pushbuttons. After pressing the <ENTER> push-button the activation is confirmed. The SAVE OPTION sub-list
is closed ignoring all settings made in it after pressing the <ESC> push-button.
SAVE OPTIONS sub-list; the selection of the SAVE MIN SPECT.
To see the MIN values on the display during the real time 1/1 OCTAVE or 1/3 OCTAVE analysis
the user has to activate the option in the DISPLAY list (path: MENU / DISPLAY / DISPLAY SETUP /
SPECTRUM VIEW / MIN with active SPECTRUM mode or path: MENU / DISPLAY / DISPLAY MODES /
SPECTRUM).
7.3
Loading the files with the measurement results - LOAD
The LOAD is used for loading data file from the FLASH DISC (e.g. for the verification or
comparison). The position is opened after pressing the <ENTER> push-button when the LOAD text in
the FILE list is displayed inversely (selected using the <
>, <
> (or <
>, <
>) push-buttons).
The return to the FILE list is possible after pressing the <ESC> push-button.
FILE list with the LOAD text highlighted (displayed inversely)
7-12
SVAN 956 USER MANUAL
Notice: It is not possible to load the file during the execution of the measurements.
On such attempt the message: MEASUREMENT IN PROGRESS is displayed for about 3 seconds.
After pressing the <ENTER> push-button the instrument checks its current state. In the case when
the measurements are performed, the file loading is impossible and the message is displayed.
Display after the attempt to perform an unavailable operation during measurement in progress
In the case when the instrument memory is empty (no file is stored), after entering the LOAD
window the NO FILES text is displayed and the instrument waits for the reaction of the user. The user
should press then the <ESC>, <ENTER> (the instrument returns to the FILE list) or <START / STOP>
push-button (the instrument starts the measurement).
Display during the execution of the LOAD operation
The current number of the file and the total number of the saved files is displayed in the first line
of the LOAD window. The name of the file is displayed in the second line (its current number is presented
in the first line). The name of the file suggests the operation the file was created-in. The names in which
the first character is @ are coming from the AUTO SAVE function. The file with the default name
@Timer@ is coming from the AUTO SAVE function executed in the TIMER operation. The other names
suggest the SAVE / SAVE NEXT function. The type of the current file (LEVEL METER, 1/1 OCTAVE,
1/3 OCTAVE, FFT or ENVELOPING) and the mode ([VIBR.]) are given in the third line. If during the
measurements which results are saved in the file, the logger file was also created its name is displayed in
the fourth line.
Notice: The logger file can be deleted from the instrument’s memory in the FILE / DELETE /
LOGGER FILES window and this deleting operation does not modify the contents of the fourth line
of the LOAD window.
The date and time of the SAVE operation are displayed in the fifth and sixth line, respectively.
The change of the current file with the unit step can be done after pressing the <
>, <
> push-buttons.
The first file is available after pressing the <
> with <SHIFT> push-button (or <
> with <SHIFT>) and the
last one is displayed after pressing the <
> with <SHIFT> push-button (or <
> with <SHIFT>).
Exemplary contents of the LOAD window
7-13
SVAN 956 USER MANUAL
_
Notice: Many result files can be associated with one logger file, i.e. during the execution
of the AUTO SAVE function.
..
Exemplary result files associated with the same logger file (&LOG2)
The name of the file is accepted and the file is loaded after pressing the <ENTER> push-button.
The message with the name of the selected file is displayed during the execution of the loading operation.
Display during the execution of the loading function
The next message is displayed after successful end of loading operation. The instrument waits
for the reaction of the user (any push-button should be pressed except the <SHIFT> or <ALT> one) and
after pressing a push-button it returns to the FILE list.
<A KEY>
Displays after the execution of the LOAD operation
The contents of the loaded file is displayed in the available result presentation modes
(after pressing the <
>, <
> push-buttons) depending on the current settings of the instrument.
=> <ENTER> =>
<A KEY>
Exemplary displays during the loading and checking the contents of a 1/1 OCTAVE file
7-14
SVAN 956 USER MANUAL
7.4
Removing a file with the measurement results from memory – DELETE
The DELETE is used to remove a file from memory. In order to enter the window the user has
to select the DELETE text (to display it inversely) using the <
>, <
> push-buttons and then press
the <ENTER> one.
FILE list with the DELETE text highlighted (displayed inversely)
In the DELETE window, there are three elements: RESULT FILES, LOGGER FILES and
SETUP FILES. In order to enter the selected sub-list the user has to select the proper text (to display
it inversely) using the <
>, <
> (or <
>, <
>) push-buttons and then press the <ENTER> one.
The DELETE window is closed and the instrument returns to the FILE list after pressing the <ESC> one.
7.4.1
Deleting files with the main results - RESULT FILES
In order to enter the window one has to press the <ENTER> push-button on the inversely displayed
RESULT FILES text of the DELETE sub-list using the <
>, <
>, <
> with <SHIFT> or <
> with
<SHIFT> push-buttons. The DELETE sub-list is closed and the instrument returns to the FILE list after
pressing the <ESC> push-button.
In order to enter the list of the saved result files in the flash memory one has to press the <ENTER>
push-button. In the case when the result files were not saved in the memory, the special message
is displayed and the instrument waits for the reaction of the user. The user should press any push-button
except the <SHIFT> and <ALT>.
=> <ENTER> =>
RESULT FILES selected to be deleted and the flash memory does not contain any file
After pressing the <ENTER> push-button the instrument checks its current state. In the case when
the measurements are performed, the RESULT FILES entering is impossible. In such case, the message
is displayed and the instrument returns after few seconds to the DELETE sub-list.
Display after the attempt to perform an unavailable operation during measurement in progress
The same data about the existing in the instrument files as in the FILE / LOAD window
are displayed after successful opening the FILE / DELETE / RESULT FILES one (pressing the <ENTER>
push-button).
The current number of the file and the total number of the saved files is displayed in the first line
of the window.
7-15
SVAN 956 USER MANUAL
_
The name of the file is displayed in the second line (its current number is presented
in the first line).
The name of the file suggests the operation the file was created-in. The names in which the first
character is @ are coming from the AUTO SAVE function. The file with the default name @Timer@ is
coming from the AUTO SAVE function executed in the TIMER operation. The other names suggest the
SAVE / SAVE NEXT function. The type of the current file LEVEL METER, 1/1 OCTAVE, 1/3 OCTAVE,
FFT or ENVELOPING) and the mode ([VIBR.]) is given in the third line. If during the measurements which
results are saved in the file, the logger file was also created its name is displayed in the fourth line.
Notice: The logger file can be deleted from the instrument’s memory in the FILE / DELETE /
LOGGER FILES window and this deleting operation does not modify the contents of the fourth line of the
DELETE window.
The DATE and TIME of the SAVE operation are displayed in the fifth and sixth line, respectively.
The change of the current file with the unit step can be done after pressing the <
>, <
> push-buttons.
The first file is available after pressing the <
> with <SHIFT> push-button (or <
> with <SHIFT>) and the
last one is displayed after pressing the <
> with <SHIFT> push-button (or <
> with <SHIFT>).
Selection of the RESULT FILES to be deleted
The selected file is deleted after pressing the <ENTER> push-button. The message is displayed
after the successful end of the operation. The instrument waits for the reaction of the user (any pushbutton should be pressed except the <SHIFT> and <ALT> one) and after pressing a push-button
it returns to the DELETE sub-list.
=> <ENTER> =>
=> <ANY PUSH-BUTTON> =>
=> <ENTER> =>
Execution of the RESULT FILES deletion
After the execution of the result files removing from the memory usually the FREE SPACE memory
(path: MENU / FILE / FREE SPACE) rests the same as before the deletion but TOTAL AVAILABLE
memory is increased. It is because erased file was somewhere in the file’s space. The file is no longer
accessible but the recuperated memory is still unused for the next saving. This memory becomes
available after the defragmentation process (path: MENU / FILE / DEFRAGMENTATION) in which all files
are moved to the continuous space. In order to illustrate it let us consider the result file named
@EXAMP4, which is 1946 bytes long.
7-16
SVAN 956 USER MANUAL
=><ENTER>=>
=>
Execution of the @EXAMP4 file deletion and the influence of this process on the memory space
After removing @EXAMP4 from the memory, only the TOTAL AVAILABLE is increased (path:
MENU / FILE / FREE SPACE).
=>
=>
Execution of the @EXAMP5 file deletion and the influence of this process on the memory space
The displays above illustrates the erasing from the flash memory another file named @EXAMP5
which was also 1946 bytes long; the FILES FREE SPACE, LOGGER FREE SPACE and
LOGGER AVAILABLE remain unchanged while the TOTAL AVAILABLE is increased.
7.4.2
Deleting logger files - LOGGER FILES
In order to enter the window one has to press the <ENTER> push-button on the inversely displayed
LOGGER FILES text of the DELETE sub-list using the <
>, <
>, <
> with <SHIFT> or <
> with
<SHIFT> push-buttons. The DELETE sub-list is closed and the instrument returns to the FILE list
after pressing the <ESC> push-button.
In order to enter the list of the saved logger files in the memory one has to press the <ENTER>
push-button. In the case when the logger files were not saved in the memory, the special message
is displayed and the instrument waits for the reaction of the user. The user should press any push-button
except the <SHIFT> and <ALT>.
=> <ENTER> =>
LOGGER FILES selected to be deleted and the memory does not contain any file
After pressing the <ENTER> push-button the instrument checks its current state. In the case when
the measurements are performed, the LOGGER FILES entering is impossible. In such case,
the message is displayed and the instrument returns after few seconds to the DELETE sub-list.
7-17
SVAN 956 USER MANUAL
_
Display after the attempt to perform an unavailable operation during measurement in progress
The similar data about the existing in the instrument logger files as in the DISPLAY /
LOGGER VIEW window are displayed after successful opening the FILE / DELETE / LOGGER FILES
one (pressing the <ENTER> push-button).
In the first line, the available still logger’s memory is displayed followed by:
• The selected number of the logger’s file and the number of all saved files (FILE NO.:).
• The name of the logger’s file (LOG.FILE:).
• The size of the logger file which name is displayed in the previous line (LOG.SIZE:).
• The results saved (if any are present) in the logger from the first profile (P(1):).
• The results saved (if any are present) in the logger from the second profile (P(2):).
• The results saved (if any are present) in the logger from the third profile (P(3):).
The change of the current file with the unit step can be done after pressing the <
>, <
> pushbuttons. The first file is available after pressing the <
> with <SHIFT> push-button (or <
> with
<SHIFT>) and the last one is displayed after pressing the <
> with <SHIFT> push-button (or <
> with
<SHIFT>).
Selection of the LOGGER FILES to be deleted
The selected file is deleted after pressing the <ENTER> push-button. The message is displayed
after the successful end of the operation. The instrument waits for the reaction of the user (any pushbutton should be pressed except the <SHIFT> and <ALT> one) and after pressing a push-button
it returns to the DELETE sub-list.
=> <ENTER> =>
=> <ANY PUSH-BUTTON> =>
=> <ENTER> =>
Execution of the LOGGER FILES deletion
After the execution of the logger files deletion from the memory, usually the logger free space rests
the same as before the deletion but the total logger available memory is increased. It is because erased
file was somewhere in the file’s space. The file is no longer accessible but the recuperated memory is still
unused for the next saving. This memory becomes available after the defragmentation process (path:
7-18
SVAN 956 USER MANUAL
MENU / FILE / DEFRAGMENTATION / LOGGER DEFRAGMENT.) in which all files are moved
to the continuous space.
It can be illustrated on the figures below by erasing from the memory 2 kB-long logger file named
&LOG107. The presented there FREE SPACE window comes from the FILE list.
=> <ENTER> =>
=>
Execution of the &LOG107 file deletion from the logger memory and its influence on the memory space
(LOGGER AVAILABLE)
The displays below illustrates the erasing from the logger memory another big file (29 kB) named
&LOG113 just after the erasing of the file &LOG107 the FILES FREE SPACE, TOTAL AVAILABLE and
LOGGER FREE SPACE remain unchanged while the LOGGER AVAILABLE is increased.
=>
=>
Execution of the &LOG113 file deletion and the influence of this process on the memory space
7.4.3
Deleting files with setup settings - SETUP FILES
In order to enter the window one has to press the <ENTER> push-button on the inversely displayed
SETUP FILES text of the DELETE sub-list using the <
>, <
>, <
> with <SHIFT> or <
> with <SHIFT>
push-buttons. The DELETE sub-list is closed and the instrument returns to the FILE list
after pressing the <ESC> push-button.
In order to enter the list of the saved setup files in the memory one has to press the <ENTER>
push-button. In the case when the setup files were not saved in the memory, the special message
is displayed and the instrument waits for the reaction of the user. The user should press any push-button
except the <SHIFT> and <ALT>.
=> <ENTER> =>
SETUP FILES selected to be deleted and the instrument’s memory does not contain any file
After pressing the <ENTER> push-button the instrument checks its current state. In the case when
the measurements are performed, the SETUP FILES entering is impossible. In such case, the message
is displayed and the instrument returns after few seconds to the DELETE sub-list.
7-19
SVAN 956 USER MANUAL
_
Display after the attempt to perform an unavailable operation during measurement in progress
The data about the existing in the instrument setup files are displayed after successful opening
the FILE / DELETE / LOGGER FILES window (pressing the <ENTER> push-button).
The current number of the file and the total number of the saved setup files is displayed in the first
line of the window. The date and time of the SAVE SETUP operation is displayed in the last two lines
respectively.
The change of the current file with the unit step can be done after pressing the <
>, <
> pushbuttons. The first file is available after pressing the <
> with <SHIFT> push-button (or <
> with
<SHIFT>) and the last one is displayed after pressing the <
> with <SHIFT> push-button (or <
> with
<SHIFT>).
Selection of the SETUP FILES to be deleted
The selected file is deleted after pressing the <ENTER> push-button. The message is displayed
after the successful end of the operation. The instrument waits for the reaction of the user (any pushbutton should be pressed except the <SHIFT> and <ALT> one) and after pressing a push-button
it returns to the DELETE sub-list.
=> <ENTER> =>
=> <ANY PUSH-BUTTON> =>
=> <ENTER> =>
Execution of the RESULT FILES deletion
After the execution of the setup files removing from the memory usually the FREE SPACE memory
(path: MENU / FILE / FREE SPACE) rests the same as before the deletion but TOTAL AVAILABLE
memory is increased. It is because erased file was somewhere in the file’s space. The file is no longer
accessible but the recuperated memory is still unused for the next saving.
This memory becomes available after the defragmentation process (path: MENU / FILE /
DEFRAGMENTATION / FILES DEFRAGMENT.) in which all files are moved to the continuous space.
In order to illustrate it let us consider the removing from the memory the setup file named @SET3.
After this, only the TOTAL AVAILABLE is increased (path: MENU / FILE / FREE SPACE).
7-20
SVAN 956 USER MANUAL
=> <ENTER> =>
=>
Execution of the @SET3 file deletion and its influence on the memory space
The displays below illustrates the erasing from the flash memory another file named @SET8;
the FILES FREE SPACE, LOGGER FREE SPACE and LOGGER AVAILABLE remain unchanged while
the TOTAL AVAILABLE is increased.
=>
=>
Execution of the @SET8 file deletion and the influence of this process on the memory space
7.5
Removing all files with measurement results from memory - DELETE ALL
The DELETE ALL is used to remove all files from memory. In order to enter the position the user
has to select the DELETE ALL text in the FILE list, using the <
>, <
> (or <>, <>) push-buttons and
press the <ENTER> one. The DELETE ALL sub-list consists of three positions: RESULT FILES,
LOGGER FILES and SETUP FILES.
DELETE ALL text highlighted (displayed inversely) in the FILE list
7.5.1
Deleting all result files - RESULT FILES
In order to activate the position the user has to place the special character in the line
with the RESULT FILES text using the <> push-button. The DELETE ALL sub-list is closed and
the instrument returns to the FILE list after pressing the <ESC> push-button. In order to enter
the DELETE ALL window one has to press the <ENTER> push-button.
RESULT FILES selected to the execution of the DELETE ALL operation
7-21
SVAN 956 USER MANUAL
_
After pressing the <ENTER> push-button the instrument checks its current state. In the case when
the measurements are performed, the execution of the DELETE ALL operation is not possible.
In such case, the message is displayed for a few seconds and the instruments returns to the FILE list.
Display after the attempt to perform an unavailable operation during measurement in progress
If the measurements are not performed the instrument requests the confirmation of the operation
after entering this window (after pressing the <ENTER> push-button). After next pressing the <ENTER>
push-button, when the NO option is selected, the window is closed and the instrument returns to the FILE
list. The selection of the NO or YES option is possible using the <>, <> push-buttons. The return
to the FILE list is also possible after pressing the <ESC> push-button.
Displays with the confirmation window during the execution of the DELETE ALL operation
All files from the selected type are deleted after the <ENTER> push-button pressing, when the YES
option is selected. The message is displayed after the successful execution of all stages
of the operation. The instrument waits for the reaction of the user (any push-button should be pressed
except the <SHIFT> and <ALT> one) and after pressing a push-button it returns to the FILE list.
Execution of the DELETE ALL operation in the case of RESULT FILES selection
7.5.2
Deleting all logger files - LOGGER FILES
In order to activate the position the user has to place the special character in the line
with the LOGGER FILES text using the <
> push-button. The DELETE ALL sub-list is closed and
the instrument returns to the FILE list after pressing the <ESC> push-button.
In order to enter the DELETE ALL window one has to press the <ENTER> push-button.
LOGGER FILES selected to the execution of the DELETE ALL operation
After pressing the <ENTER> push-button the instrument checks its current state. In the case when
the measurements are performed, the execution of the DELETE ALL operation is not possible.
In such case, the message is displayed for a few seconds and the instruments returns to the FILE list.
7-22
SVAN 956 USER MANUAL
Display after the attempt to perform an unavailable operation during measurement in progress
If the measurements are not performed the instrument requests the confirmation of the operation
after entering this window (after pressing the <ENTER> push-button). After next pressing the <ENTER>
push-button, when the NO option is selected, the window is closed and the instrument returns to the FILE
list. The selection of the NO or YES option is possible using the <
>, <
> push-buttons. The return
to the FILE list is also possible after pressing the <ESC> push-button.
Displays with the confirmation window during the execution of the DELETE ALL operation
All files from the selected type are deleted after the <ENTER> push-button pressing, when the YES
option is selected. The message is displayed after the successful execution of all stages
of the operation. The instrument waits for the reaction of the user (any push-button should be pressed
except the <SHIFT> and <ALT> one) and after pressing a push-button it returns to the FILE list.
Execution of the DELETE ALL operation in the case of LOGGER FILES selected
7.5.3
Deleting all setup files - SETUP FILES
In order to activate the position the user has to place the special character in the line
with the SETUP FILES text using the <
> push-button. The DELETE ALL sub-list is closed and
the instrument returns to the FILE list after pressing the <ESC> push-button.
In order to enter the DELETE ALL window one has to press the <ENTER> push-button.
SETUP FILES selected to the execution of the DELETE ALL operation
After pressing the <ENTER> push-button the instrument checks its current state. In the case when
the measurements are performed, the execution of the DELETE ALL operation is not possible.
In such case, the message is displayed for a few seconds and the instruments returns to the FILE list.
7-23
SVAN 956 USER MANUAL
_
Display after the attempt to perform an unavailable operation during measurement in progress
If the measurements are not performed the instrument requests the confirmation of the operation
after entering this window (after pressing the <ENTER> push-button). After next pressing the <ENTER>
push-button, when the NO option is selected, the window is closed and the instrument returns to the FILE
list. The selection of the NO or YES option is possible using the <
>, <
> push-buttons. The return to the
FILE list is also possible after pressing the <ESC> push-button.
Displays with the confirmation window during the execution of the DELETE ALL operation
All files from the selected type are deleted after the <ENTER> push-button pressing, when the YES
option is selected. The message is displayed after the successful execution of all stages
of the operation. The instrument waits for the reaction of the user (any push-button should be pressed
except the <SHIFT> and <ALT> one) and after pressing a push-button it returns to the FILE list.
Execution of the DELETE ALL operation in the case of SETUP FILES selection
Notice: The execution of the DELETE ALL function described above takes place in the case
when only one type of the files is selected in the DELETE ALL sub-list. If all types are selected
simultaneously and the logger, result and setup are saved, only Clearing operation is performed but two
times – one time in logger files memory and one time in result and setup files memory. After clearing
all memory, the defragmentation is not done. The memory merging is done only in the case of setup and
results memory, as these two different types of files are saved together in the same space.
Execution of the DELETE ALL operation for all type files simultaneously
7-24
SVAN 956 USER MANUAL
7.6
Merging file space - DEFRAGMENTATION
The DEFRAGMENTATION is used to make the file memory continuous. All new files are saved
starting from the beginning of the free memory space. The memory occupied by the deleted file, assuming
that the file was not the last one, remains unused for the next files saving. After the removing
a file the files memory becomes discontinuous, with unused parts, which cannot be utilized in the future.
The situation changes after the process called defragmentation. During this process, the files saved
in the files memory are moved in order to obtain the continuous occupied space. The files’ merging is
performed separately for two parts of the instrument’s memory: the FILES DEFRAGMENT. is used to join
the result and setup files and LOGGER DEFRAGMENT. is used in the case of the logger.
Before the defragmentation the FILES FREE SPACE and TOTAL AVAILABLE, characterizing
the result memory (path: MENU / FILE / FREE SPACE), usually differ between each other. After this
operation, these two parts are equal.
The same situation is in the case of the LOGGER FREE SPACE and TOTAL AVAILABLE
characterizing the logger file. In order to enter the DEFRAGMENTATION sub-list the user has to select
the DEFRAGMENTATION text in the FILE list, using the <
>, <
> (or <
>, <
>) push-buttons and
press the <ENTER>.
DEFRAGMENTATION text highlighted (displayed inversely) in the FILE list
Notice: The DEFRAGMENTATION must not be broken – the user should never press
<ESC> or any other push-button during the DEFRAGMENTATION process.
7.6.1
Merging result and setup files memory - FILES DEFRAGMENTATION
The FILES DEFRAGMENT. is used to join the result and setup files memory. In order to select this,
the user has to display inversely the FILES DEFRAGMENT. text in the DEFRAGMENTATION sub-list
using the <
> (or <
>) push-button.
FILES DEFRAGMENT. selected to the execution of the DEFRAGMENTATION operation
The DEFRAGMENTATION sub-list is closed and the instrument returns to the FILE list
after pressing the <ESC> push-button. In order to continue the execution of the function one has to press
the <ENTER> push-button. The instrument requests the confirmation of the operation. The next pressing
of the <ENTER> push-button, when the NO option is selected, causes the closing of the window and
the return to the DEFRAGMENTATION sub-list. The selection of the NO or YES option is possible using
the <
>, <
> push-buttons. The return to the DEFRAGMENTATION sub-list is also possible after
pressing the <ESC> push-button.
7-25
SVAN 956 USER MANUAL
_
Confirmation windows during the execution of the FILES DEFRAGMENTATION operation
After pressing the <ENTER> push-button the instrument checks its current state. In the case when
the measurements are performed, the execution of the DEFRAGMENTATION operation is not possible.
In such case, the message is displayed and after few seconds instrument returns
to the DEFRAGMENTATION sub-list.
Display after the attempt to perform an unavailable operation during measurement in progress
If the measurements are not performed, after pressing the <ENTER> push-button on the active
YES option, the instrument checks whether the used result and setup files memory is continuous or not.
If this memory is continuous, the DEFRAGMENTATION operation is not executed and the special
message is displayed. The instrument waits for the reaction of the user (any push-button should
be pressed except the <SHIFT> and <ALT> one) and after pressing a push-button it returns
to the DEFRAGMENTATION sub-list.
Message in the case when the execution of the DEFRAGMENTATION operation is unnecessary
If there are conditions to execute the DEFRAGMENTATION operation, it is done and the current
progress is shown on the display.
After the successful execution, the special message is displayed and the instrument waits
for the reaction of the user. Any push-button should be then pressed except the <SHIFT> and <ALT>
one. After pressing a push-button, the instrument returns to the DEFRAGMENTATION sub-list.
Execution of the DEFRAGMENTATION operation
The displays below illustrate the results of the FILES DEFRAGMENT. – after the execution,
the FILES FREE SPACE and TOTAL AVAILABLE become equal while the LOGGER FREE SPACE and
LOGGER AVAILABLE remain unchanged.
7-26
SVAN 956 USER MANUAL
=>
Result of the FILES DEFRAGMENTATION operation
7.6.2
Merging logger files memory - LOGGER DEFRAGMENT.
The LOGGER DEFRAGMENT. is used to join the logger files memory. In order to select this,
the user has to display inversely the LOGGER DEFRAGMENT. text using the <
> (or <
>) push-button.
LOGGER DEFRAGMENT. selected to the execution of the DEFRAGMENTATION operation
The DEFRAGMENTATION sub-list is closed and the instrument returns to the FILE list
after pressing the <ESC> push-button. In order to continue the execution of the function one has to press
the <ENTER> push-button. The instrument requests the confirmation of the operation. The next pressing
of the <ENTER> push-button, when the NO option is selected, causes the closing of the window and
the return to the DEFRAGMENTATION sub-list. The selection of the NO or YES option is possible using
the <
>, <
> push-buttons. The return to the DEFRAGMENTATION sub-list is also possible after
pressing the <ESC> push-button.
Confirmation windows during the execution of the LOGGER DEFRAGMENTATION operation
After pressing the <ENTER> push-button the instrument checks its current state. In the case when
the measurements are performed, the execution of the DEFRAGMENTATION operation is not possible.
In such case, the message is displayed and after few seconds instrument returns
to the DEFRAGMENTATION sub-list.
Display after the attempt to perform an unavailable operation during measurement in progress
If the measurements are not performed, after pressing the <ENTER> push-button on the active
YES option, the instrument checks whether the used logger files memory is continuous or not.
If this memory is continuous, the DEFRAGMENTATION operation is not executed and the special
message is displayed. The instrument waits for the reaction of the user (any push-button should
be pressed except the <SHIFT> and <ALT> one) and after pressing a push-button it returns
to the DEFRAGMENTATION sub-list.
7-27
SVAN 956 USER MANUAL
_
Message in the case when the execution of the DEFRAGMENTATION operation is unnecessary
If there are conditions to execute the DEFRAGMENTATION operation, it is done and the current
progress is shown on the display. After the successful execution, the special message is displayed and
the instrument waits for the reaction of the user. Any push-button should be then pressed except
the <SHIFT> and <ALT> one. After pressing a push-button the instrument returns
to the DEFRAGMENTATION sub-list.
Execution of the DEFRAGMENTATION operation
The displays below illustrate the results of the LOGGER DEFRAGMENT. – after the execution
the LOGGER FREE SPACE and LOGGER AVAILABLE become equal while the FILES FREE SPACE
and TOTAL AVAILABLE remain unchanged.
=>
Result of the LOGGER DEFRAGMENTATION operation
7.7
Checking the contents of the memory - CATALOGUE
The CATALOGUE is used for checking the contents of the memory (the list of the result and setup
files). In order to enter the window the user has to select the CATALOGUE text in the FILE list, using
the <
>, <
> (or <
>, <
>) push-buttons and press the <ENTER> one.
CATALOGUE text highlighted (displayed inversely) in the FILE list
In the case when the instrument memory is empty (no file is stored), after entering
the CATALOGUE the NO FILES text is displayed and the instrument waits for the reaction of the user.
The user should press then the <ESC>, <ENTER> (the instrument returns to the FILE list) or
<START / STOP> push-button (the instrument starts the measurement).
7-28
SVAN 956 USER MANUAL
CATALOGUE window when the memory is empty
In the case when the result and setup files memory in the instrument is not empty (some files
are stored) another window is displayed in which the same data about the existing in the instrument files
as in the FILE / LOAD window are presented.
The current number of the file and the total number of the saved result and setup files is displayed
in the first line of the window. The name of the file is displayed in the second line (its current number is
presented in the first line).
The name of the file suggests the operation the file was created-in. The names in which the first
character is @ are coming from the AUTO SAVE function. The file with the default name @Timer@
is coming from the AUTO SAVE function executed in the TIMER operation. The other names suggest
the SAVE / SAVE NEXT function. The type of the current file (LEVEL METER, 1/1 OCTAVE,
1/3 OCTAVE, FFT or ENVELOPING) and the mode ( [VIBRATION]) is given in the third line. If during the
measurements which results are saved in the file, the logger file was also created its name is displayed in
the fourth line.
Notice: The logger file can be deleted from the instrument’s memory in the FILE / DELETE /
LOGGER FILES window and this deleting operation does not modify the contents of the fourth line
of the CATALOGUE window.
The date and time of the SAVE operation are displayed in the fifth and sixth line, respectively.
The change of the current file with the unit step can be done after pressing the <
>, <
> push-buttons.
The first file is available after pressing the <
> with <SHIFT> push-button (or <
> with <SHIFT>) and the
last one is displayed after pressing the <
> with <SHIFT> push-button (or <
> with <SHIFT>).
The setup file is indicated by the SETUP text displayed in the third line instead of the LEVEL METER /
DOSE METER text.
Contents of the CATALOGUE window
Notice: Many result files can be associated with one logger file, i.e. during the execution
of the AUTO SAVE function.
7-29
SVAN 956 USER MANUAL
_
Exemplary result files associated with the same logger file &LOG2 in the CATALOGUE window
7.8
Checking the free space in the memory - FREE SPACE
The FREE SPACE is used to read out the free space in the FLASH DISC memory
of the instrument. In order to enter the window the user has to select the FREE SPACE text in the FILE
list, using the <
>, <
> (or <
>, <
>) push-buttons and press the <ENTER> one.
FREE SPACE text highlighted (displayed inversely) in the FILE list
The files memory in the instrument is divided into two separate parts.
One part is dedicated for saving the result and setup files and its size is equal to 16252428 bytes.
The second part is used for saving the logger files and its size is equal to 15859224 bytes.
The FREE SPACE window in the instrument after the execution of the DELETE ALL operation
is presented below.
FREE SPACE window after the execution of the DELETE ALL operation
The FREE SPACE window contains four numbers. First two, named FILES FREE SPACE and
TOTAL AVAILABLE, characterize the result and setup files memory.
The files are always saved starting from the beginning of the continuous memory space. The size
in bytes of this space is given in the FILES FREE SPACE position.
If the result and setup files were not deleted from the memory the number of bytes displayed
in the TOTAL AVAILABLE position is the same as in the FILES FREE SPACE. However, if some of them
were deleted, assuming that they were not the last saved, the memory used by them is empty but it does
not increase the continuous space.
In such case, the number given in the TOTAL AVAILABLE position is greater than that
in the FILES FREE SPACE. The DEFRAGMENTATION operation, which merges files, should be used to
increase the FREE SPACE.
The next two numbers given in the FREE SPACE window, named LOGGER FREE SPACE and
LOGGER AVAILABLE characterize the logger files memory where the saving mechanism is the same.
Therefore, the numbers presented in the FREE SPACE window depend on the history
of the measurements and the operations performed by the user.
7-30
SVAN 956 USER MANUAL
FREE SPACE window with the number depending on the measurements and operations performed
The window is closed and the instrument returns to the FILE list after pressing the <ENTER> or
<ESC> push-buttons or it starts the measurements (after pressing the <START / STOP> one).
7.9
Saving setup files in the instrument’s memory - SAVE SETUP
The SAVE SETUP is used for storing setup settings in the internal non-volatile (FLASH DISC)
memory (files are always written at the beginning of a free continuous space) as a file (see Appendix B for
the file formats). In order to enter the window the user has to select the SAVE SETUP text in the FILE list,
using the <
>, <
> (or <>, <>) push-button and press the <ENTER> one.
SAVE SETUP text highlighted (displayed inversely) in the FILE list
There are two available functions: the SAVE NEXT – save a setup file with the name increased
by one, and SAVE – save a setup file with the edited name. These functions are available after pressing
the <
>, <
> push-buttons.
SAVE SETUP window in the FILE list
The name of the file, in which the setup settings are to be saved, is displayed above the SAVE or
SAVE NEXT text. The default name for a setup file is displayed in the case of the first entering to this
position (after power on). The default file name for setup settings is SET. The line of the setup file’s name
edition (FILE NAME) is opened after pressing the <
> push-button.
The user can skip the setup file’s name edition and start saving file pressing the <ENTER> pushbutton or return to the FILE list pressing the <ESC> one. The edition process is presented on the Figure
below. The displayed inversely character is currently edited. The <
>, <
>, <
>, <
> and <SHIFT>
push-buttons are used for editing the name which cannot exceed eight characters.
Display during the process of setting the character in the edited name
7-31
SVAN 956 USER MANUAL
_
One can select the proper position of the character in the edited text using the <
>, <
> pushbuttons.
Display during the selection of the character’s position to be edited
The available ASCII characters can be changed using the <
> (or <
>) push-button pressed
together with the <SHIFT> one. The subsequent digits, underline, big letters and space appear on
the display in the inversely displayed position after each pressing of the mentioned above push-buttons.
...
Display during the selection of the character
Displays in the FILE NAME edition after pressing the <SHIFT> and <> push-buttons
Displays in the FILE NAME edition after pressing the <SHIFT> and <> push-buttons
The edited name is accepted and the setup file is saved after pressing the <ENTER> push-button.
The special warning is displayed in the case the file with the edited name already exists in the memory,
if the REPLACE position is not activated (path: MENU / FILE / SAVE OPTIONS). The instrument waits
then for a reaction of the user (any push-button should be pressed except the <SHIFT> or the <ALT>).
7-32
SVAN 956 USER MANUAL
=>
...
...
Displays during the attempt of overwriting the existing file, changing the name and saving data
All changes introduced to the setup file name during the edition are ignored after pressing
the <ESC> push-button. This pressing causes the return to the list from which the SAVE option
was entered. The return after the edition to the line with the SAVE or SAVE NEXT text is possible
after pressing the <
> push-button.
The simplified edition consists in the addition at the end of the file name the natural number.
The increase by one of the number is made automatically. After the saving operation execution the new
setup file name is displayed and the instrument waits then for a reaction of the user (any push-button
should be pressed except the <SHIFT> or the <ALT> one). In the next attempt of saving data, the new
name is displayed in the FILE NAME line and that name is increased by one during the saving operation.
...
...
Displays in the simplified edition of the setup file name and saving operation execution
The number can be changed from 1 to N. The only limitation of the N value is the length
of the file name, which cannot be longer than 8 characters. In the case when such limitation is achieved
and the instrument can not change automatically the file’s name the only possibility is to edit new base file
name.
Notice: The files can be overwritten (the use of the same file name) without any warning
if the REPLACE option is switched on (path: MENU / FILE / SAVE OPTIONS / REPLACE).
...
Displays in the simplified edition of the file name, saving and the “saturation” of that operation
As it was already written, the instrument attempts to save a file after pressing the <ENTER> pushbutton. The saving is not possible in the case when the instrument is measuring the signal. The special
message is displayed for about 3 seconds in this case and the instrument returns to the SAVE SETUP
window.
7-33
SVAN 956 USER MANUAL
_
Displays after the attempt to perform unavailable saving operation; the return to the SAVE SETUP
Notice: During the execution of the SAVE or SAVE NEXT function an additional window
is displayed informing about the operation performed. This window can be unnoticed by the user
as it appears for the short time.
View of all displays during and after the execution of the SAVE operation
As it was already written it is not possible to store the data in the file, which already exists, when
the REPLACE is not active ([ ]) (path: MENU / FILE / SAVE OPTIONS / REPLACE).
The presented below sequence of displays illustrates the situation when during the name-edition
process, the user selected the name that was used before but this time the REPLACE is active.
The setup file is overwritten, the instrument displays a special message and waits for the reaction
of the user (any push-button should be pressed except the <SHIFT> or the <ALT> one) and after
pressing a push-button it returns to the FILE list.
...
... =>
=>
...
...
Displays after the attempt to overwrite a file if the REPLACE is active
7.10 Loading the files with the setup settings - LOAD SETUP
The LOAD SETUP is used for loading setup setting file from the FLASH DISC (e.g. for performing
different type of measurements with different instrument’s settings). The position is opened after pressing
the <ENTER> push-button when the LOAD SETUP text in the FILE list is displayed inversely (selected
using the <
> (or <
>) or <
> (or <
> with the <SHIFT> push-buttons). The return to the FILE list
is possible after pressing the <ESC> push-button.
7-34
SVAN 956 USER MANUAL
FILE list with the LOAD SETUP text highlighted (displayed inversely)
Notice: It is not possible to load the file during the execution of the measurements.
On such attempt the message: MEASUREMENT IN PROGRESS is displayed for about 3 seconds.
After pressing the <ENTER> push-button the instrument checks its current state. In the case when
the measurements are performed, the file loading is impossible and the message is displayed.
Display after the attempt to perform an unavailable operation during measurement in progress
In the case when the setup files were not saved, after entering the LOAD SETUP window,
the NO FILES text is displayed and the instrument waits for the reaction of the user. The user should
press then the <ESC>, <ENTER> (the instrument returns to the FILE list) or <START / STOP> pushbutton (the instrument starts the measurement).
Display during the execution of the LOAD SETUP operation
The current number of the setup file and the total number of the saved setup files is displayed
in the first line of the LOAD SETUP window. The name of the file is displayed in the second line
(its current number is presented in the first line).
The date and time of the SAVE SETUP operation is displayed in the fourth and fifth line
respectively. The change of the current file with the unit step can be done after pressing the <
>, <
>
push-buttons. The first file is available after pressing the <
> with <SHIFT> push-button (or <
> with
<SHIFT>) and the last one is displayed after pressing the <> with <SHIFT> push-button (or <
> with
<SHIFT>).
Exemplary contents of the LOAD SETUP window
The name of the file is accepted and the file is loaded after pressing the <ENTER> push-button.
The message with the name of the selected file is displayed during the execution of the loading operation.
The next message is displayed after successful end of loading operation. The instrument waits
7-35
SVAN 956 USER MANUAL
_
for the reaction of the user (any push-button should be pressed except the <SHIFT> or <ALT> one) and
after pressing a push-button it returns to the FILE list.
<A KEY>
Displays after the execution of the LOAD SETUP operation
7.11 Connecting the external USB memory stick- DIRECTORY
The DIRECTORY text appears in the FILE list when the USB memory stick is connected
to the device. (It is necessary to select in the USB–HOST PORT window the USB DISK position, path:
MENU / SETUP / USB–HOST PORT / USB DISK). In order to enter the window the user has to select
the DIRECTORY text in the FILE list, using the <
>, <
> (or <
>, <
>) push-buttons and press
the <ENTER> one. The return to the FILE list is possible after pressing the <ESC> push-button.
a)
b)
FILE list with the DIRECTORY text selected (a) and the DIRECTORY window opened (b)
The FREE SPACE denotes the available free memory on the connected disk. The DIR NO. shows
st
the number of the selected directory (the 1 number) and the number of the existing directories
nd
(the 2 number). In the case the directories do not exist, these numbers are equal to zero.
st
The DIR NAME enables one to edit the directory name (the 1 number) or displays its name. The help
lines are placed at the display’s bottom.
There are two ways of the current directory selection:
• the name edition in the DIR NAME line. The default name consists of the day number and the month
abbreviation. The not existing directory will be created.
• the selection of the existing directory by means of the <
>, <
> push-buttons pressed in the line
with the DIR NO. text. The name of the selected directory is displayed in the DIR NAME line.
The selection is confirmed after pressing the <ENTER> push-button which closes the window and
returns to the FILE list. The return to this list is also possible after pressing the <ESC> push-button but
the selection is not confirmed. The selection of the directory is obligatory during the initialisation process.
In this case also the <ESC> push-button confirms the settings.
FILE list, the DIRECTORY window
Notice: After connecting a USB memory stick to the device the paper sheet icon appears in
the top of the display.
7-36
SVAN 956 USER MANUAL
7.12 Copying files to the external USB memory stick- COPY FILES TO USB
The COPY FILES TO USB is used for copying files to the external USB memory stick. The position
is opened after pressing the <ENTER> push-button when the COPY FILES TO USB text in the FILE list
is displayed inversely. The return to the FILE list is possible after pressing the <ESC> push-button.
a)
b)
FILE list with the COPY FILES TO USB text selected (a) and the COPY FILES window opened (b)
The COPY FILES TO USB sub-list consists of three positions to be selected: RESULT FILES,
LOGGER FILES and SETUP FILES and DIRECTORY position with the name of the directory in which the
files from the internal memory of the instrument will be stored.
In order to copy required type of the files the user has to place the special character in the line
with the RESULT FILES, LOGGER FILES or SETUP FILES text using the <
> or <
> push-button.
After next pressing the <ENTER> push-button, when no option is selected, the window is closed and
the instrument returns to the FILE list. The return to the FILE list is also possible after pressing the
<ESC> push-button.
b)
a)
RESULT FILES selection to the execution of the COPY FILES TO USB operation (a); the RESULT,
LOGGER and SETUP files selected to the execution of the COPY FILES TO USB operation (b)
After pressing the <ENTER> push-button the instrument checks its current state. When
the measurements are performed, the execution of the COPY FILES TO USB operation is not allowed.
In such case, the message is displayed for a few seconds and the instrument returns to the FILE list.
Display after the attempt to perform an unavailable operation during measurement in progress
If the measurements are not performed, the instrument starts the operation. After the operation
Files Copied O.K. message is presented on the display. If a file has been already copied to the USB
stick, a message ALREADY EXIST is presented on the display as well as the name of the file.
a)
b)
Display after the execution of COPY FILES TO USB operation (a) and when the file exists already (b)
7-37
SVAN 956 USER MANUAL
_
7.13 Moving files to the USB memory stick- MOVE FILES TO USB
The MOVE FILES TO USB is used for moving files from internal instrument’s memory to the USB
memory stick.
The proper window is opened after pressing the
the MOVE FILES TO USB text in the FILE list is displayed inversely.
<ENTER>
push-button
when
The return to the FILE list is possible after pressing the <ESC> push-button.
a)
b)
FILE list with the MOVE FILES TO USB text selected (a) and the MOVE FILES window opened (b)
The MOVE FILES TO USB sub-list consists of three positions: RESULT FILES, LOGGER FILES,
SETUP FILES and DIRECTORY position with the name of the file in which the files from the internal
memory of the instrument will be stored.
In order to activate required position the user has to place the special character in the line
with the RESULT FILES, LOGGER FILES or SETUP FILES text using the <> or <
> push-button.
After next pressing the <ENTER> push-button, when no option is selected, the window is closed and
the instrument returns to the FILE list. The return to the FILE list is also possible after pressing
the <ESC> push-button.
b)
a)
RESULT FILES selection to the execution of the MOVE FILES TO USB operation (a) the RESULT,
LOGGER and SETUP files selected to the execution of the MOVE FILES TO USB operation (b)
After pressing the <ENTER> push-button the instrument checks its current state. In the case when
the measurements are performed, the execution of the MOVE FILES TO USB operation is not possible.
In such case, the message is displayed for few seconds and the instruments returns to the FILE list.
Display after the attempt to perform an unavailable operation during measurement in progress
If the measurements are not performed, the instrument starts the operation. After the operation
Files Moved O.K. message is presented on the display.
If the file already exist in the USB memory stick the message with the name of the file and
ALREADY EXIST text is presented on the display.
7-38
SVAN 956 USER MANUAL
Display after the execution of MOVE FILES TO USB operation (a) and when the file already exists
in the USB memory (b)
Notice: After the execution of the MOVE FILES TO USB operation, files, which have been
moved, do not exist in the internal instrument’s memory any more.
7-39
SVAN 956 USER MANUAL
8
REPORTS PRINTING - REPORT
The printed reports of the vibration measurement results in the predefined format can be obtained
by means of the REPORT list. In order to open the REPORT list the user has to:
• press the <MENU> push-button,
• select from the main list, using the <
>, <
> (or <
>, <
>) push-buttons, the REPORT text (highlight
it inversely),
• press the <ENTER> push-button.
Display in the main list; the REPORT text highlighted (displayed inversely)
In order to obtain the report the user has to connect the instrument to the printer’s RS 232 port
using the SV 55 RS 232 interface. This hardware interface is hidden in the Cannon type, 9-pin RS 232
plug-in. On the other end of the SV 55 interface, which itself looks like a cable, there is the USB Host plugin. This plug-in should be placed in the USB Host socket of the instrument.
It is also possible to connect the instrument to the USB port of a PC using the proper cable.
Measurement results can be easy downloaded to any PC (using USB interface and SvanPC
software) and printed out on the printer attached to a PC.
Notice: The converter SV 55 serves as the RS 232 interface. The SV 55 connection to the
USB Host socket is detected and after successful detection the headphone icon is switched on.
The transmission using the SV 55 is possible only in the case when the instrument is not connected to a
PC with the USB Device port.
The RS232 is the default setting in the USB–HOST PORT in the SETUP list. Only in this option
the USB host controller is awaken and the power consumption is the lower one.
<ENTER>
SETUP list with the USB–HOST PORT selected and this window with the activated RS232
The user has to be sure that the RS232 is activated (path: MENU / SETUP / USB–HOST PORT /
RS232) before starting printing reports. Additionally, in the RS232 list (path: MENU / SETUP / RS232) the
user has to select the proper speed of the transmission and the parameter called TIME OUT.
<ENTER>
...
SETUP list with the RS232 selected and the exemplary contents of this window
8-1
SVAN 956 USER MANUAL
_
The RS 232 interface transmission (BAUD RATE) speed can be selected from the following
available values: 1200 (bits / second), 2400 (bits / s), 4800 (bits / s), 9600 (bits / s), 19200 (bits / s),
38000 (bits / s), 57600 (bits / s) or 115200 (bits / s).
The selection is made by means of the <
>, <
> push-buttons. The transmission speed should
correspond to the one selected in a printer. The other RS 232 transmission parameters are fixed to 8 bits
for data, No parity & 1 Stop bit. The default value of the TIME OUT parameter is equal to one but it can
be too short period for the printers, which are not too fast. In such case, this parameter has to be
increased.
The description of the SV 55 pin-outs is given in App. C. The printers with the different connections
on the RS 232 socket require the special, individual RS 232 – RS 232 cable that should fulfil the suitable
wire crossing.
The printers, in which the Centronics interface is available instead of the RS 232 one, can be
connected to the instrument by means of the SV 52 RS 232 – Centronics interface.
The printers, which have only USB interface, are currently not driven by the instrument.
Notice: Switch the power off before connecting the instrument to any external device (e.g. a
printer or a Personal Computer).
The REPORT list contains the following elements:
TITLE
that enables the user to give the header to the printed report;
PRINT RESULTS
that enables the user to print out the measurement results on the default printer
or to send the measurement result s to a PC using SvanPC software and USB
interface;
PRINT FILE
that enables the user to print out on a printer the selected file with
the measurement results or to send it to a PC using SvanPC software
and USB interface
PRINT LOGGER
that enables the user to print out on a printer connected directly
to the instrument the measurement results in a selected file from the logger
or to send it to a PC using SvanPC software and USB interface
PRINT USER FILTERS that enables the user to print out on a printer connected directly
to the instrument the values of the user filters introduced in the instrument
or to send them to a PC using SvanPC software and USB interface;
PRINT CATALOGUE
that enables the user to print out the catalogue of the files
OPTIONS
that enables the user to determine the options of the report.
REPORT list
Notice: All reports are printed in the character format using the ASCII set.
8-2
SVAN 956 USER MANUAL
8.1 Edition of the user’s text to be added to the reports - TITLE
The TITLE enables the user to edit the text added to the file and to the report to be printed.
This operation is performed in the same way as it was described in the case of the FILE NAME window.
In order to enter the position the user has to select the TITLE text in the REPORT list, using the <
>,
<
> (or <
>, <
> with <SHIFT>) push-buttons and press the <ENTER> one.
REPORT windows with the TITLE selected
The text edition is made using the <
>, <
>, <
>, <
> and <SHIFT> push-buttons. The <
>,
<
> push-buttons are used for changing the position of the edited character. The number (counted from
the beginning of the text) of the edited character is displayed in the first line of the display, in the brackets.
The text is limited to 128 characters.
Displays in the text edition of the report’s header
The <
>, <
> push-buttons are used for the selection of the ASCII characters. Digits, small
and big letters as well as special characters, all together 91, are available (cf. the view of the displays
below). Small and big letters are placed one after another.
Pressing the <SHIFT> and <
> push-buttons causes that the highlighted character is erased from
the text (DEL function). Pressing the <SHIFT> and <
> causes that the whole text is shifted one position
to the right (INSERT function).
The window is closed and the instrument returns to the REPORT list after pressing the <ENTER>
or <ESC> push-button. In the first case, the edited text is saved and will be added to the printed reports.
In the latter case newly introduced text or the amendments made in the old one are ignored.
Displays with all available characters
Displays with all available characters (cont.)
8-3
SVAN 956 USER MANUAL
_
8.2 Printing of the measurement results - PRINT RESULTS
The PRINT RESULTS enables the user to print the report on the attached printer or to send out
the report to a PC using the SvanPC software and the USB interface.
In order to enter the position the user has to select the PRINT RESULT text in the REPORT list,
using the <
>, <
> (or <
>, <
>) push-buttons and press the <ENTER> one.
a)
REPORT windows with the PRINT RESULTS selected
After pressing the <ENTER> push-button the instrument checks its current state. In the case when
the measurements are performed, the printing is impossible and the message is displayed.
Display after the attempt to perform an unavailable operation during measurement in progress
In the case when a measurement was already performed and a result is available, the message
presented below is displayed.
Display in the REPORT list; the execution of the PRINT RESULTS
When the message is on the display, the data are transferred from the instrument to the attached
printer. The instrument returns to the REPORT list after transferring all data.
The exemplary report printed in A5 format (path: MENU / REPORT / OPTION / FORMAT A5)
with the TITLE “20JUL” (path: MENU / REPORT / TITLE / 20JUL) looks as follows:
(C) SVANTEK
SVAN 956
2007/07/20
(v6.05/6.05.2)
No.12001
17:09:24
TITLE:
20JUL
------------ SETTINGS ----------Device mode........:
Input..............:
Device function....:
LEVEL METER version:
Meas. start date...:
Meas. start hour...:
Range..............:
Ref.level for Acc..:
Ref.level for Vel..:
8-4
VIBR. METER
Accelerometer
LEVEL METER
6.05
2007/07/20
17:01:00
HIGH
1 um/s2
1 nm/s
SVAN 956 USER MANUAL
Ref.level for Dil..:
Measure trigger....:
Logger trigger.....:
Repeat cycle.......:
Start delay........:
Integration time...:
Calibr. factor.....:
Calibration by.....:
Calibration date...:
Calibration hour...:
RMS integration....:
Profile:
Filter:
Detector:
Logger:
#1
HP1
1.0s
None
1 pm
Off
Off
1
1 s
10 s
-20.0 dB
Sensitivity
2007/07/20
16:38:20
Linear
#2
HP3
1.0s
PEAK
RMS
#3
HP10
1.0s
PEAK
RMS
--------------- RESULTS -------------Measurement time: 00:00:10
Prof.:
PEAK
P-P
MAX
RMS
#1
8.61
12.7
2.04
1.33
m/s2
m/s2
m/s2
m/s2
#2
6.24 m/s2
10.0 m/s2
1.35 m/s2
923mm/s2
#3
4.90 m/s2
7.67 m/s2
624mm/s2
452mm/s2
--------------------------------------
Example of the printed results - A5 format
The same result’s report printed in A4 format is presented below:
(C) SVANTEK
SVAN 956
No.12001 2007/07/20
(v6.05/6.05.2)
17:03:27
TITLE:
20JUL
------------ SETTINGS -----------
------------ SETTINGS -----------
Device mode........:
Input..............:
Device function....:
Meas. start date...:
Range..............:
Ref.level for Vel..:
Measure trigger....:
Repeat cycle.......:
Integration time...:
Calibration by.....:
Calibration hour...:
LEVEL METER version:
Meas. start hour...:
Ref.level for Acc..:
Ref.level for Dil..:
Logger trigger.....:
Start delay........:
Calibr. factor.....:
Calibration date...:
RMS integration....:
Profile:
Filter:
Logger:
#1
HP1
None
VIBR. METER
Accelerometer
LEVEL METER
2007/07/20
HIGH
1 nm/s
Off
1
10 s
Sensitivity
16:38:20
#2
HP3
PEAK
RMS
#3
HP10
PEAK
RMS
Profile:
Detector:
#1
1.0s
6.05
17:01:00
1 um/s2
1 pm
Off
1 s
-20.0 dB
2007/07/20
Linear
#2
1.0s
#3
1.0s
-------------------- RESULTS -------------------Measurement time: 00:00:10
Prof.:
PEAK
P-P
#1
8.61
12.7
m/s2
m/s2
#2
6.24
10.0
m/s2
m/s2
#3
4.90
7.67
m/s2
m/s2
8-5
SVAN 956 USER MANUAL
MAX
RMS
2.04
1.33
_
m/s2
m/s2
1.35 m/s2
923 mm/s2
624 mm/s2
452 mm/s2
-------------------------------------------------
Example of the printed results from the VLM mode - A4 format
The following confirmation question is displayed after the printing, if the Prompt parameter
was selected in the EJECT P. (path: MENU / REPORT / OPTIONS / EJECT P.). The user has to answer
in this case if the paper in the printer has to be ejected to the new page. The change of the available
answers is possible after pressing the <
>, <
> push-buttons. The return to the REPORT list
is performed after pressing the <ENTER> push-button with the possible ejection of the paper to the new
page.
Displays with the confirmation request of the paper ejection
The similar message is displayed after sending out the statistics of the results, the contents of the
selected file, the contents of the selected file in the logger and the catalogue of the files
(PRINT STATISTICS,
PRINT FILE,
PRINT LOGGER,
PRINT USER FILTERS
and
PRINT CATALOGUE).
The message about the time limit is displayed in the case when the printer (or a PC)
is not connected or there is any other reason that it does not receive the data. The instrument waits
for the reaction of the user (any push-button should be pressed except the <SHIFT> and <ALT> one)
and after pressing a push-button it returns to the REPORT list. Another message is presented
and the instrument waits for the reaction of the user in the case when there is no data to be printed.
a)
b)
Displays during the results printing when there is no transfer (a) and no data (b)
8.3 Printing of the measurement results from the selected file - PRINT FILE
The PRINT FILE enables the user to print out on a printer connected directly to the instrument the
selected file with the measurement results or to send it to a PC using SvanPC software and the USB
interface. In order to enter the position the user has to select the PRINT FILE text in the REPORT list,
using the <
>, <
> (or <
>, <
>) push buttons and press the <ENTER>.
REPORT windows with the PRINT FILE selected
After pressing the <ENTER> push-button the instrument checks its current state. In the case when
the measurements are performed, the printing is impossible and the message is displayed.
8-6
SVAN 956 USER MANUAL
Display after the attempt to perform an unavailable operation during measurement in progress
If no files were saved in the instrument’s memory then after pressing <ENTER> a special message
is displayed and the unit waits for the reaction of the user. In this time any push-button should be pressed
except the <SHIFT> and <ALT> one and after pressing a push-button the instrument returns
to the REPORT list.
Display in the REPORT list; the PRINT FILE position when no files were saved
In the consecutive lines of the display the current file number, the total number of the files, the file
name, file type, date and time of registration are presented. The change of the current file with the unit
step can be done pressing the <
>, <
> push-buttons. After pressing the <
> with <SHIFT> push-button
the first file is available and after pressing the <
> with <SHIFT> push-button - the last one
is displayed.
Displays during the selection of the file to be printed
The contents of the selected file is sent out to a PC after pressing the <ENTER> push-button.
The following message is displayed on the display during the printing:
Display during the execution of the PRINT FILE operation
The instrument returns to the REPORT list when all data are transferred but if the Prompt
parameter was selected (path: MENU / REPORTS / OPTIONS / EJECT P. / Prompt), the described
in the PRINT RESULTS message is displayed on the display after the printing. The user has to answer
in this case if the Line Feed has to be added to the transferred data. The change of the available answers
is possible after pressing the <
>, <
> push-buttons. The return to the REPORT list is performed after
pressing the <ENTER> push-button with the possible Line Feed addition.
Display during the file sending out when there is no data transfer
8-7
SVAN 956 USER MANUAL
_
The message about the time limit is displayed in the case when the printer (or PC) is not connected
or there is any other reason that it does not receive the data. The instrument waits for the reaction
of the user (any push-button should be pressed except the <SHIFT> and <ALT> one) and it returns
to the REPORT list after pressing a push-button.
The exemplary printed file contents are presented below.
(C) SVANTEK
SVAN 956
2007/08/18
(v6.06/6.06.3)
No.12001
16:32:37
File name: @RES14
TITLE:
------------ SETTINGS ----------Device mode........:
Input..............:
Device function....:
LEVEL METER version:
Meas. start date...:
Meas. start hour...:
Range..............:
Ref.level for Acc..:
Ref.level for Vel..:
Ref.level for Dil..:
Measure trigger....:
Logger trigger.....:
Repeat cycle.......:
Start delay........:
Integration time...:
Calibr. factor.....:
RMS integration....:
Profile:
Filter:
Detector:
Logger:
#1
HP1
1.0s
None
VIBR. METER
Accelerometer
LEVEL METER
6.06
2007/08/17
18:01:04
HIGH
1 um/s2
1 nm/s
1 pm
Off
Off
Infinity
1 s
10 s
0.0 dB
Linear
#2
HP3
1.0s
None
#3
HP10
1.0s
None
--------------- RESULTS -------------Measurement time: 00:00:10
Prof.:
#1
PEAK
115mm/s2
P-P
211mm/s2
MAX
24.3mm/s2
RMS
20.0mm/s2
VDV
49.5mm/sX
Remark:
#2
97.7mm/s2
188mm/s2
20.9mm/s2
18.0mm/s2
44.2mm/sX
#3
90.2mm/s2
176mm/s2
18.2mm/s2
16.2mm/s2
39.4mm/sX
X = 1.75
Example of the printed file from the VIBRATION LEVEL METER mode - format A5
8.4 Printing of the logger results - PRINT LOGGER
The PRINT LOGGER enables the user to print out on a printer connected directly to the instrument
the measurement results in a selected file from the logger or to send them to a PC using SvanPC
software and USB interface. In order to enter the position the user has to select the PRINT LOGGER text
8-8
SVAN 956 USER MANUAL
in the REPORT list, using the <
>, <
> (or <
>, <
>) push buttons and press the <ENTER>. This
option is under development - Function not available text appears on the display.
REPORT windows with the PRINT LOGGER selected
PRINT LOGGER window opened - Function not available message
8.5 Printing of the coefficients of the user filters - PRINT USER FILTERS
The PRINT USER FILTERS enables the user to print out the values of the user filters introduced
in the instrument: S1, S2, S3.
REPORT windows with the PRINT USER FILTERS selected
In order to enter the position the user has to select the PRINT USER FILTERS text in the REPORT
list, using the <
>, <
> (or <
>, <
>) push buttons and press the <ENTER>. After pressing the
<ENTER> push-button the instrument checks its current state. In the case when the measurements are
performed, the printing is impossible and the message is displayed.
Display after the attempt to perform an unavailable operation during measurement in progress
The selection of the USER FILTER is made by means of the <
>, <
> push buttons.
PRINT USER FILTERS windows; the user filter selection
The contents of the selected file is sent out to the attached printer (or to a PC) after pressing
the <ENTER> push-button. The following message is displayed on the display during the printing:
8-9
SVAN 956 USER MANUAL
_
Display in the REPORT list; the execution of the PRINT USER FILTERS
When the message is on the display, the data are transferred from the instrument to the attached
printer (or PC). The instrument returns to the REPORT list after transferring all data.
In the case when the printer or PC is not connected or there is any other reason that it does not
receive the data the message about the time limit is displayed. The instrument waits for the reaction
of the user (any push-button should be pressed except the <SHIFT> and <ALT>) and after pressing
a push-button it returns to the REPORT list.
The exemplary USER FILTER coefficients printed in A4 format look as follows:
(C) SVANTEK
SVAN 956
No.12001 2007/07/20
(v6.05/6.05.2)
17:03:27
Vibration meter mode filter
------- S1 -----[Hz]
0.80
1.00
1.25
1.60
2.00
2.50
3.15
4.00
5.00
6.30
8.00
10.00
12.50
16.00
20.00
------- S1 ------
[dB]
-INF
-100.0
-90.0
-80.0
-70.0
-60.0
-50.0
-40.0
-30.0
-20.0
-10.0
0.0
10.0
20.0
30.0
[Hz]
25.00
31.50
40.00
50.00
63.00
80.00
100.00
125.00
160.00
200.00
250.00
315.00
400.00
500.00
630.00
-----------------
[dB]
40.0
50.0
60.0
70.0
80.0
90.0
100.0
90.0
80.0
70.0
60.0
50.0
40.0
30.0
20.0
-----------------
------- S1 -----[Hz]
800.00
1000.00
1250.00
1600.00
2000.00
2500.00
3150.00
4000.00
5000.00
6300.00
8000.00
10000.00
12500.00
16000.00
20000.00
-----------------
Example of the printed coefficients of the user filter S1- format A4
(C) SVANTEK
SVAN 956
2007/08/18
(v6.06/6.06.3)
No.12001
16:32:37
Vibration meter mode filter
------- S2 -----[Hz]
0.80
1.00
1.25
1.60
2.00
2.50
3.15
4.00
5.00
6.30
8.00
8-10
[dB]
-INF
-INF
-INF
-INF
0.0
0.0
0.0
0.0
0.0
0.0
0.0
------- S2 -----[Hz]
160.00
200.00
250.00
315.00
400.00
500.00
630.00
800.00
1000.00
1250.00
1600.00
[dB]
10.0
0.0
-10.0
-20.0
-30.0
-40.0
-50.0
-60.0
-70.0
-80.0
-90.0
-100.0
-INF
-INF
-INF
[dB]
1.0
1.0
1.0
3.0
3.0
3.0
1.0
1.0
1.0
1.0
1.0
SVAN 956 USER MANUAL
10.00
12.50
16.00
20.00
25.00
31.50
40.00
50.00
63.00
80.00
100.00
125.00
0.0
0.0
0.0
0.0
0.0
0.0
0.0
0.0
0.0
0.0
1.0
0.0
-----------------
2000.00
2500.00
3150.00
4000.00
5000.00
6300.00
8000.00
10000.00
12500.00
16000.00
20000.00
0.0
0.0
0.0
0.0
0.0
0.0
0.0
-INF
-INF
-INF
-INF
-----------------
Example of the printed coefficients of the user filter S2 - format A5
8.6 Printing of the file’s catalogue - PRINT CATALOGUE
The PRINT CATALOGUE enables the user to print the catalogue of the files stored
in the instrument on the attached printer. In order to enter the position the user has to select
the PRINT CATALOGUE text in the REPORT list, using the <
>, <
> (or <
>, <
>) push buttons
and press the <ENTER>.
REPORT windows with the PRINT CATALOGUE selected
After pressing the <ENTER> push-button the instrument checks its current state. In the case when
the measurements are performed, the printing is impossible and the message is displayed.
Display after the attempt to perform an unavailable operation during measurement in progress
After pressing the <ENTER> push-button the following message is displayed:
Display in the REPORT list; the execution of the PRINT CATALOGUE
When the message is on the display, the data are transferred from the instrument to the attached
printer.
The instrument returns to the REPORT list after transferring all data but if the Prompt parameter
was selected in the EJECT P. (path: MENU / REPORT / OPTIONS / EJECT P.), the confirmation question
is displayed after the printing. The user has to answer in this case if the paper in the printer has to be
8-11
SVAN 956 USER MANUAL
_
ejected to the new page. The change of the available answers is possible after pressing the <
>, <
>
push-buttons.
The return to the REPORT list is performed after pressing the <ENTER> push-button with the
possible ejection of the paper to the new page.
Displays with the confirmation request of the paper ejection
The exemplary printed catalogue is presented below.
(C) SVANTEK
SVAN 956
No.12001 2007/08/18
CATALOGUE CONTENTS
Name
@RES1
@RES3
@RES5
@RES7
@RES9
@RES11
@RES13
SET0
Mf Length
<Vo>
426
<Vo>
426
<Vo>
426
<Vo>
426
<Vo>
426
<Vo>
426
<Vl>
380
< >
2280
(v6.06/6.06.3)
Number of files: 15
Date
07/08/17
07/08/17
07/08/17
07/08/17
07/08/17
07/08/17
07/08/17
07/08/17
Time
17:59
17:59
17:59
18:00
18:00
18:00
18:01
18:05
--------------------------------------
Name
@RES2
@RES4
@RES6
@RES8
@RES10
@RES12
@RES14
Mf Length
<Vo>
426
<Vo>
426
<Vo>
426
<Vo>
426
<Vo>
426
<Vl>
380
<Vl>
380
The same catalogue printed in A5 format looks as follows:
(C) SVANTEK
2007/08/18
SVAN 956
(v6.06/6.06.3)
No.12001
16:36:59
CATALOGUE CONTENTS
Number of files: 15
Name
@RES1
@RES2
@RES3
@RES4
@RES5
@RES6
@RES7
@RES8
@RES9
@RES10
@RES11
@RES12
@RES13
@RES14
SET0
Mf Length
<Vo>
426
<Vo>
426
<Vo>
426
<Vo>
426
<Vo>
426
<Vo>
426
<Vo>
426
<Vo>
426
<Vo>
426
<Vo>
426
<Vo>
426
<Vl>
380
<Vl>
380
<Vl>
380
< >
2280
Date
07/08/17
07/08/17
07/08/17
07/08/17
07/08/17
07/08/17
07/08/17
Time
17:59
17:59
17:59
18:00
18:00
18:00
18:01
--------------------------------------
Example of the printed catalogue - format A4
Date
07/08/17
07/08/17
07/08/17
07/08/17
07/08/17
07/08/17
07/08/17
07/08/17
07/08/17
07/08/17
07/08/17
07/08/17
07/08/17
07/08/17
07/08/17
Time
17:59
17:59
17:59
17:59
17:59
17:59
18:00
18:00
18:00
18:00
18:00
18:00
18:01
18:01
18:05
--------------------------------------
Example of the printed catalogue - format A5
8-12
16:38:08
SVAN 956 USER MANUAL
When the catalogue of the files is empty (the measurement results were not saved), the instrument
returns to the REPORT list without any reaction.
Display during the catalogue printing when there is no data transfer
8.7 Selection of the printing options - OPTIONS
Using the OPTIONS the user can select the format of the listing (FORMAT), can control the way
the paper is ejected in the printer (EJECT P.). In order to enter the position the user has to select
the OPTIONS text in the REPORT list, using the <
>, <
> (or <
>, <
>) push-buttons and press
the <ENTER>.
REPORT windows with the OPTION selected
8.7.1 Selection of the format of the print out - FORMAT
The FORMAT enables the user to select the format of the listing (A4 and A5 options are available).
In order to confirm the selection the <ENTER> push-button has to be pressed. After this confirmation,
the OPTIONS sub-list is closed. In order to ignore any changes made in the OPTIONS sub-list the user
has to press the <ESC> push-button.
OPTIONS windows; the selection of the format
8.7.2 Controlling the paper ejection after print out - EJECT P.
The EJECT P. enables the user to control the ejection of the paper after the listing is done.
The following options are available: Prompt (the instrument asks whether to eject the page after printing
report, statistics or catalogue), Auto (after printing, the paper is ejected) and None (the paper
is not ejected after printing). In particular, it is possible to have one result after another using the None
or Prompt options.
In the EJECT P. position any change is performed by means of the <
>, <
> push-buttons.
In order to confirm the selection the <ENTER> push-button has to be pressed. After this confirmation,
the OPTIONS sub-list is closed. In order to ignore any changes made in the OPTIONS sub-list the user
has to press the <ESC> push-button.
8-13
SVAN 956 USER MANUAL
_
OPTIONS windows; the selection of the paper ejection
The request is displayed after the printing of the measurement results, the statistics of the results,
the contents of the selected file, the contents of the selected file in the logger and the catalogue of the
files (PRINT RESULTS, PRINT FILE, PRINT LOGGER, PRINT USER FILTERS, PRINT CATALOGUE)
if the Prompt parameter was selected in the EJECT P. position of the OPTIONS sub-list. The user has to
answer in this case if the paper in the printer has to be ejected to the new page. The change of the
available answers is possible after pressing the <
>, <
> push-buttons. The return
to the REPORT list is performed after pressing the <ENTER> push-button with the possible ejection
of the paper to the new page.
Displays with the request for the confirmation of the paper ejection
The message about the time limit is displayed in the case when the printer is not connected or there
is any other reason that it does not eject a paper. The instrument waits for the reaction of the user (any
push-button should be pressed except the <SHIFT> one) and after pressing a push-button it returns
to the REPORT list.
Display after a printing when there is not possible to eject a paper
8-14
SVAN 956 USER MANUAL
9
SETUP MENU - SETUP
The SETUP list contains different sub-lists and positions. Some of them are directly related with
vibration measurements, and some - with the settings of the hardware components of the instrument. In
order to open the SETUP list the user has to:
• press the <MENU> push-button,
• select from the main list, using the <>, <> (or <>, <>) push-buttons, the SETUP text (highlight it
inversely),
• press the <ENTER> push-button.
Display in the main list; the SETUP text highlighted (displayed inversely)
In the SETUP list, the following items are available:
LANGUAGE
it enables the user to set language of the user interface.
CLEAR SETUP
it enables the user to return to the default, factory setup.
EXTERNAL I/O SETUP
it enables the user to select the available functionality of the Ext. I/O port.
HUMAN VIB. FILT.
it enables the user to activate HUMAN VIBRATION FILTERS. This
position appears only before activation of those filters.
IEPE CURRENT
it enables the user to choose current IEPE supply.
REFERENCE LEVELS
it enables the user to select the reference level for calculation of the
vibration measurement results
REMOTE COMMUNICATION it enables the user to select the type of remote communication and
packet size for data transmission.
RMS INTEGRATION
it enables the user to select the way of integration for the RMS
measurement.
RPM MEASUREMENT
it enables the user to activate the RPM (Revolution Per Minute)
measurement option. This position does not appear after activation
of the function.
RS232
it enables the user to set the transmission speed and the timeout
in the RS232 interface.
RTC
it enables the user to set the Real Time Clock.
SHIFT MODE
it enables the user to set the operating mode of the <SHIFT> and
the <START / STOP> push-buttons.
SIGNAL GENERATOR
it enables the user to activate SIGNAL GENERATOR function.
TIMER
it enables the user to set the Timer function.
USB–HOST PORT
it enables the user to select the available functionality of the USB Host
port.
USER FILTERS
it enables the user to select and set the correcting values for all real-time
and 1/1 and 1/3 octave filters.
VIBRATION UNITS
it enables the user to select the vibration units in which the results
of the measurements are to be given. This position is taken off
from the menu in the sound meter and voltage (sound) mode.
WARNINGS
it enables the user to switch on or off the warnings that can be displayed
during the operation of the instrument.
Pressing the <SHIFT> and <> (or <SHIFT> and <>) push-buttons results in a movement
to the first position of the opened list and pressing the <SHIFT> and <> (or <SHIFT> and <>) – results
in a movement to the last position of the opened list.
9-1
SVAN 956 USER MANUAL
_
In each available position any change is performed by means of the <>, <> push-buttons.
In order to confirm the selection the <ENTER> push-button has to be pressed. After this confirmation,
the opened window or list is closed. In order to ignore any changes made in the opened window or list
the user has to press the <ESC> push-button.
SETUP list
9.1 Setting the language of the user interface - LANGUAGE
The LANGUAGE enables one to select the language of the user interface. In order to enter the list
one has to press the <ENTER> push-button on the inversely displayed LANGUAGE text of the SETUP
list. The selection is made by placing a special character by means of the <>, <> push-buttons
in the line with the selected language. Pressing the <SHIFT> and <> (or <SHIFT> and <>) pushbuttons results in a movement to the first position of the opened list and pressing the <SHIFT> and <>
(or <SHIFT> and <>) – results in a movement to the last position of the opened list. The selection
is confirmed and the list is closed after pressing the <ENTER> push-button. The list is closed without any
confirmation after pressing the <ESC> push-button.
SETUP list; the LANGUAGE text highlighted (displayed inversely)
Language windows with all available languages
Displays with the English version of the user interface
Displays with the Italian version of the user interface
9-2
SVAN 956 USER MANUAL
Displays with the Polish version of the user interface
Displays with the Hungarian version of the user interface
Displays with the Flemish version of the user interface
Displays with the French version of the user interface
Displays with the Spanish version of the user interface
Displays with the German version of the user interface
Displays with the Turkish version of the user interface
For activation of the Russian version of the user interface, the special code has to be entered.
9-3
SVAN 956 USER MANUAL
_
Displays during the entering of the access code to the Russian version of the user interface
Displays with the Russian version of the user interface available only on some markets
9.2 Return to the factory settings - CLEAR SETUP
The CLEAR SETUP enables the user to return to the default set up of the instrument.
In order to enter the position the user has to select the CLEAR SETUP text in the SETUP list, using
the <>, <> (or <>, <>) push-buttons and press the <ENTER>.
SETUP list; the CLEAR SETUP text highlighted (displayed inversely)
After entering this position, the request for the confirmation is displayed. The proper answer
for the request is selected by means of the <>, <> push-buttons. The instrument returns to the default
set up after pressing the <ENTER> push-button in the case when the answer YES was chosen.
Displays with the request for the confirmation for the CLEAR SETUP execution
During the clearing process the message WAIT... is displayed. The following message is displayed
after the return to the default settings and the instrument waits for the user’s reaction.
Displays during and after the execution of the CLEAR SETUP function
The window is closed and the instrument returns to the SETUP list after pressing any push-button
with an exception of the <SHIFT> and the <ALT> one.
9-4
SVAN 956 USER MANUAL
9.3 Setting parameters of the Ext. I/O port - EXTERNAL I/O SETUP
The EXTERNAL I/O SETUP enables the user to select the available functionality of the Ext. I/O
port. In order to enter the window the user has to select the EXTERNAL I/O SETUP text in the SETUP
list, using the <>, <> (or <>, <>) push-buttons and press the <ENTER> one.
SETUP list, the EXTERNAL I/O SETUP text highlighted
In order to select a value in a position of the sub-list the <>, <> should be pressed.
The position of the sub-list is changed after pressing the <>, <> push-buttons. In order to confirm
the selection the <ENTER> push-button has to be pressed. Such pressing closes the sub-list.
After pressing the <ESC> push-button the sub-list is also closed but all changes, which were made, are
ignored.
9.3.1 Mode selection of the Ext. I/O port - MODE
In the MODE, it is possible to select the function of the instrument’s socket named as Ext. I/O.
This socket can be used as
• the output of the analogue signal (ANALOG OUT) transmitted from the input of the instrument
to its output without any digital processing (i.e. filtering),
• the input of the digital signal used as an external trigger to start the measurements (DIGITAL IN)
in the “slave” instrument,
• the digital output (DIGITAL OUT) used for triggering other “slave” instrument from the “master” one,
• the source of any alarm signal in the case of certain circumstances occurred during the measurements
(i.e. the level of the input signal was higher than selected one).
The more detailed description of the Ext. I/O is given in App. C.
To select the mode, the user has to use the <>, <> push-buttons in the line with the MODE text.
The window is closed and the instrument returns to the SETUP list after pressing the <ENTER>
(with the confirmation of all changes made there) or <ESC> push-buttons (ignoring all changes).
EXTERNAL I/O SETUP windows; the MODE selection
In the case of ANALOG OUT selection there are two options DIRECT and D/A (Digital/Analog).
To select the option the user has to place a special character in the line with the option’s name using <>,
<> and <>, <> push-buttons. In the case of D/A option the SOURCE position appears on the
display. The available sources are as follows: A, C, Z, R1, R2, R3, 1 Hz, 2 Hz, ..., 20kHz. The selection of
the SOURCE is made by means of <>, <> push-buttons and pressing <ENTER>.
EXTERNAL I/O SETUP windows; D/A selection
9-5
SVAN 956 USER MANUAL
_
..
EXTERNAL I/O SETUP windows; the source selection for D/A option
In the case of DIGITAL IN selection the signal appearing on the I/O socket will be treated
as the external trigger if the EXT. I/O is chosen (path: MENU / INPUT / TRIGGER SETUP /
MEASURE TRIGGER / SOURCE / EXT. I/O) and it can be set only if SLOPE + or SLOPE – was set as a
TRIGGER (path: MENU / INPUT / TRIGGER SETUP / MEASURE TRIGGER / TRIGGER).
MEASURE TRIGGER windows; the EXT. I/O selection
9.3.2 Digital output function selection of the I/O socket - FUNCTION
In the FUNCTION, it is possible to set the function of the digital output of the I/O instrument’s
socket. The socket can be used as the source of the trigger pulse (TRIG. PULSE) which starts the
measurement in another “slave” instrument linked to the “master” one or the alarm signal which appears
there after fulfilling certain measurement conditions (ALARM PULSE).
In order to select the function of the digital output the user has to use the <>, <> push-buttons in
the active line with the FUNCTION text. The window is closed and the instrument returns to the SETUP
list after pressing the <ENTER> (with the confirmation of all changes made there) or <ESC> push-buttons
(ignoring all changes).
EXTERNAL I/O SETUP windows; the FUNCTION selection
9.3.3 Polarisation selection of the digital output signal - POLARISATION
In the POLARISATION, it is possible to select which polarisation of the signal (negative or positive)
will be valid.
9-6
SVAN 956 USER MANUAL
In order to select the polarisation the user has to use the <>, <> push-buttons in the active line
with the POLARISATION text. The window is closed and the instrument returns to the SETUP list after
pressing the <ENTER> (with the confirmation of all changes made there) or <ESC> push-buttons
(ignoring all changes).
EXTERNAL I/O SETUP windows; the POLARISATION selection
9.3.4 Active level selection of the digital output signal - ACTIVE LEVEL
In the ACTIVE LEVEL, it is possible to select which level of the signal should be treated as a valid
one (“negative” or “positive” logic).
In order to select the level the user has to use the <>, <> push-buttons in the active line
with the ACTIVE LEVEL text. The window is closed and the instrument returns to the SETUP list
after pressing the <ENTER> (with the confirmation of all changes made there) or <ESC> push-buttons
(ignoring all changes).
EXTERNAL I/O SETUP windows; the ACTIVE LEVEL selection
9.3.5 Source signal selection for the alarm pulse generation - SOURCE
In the SOURCE, it is possible to select the measurement result which level should be checked.
If the measured result level is greater than selected alarm level – the instrument will generate alarm signal
on the I/O socket. The measurement results from the first profile: PEAK(1) or RMS(1) can be used for the
purpose described above.
In order to select the function of the digital output the user has to use the <>, <> push-buttons in
the active line with the SOURCE text. The window is closed and the instrument returns to the SETUP list
after pressing the <ENTER> (with the confirmation of all changes made there) or <ESC> push-buttons
(ignoring all changes).
EXTERNAL I/O SETUP windows; the SOURCE selection
9.3.6 Alarm level selection on the digital output of I/O - ALARM LEVEL
In the ALARM LEVEL, it is possible to set the level of the result to be monitored during
the measurements. If the result is greater than the one set in this line, the instrument will generate
the alarm signal in the selected logic. The available levels are within the range [30.0 dB, 140 dB].
9-7
SVAN 956 USER MANUAL
_
The ALARM LEVEL current value decreasing / increasing by 0.1 dB is possible by means
of the <>/ <>push-buttons. The step can be decreased / increased up to 1 dB after pressing
simultaneously the <>/ <> push-buttons with the <SHIFT> one. The window is closed and
the instrument returns to the SETUP list after pressing the <ENTER> (with the confirmation of all changes
made in the window) or <ESC> push-buttons (ignoring all changes).
EXTERNAL I/O SETUP windows; the ALARM LEVEL setting
9.4 Activation of human vibration filters - HUMAN VIB. FILT.
In the HUMAN VIBR. FILT. it is possible to activate the human vibration filters (Wk, Wd, Wc, Wj,
Wm, Wh, Wg, Wb), which are not included in the standard set of the instrument. This option can be
bought together with the instrument or can be purchased by the user in the future. In the latter case, after
selecting the HUMAN VIB. FILT. text in the SETUP list (in vibration modes), using the <>, <> (or <>,
<>) push-buttons, and pressing <ENTER>, the user has to introduce special code for activation of the
function. After successful activation the HUMAN VIBRATION filters, this text does not appear on the
SETUP list any more and the instrument never more asks for the code.
SETUP list, the HUMAN VIB. text highlighted (displayed inversely)
Displays during the entering of the access code to a function
9.5 Selection of the current IEPE supply - IEPE CURRENT
The IEPE CURRENT enables the user to choose current IEPE supply.
In order to enter the window the user has to select the IEPE CURRENT text in the SETUP list,
using the <>, <> (or <>, <>) push-buttons and press the <ENTER> one.
SETUP list, the IEPE CURRENT text highlighted (displayed inversely)
9-8
SVAN 956 USER MANUAL
Two options are available: 1.5 mA and 4.5 mA. The selection is made by placing a special
character in the required position by means of the <>, <> (or <>, <>) push-buttons. The window is
closed and the instrument returns to the SETUP list after pressing the <ENTER> (with the confirmation of
a change made in the position) or <ESC> push-buttons (ignoring a change made in the position).
IEPE CURRENT windows; the IEPE supply selection
9.6 Reference signal in vibration measurements - REFERENCE LEVELS
The REFERENCE LEVELS sub-list enables the user to set the reference level of the vibration
signal. The values, which are set here, are taken into account during the calculations of the measurement
results expressed in the logarithmic scale (with the dB as the units).
In order to enter the position the user has to select the REFERENCE LEVELS text in the SETUP
list, using the <>, <> (or <>, <>) push-buttons and press the <ENTER> one. The selection
of a parameter which level has to be set is done by means of the <>, <> push-buttons.
SETUP list, the REFERENCE LEVELS text highlighted (displayed inversely)
9.6.1 Setting the reference level of the acceleration signal - ACC
In the ACC position the user can set the reference level of the acceleration signal. It is possible
-2
-2
-2
to set this level from 1 µms to 100 µms with 1 µms step pressing the <>, <> push-buttons.
-2
The step can be increased to 10 µms pressing the <SHIFT> with the <>, <> push-buttons.
In order to confirm the setting the <ENTER> push-button has to be pressed. Such pressing closes
the sub-list. After pressing the <ESC> push-button the sub-list is also closed but all changes, which were
made, are ignored.
REFERENCE LEVELS windows; the reference level setting of acceleration signal
9.6.2 Setting the reference level of the velocity signal - VEL
In the VEL position, the user can set the reference level of the velocity signal. It is possible to set
-1
-1
-1
this level from 1 nms to 100 nms with 1 nms step pressing the <>, <> push-buttons. The step can
-1
be increased to 10 nms pressing the <SHIFT> with the <>, <> push-buttons.
9-9
SVAN 956 USER MANUAL
_
In order to confirm the setting the <ENTER> push-button has to be pressed. Such pressing closes
the sub-list. After pressing the <ESC> push-button the sub-list is also closed but all changes, which were
made, are ignored.
REFERENCE LEVEL windows; setting the reference level of velocity signal
9.6.3 Setting the reference level of the displacement signal - DIL
In the DIL position, the user can set the reference level of the displacement signal. It is possible
to set this level from 1 pm to 100 pm with 1 pm step pressing the <>, <> push-buttons. The step can
be increased to 10 pm pressing the <SHIFT> with the <>, <> push-buttons.
In order to confirm the setting the <ENTER> push-button has to be pressed. Such pressing closes
the sub-list. After pressing the <ESC> push-button the sub-list is also closed but all changes, which were
made, are ignored.
REFERENCE LEVELS windows; setting the reference level of displacement signal
9.7 Parameters of remote communication - REMOTE COMMUNICATION
The REMOTE COMMUNICATION enables the user to select the type and set the packet size
of the packet communication.
In order to enter the position the user has to select the REMOTE COMMUNICATION text in the
SETUP list, using the <>, <> (or <>, <>) push-buttons and press the <ENTER>.
SETUP list, the REMOTE COMMUNICATION text highlighted (displayed inversely)
9.7.1 Selecting the type of remote communication - TYPE
The TYPE enables the user to select the type of the REMOTE COMMUNICATION. Three options
are available: Off, CONTINUOUS and PACKET. The selection of the required option is made by <>,
<> push-buttons. The confirmation is made by pressing <ENTER> push button.
REMOTE COMMUNICATION windows; the TYPE selection
9-10
SVAN 956 USER MANUAL
9.7.2 Setting the packet size of the remote communication - PACKET
In the case of the PACKET type it is possible to select the packet size. The available options are
1024, 512, 256, 128 and 64. The selection is made by the <>, <> push-buttons. The confirmation
is made by pressing the <ENTER> push button.
REMOTE COMMUNICATION windows; packet size selection
9.8 Detector’s type selection in the RMS calculations - RMS INTEGRATION
The RMS INTEGRATION enables the user to select the detector type for the calculations
of the RMS function.
In order to enter the position the user has to select the RMS INTEGRATION text in the SETUP list,
using the <>, <> (or <>, <>) push-buttons and press the <ENTER>.
SETUP list with the RMS INTEGRATION text highlighted (displayed inversely)
Two options are available: LINEAR and EXPONENTIAL. The required parameter can be selected
by means of the <>, <> (or <>, <>) push-buttons. The window is closed and the instrument returns
to the SETUP list after pressing the <ENTER> (with the confirmation of a change made
in the position) or <ESC> push-buttons (ignoring a change made in the position).
Displays and with the available options of the RMS INTEGRATION
The formulae used for the RMS calculation are given in Appendix D. Setting LINEAR is required
for getting the true RMS value of the measured signal. When this option is selected the value of the RMS
function do not depend on the detector time constant: 100ms, 125ms, 200ms, 500ms, 1.0s, 2.0s, 5.0s,
10.0s. In this case, the indicator Lin. (or L) is displayed in the different modes of the result presentation.
Setting EXPONENTIAL enables the user to fulfil the requirements of another standard for the RMS
measurements. When this option is selected the value of the RMS function depends on the detector time
constant (the results are displayed with the indicator of the detectors selected in the profiles (path: MENU
/ INPUT / PROFILE x / DETECTOR: 100ms, 125ms, 200ms, 500ms, 1.0s, 2.0s, 5.0s, 10.0s).
9-11
SVAN 956 USER MANUAL
_
9.9 Activation of RPM measurement function - RPM MEASUREMENT
The RPM MEASUREMENT (RPM - Revolutions Per Minute) position enables the user to activate
the RPM measurement function, which is not included in the standard set of the instrument. It can be
bought together with the instrument or can be purchased by the user in the future. In the latter case, after
selecting the RPM MEASUREMENT text in the SETUP list, using the <>, <> (or <>, <>) pushbuttons, and pressing <ENTER>, the user has to introduce special code for activation of the function.
After successful activation the RPM MEASUREMENT, this text does not appear on the SETUP list any
more (RMP position appears then in the INPUT list) and the instrument never more asks for the code.
SETUP list, the RPM MEASUREMENT text highlighted (displayed inversely)
Displays during the entering of the access code to a function
INPUT list after activation of the RPM MEASUREMENT function
9.10 Setting the parameters of the serial interface - RS232
The RS232 enables the user to programme the RS 232 interface transmission speed
(BAUD RATE) and to set the time limit before which the interface operation should be performed
(TIME OUT). In order to enter the position the user has to select the RS232 text in the SETUP list, using
the <>, <> (or <>, <>) push-buttons and press the <ENTER>.
SETUP list, the RS232 text highlighted (displayed inversely)
9.10.1 Setting the transmission speed of the serial interface - BAUD RATE
The RS 232 interface transmission (BAUD RATE) speed can be selected from the following
available values: 1200 (bits / second), 2400 (bits / s), 4800 (bits / s), 9600 (bits / s), 19200 (bits / s),
38000 (bits / s), 57600 (bits / s) or 115200 (bits / s). The selection is made by means of the <>, <>
push-buttons.
9-12
SVAN 956 USER MANUAL
The other RS 232 transmission parameters are fixed to 8 bits for data, No parity & 1 Stop bit.
The selected value has to be confirmed by pressing the <ENTER> push-button, which causes
the simultaneous return to the SETUP list. All settings are ignored after the return to the SETUP list
by pressing the <ESC> push-button.
RS232 windows; the possible settings of the BAUD RATE
9.10.2 Setting time limit for the performance of serial interface operation - TIME OUT
The TIME OUT value shown in the inversely displayed line is increased or decreased by one
with each pressing the <>, <> push-buttons. The step is increased / decreased to ten after pressing
the <>, <> push-buttons together with the <SHIFT> one. The default value of this parameter is equal
to one but it can be too short period for the printers, which are not too fast. In such case, the TIME OUT
parameter has to be increased. The window is closed and the instrument returns to the SETUP list
after pressing the <ENTER> (with the confirmation of all changes made in the window) or <ESC> pushbuttons (ignoring all changes made there).
RS232 window; the setting of the TIME OUT with 1-second step
...
RS232 window; the setting of the TIME OUT with 10-seconds step
9.11 Programming the instrument’s internal Real Time Clock - RTC
The RTC enables one to programme the internal Real Time Clock. This clock is displayed
in the different places depending on the selected presentation mode. In order to enter the position
the user has to select the RTC text in the SETUP list, using the <>, <> (or <>, <>) push-buttons
and press the <ENTER> one.
SETUP list, the RTC text highlighted (displayed inversely)
9-13
SVAN 956 USER MANUAL
_
The selection of the setting parameter (hour, minute, second, day, month and year) is performed
using the <>, <> push-buttons and the change of its value – using the <>, <> push-buttons pressed
together with the <SHIFT>.
RTC windows with the different parameters to be set
Notice: The new value of a parameter is confirmed after each pressing of the <> or <>
together with the <SHIFT> push-buttons (new value is selected without any confirmation from
the <ENTER> push-button).
The window is closed and the instrument returns to the SETUP list after pressing the <ENTER> or
<ESC> push-button.
9.12 Selection of few push-buttons mode - SHIFT MODE
The SHIFT MODE enables the user to programme the operation mode of the <SHIFT>, <ALT> and
<START / STOP> push-buttons.
In order to enter the position the user has to select the SHIFT MODE text in the SETUP list,
using the <>, <> (or <>, <>) push-buttons and press the <ENTER> one. The selection
of a parameter in both positions is done by means of the <>, <> push-buttons and confirmed
by the <ENTER> one. Any changes made in the window are not confirmed in the case of pressing
the <ESC> push-button but the window is closed.
SETUP list, the SHIFT MODE text highlighted (displayed inversely)
9.12.1 <SHIFT> / <ALT> push-button working mode selection - SHIFT
In the SHIFT, the user can choose between 2nd Fun. and Shift. When the Shift text is selected,
the <SHIFT> and <ALT> push-buttons operates as in the keyboard of a computer – in order to achieve
the desired result, the second push-button has to be pressed in conjunction with the <SHIFT>/<ALT>
one. When the 2nd Fun. text is selected the <SHIFT>/<ALT> push-button operates in the sequence
with the other one.
In order to select a desired mode of the <SHIFT> push-button the <>, <> should be pressed.
In order to confirm the selection the <ENTER> push-button has to be pressed. Such pressing closes
9-14
SVAN 956 USER MANUAL
the sub-list. After pressing the <ESC> push-button the sub-list is also closed but all changes,
which were made, are ignored.
SHIFT MODE windows; the available SHIFT settings
9.12.2 <START / STOP> push-button working mode selection - ST/SP
In the ST/SP the user can choose between Normal and Inverse. When the Normal text is selected
the instrument reacts on each of the <START / STOP> push-button pressing, starting or stopping
the measurements.
When the Inverse text is selected the <START / STOP> push-button operates in conjunction or
in a sequence with the <SHIFT> one. The measurements are started or stopped after pressing both pushbuttons.
In order to select a desired mode of the <START / STOP> push-button the <>, <> should
be pressed. In order to confirm the selection the <ENTER> push-button has to be pressed. Such pressing
closes the sub-list. After pressing the <ESC> push-button the sub-list is also closed but all changes, which
were made, are ignored.
SHIFT MODE windows; the available ST/SP settings
9.13 Activation of the signal generation option - SIGNAL GENERATOR
The SIGNAL GENERATOR position enables the user to activate the built-in signal generator.
This function is under development.
In order to enter the sub-list the user has to select the SIGNAL GENERATOR text in the SETUP
list, using the <>, <> (or <>, <>) push-buttons and press the <ENTER> one.
SETUP list, the SIGNAL GENERATOR selected (highlighted inversely)
Display in the opened SIGNAL GENERATOR window
9-15
SVAN 956 USER MANUAL
_
9.14 Programming the instrument’s internal timer - TIMER
The TIMER enables one to programme the internal timer. The instrument can be switched on
by itself in the programmed time and it can perform the measurements using the setup, which was used
before its switching off.
The selection of the parameter to be set is performed using the <>, <> and the change of its
value – using the <>, <> push-buttons pressed together with the <SHIFT>.
In order to enter the position the user has to select the TIMER text in the SETUP list (using
the <>, <> or <>, <> push-buttons) and press the <ENTER> one.
SETUP list, the TIMER text highlighted (displayed inversely)
9.14.1 Selecting the mode of the timer function - MODE
The MODE of the timer function is selected pressing the <>, <> push-buttons when the MODE
text is displayed inversely in the TIMER sub-list.
The timer can be switched off – Off, switched on only once – SINGLE, switched on many times
regularly – REGULAR with the period between two consecutive measurements set in the REPETITION
line or switched on up to four times, not regularly – IRREGULAR in the time set in the TIMEx positions.
The selected value has to be confirmed by pressing the <ENTER> push-button, which causes
the simultaneous return to the SETUP list. All settings are ignored after the return to the SETUP list
by pressing the <ESC> push-button.
In the case the timer function is active (SINGLE, REGULAR or IRREGULAR) the clock icon starts
blinking up to switching timer function off or up to finishing programmed measurements.
TIMER windows; the mode selection
9.14.2 Setting day of the instrument’s switch on - START DAY
The START DAY determines the date of the measurement start. The timer can be programmed up
to one month ahead and during the date setting the current state of the Real Time Clock is taken
into account.
The required date can be selected pressing the <>, <> push-buttons when the START DAY text
is displayed inversely in the TIMER sub-list.
The selected value has to be confirmed by pressing the <ENTER> push-button, which causes
the simultaneous return to the SETUP list. All settings are ignored after the return to the SETUP list
by pressing the <ESC> push-button.
9-16
SVAN 956 USER MANUAL
...
TIMER windows; setting day of the instrument’s switch on
9.14.3 Setting hour of the instrument’s switch on - START HOUR
The START HOUR determines hour of the measurement start. The required hour can be selected
pressing the <>, <> push-buttons when the START HOUR text is displayed inversely in the TIMER
sub-list.
In order to set minutes one has to enter their position pressing the <>, <> pushbuttons and then
pressing the <>, <> push-buttons to select the proper value. The selected value has to be confirmed
by pressing the <ENTER> push-button, which causes the simultaneous return to the SETUP list. All
settings are ignored after the return to the SETUP list by pressing the <ESC> push-button.
TIMER windows; setting hour and minute of the instrument’s switch on
9.14.4 Selecting the start hours for four irregular automatic measurements - TIMEx
The TIMEx (TIME1, TIME2, TIME3, TIME4) is used to determine four irregular automatic starts
of the measurements. The required hour can be selected pressing the <>, <> push-buttons when
the TIMEx text is displayed inversely in the TIMER sub-list (mode IRREGULAR).
In order to set minutes one has to enter the proper line pressing the <>, <> push-buttons and
then pressing the <>, <> push-buttons to select the proper value. The selected value has to be
confirmed by pressing the <ENTER> push-button, which causes the simultaneous return to the SETUP
list. All settings are ignored after the return to the SETUP list by pressing the <ESC> push-button.
9.14.5 Selecting the period between two consecutive measurements - REPETITION
The REPETITION of the timer function is selected pressing the <>, <> push-buttons when
the REPETITION text is displayed inversely in the TIMER sub-list (mode REGULAR). This parameter can
be programmed from 00:00 up to 99:59.
9-17
SVAN 956 USER MANUAL
_
In order to set the proper value one has to select hours or minutes pressing the <>, <> pushbuttons and then, pressing the <>, <> push-buttons, to select the proper value. The selected value has
to be confirmed by pressing the <ENTER> push-button, which causes the simultaneous return to
the SETUP list. All settings are ignored after the return to the SETUP list by pressing the <ESC> pushbutton.
TIMER windows; setting REPETITION parameter
9.14.6 Description of the exemplary timer function execution
The TIMER function is used to programme the instrument’s switch on at the given time and perform
the measurements with the parameters set in the INPUT sub-list. Let us assume that the user wants to
st
switch on the instrument the 1 of February, at 13:25, measure vibration during 10 seconds without using
logger and save the results in a file @RES2.
In order to do this the user has to set the parameters of the TIMER function (path: MENU / SETUP /
TIMER), the measurement parameters (path: MENU / INPUT / MEASUREMENT SETUP), activate
the AUTO SAVE function (path: MENU / FILE / SAVE OPTIONS), name the file (the FILE NAME window
is opened after switching on the AUTO SAVE function) and finally – switch off the instrument.
Exemplary settings made for the desired execution of the TIMER function
st
The instrument will be switched on the 1 of February at 13:25 and will be warmed up
for the period of 60 seconds decrementing by one after each second the counter visible on the display.
Counting down during the warming up of the instrument after switching it on
After warming up the instrument and the preset DELAY time, the measurements are performed
for a period of ten seconds. Then, the results are saved in the file which name was given or accepted
(the proper information is displayed) and finally – the instrument is switched off.
Displays during the executing of the TIMER function (timer icon is active)
9-18
SVAN 956 USER MANUAL
Notice: The instrument’s TIMER function can be used for multiply measurements
(at the programmed day and time with the selected repetition). The first switch on of the instrument must
be within one month ahead.
9.15 Selection the USB–HOST port functionality - USB–HOST PORT
The USB–HOST PORT enables one to programme the functionality of the instrument’s socket
named USB Host.
In order to enter the position the user has to select the USB–HOST PORT text in the SETUP list,
using the <>, <> (or <>, <>) push-buttons and press the <ENTER> one.
SETUP list, the USB–HOST PORT text highlighted (displayed inversely)
The socket USB Host can be used to serve as the input of the different interfaces: RS 232 or USB.
The RS 232 interface in the SVAN 95x instrument is available as a hardware option (a special interface,
named as the SV 55, with a dedicated microprocessor has to be attached to the socket USB Host).
The RS232 is the default setting in this window. Only in this option the USB host controller is awaken and
the power consumption is the lower one. An error occurs in the case of the connection to the socket
the peripheral device of the different type than the selected one.
Displays in the USB–HOST PORT
The selection of the socket’s functionality is made with the <>, <> (or <>, <>) push-buttons
which moves the special character between the available options. The selection is confirmed
after pressing the <ENTER> push-button which closes the window and returns to the SETUP list.
The return to this list is also possible after pressing the <ESC> push-button but the selection is not
confirmed. In order to activate IrDA, SRT RECORDING, WAVE RECORDING or EVENT RECORDING
the user has to introduce a special code.
Displays during the entering of the access code to SRT RECORDING, WAVE RECORDING or
EVENT RECORDING
9-19
SVAN 956 USER MANUAL
_
The USB host interface can be used to control the external USB memory disk (USB DISK,
SRT RECORDING, WAVE RECORDING, EVENT RECORDING) with the FAT16 or FAT32 file systems
or IrDA (Infrared Data Association) interface (USB IrDA) based on the dedicated circuit STIr4200.
Notice: The converter SV 55 serves as the RS 232 interface. The SV 55 connection
to the USB Host socket is detected and after successful detection the headphone icon is switched on.
The transmission using the SV 55 is possible only in the case when the instrument is not connected
to a PC with the USB Device port.
Notice: The connection to the USB Host socket the USB disk switches off the instrument’s
internal flash memory. All file functions and remote commands are redirected to the USB disk.
The internal flash memory is activated after disconnecting USB disk and the instrument.
After the USB DISK, SRT RECORDING, WAVE RECORDING or EVENT RECORDING selection,
the device connected to that socket is recognised. The warning appears on the display after the
connection of the unknown device.
In the case, the device declares the current consumption greater than 200 mA the dedicated
warning is presented.
In the case, the current consumption is greater than 250 mA the connected USB disk is switched
off and special warning is displayed.
In other cases, the connected USB disk is initiated and the free space is determined.
Displays with the different USB disk warnings
This operation can last up to few minutes depending on the disk’s capacity. The detection
of the USB DISK is signalised by the paper sheet icon (at the display’s left corner). Next, the file’s
directory should be determined (path: MENU / FILE / DIRECTORY). This directory can be created
in the instrument or already existing one in the disk is selected.
The FREE SPACE denotes the available free memory on the connected disk.
st
The DIR NO. shows the number of the selected directory (the 1 number) and the number
nd
of the existing directories (the 2 number). In the case the directories do not exist, these numbers
are equal to zero.
st
The DIR NAME enables one to edit the directory name (the 1 number) or displays its name.
The help lines are placed at the display’s bottom.
There are two ways of the current directory selection:
• the name edition in the DIR NAME line. The default name consists of the day number and the month
abbreviation. The not existing directory will be created.
• the selection of the existing directory by means of the <>, <> push-buttons pressed in the line
with the DIR NO. text. The name of the selected directory is displayed in the DIR NAME line.
The selection is confirmed after pressing the <ENTER> push-button which closes the window and
returns to the FILE list. The return to this list is also possible after pressing the <ESC> push-button but the
9-20
SVAN 956 USER MANUAL
selection is not confirmed. The selection of the directory is obligatory during the initialisation process. In
this case also the <ESC> push-button confirms the settings.
Contents of the DIRECTORY window
In the case of the TIMER function, the directory selection is skipped and the default one is created.
The usage of the USB disk modifies a few windows and lists. First of all, the described above
DIRECTORY window and COPY FILES TO USB, MOVE FILES TO USB windows appear in the FILE list.
Additionally, in some places concerning the file management the info about the name of the current USB
disk directory is displayed in the upper line: DIRECTORY: the name of the current directory.
These places are as follows: DISPLAY / LOGGER VIEW, FILE / LOAD, FILE / DELETE /
RESULT FILES,
FILE / DELETE / LOGGER FILES,
FILE / DELETE / SETUP FILES,
FILE /
CATALOGUE, FILE / LOAD SETUP.
The usage of the USB disk modifies also the execution of a few functions, namely:
• the DEFRAGMENTATON is not executed,
• the REAL TIME transmission is stopped,
• the remote file writing using the #9 function is not available
• in the FILE / FREE SPACE window the free space and the total capacity of the USB disk are given,
• in the file report the name of the current directory of the USB disk is added,
• the USB disk memory is not divided between the files and the logger, so the free space concerns both:
logger and file memory.
The USB disk can be disconnected when the measurements are not performed and the results
are presented. The internal instrument’s flash memory is initialised after switching off the USB disk.
In the USB disk that is divided into partitions its first partition has to serve FAT32 or FAT16 file
system. Only short name file (up to 8 characters, similar to DOS system) is implemented. The existing
longer names are shortened.
Notice: The disconnection of the USB disk during the data transmission can cause the lost
of data saved in the USB disk as well as in the instrument’s internal flash.
The IrDA is the wireless interface used for the communication between the instrument and a PC.
The connection of the IrDA converter results in displaying the info window and switching on the paper
sheet icon (at the left side of the upper line).
In the case of the unsuitable settings in the USB HOST PORT window or connecting wrong device
another info window is displayed.
The transmission parameters are selected automatically during the negotiation process. The fastest
available speed equals to 115 200 kb/s. In this case, the real speed is not bigger than 1.5 kB/s. The IrDA
programming is based on a virtual COM port emulation in a PC.
Displays during the IrDA interface connection
9-21
SVAN 956 USER MANUAL
_
9.16 Setting the coefficients of the user filters - USER FILTERS
The USER FILTERS position enables the user to introduce the values of the coefficients of the user
filters.
In order to enter the position the user has to select the USER FILTERS text in the SETUP list,
using the <>, <> (or <>, <>) push-buttons and press the <ENTER>. The USER FILTERS sub-list
contains two positions: REAL TIME FILTERS and SPECTRUM BASED FILTERS.
SETUP list, the USER FILTERS text highlighted (displayed inversely)
USER FILTERS windows, REAL TIME FILTERS selected (a), SPECTRUM BASED FILTERS selected (b)
9.16.1 Introduction the parameters of real time filters - REAL TIME FILTERS
The REAL TIME FILTERS sub-list enables the user to introduce the values of the correcting
coefficients taken into account in the real time measurements.
In order to enter this sub-list the user has to select the REAL TIME FILTERS text
in the USER FILTERS list, using the <>, <> (or <>, <>) push-buttons and press the <ENTER>.
After pressing <ENTER> push-button the window for entering the access code to an option is opened (in
the first essay of its execution).
The REAL TIME FILTERS (sub-list) contains 3 positions: R1, R2, R3.
USER FILTERS windows, REAL TIME FILTERS selected
Displays during the entering of the access code to REAL TIME FILTERS
9.16.1.1 Selecting real time filter - Rx
The selection of the filter is made by means of the <>, <> (or <>, <>) push-buttons.
The confirmation is made after pressing <ENTER> push button. The return to the USER FILTERS
window ignoring any changes made in the sub-list is made after pressing the <ESC> push-button.
9-22
SVAN 956 USER MANUAL
REAL TIME FILTERS windows, the filter selection
In Rx (R1, R2, R3) window there are three positions: TYPE, LFC(3dB), HFC(3dB). The selection of
the position is made by means of <>, <> push-buttons.
In order to confirm the selection the user has to press <ENTER> push button.
In the TYPE position there are three options: HIGHPASS, BANDPASS and LOWPASS denoting
the type of the digital filter, which has to be designed and implemented. All mentioned above filters, highpass, band-pass and low-pass, are the second order, which means that the slope is equal to
12 dB/octave. The selection of the option is made with <>, <> push-buttons. The confirmation is made
after pressing <ENTER> push-button. The return to the REAL TIME FILTERS list ignoring any changes
made in the sub-list is made after pressing the <ESC> push-button.
R1 filter windows, the TYPE selection
In the case of a low-pass filter the user has to determine the HFC(3dB) parameter which denotes
the HFC (High Frequency Corner) of the Rx filter at which the amplitude of the input signal is attenuated
two times. The available values are from 100 Hz to 10.0 kHz.
The selection of the required value is made with <>, <> push-button (pressing <> or <>pushbutton with the <SHIFT> one increases the step 20 times). The confirmation is made by pressing
<ENTER>. The return to the REAL TIME FILTERS list ignoring any changes made in the sub-list is made
after pressing the <ESC> push-button.
R1 filter windows, the HFC(3dB) selection for a LOWPASS filter
In the case of a high-pass filter the user has to determine the LFC(3dB) parameter, which denotes
the LFC (Low Frequency Corner) of the Rx filter at which the amplitude of the input signal is attenuated
two times. The available values of the LFC are from 10 Hz to 10.0 kHz.
The selection of the required value is made with <>, <> push-button (pressing <> or <>pushbutton with the <SHIFT> one increases the step 20 times). The confirmation is made by pressing
<ENTER>. The return to the REAL TIME FILTERS list ignoring any changes made in the sub-list is made
after pressing the <ESC> push-button.
R1 filter windows, the LFC(3dB) selection for a HIGHPASS filter
9-23
SVAN 956 USER MANUAL
_
In the case of a band-pass filter, the user has to determine two frequencies: the LFC(3dB) which
denotes the (Low Frequency Corner) and the HFC(3dB) of the Rx filter. At these frequencies,
the amplitude of the input signal is attenuated two times. The available values of the LFC are from 10 Hz
to 10.0 kHz, while the HFC the available values are from 100 Hz to 10.00 kHz. The selection
of the parameter is made by pressing <>, <> push-buttons (pressing <> or <> push-button
with the <SHIFT> one increases the step 20 times). The confirmation is made by pressing <ENTER>.
The return to the REAL TIME FILTERS list ignoring any changes made in the sub-list is made after
pressing the <ESC> push-button.
R1 filter windows, the LFC(3dB) selection and the HFC(3dB) selection for BANDPASS filter
9.16.2 Setting filter coefficients for octave analysis - SPECTRUM BASED FILTERS
The SPECTRUM BASED FILTERS sub-list enables the user to introduce the values of the filter
coefficients correcting the results of 1/1 OCTAVE or 1/3 OCTAVE analysis. The results of the analysis
(the TOTAL values) can be modified by the introduced factors.
In order to enter the sub-list the user has to select the USER FILTERS text in the SETUP list, using
the <>, <> (or <>, <>) push-buttons and press the <ENTER>. The USER FILTERS (sub-list)
contains 3 sub-lists: VIEW, EDIT and CLEAR.
USER FILTERS windows, SPECTRUM BASED FILTERS selected
9.16.2.1 Looking at the coefficients of the user filters set - VIEW
The VIEW sub-list enables one to look at the coefficients of the USER FILTERS sets saved
in the instrument under the names S1, S2, S3. The coefficients can be set by the user in the instrument
by means of the EDIT option or sent to it (together with the name) by means of the interface using #6
function (cf. App. A for the description).
In order to enter the sub-list the user has to select in the SPECTRUM BASED FILTER sub-list
the VIEW text, using the <>, <> (or <>, <>) push-buttons and press the <ENTER>. In the VIEW
window one can select one of three mentioned above filters (S1, S2 and S3). The selection of the filter
in this sub-list is performed by means of the <>, <> push-buttons.
9-24
SVAN 956 USER MANUAL
SPECTRUM BASED FILTERS window, the VIEW text highlighted
The sub-list is closed and the instrument returns to the USER FILTERS sub-list after pressing
the <ESC> push-button (ignoring a change made in the position).
VIEW windows, the filter selection
After pressing the <ENTER> push-button on the displayed inversely text the proper sub-list is
opened containing the values of the coefficients for all SPECTRUM BASED 1/1 OCTAVE and
1/3 OCTAVE filters. It is not possible to change the values. The selection of the displayed coefficients
in the selected filter is performed by means of the <>, <> push-buttons.
S1 filter windows
9.16.2.2 Setting the coefficients of the user filters set - EDIT
The EDIT sub-list enables the user to select which filters should be edited; the available options are
as follows: S1, S2, S3 or any other transmitted to the instrument from a PC by means of the interface.
In order to enter the sub-list the user has to select the EDIT text in the SPECTRUM BASED FILTER sublist, using the <>, <> (or <>, <>) push-buttons and press the <ENTER>.
SPECTRUM BASED FILTERS window, the EDIT text highlighted
The selection of the position in this sub-list is performed by means of the <>, <> push-buttons.
After pressing the <ENTER> push-button when the S1, S2, S3 or any other (in the EDIT window) text is
displayed inversely, the sub-list containing the values of the coefficients for all 1/1 OCTAVE and
1/3 OCTAVE filters is opened.
EDIT windows, the filter selection
The opened window contains the centre frequencies of the filters and their coefficients:
0.80 Hz: available values of 0.8 Hz centre frequency filter: -INF, -100.0dB ... 100.0dB
1.00 Hz: available values of 1Hz centre frequency filter: -INF,-100.0dB ... 100.0dB
9-25
SVAN 956 USER MANUAL
_
...
20.0kHz: available values of 20 kHz centre frequency filter: -INF, -100.0dB ... 100.0dB
The selection of the position in the set is performed by means of the <>, <> push-buttons.
The value is introduced by pressing the <>, <> push-buttons. The sub-list is closed and
the instrument returns to the USER FILTERS sub-list after pressing the <ENTER> (with the confirmation
of all settings made in the sub-list) or <ESC> push-button (ignoring all settings made in the sub-list).
…
S1 filter windows; the coefficient selection
9.16.2.3 Clearing the coefficients of the user filters - CLEAR
The CLEAR position enables the user to clear the values of the user coefficients of octave or third
octave filters. It is possible to clear all sets of coefficients (ALL), to clear the first set (S1), to clear the
second set (S2), to clear the third one (S3) or any other transmitted to the instrument from a PC by means
of the interface.
SPECTRUM BASED FILTER window; the CLEAR position selected
In order to enter the sub-list the user has to select in the SPECTRUM BASED FILTER sub-list
the CLEAR text, using the <>, <> (or <>, <>) push-buttons and press the <ENTER>.
The selection of the position in this sub-list is performed by means of the <>, <> push-buttons.
The coefficients of a set (or sets) are cleared after the selection of the proper text by means of the <>,
<> push-buttons and after pressing the <ENTER> one.
CLEAR windows, the selection of the filters to be cleared
After this, the WAIT text appears on the display and the instrument returns to the
SPECTRUM BASED window. The CLEAR sub-list is also closed and the instrument returns to the
SPECTRUM BASED window after pressing the <ESC> push-button (without taking any action).
9-26
SVAN 956 USER MANUAL
Displays during and after the execution of CLEAR operation
9.17 Selection of the vibration units - VIBRATION UNITS
The VIBRATION UNITS position enables the user to select the units for the vibration
measurements. In order to enter the position the user has to select the VIBRATION UNITS text in the
SETUP list, using the <>, <> (or <>, <>) push-buttons and press the <ENTER>.
SETUP list, the VIBRATION UNITS text highlighted (displayed inversely)
2
It is possible to select the NON-METRIC units (e.g. g, ips, mil etc.) or METRIC units (e.g. m/s , m/s,
m etc.). The selection is done by means of the <>, <> push-buttons. In order to confirm the selection
the <ENTER> push-button has to be pressed. Such pressing closes the sub-list. After pressing
the <ESC> push-button the sub-list is also closed but all changes, which were made, are ignored.
VIBRATION UNITS windows with the available positions
9.18 Warnings selection - WARNINGS
The WARNINGS enables the user to select the messages, which could be displayed during
the operation of the instrument. In order to enter the window the user has to select the WARNINGS text
in the SETUP list, using the <>, <> (or <>, <>) push-buttons and press the <ENTER>.
This window contains only one position.
SETUP list, the WARNINGS text highlighted (displayed inversely)
9.18.1 Saving the measurement results in a file - RESULTS NOT SAVED
In order to switch on the displaying of the message the user has to place, by means of the <>,
<> push-buttons, the special character in the warning’s position. The window is closed and
the instrument returns to the SETUP list after pressing the <ENTER> (with the confirmation of a change
made in the position) or <ESC> push-button (ignoring a change made in the position).
9-27
SVAN 956 USER MANUAL
_
WARNINGS windows; RESULTS NOT SAVED selected
When the position is set to be active the special warning can be displayed after pressing
the <START / STOP> push-button. It will be happened in a case when the result of the previous
measurement was not saved in a file of the instrument.
Displays with LAST RESULTS NOT SAVE warning
The question Continue? appears with the warning message. The default value of the CONTINUE
position is SAVE NEXT. After pressing the <ENTER> push-button the instrument saves last results
with the name number increased by one. Using the <>, <> push-buttons one can change the value
of the CONTINUE position to YES or NO. If YES is chosen (to confirm the change the <ENTER> should
be pressed), the instrument returns to the active mode of result presentation starting the new
measurement process. If NO is chosen (to confirm the change the <ENTER> should be pressed),
the instrument returns to the active mode of measurement result’s presentation without starting the new
measurement process.
9.18.2 Checking free space on the USB disk - USB DISK FREE SP.
In order to switch on the displaying of the message the user has to place, by means of the <>,
<> push-buttons, the special character in the warning’s position. The window is closed and
the instrument returns to the SETUP list after pressing the <ENTER> (with the confirmation of a change
made in the position) or <ESC> push-button (ignoring a change made in the position).
WARNINGS windows; USB DISK FREE SP. selected
9.18.3 Minimum USB disk memory free space setting - MIN FREE SPACE
In this line, the user can determine the amount of the USB disk memory free space.
WARNINGS windows; MIN FREE SPACE selection
9-28
SVAN 956 USER MANUAL
The selected limit has to be within the range [1 MB, 1024 MB]. If the available memory is not
greater than that limit, the warning will be displayed. The limit is set by means of the <>, <> pushbuttons with the step equal to one MB. The step is increased up to ten MB, pressing the <>, <> pushbuttons together with the <SHIFT> one. The window is closed and the instrument returns to the SETUP
list after pressing the <ENTER> (with the confirmation of a change made in the position) or <ESC> pushbutton (ignoring a change made in the position).
The exemplary warning is presented below. The return to the programme execution is done
after pressing any push-button except the <SHIFT> and <ALT>.
Display with USB DISK FREE SPACE warning
9-29


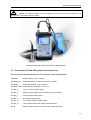
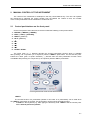
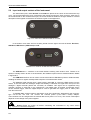
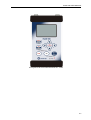
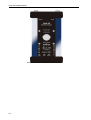
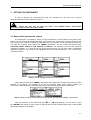
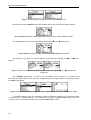
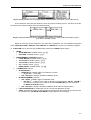
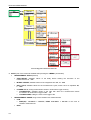
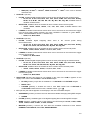
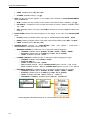
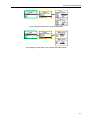
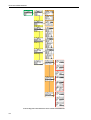
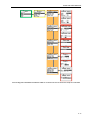
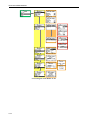
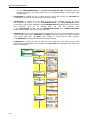
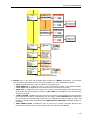
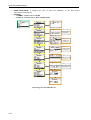

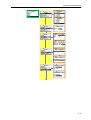
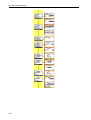
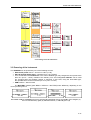
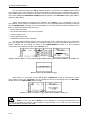
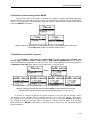

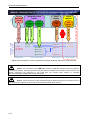
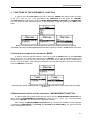
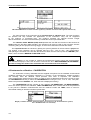
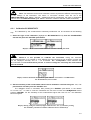
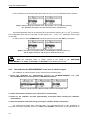

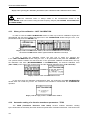
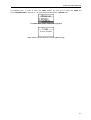

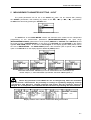
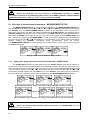
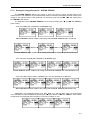
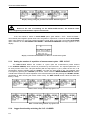
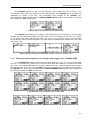
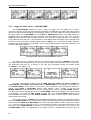
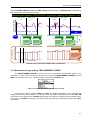
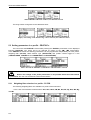
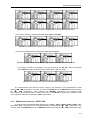
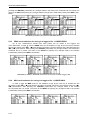
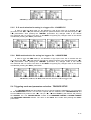
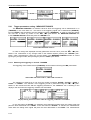
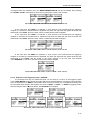
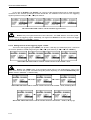

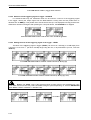
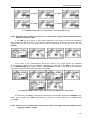
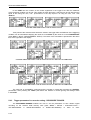
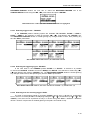
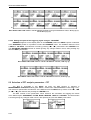
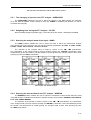
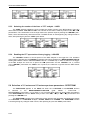
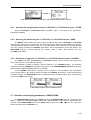
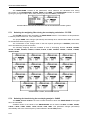
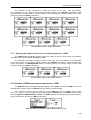
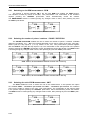
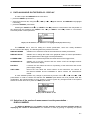
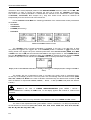
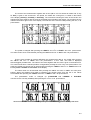
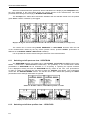
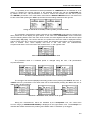
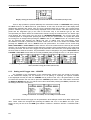
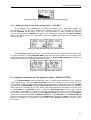
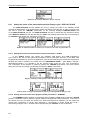
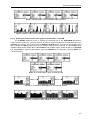
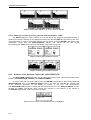
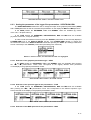

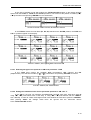
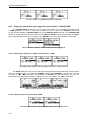
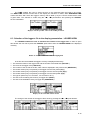
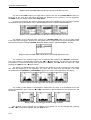
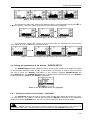
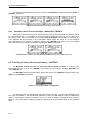
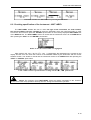

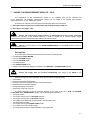
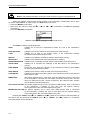
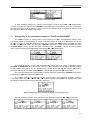
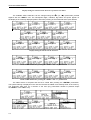
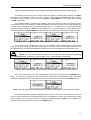
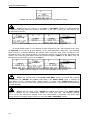
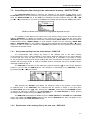
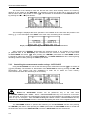

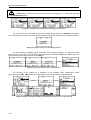
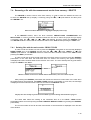
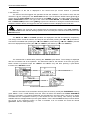
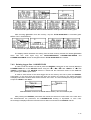
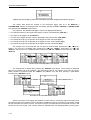
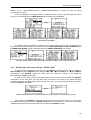

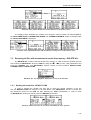
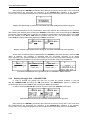
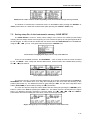
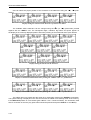
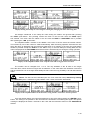
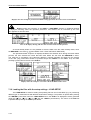
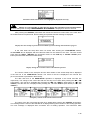
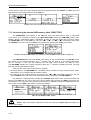
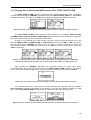
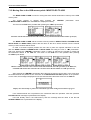

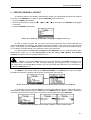
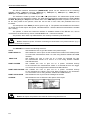
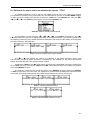
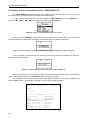
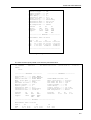
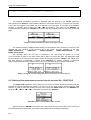
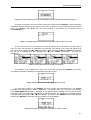
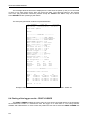
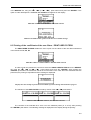
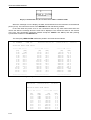
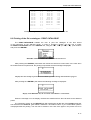
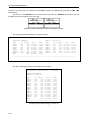
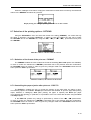
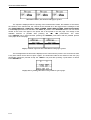
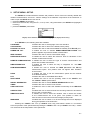
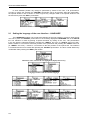
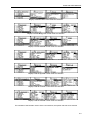
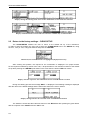
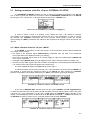
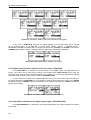
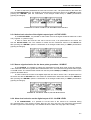
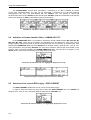
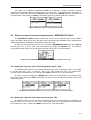
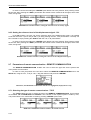
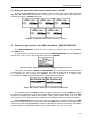
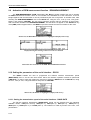
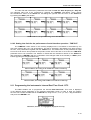
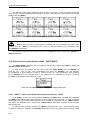
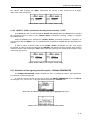
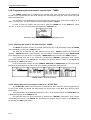
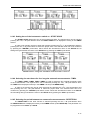
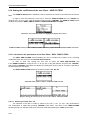
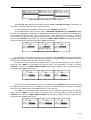
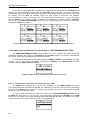
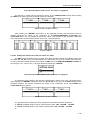
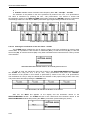
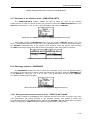
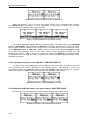
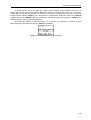
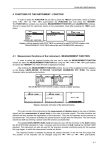
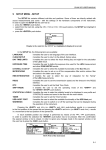

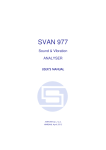

![User Manual [PDF 779 kB]](http://vs1.manualzilla.com/store/data/005781460_1-49b4dd0a8e6377162bdb6a1daefcc9f3-150x150.png)