1
Propeller Balancer App
User Manual
Smart Avionics Ltd.
Revision: 23
www.smartavionics.com
25/05/2015
Propeller Balancer App: User Manual
Copyright © 2003-2015 Smart Avionics Ltd.
Android is a trademark of Google Inc.
Bluetooth is a registered trademark of Bluetooth SIG Inc.
Table of Contents
1. Introduction ................................................................................................. 1
1.1. Obtaining and Installing the App ..................................................... 1
1.2. Balancing System Overview ............................................................ 2
1.3. App Overview .................................................................................... 2
1.3.1. Title bar .................................................................................. 2
1.3.2. Tabbed views ......................................................................... 2
1.3.3. Quitting the app ..................................................................... 3
1.3.4. Jobs ........................................................................................ 3
1.3.5. Status bar ............................................................................... 3
1.3.6. Menus ..................................................................................... 4
1.3.7. Exporting images ................................................................... 4
1.3.8. Vibration level colours ........................................................... 4
1.4. Bluetooth Setup ................................................................................ 5
1.5. Bluetooth Remote Capture Button ................................................... 6
2. Polar Chart View .......................................................................................... 7
2.1. Propeller Mode Polar Chart .............................................................. 8
2.1.1. Propeller mode solution ........................................................ 9
2.2. Rotor Mode Polar Chart .................................................................... 9
2.2.1. Rotor Mode Markers ............................................................ 11
2.2.2. Defining move lines ............................................................. 13
2.2.3. Move line setup dialog ......................................................... 14
2.2.4. Rotor mode solution ............................................................ 15
2.3. Polar Chart Context Menu .............................................................. 15
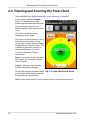
2.4. Panning and Zooming the Polar Chart .......................................... 18
3. Data View .................................................................................................. 19
4. Graph View ................................................................................................ 21
4.1. Graph View Context Menu ............................................................. 22
5. Spectrum View .......................................................................................... 23
5.1. Spectrum View Context Menu ....................................................... 24
5.2. Spectrum Analysis Dialog .............................................................. 27
6. Polar Point List .......................................................................................... 29
6.1. Polar Point List Context Menu ....................................................... 30
6.2. Delete Points Submenu .................................................................. 31
6.3. Captured Point Dialog .................................................................... 32
6.3.1. Propeller mode ..................................................................... 32
6.3.2. Rotor mode ........................................................................... 33
6.3.3. Captured point dialog context menu .................................. 33
7. Spectrum List ............................................................................................ 35
7.1. Spectrum List Context Menu ......................................................... 36
7.2. Delete Spectra Submenu ............................................................... 37
8. Big Capture Button View ........................................................................... 39
9. Options Menu ............................................................................................ 41
9.1. Job Submenu ................................................................................. 42
9.2. Job Setup Dialog ............................................................................ 44
9.2.1. Propeller mode job setup .................................................... 44
9.2.2. Rotor mode job setup .......................................................... 45
www.smartavionics.com
iii
Propeller Balancer App
9.3. Point Logger Submenu .................................................................. 45
9.3.1. Point logger configuration dialog ....................................... 46
9.4. Database Submenu ........................................................................ 46
9.5. Export Data Submenu .................................................................... 47
9.6. Import Data Submenu .................................................................... 48
9.7. Preferences View ............................................................................ 48
9.7.1. Display Preferences ............................................................. 48
9.7.2. General Preferences ............................................................ 49
9.8. Dummy Data Setup Dialog ............................................................. 50
10. PB-3 Options Submenu .......................................................................... 51
10.1. Internal Tacho Options Dialog ..................................................... 51
10.2. Polar Options Dialog .................................................................... 52
10.3. Accelerometer Scaling Dialog ..................................................... 53
11. Propeller Balancing ................................................................................. 55
11.1. Minimising Other Sources of Vibration ....................................... 55
11.2. Propeller mass imbalance ........................................................... 55
11.3. Static Propeller Balancing ........................................................... 55
11.4. Dynamic Propeller Balancing ...................................................... 56
11.5. Taking a Vibration Reading .......................................................... 57
11.6. Balancing Procedure .................................................................... 59
11.7. After Balancing ............................................................................. 60
11.8. Troubleshooting ........................................................................... 60
11.8.1. The displayed RPM is erratic or wrong ............................. 60
11.8.2. The current polar point position varies widely ................. 61
11.8.3. Adding weight does not reduce the vibration level .......... 61
12. Rotor Balancing ...................................................................................... 63
12.1. Causes Of Rotor Vibration ........................................................... 63
12.2. Rotor Mass Balancing .................................................................. 64
12.2.1. Defining move lines ........................................................... 65
12.2.2. Using the move lines to balance ....................................... 66
13. Two Plane Balancing .............................................................................. 67
13.1. Two Plane Balancing Method ...................................................... 67
13.1.1. Measurement and correction planes ................................ 67
13.2. Two Plane Balancing View ........................................................... 68
13.2.1. Single accelerometer procedure ....................................... 69
13.2.2. Dual accelerometer procedure .......................................... 70
A. Exported CSV Data Formats ..................................................................... 71
A.1. Polar Point Data Format ................................................................ 71
A.2. Spectrum Data Format ................................................................... 71
Index .............................................................................................................. 73
iv
www.smartavionics.com
List of Figures
1.1. PB-3 Pairing ............................................................................................. 5
2.1. Propeller Mode Polar Chart ..................................................................... 8
2.2. Rotor Mode Polar Chart ......................................................................... 10
2.3. Marker Positions When Tape Aligned With Tacho ............................... 11
2.4. Marker Positions When Tape Aligned With Master Blade .................... 12
2.5. Moving A Move Line ............................................................................... 13
2.6. Move Line Setup .................................................................................... 15
2.7. Polar Chart Pan & Zoom ........................................................................ 18
3.1. Data View ............................................................................................... 19
4.1. Graph View (Cartesian and Polar Formats) .......................................... 21
5.1. Spectrum View ....................................................................................... 23
5.2. Spectrum Analysis (prop) ...................................................................... 27
5.3. Spectrum Analysis (rotor) ..................................................................... 27
6.1. Polar Point List ....................................................................................... 29
6.2. Point Details ........................................................................................... 32
6.3. Balance Solution .................................................................................... 32
7.1. Spectrum List ......................................................................................... 35
8.1. Big Capture Button View ........................................................................ 39
9.1. Propeller Balance Report ....................................................................... 43
9.2. Point Logging ......................................................................................... 46
9.3. Dummy Data Setup ................................................................................ 50
10.1. Internal Tacho Options ........................................................................ 51
10.2. Polar Options ....................................................................................... 52
10.3. Accelerometer Scaling ......................................................................... 53
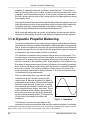
11.1. Sine Wave ............................................................................................. 56
12.1. Rotor Spectrum With Large × 2 Peak .................................................. 63
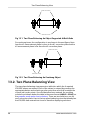
13.1. Two Plane Balancing An Object Supported At Both Ends ................. 68
13.2. Two Plane Balancing An Overhung Object ......................................... 68
13.3. Two Plane Balancing View .................................................................. 69
www.smartavionics.com
v
vi
www.smartavionics.com
Chapter 1. Introduction
The Propeller Balancer app (hereafter referred to as “the app”) provides the
user interface for the PB-3 propeller balancer system manufactured by Smart
Avionics Ltd. The app aims to be compatible with any Android™ smartphone
or tablet that supports Bluetooth® wireless connectivity and is running at
least Android version 2.1. The PB-3 system can also be used to balance
Gyroplane and Helicopter rotors.
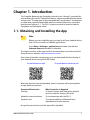
1.1. Obtaining and Installing the App
Note
Before you can install the app, you need to tell your Android device
that it's OK to install non-Market applications.
Go to Menu > Settings > applications and make sure that the
Unknown Sources checkbox is checked.
The latest revisions of the app and this documentation can be found at the
Smart Avionics website, www.smartavionics.com.
If you have a barcode scanning app, you can download the files directly to
your Android device using these QR codes:
PropellerBalancer.apk
PropellerBalancerManual.pdf
When the app has been downloaded, select it and you will be prompted to
accept these permissions:
Requested Permission
Why Permission is Required
Storage
To export images and data to the Android
device's external storage (SD card).
Network communications
To communicate with the PB-3.
System tools
To request enabling of Bluetooth and
adjustment of screen timeout.
Accept the permissions and the app will be installed.
www.smartavionics.com
1
Balancing System Overview
1.2. Balancing System Overview
The propeller/rotor balancing system has these main components:
Accelerometer
This is mounted near the propeller/rotor to detect the
vibration caused by any imbalance.
Optical
tachometer
A strip of reflective tape is attached to one propeller/rotor
blade and an optical sensor detects the tape as it passes
and generates the tachometer signal required by the
balancer. For propeller balancing, the PB-3's built in
optical tachometer would normally be used. For rotor
balancing, an external tachometer must be used.
Signal processor This digitises the vibration signal and sends the resulting
data to an Android device using Bluetooth® wireless
communications.
Android device
This provides the interface through which the user
interacts with the PB-3.
For details of how the sensors are attached and other hardware related
information, please refer to the PB-3 Propeller Balancer User Manual.
1.3. App Overview
1.3.1. Title bar
The app's title bar displays the application name (Propeller Balancer). If the
height of your Android device's display is limited, you can set a preference
to hide the title bar.
1.3.2. Tabbed views
The app has a tabbed interface that provides 4 top-level views:
The polar chart view shows a polar chart on which the data points
captured during balancing are plotted – it is the primary view used
when balancing a propeller/rotor
RPM
IPS
DEG
The data view shows an easy to read numeric display of the
current vibration data.
The graph view shows a graphical display of the vibration
waveform – very much like a simple oscilloscope.
The spectrum view shows the vibration spectrum – it can be a
very useful aid when diagnosing vibration related problems.
The desired view is selected by pressing the associated tab.
2
www.smartavionics.com
Quitting the app
If the height of your Android device's display is limited, you can set a
preference to automatically hide the tabs once you have pressed one. When
the tabs are hidden, the first item in the option menu makes them visible
again.
1.3.3. Quitting the app
To quit the app from a top-level view, press the Android device's back button.
Alternatively, you can use the Quit App option menu item from any view. A
dialog will pop up to confirm the action. If you would rather not have the
confirmation dialog, there is a preference to suppress the quit dialog.
1.3.4. Jobs
The app provides a means of keeping the data associated with each balancing
session you carry out separate. A “job” is just a named collection of captured
data items (polar points and spectra) along with a few values that configure
the PB-3's behaviour. The most important configuration value is the job's
mode which can be either Propeller or Rotor.
1.3.5. Status bar
The status bar is displayed at the top of each tabbed view. It contains a
number of fields separated by '|'. Most of the fields consist of a field name
and value separated with '='. The fields are:
Job
String
Locked
a
The name of the current job. All data (captured polar
points and spectra, exported images, etc.) will be
associated with this job. An obvious value for a job
name would be the registration letters of the aircraft
whose propeller/rotor is being balanced. Job names
are case insensitive and are always displayed using
upper-case letters.
This field doesn't have a value and it is only shown
when the current job is “locked”.
Axis
X or Y or
Alias
The accelerometer axis currently selected. If the
currently selected axis has been given an alias, that
will be displayed instead of X or Y.
PSRU
Number
The ratio of the PSRU (Propeller Speed Reduction Unit)
fitted to the engine.
Mode
Prop or
Rotor
The current job's mode.
Tacho
Int or Ext
The tachometer currently selected (internal or
external).
www.smartavionics.com
3
Menus
Log
On or Off
Indicates whether the Logger is enabled or not. If the
Logger has logged some data, the field will be
displayed in green.
Bat
Percentage The remaining capacity of the PB-3's battery. If the
value is less than 20%, the field is displayed in red.
a
Previous versions of this app labelled data items with a “job tag”, job names are now used
instead.
When the app is connecting to the PB-3, progress messages are appended
to the status bar.
If the height of your Android device's display is limited, you can set a
preference to hide the status bar.
1.3.6. Menus
View-specific options are accessed through context menus (menu pops up
when view is long-pressed).
Common options are accessible via the options menu that pops up when the
Android device's menu button is pressed. Devices that run the more recent
versions of Android (Honeycomb or later) generally don't have a menu button.
Instead, the options menu is accessed via the device's Action Bar. If the width
of the display allows, some of the option menu items (Job, List Points, List
Spectra, etc.) will be shown in the Action Bar rather than in the option menu.
1.3.7. Exporting images
At any time, a snapshot of the current top-level view can be exported as a
JPEG or PNG image by selecting Export Image from the options menu. The
images are saved into a directory called Pictures/PB on the Android device's
external storage (SD card). The image format used is determined by the
exported image format preference.
After an image has been saved, an image viewing app is invoked to display
the image. Typically, Android image viewers provide (menu) options to share
the displayed image using Bluetooth, email, etc. Pressing the back button in
the image viewer should return you to the Propeller Balancer app. There are
many Android image viewer apps that provide a variety of features. A free
one that works extremely well for our purposes is “QuickPic” which can be
installed via Google Play.
1.3.8. Vibration level colours
The background of the polar chart can optionally be coloured to give an
indication of the level of vibration. The same colours are also used for the
background of the text wherever the vibration level is displayed textually. The
vibration level is expressed in units of Inches Per Second (IPS).
4
www.smartavionics.com
Bluetooth Setup
Here is a summary of the vibration levels along with their descriptions and
colours:
Colour
IPS
Description
≥ 1.0
Very rough
< 1.0
Rough
< 0.5
Slightly rough
< 0.25
Fair
< 0.15
Good
< 0.07
Very good
< 0.04
Extremely good
1.4. Bluetooth Setup
The PB-3 and the Android device communicate using Bluetooth and they
have to be paired before communication can take place. To pair the devices,
do the following:
1. Turn on the PB-3 and check that its status LED is flashing regularly.
2. On the Android device, go to Menu > Settings > Wireless & networks >
Bluetooth settings – if Bluetooth is not yet enabled, enable it now using
the checkbox on that page.
3. Press Scan for devices – after a few seconds the PB-3 should appear in
the list of Bluetooth devices displayed lower down on the screen (you may
need to scroll down to find it if the list contains several items).
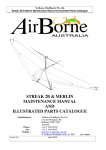
Now pair with the PB-3 by pressing its entry
in the list – a dialog should appear inviting
you to enter the security code which is 0000.
The PB-3 should now be paired and its entry
in list should say “Paired but not connected”.
The Android device and the PB-3 will remain
paired until you unpair them by long-pressing
the PB-3 list entry and then selecting the
Unpair option.
Fig 1.1. PB-3 Pairing
www.smartavionics.com
5
Bluetooth Remote Capture Button
If you turn off the Bluetooth on the Android device, when you next start the
Propeller Balancer app it will ask you if you want to turn the Bluetooth on.
1.5. Bluetooth Remote Capture Button
Remote camera shutter release devices that use the Bluetooth HID protocol
can be used as a remote capture button. This is particularly useful for
capturing polar points and spectra when flying a gyroplane or helicopter as
the pilot does not have to hold the Android device or use the on-screen
controls at all. The app has been tested with a device called the iKey3 but
any device that behaves like a HID keyboard, and sends an Enter key when
its button is pressed, should be compatible.
6
www.smartavionics.com
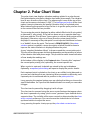
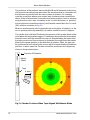
Chapter 2. Polar Chart View
The polar chart view displays vibration readings plotted in a polar format.
Each plotted polar point has a vibration level and a phase angle. The vibration
level is zero at centre of the chart. The phase angle is zero at the top of the
chart and increases clockwise (0-360°). The background colour of the chart
makes it easy to determine the quality (vibration level) of a plotted point.
When balancing the propeller/rotor, the aim is to get the polar point as close
to the centre of the chart as possible.
The current polar point is displayed as either a black filled circle (X axis points)
or diamond (Y axis points). If the job has been set up to capture data from
both axes and the “Plot All Axes” menu option is selected, both points will be
displayed. Otherwise, only one of them (from the primary axis) will be
displayed. A summary of the polar point's most important attributes is shown
in a “bubble” above the point. The format is RPM/IPS@DEG. If the show
solution option is enabled, a terse description of what should be done to
improve the state of balance is displayed below the point.
A grey “standard deviation ellipse” is drawn around the current polar point.
The size of the ellipse grows and shrinks depending on the variation in values
of the vibration level and phase angle. This provides a useful visual indication
of how steady the readings are.
At the bottom of the display is the Capture button. Pressing this “captures”
the current polar point(s) and, optionally, the current spectra too.
When a point is captured, its details are stored in the app's database.
Optionally, a captured point dialog will open to display the point's details.
Each captured point is plotted on the chart as an unfilled circle/diamond so
you can see how the points are clustering. When zoomed in sufficiently, each
captured point is numbered with its position in the polar point list.
Long-pressing the capture button pops up a dialog that lets you choose the
size of that button. So if you find the standard button too small you can make
it bigger.
The chart can be panned by dragging it with a finger.
The chart can be zoomed using the zoom control buttons that appear when
the chart is panned or by using “pinch-zoom” gestures if your Android device
supports them. The visibility of the zoom controls is determined by the show
zoom controls preference. You can also use the Android device's volume
up/down buttons to adjust the zoom.
Long-pressing the polar chart pops up the polar chart context menu.
www.smartavionics.com
7
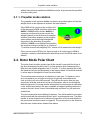
Propeller Mode Polar Chart
2.1. Propeller Mode Polar Chart
Fig 2.1. Propeller Mode Polar Chart
When balancing a propeller, all adjustments (weight added and/or moved)
are determined by comparing the current polar point with the start point. A
start point is simply a polar point that was captured before any weights were
8
www.smartavionics.com
Propeller mode solution
added. Start points are plotted as filled blue circles. Any point can be specified
to be the start point.
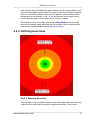
2.1.1. Propeller mode solution
The propeller mode solution bubble contains a terse description of how the
weight needs to be adjusted to achieve the best balance.
If the RPM of the current point is within ±5%
of the start point's RPM, a solution of the form
ANGLE × SCALE will be shown. ANGLE is
signed; a positive value means move the
weight forward (in the direction of propeller
rotation) that many degrees and a negative
value means move the weight backward
(opposite to the direction of propeller
rotation). SCALE is a multiplier that specifies
the required change in weight; e.g. a value of
1.2 means increase the weight by 20%, a value of 0.5 means halve the weight.
If the current point's RPM is not close enough to the start point's RPM to
calculate a solution, the bubble will indicate how much the RPM needs to be
altered.
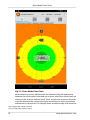
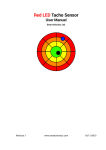
2.2. Rotor Mode Polar Chart
The polar chart provides a plan view of the aircraft's rotor with the front of
the aircraft assumed to be in the 12 o'clock position (the datum position).
With the rotor blades aligned in the 12 o'clock - 6 o'clock position (fore-aft)
the blade at the front (at the datum) is the master blade. It should be marked
in some way to distinguish it from the other blade.
The accelerometer measures acceleration in two axes. To balance a rotor
you only need to use a single axis which is typically orientated to the
side-to-side (roll) axis of the aircraft. The job has an option that lets you
specify the primary axis which is the accelerometer axis to use during the
balancing process. You may also be interested in measuring the acceleration
in the vertical axis and so the app is capable of capturing data (points and
spectra) for both X and Y axes simultaneously and there is a job option to
enable that.
The rotor mode polar chart displays 3 markers. Two of the markers are square
and they indicate the orientation of the X and Y accelerometer axes. The other
marker is arrow shaped and it indicates the position of the master blade at
the point when the tachometer is triggered. The arrow points in the direction
that the rotor rotates when viewed from above.
www.smartavionics.com
9
Rotor Mode Polar Chart
Fig 2.2. Rotor Mode Polar Chart
When balancing a rotor, adjustments are determined by the relationship
between the current polar point and one or more move lines. Move lines are
1
2
shown on the chart as dashed black lines. A move line shows on the polar
chart the direction the current polar point would move in when a particular
adjustment is carried out. For example, there would normally be a move line
1
Style configurable, default is dashed.
Colour configurable, default is black.
2
10
www.smartavionics.com
Rotor Mode Markers
associated with adding weight to either tip of the rotor blades to adjust the
spanwise balance. Adding weight to one tip would move the current polar
point parallel to that move line in one direction and adding weight to the other
tip would move the polar point parallel to that move line in the opposite
direction. Another common move line is associated with shifting the mass
of the rotor system in a chordwise direction. The move lines are not required
to be orthogonal (at 90°) to each other. Each axis (X and Y) can have any
number of move lines defined and they will all be shown on the chart. At any
one time, a maximum of 2 move lines may be selected to be used in the
solution calculation. Each job has its own move lines.
2.2.1. Rotor Mode Markers
The rotor mode markers show you how the accelerometer axes are aligned
with the aircraft structure and also where the master blade is positioned at
the time the tachometer is triggered. Once defined, you should not need to
alter the position of the markers again unless you change the orientation of
the accelerometer or the positions of the tachometer sensor and/or the
retroreflective tape. With the markers correctly set, the angles reported by
the app can be related to the rotor when it is positioned with the master blade
pointing forward (the datum position).
Direction Of Rotation
Datum
Master
Blade
X Axis +
Accel
Tac
ho
Tape
Fig 2.3. Marker Positions When Tape Aligned With Tacho
www.smartavionics.com
11
Rotor Mode Markers
The positions of the markers that are labelled X and Y indicate the directions
of the positive accelerometer axes when the accelerometer is mounted such
that its axes are parallel with the rotor's plane of rotation. For example,
consider a machine whose rotor rotates anti-clockwise when viewed from
above. If the accelerometer is mounted so that the positive X axis is pointing
away from the rotor's axis of rotation in the 3 o'clock direction (i.e. pointing
to the right when viewed from above), the X marker should be in the 3 o'clock
(90°) position as shown in Fig 2.3.
When an accelerometer axis is perpendicular to the plane of rotation (i.e. the
axis is pointing vertically upwards), its marker should be set to 0 degrees.
The marker that is labelled T indicates the position of the master blade at the
point where the tachometer triggers. To determine the position for this marker,
move the rotor until the retroreflective tape is illuminated by the beam from
the tacho sensor and then measure (or estimate) the angle from the master
blade to the datum position in the direction of rotation. Often, the tape can
be positioned in front of the tacho sensor with the master blade at the datum
position, in which case, the T marker should be positioned at 0 degrees as
shown in the previous figure.
Direction Of Rotation
Datum
Master
Blade
Tape
X Axis +
Accel
Tac
h
o
Fig 2.4. Marker Positions When Tape Aligned With Master Blade
12
www.smartavionics.com
Defining move lines
Alternatively, if the retroreflective tape is attached to the master blade such
that when that blade is at the datum, the tape is also lined up with the datum,
then the T marker's position must coincide with the actual position of the
tachometer on the aircraft. In Fig 2.4, the tachometer is mounted in the 4
o'clock position and so that's where the T marker is placed.
The markers can be moved by selecting the Move Markers item from the
polar chart context menu. Alternatively, the markers can be positioned by
entering the required angles into the job setup dialog.
2.2.2. Defining move lines
Fig 2.5. Moving A Move Line
The orientation of a move line is defined by positioning on the polar chart two
nodes (node A and node B) that the line passes through. A move line's
www.smartavionics.com
13
Move line setup dialog
orientation is adjusted by dragging its nodes to positions on the chart that
correspond to known conditions.
For example, to set up the spanwise move line, weight is first added to one
tip and one or more polar points are captured in that condition. Then the
weight is moved to the opposite tip and more polar points are captured. The
move line's nodes are then positioned on the polar chart above the two groups
of points.
The amount of weight added to each tip (grams, number of washers, etc.) is
entered into the move line setup dialog along with an optional name ('span',
'chord', etc.) and units ('grams', 'washers', 'inches of tape', etc.). Once the
move line is set up, the “solution” for the current polar point will contain a
suggested adjustment derived from the position of that point along the move
line. In “move move lines mode” the move line nodes are shown as white
bubbles containing text.
2.2.3. Move line setup dialog
The move line setup dialog is used to configure a single move line. It contains
these items:
Name
The move line's name. It is simply used as a label and it
doesn't have to be unique or defined at all if you don't
want to name the move line.
Applies To Axis
The name (X, Y or axis alias) of the accelerometer axis
that this move line is associated with. Each move line can
only be associated with one axis.
Units
The units of adjustment for this move line. Typical move
line units are “grams”, “washers”, “inches of tape”,
“degrees clockwise”, etc.
Value @ A
The number of units of adjustment that correspond to the
positions of the move line's nodes. For example, one node
could correspond to the condition of 10 washers being
attached to the tip of the master blade and the other node
for the opposite condition of 10 washers being attached
to the tip of the non-master blade. These two values must
be different in either magnitude or sign, i.e. they can't
both be 10 (but one can be 10 and the other -10).
Value @ B
Increment
14
When the adjustment is calculated, the resulting value
will be a multiple of this increment. So if you only have
washers of one size, then an increment of 1 would be
appropriate but if you also had some washers that
weighed half as much, then an increment of 0.5 would be
appropriate because then the suggested amount of
adjustment would be to the nearest 1/2 washer.
www.smartavionics.com
Rotor mode solution
Move Line Colour The move line's colour. Supported colours are black, red,
green, blue, magenta and orange.
Move Line Style
The move line's style. Supported styles are dashes,
arrows, solid and dots.
Fig 2.6. Move Line Setup
2.2.4. Rotor mode solution
The rotor mode solution bubble contains one or two suggestions for
adjustments to be made to achieve the best balance. Each move line provides
one suggestion. The format of the suggestions is “name: amount units” where
name is the move line's name (if it has one), amount is the amount of
adjustment required and units are the units of adjustment (if they were defined
for the move line).
If more than one suggestion is shown, they
are ordered with the largest adjustment
3
shown above the smaller adjustment .
2.3. Polar Chart Context Menu
The polar chart context menu contains these items:
3
The ordering is done by comparing the distances along the respective move lines that the polar point would
need to move to reach the centre of the chart so the move lines' units do not have to be the same.
www.smartavionics.com
15
Polar Chart Context Menu
Plot All Jobs
A checkbox that controls whether captured points from
other jobs are plotted along with the current job's points
or not.
Plot All Axes
A checkbox that controls whether captured points whose
axis differs from the current axis are plotted or not.
Track Current
Point
A checkbox that controls whether the chart is to be
automatically panned so that the current polar point is
always displayed near to the centre of the screen.
Keep Centre
Visible
A checkbox that controls whether the chart is to be
automatically zoomed so that the centre of the chart is
always visible when tracking the current point.
Colour
Background
A checkbox that controls whether the chart's background
will be coloured or not.
Show Solution
A checkbox that controls whether a “solution bubble” will
be shown below the current point's summary or not. The
solution bubble content is different for propeller and rotor
modes.
a
Pan & Zoom Chart Enters the legacy pan-zoom mode. You can also use the
Android device's volume up/down buttons to adjust the
zoom.
a
Only available if the legacy modal pan-zoom behaviour is enabled.
In rotor mode, the context menu also includes these items:
Rotor Rotates
Clockwise
A checkbox that, when checked, specifies that the rotor
rotates in a clockwise direction when viewed from above.
The T marker shows the direction of rotor rotation.
Move Markers
Normally, the positions of the X, Y and T markers are
fixed. This menu item enables “move markers mode”
which allows you to reposition the markers by simply
dragging them with your finger to the required positions.
The markers become blue when move markers mode is
active. To fix the markers again use the (now visible) Fix
Markers menu item or just wait a short while and the
markers will become fixed again automatically.
As you move the T marker, all of the polar points on the
chart move with it. Moving one of the accelerometer axis
markers (X or Y) just moves the points associated with
that axis.
Move Move Lines Selecting this item enables “move move lines mode”
which allows you to adjust the positions of the existing
move lines by dragging the lines' nodes. The positions
of the lines' nodes is shown by “bubbles” that are
displayed while this mode is active. Drag the nodes so
that they lie on top of the polar point(s) that correspond
16
www.smartavionics.com
Polar Chart Context Menu
to a particular state of imbalance (weight on one tip or
the other, etc.) To fix the move lines again use the (now
visible) Fix Move Lines menu item or just wait a short
while and the move lines will become fixed again
automatically.
Setup Move Line
This item lets you select one move line to be configured.
For a short while, the move lines' node information is
displayed so that you can identify the move lines. Touch
the move line that is to be configured and the move line
setup dialog will appear.
Select Move Lines Pops up a dialog containing a list of check boxes, one for
To Use
each defined move line. You can select which of the move
lines will be used to calculate the rotor mode solutions.
No more than 2 move lines can be selected at any one
time.
Add Move Line
Adding the move line involves setting up its parameters
and positioning the line on the chart. Selecting this item
firstly pops up the move line setup dialog and when that
dialog is dismissed using the Accept button, move move
line mode is entered so that the new move line's nodes
can be positioned.
Show Move Line
Names
A checkbox that enables the display of the move line
names. When enabled, the name of each move line will
be displayed in a “bubble” positioned on the appropriate
line.
www.smartavionics.com
17
Panning and Zooming the Polar Chart
2.4. Panning and Zooming the Polar Chart
Only available if the legacy modal pan-zoom behaviour is enabled.
In pan-zoom mode the Capture
button is hidden and two new
buttons appear at the top of the view
and (optionally) zoom control
buttons appear at the bottom of the
view.
The chart can be panned by
dragging it with a finger.
The chart can be zoomed by using
the zoom control buttons or by
using “pinch-zoom” gestures if your
Android device supports them. The
visibility of the zoom controls is
determined by the show zoom
controls preference. The new
buttons are:
Reset – centres the chart in the view
and zooms out so that the whole
chart is visible.
Cancel – exits pan-zoom mode
without saving any changes.
To save the changes you have made Fig 2.7. Polar Chart Pan & Zoom
and exit pan-zoom mode, press the
Android device's back button.
While in pan-zoom mode, current point tracking is temporarily disabled.
18
www.smartavionics.com
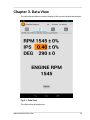
Chapter 3. Data View
The data view provides a numeric display of the current vibration data values.
Fig 3.1. Data View
The data values displayed are:
www.smartavionics.com
19
RPM – the propeller RPM and associated percentage standard deviation.
IPS – the vibration level and associated percentage standard deviation.
DEG – the phase angle of the vibration (in degrees) and associated standard
deviation (the standard deviation is limited to a maximum of 90).
ENGINE RPM - this is simply the propeller RPM multiplied by the PSRU ratio.
Below the data values is the Capture button. Pressing this “captures” the
current polar point(s) and, optionally, the current spectra too.
When a point is captured, its details are stored in the app's database.
Optionally, a captured point dialog will open to display the point's details.
20
www.smartavionics.com
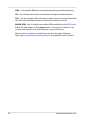
Chapter 4. Graph View
The graph view displays the time domain vibration waveforms (acceleration,
velocity or displacement plotted against time) for one revolution of the
propeller/rotor. The waveform may be plotted using either Cartesian or Polar
coordinates. Alternatively, if data is captured from both X and Y axes, it may
be plotted as a 2 dimensional graph.
Fig 4.1. Graph View (Cartesian and Polar Formats)
If the Colour Waveform context menu option is selected, the waveform is
coloured red at the start of the cycle and blue at the end.
When acceleration is being displayed using the polar format, the display also
shows (with a small red cross) the position of the average of the plotted polar
coordinates. This gives you a visual indication of the vibration waveform's
phase angle.
The waveforms' size may be scaled manually using either the context menu
or the Android device's volume controls or automatic scaling can be enabled.
At the top of the view, the current RPM and IPS are shown and at the bottom
status information that shows when the waveform was captured and what
is being displayed.
Long-pressing the view pops up a context menu.
www.smartavionics.com
21
Graph View Context Menu
4.1. Graph View Context Menu
The graph view context menu contains these items:
Cartesian Plot
A checkbox that selects a Cartesian plot of the data.
Polar Plot
A checkbox that selects a Polar plot of the data.
2 Axis Plot
A checkbox that selects a 2 dimensional plot using data
from both axes. The primary axis data is used for the
vertical direction and the secondary axis data is used for
the horizontal direction. To give you an idea of how the
waveform progresses through the cycle, a label is
displayed every 15 degrees.
Set Full Scale
Pops up a list of full scale magnitudes for you to select
from. The first item in the list is Auto which automatically
scales the waveform so that it fits the display.
Plot Acceleration A checkbox that selects display of acceleration. This is
the raw data coming from the accelerometer.
Plot Velocity
A checkbox that selects display of velocity. This waveform
is obtained by integrating the acceleration data.
Plot Displacement A checkbox that selects display of displacement. This
waveform is obtained by integrating the velocity data.
Colour Waveform A checkbox that enables the colouring of the displayed
waveform. The beginning of the waveform is coloured
red and the end of the waveform is coloured blue.
Draw Graticule
22
A checkbox that enables the display of the graticule and
axis values.
www.smartavionics.com
Chapter 5. Spectrum View
The spectrum view shows the vibration data in the frequency domain – each
spectral line represents the vibration level at a given RPM.
Fig 5.1. Spectrum View
www.smartavionics.com
23
Spectrum View Context Menu
The spectrum view is extremely useful for helping to diagnose vibration
problems as it allows you to determine how much vibration is occurring at
1
each of the frequencies of interest (prop frequency, blade pass frequency ,
engine crank and half-crank frequencies, etc.)
By default, the plot's vertical axis represents velocity (in IPS). Alternatively,
the vertical axis can represent acceleration (in G).
The display can be scrolled left and right by simply dragging the white area
in the required direction.
Optionally, a graticule can be displayed and “interesting” spectral lines can
be labelled.
The horizontal and vertical scaling and the “width” of each of the spectral
lines may be altered using the context menu.
The width of the spectral lines is specified in RPM per line. Note that the
display update rate is influenced by the width: the narrower the width, the
slower the update rate.
If labels are being displayed, they are positioned at the top of their respective
spectral lines.
At the top of the view, the current RPM and IPS are displayed.
Long-pressing the view pops up a context menu.
5.1. Spectrum View Context Menu
The spectrum view context menu contains these items:
Capture Spectrum Captures the current spectrum and stores it in a database
on the Android device. The list of captured spectra is
accessible through the options menu. This menu item is
not shown when a previously captured spectrum is being
viewed or when the Capture button (see below) is
displayed.
Analyse Spectrum Opens an analysis dialog that describes the current
spectrum.
Set RPM Per Line Opens a dialog that lets you choose between 10, 20, 50
& 100 RPM per spectral line. This menu item is not shown
when displaying a previously captured spectrum.
Set RPM Axis
Zoom
Opens a dialog that lets you choose a scaling value of 1,
2, 5, or 10 for the RPM (horizontal) axis. You can also use
the Android device's volume up/down buttons to adjust
the RPM axis zoom.
1
Blade pass frequency is the prop frequency × number of propeller blades.
24
www.smartavionics.com
Spectrum View Context Menu
Set IPS Axis Zoom Opens a dialog that lets you choose a scaling value of
Auto, 1, 2, 5, 10, 20 or 50 for the IPS (vertical) axis. When
set to Auto, the scaling is automatically adjusted so that
the tallest line uses 80% of the available display height.
Set FFT Window
Set Auto-Pause
IPS Level
Opens a dialog that lets you choose the type of FFT
window to use. This menu item is not shown when
displaying a previously captured spectrum. The available
window types are:
None
No window is used so the display will show
artifacts due to the “spectral leakage” that
occurs when a periodic waveform is
processed by a discrete Fourier transform.
Hann
The Hann window reduces the spectral
leakage and produces a display with fewer
artifacts and better frequency resolution.
This is the default window type.
Flat Top
The Flat Top window reduces the spectral
leakage and produces the most accurate
magnitudes.
Opens a dialog that lets you choose one of Off, 0.01, 0.02,
0.05, 0.1, 0.2, 0.5, 1, 2 or 5 for the auto-pause IPS level.
If the spectrum contains a line whose IPS value exceeds
the selected level, the display will be paused. The display
can be un-paused using the options menu. Selecting Off
disables the auto-pause feature. This menu item is not
shown when displaying a previously captured spectrum.
Plot Acceleration A checkbox that controls whether the spectrum is plotted
as acceleration (G) rather than velocity (IPS).
Plot As Curve
A checkbox that controls whether the spectrum is plotted
as a continuous curve or as individual vertical lines.
Draw Graticule
A checkbox that controls whether a graticule is displayed
or not.
Label Prop Lines A checkbox that controls whether the spectral lines that
correspond to integer multiples of the propeller/rotor RPM
are labelled or not. If enabled, each spectral line whose
RPM is an integer multiple of the propeller/rotor RPM has
a green label showing the IPS and RPM values along with
the appropriate multiplier (P, 2P, 3P, ..., 6P for propellers)
or (R, 2R, 3R, ..., 6R for rotors)
Label Engine Lines A checkbox that controls whether the spectral lines that
correspond to integer multiples (and also 1/2) of the
engine crankshaft RPM are labelled or not. If enabled,
www.smartavionics.com
25
Spectrum View Context Menu
those spectral lines will have a red label showing the IPS
and RPM values along with the appropriate multiplier
(E/2, E, 2E, 3E, ..., 6E).
Label Cursor Line A checkbox that controls whether a user selectable peak,
the “cursor line ”, is labelled or not. If enabled, the line
will have a blue label showing its IPS and RPM values
along with the multiples of the propeller and engine RPMs
(xP,yE) or multiple of the rotor RPM (xR). The current
cursor line is selected by tapping the desired peak in the
lower half of the spectrum display. Tapping the upper half
of the spectrum display moves the cursor to the next peak
(to the left or right depending on which side of the display
is tapped).
Show Capture
Button
A checkbox that controls whether the Capture button is
displayed in the top-right corner or not. Pressing that
button captures the current spectrum and stores it in a
database on the Android device. The list of captured
spectra is accessible through the options menu.
Share CSV Data
Shares this spectrum as CSV data.
Note
It is possible to use the spectrum view without a tachometer but,
in that case, no analysis is possible and no propeller or engine lines
will be labelled.
26
www.smartavionics.com
Spectrum Analysis Dialog
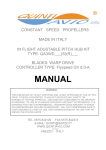
5.2. Spectrum Analysis Dialog
The spectrum analysis dialog displays text that describes the current
spectrum. To be able to do this, the propeller/rotor RPM must be known so
you need to have a working tachometer.
You can export an image of the
analysis by long-pressing the dialog
and pressing the Export Image
context menu item.
The figure on the right shows a
typical analysis exported image.
The analysis compares the vibration
levels of the spectra at integer
multiples of the propeller RPM to try
to determine the number of propeller
blades and if a plausible number is
2
determined it is shown along with
level of the blade pass vibration.
Likewise, if the vibration level at the Fig 5.2. Spectrum Analysis (prop)
crankshaft and half-crankshaft
RPMs are significant compared to the vibration at propeller RPM, they are
shown.
The rotor mode spectrum analysis
is similar except that it doesn't
report the crankshaft related
vibrations.
Fig 5.3. Spectrum Analysis (rotor)
2
It's just an estimate so don't panic if it reports the wrong number of blades!
www.smartavionics.com
27
28
www.smartavionics.com
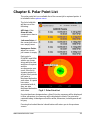
Chapter 6. Polar Point List
The polar point list is a scrollable list of the current job's captured points. It
is invoked via the options menu.
The list's bold title
will be one of the
following:
All Points, if the
Show All Jobs
context menu item is
checked.
Job name Points, if
the current job has a
non-empty name.
Anonymous Points,
when the current
job's name is empty.
Each point's
IPS@DEG and RPM
values are shown
along with the date
and time of capture
and the
accelerometer axis
used. If the list is
showing points for
all jobs, each point's
job name is
displayed below the
axis name. If a point
has notes
associated with it,
they are also
displayed below the
Fig 6.1. Polar Point List
axis name.
If a point has been designated as a Start Point, its summary will be displayed
in blue, otherwise, its summary will be displayed in black. If a point was
captured today, its background will be white, otherwise, its background will
be grey.
Pressing the Android device's back button will return you to the previous
screen.
www.smartavionics.com
29
Polar Point List Context Menu
If the divide screen preference is enabled, the screen will be divided into two
halves: one half will contain the polar point list and the other half will contain
a polar chart. Otherwise, the screen will just show the polar point list.
To select a point, short press (tap) its entry in the list. The list entry will be
highlighted and, if the polar chart is being displayed, the point will be displayed
as a filled circle. If the polar chart is not being displayed, selecting a point
will immediately pop up the point's captured point dialog which will display
the point's details. When the polar chart is being displayed next to the list,
you need to press the selected point's list entry a second time to pop up that
dialog.
Long-pressing the point list pops up a context menu.
When the screen is divided to show both the polar point list and the polar
chart, you may press a point on the chart to select it. If more than one point
is a possible candidate for selection, you will be shown a list of the candidates
so you may choose the point to be selected.
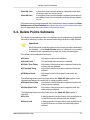
6.1. Polar Point List Context Menu
The polar point list context menu contains these items:
Show Point's
Details
Pop up the captured point dialog for the currently selected
point.
Change Point's
Job
Pops up a list of the currently known unlocked jobs so
you can choose the job that the currently selected point
will be moved to. This menu item is not shown when the
current job is locked.
Edit Point's Notes Pops up a dialog that displays the notes for the currently
selected point which you can then edit. Previously used
notes (history) can be selected from a drop-down list
which makes it very easy to reuse common phrases (e.g.
“added washer”, “moved washer forward”, etc.) This menu
item is not shown when the current job is locked.
Delete Points
Pops up the delete points submenu that lets you delete
groups of points from the database. This menu item is
not shown when the current job is locked.
Note
An individual point can also be deleted using
the captured point dialog context menu.
Show Only Items Only polar points that have notes will be displayed in the
With Notes
list.
30
www.smartavionics.com
Delete Points Submenu
Show All Jobs
A checkbox that controls whether captured points from
all known jobs are shown or not.
Show All Axes
A checkbox that controls whether captured points whose
axis differs from the current job's primary axis are shown
or not.
If the polar chart is being displayed, the context menu also contains the Colour
Background and Show Solution items from the polar chart context menu and
also (if applicable) the rotor mode context menu items.
6.2. Delete Points Submenu
The delete points submenu lets you choose a group of points to be deleted.
You will be asked to confirm the action before any points are really deleted.
Important
All of the points currently shown in the list are possible candidates
for deletion – if the Show All Jobs option is checked, it is possible
to delete all the captured points from all of the unlocked jobs!
The delete points submenu items are:
All Points
All points in the list are deleted.
Selected Point
The currently selected point is deleted.
All Older Than Today
All points in the list that were captured before the
current day are deleted.
All Captured Today
All points in the list that were captured today are
deleted.
All Without Notes
All points in the list that don't have notes are
deleted.
The following items are only shown when the Show All Jobs option is not
checked and when the current job is using propeller mode.
All Before Start Point
All points in the list that were captured before the
start point are deleted.
All After Start Point
All points in the list that were captured after the
start point are deleted.
The following items are only shown when the Show All Jobs option is
checked.
All In Job
A dialog opens to let you select a job and all points
in the list from the selected job are deleted.
All Not In Job
A dialog opens to let you select a job and all points
in the list that are not from the selected job are
deleted.
www.smartavionics.com
31
Captured Point Dialog
6.3. Captured Point Dialog
This dialog is displayed when a captured point is selected – a point can be
selected by short-pressing its polar point list entry. Also, when a point is first
captured by pressing the Capture button, it will be automatically selected if
the show point details after capture option is enabled in the job setup dialog.
The dialog is titled with the point's IPS
& DEG values. For propeller mode jobs,
if the point is a start point, that will be
indicated in the dialog's title.
The dialog displays the point's details
and a short description of the vibration
level.
Use the Android device's back button to
dismiss the dialog.
Fig 6.2. Point Details
A short press on the dialog will display
the point on a polar chart as a filled circle (X axis point) or diamond (Y axis
point). Other points from the same job are shown unfilled. Press the Android
device's back button to dismiss the chart. Long pressing the dialog will display
the captured point context menu.
6.3.1. Propeller mode
If the point is a start point, an estimate of the amount of weight required to
1
correct the imbalance is shown .
Otherwise, for non-start points, if a start
point has been defined for the job,
instructions on how to improve the
balance (a “solution”) are displayed.
The instructions tell you how the
position and mass of the trial weight
should be altered to reduce the level of
vibration.
Directions are in terms of propeller
rotation, forward means in the direction
Fig 6.3. Balance Solution
of rotation and backwards means
opposite to the direction of rotation.
1
The estimate assumes that the engine is less than 100HP, larger engines and heavier propellers will require
more weight (+25% for engines 100-300HP, +200% for engines 300+HP).
32
www.smartavionics.com
Rotor mode
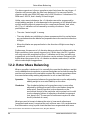
6.3.2. Rotor mode
If move lines have been defined for the current job's primary axis, the dialog
shows the suggested adjustment for each move line.
6.3.3. Captured point dialog context menu
Long pressing the the captured point dialog pops up a context menu
containing these items:
Use As Start Point
Use this point as a start point. This item is only
available for propeller mode jobs.
Show Waveform
Opens a graph view to graphically display the
acceleration data associated with the current polar
point.
a
Show Related Spectrum Searches for a related spectrum whose capture
time most closely matches the point's capture time.
If a spectrum is found that differs in capture time
by no more than 30 seconds, it is displayed. Press
the Android device's back button to dismiss the
spectrum view.
Show On Polar Chart
Displays the point on a polar chart as a filled circle
or diamond. Press the Android device's back button
to dismiss the chart.
Edit Point's Notes
Opens a dialog so that you can edit the notes
associated with this point. This menu item is not
shown when the current job is locked.
Change Point's Job
Pops up a list of the currently known unlocked jobs
so you can choose the job that the currently
selected point will be moved to. This menu item is
not shown when the current job is locked.
Export Image
Exports the current view as a JPEG or PNG image.
Delete
After confirmation, the point is deleted from the
database. This menu item is not shown when the
current job is locked.
a
A spectrum is related if it has the same job and accelerometer axis as the point.
www.smartavionics.com
33
34
www.smartavionics.com
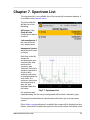
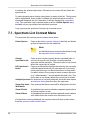
Chapter 7. Spectrum List
The spectrum list is a scrollable list of the current job's captured spectra. It
is invoked via the options menu.
The list's bold title
will be one of the
following:
All Spectra, if the
Show All Jobs
context menu item is
checked.
Job name Spectra, if
the curent job has
non-empty name.
Anonymous Spectra,
when the job's name
is empty.
Each line in the list
shows the
accelerometer axis
used and the date
and time the
spectrum was
captured. If the list is
showing spectra for
all jobs, each
spectra's job name
is displayed after the
axis name. If a
spectrum has notes
associated with it,
they are also
displayed after the
job name.
Fig 7.1. Spectrum List
If a spectrum was
captured today, the list entry's background will be white, otherwise, grey.
Pressing the Android device's back button will return you to the previous
screen.
If the divide screen preference is enabled, the screen will be divided into two
halves: one half will contain the spectrum list and the other half will be used
www.smartavionics.com
35
Spectrum List Context Menu
to display the selected spectrum. Otherwise, the screen will just show the
spectrum list.
To select a spectrum to display, short press its entry in the list. The list entry
will be highlighted. If the screen is divided, the selected spectrum will be
displayed alongside the list. Otherwise, it will be displayed in a spectrum
view. The spectrum view's context menu now has a Delete Spectra entry
available so you can delete that individual spectrum.
Long-pressing the spectrum list pops up a context menu.
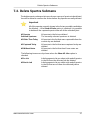
7.1. Spectrum List Context Menu
The spectrum list context menu contains these items:
Delete Spectra
Pops up the delete spectra submenu that lets you delete
groups of spectra from the database.
Note
An individual spectra can also be deleted using
the spectrum view context menu.
Change
Spectrum's Job
Pops up a list of the currently known unlocked jobs so
you can choose the job that the currently selected
spectrum will be moved to. This menu item is not shown
when the current job is locked.
Edit Spectrum's
Notes
Pops up a dialog that displays the notes for the currently
selected spectrum which you can then edit. Previously
used notes (history) can be selected from a drop-down
list which makes it very easy to reuse common phrases
(e.g. “added washer”, “moved washer forward”, etc.) This
menu item is not shown when the current job is locked.
Analyse Spectrum If a spectrum is currently selected, this menu item opens
an analysis dialog that describes the spectrum.
Show Only Items Only spectra that have notes will be displayed in the list.
With Notes
Show All Jobs
A checkbox that controls whether captured spectra from
all jobs are shown or not.
Show All Axes
A checkbox that controls whether captured spectra whose
axis differs from the current axis are shown or not.
If a spectrum is being displayed, the context menu will also contain items
from the spectrum view context menu.
36
www.smartavionics.com
Delete Spectra Submenu
7.2. Delete Spectra Submenu
The delete spectra submenu lets you choose a group of spectra to be deleted.
You will be asked to confirm the action before any spectra are really deleted.
Important
All of the spectra currently shown in the list are possible candidates
for deletion – if the Show All Jobs option is checked, it is possible
to delete all the captured spectra from all of the unlocked jobs!
All Spectra
All spectra in the list are deleted.
Selected Spectrum
The currently selected spectrum is deleted.
All Older Than Today
All spectra in the list that were captured before the
current day are deleted.
All Captured Today
All spectra in the list that were captured today are
deleted.
All Without Notes
All spectra in the list that don't have notes are
deleted.
The following items are only shown when the Show All Jobs option is
checked.
All In Job
A dialog opens to let you select a job and all spectra
in the list from the selected job are deleted.
All Not In Job
A dialog opens to let you select a job and all spectra
in the list that are not from the selected job are
deleted.
www.smartavionics.com
37
38
www.smartavionics.com
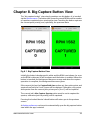
Chapter 8. Big Capture Button View
The “big capture button” view simply contains one big button. It is invoked
via the options menu. The button text shows the current RPM and the number
of captures completed since starting the view. Touching the button captures
the current polar point(s) and, optionally, the spectrum data.
Fig 8.1. Big Capture Button View
Initially, the button's background is white and the RPM is not shown. As soon
as the RPM is detected, it will be shown and the button is enabled. When the
button is touched, the background becomes orange and when the capture
operation is complete, the background becomes green.
If the current job has the Capture Both Axes option set, then polar points and
spectra from both the X and Y axes will be captured. Otherwise, only points
and spectra from the current job's primary axis (X or Y) will be captured.
The current job's Also Capture Spectra option must be set to capture the
spectra, otherwise just the point(s) will be captured.
Pressing the Android device's back button will return you to the previous
screen.
A display preference can be set to automatically open the big capture button
view when the app is started.
www.smartavionics.com
39
40
www.smartavionics.com
Chapter 9. Options Menu
Pressing the Android device's menu button pops up an options menu
containing these items:
Show Tabs
If the Hide Tabs preference has been set, this menu item
is available to make the tabs visible again.
Pause/Continue
Toggles the current view's paused state – when paused,
the view is not updated. If your Android device has a
hardware keyboard, the space key also toggles the paused
state.
Export Image
Exports the current view as a JPEG or PNG image.
Help
Pops up a submenu that let's you choose which manual
to view (PB-3 manual or the app manual). If the chosen
a
manual can be found locally on the Android device, it will
b
be displayed using your preferred PDF reader . If the
manual cannot be found locally, an attempt will be made
c
to download it from the Smart Avionics website .
Job
Pops up the job submenu.
List Points
Displays the polar point list.
List Spectra
Displays the spectrum list.
PB-3 Options
Pops up the PB-3 options submenu. This menu item is
only shown if the Data Source preference is set to PB-3.
Dummy Data
Options
Pops up a submenu that gives you access to the dummy
data setup dialog. This menu item is only shown if the
Data Source preference is set to Dummy.
Big Capture
Button
Invokes the big capture button view.
Two Plane
Balancing
Invokes the two plane balancing view.
Export Data
Pops up the export data submenu.
Import Data
Pops up the import data submenu.
Database
Pops up the database submenu.
Point Logger
Pops up the point logger submenu.
Preferences
Opens the app's preferences view.
About
Opens a dialog that displays hardware and software
revision numbers, copyright information and the PB-3's
Bluetooth address. To make it easy to check you are using
the latest version of the app, a button is provided that
opens the app release history page at
www.smartavionics.com in a web browser.
www.smartavionics.com
41
Job Submenu
Quit App
Quits the app and returns you to the Android home screen.
A dialog will pop up to confirm the action. If you would
rather not have the confirmation dialog, there is a
preference to suppress the quit dialog.
Back To Top
Returns you to the current top-level view. This menu item
is only shown when the current view is not a top-level
view.
a
The following directories located on the Android device's external storage (sdcard) are searched
for the manual: PropellerBalancer, download, downloads and Downloads.
b
You need a PDF reader app to be installed on your Android device to be able to read the manuals.
c
The stock Android browser will not download the PDF files unless a PDF reader app is already
installed.
9.1. Job Submenu
This menu contain items related to creating and configuring jobs:
Switch Axes
This item toggles the job's primary axis between the X
and Y axes.
Last Job
Make the previous current job the current job again. Each
press of this item toggles between the two most recently
used jobs.
Switch Job
This item presents a list of all the known job names so
you can select the job that is to become the current job.
All new polar points and spectra that are captured will be
associated (tagged) with this job. The job names are
initially listed in alphabetic order. A dialog button toggles
between alphabetic ordering and job age ordering. A job's
age is simply the age of the job's last captured point or
spectrum.
New Job
Opens a dialog so that you can enter a name for the new
job. When the name has been entered, two buttons are
enabled that let you choose between creating the new
job with default parameters or creating the new job with
parameters that are copied from an existing job. When
you press the latter button, you will be presented with a
list of all the existing jobs and you can select one to copy
the parameters from. The new job is created and the job
setup dialog is opened so that you can configure the job.
If you enter a name that is already in use, you are given
the option to switch to that job and if you decline to do
that, the new job name dialog reappears and gives you
the chance to enter a new job name.
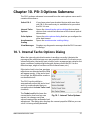
Setup Job
42
This item opens the job setup dialog.
www.smartavionics.com
Job Submenu
Rename Job
This item presents a dialog into which you can enter the
new name for the current job. It won't let you use a name
that is already in use.
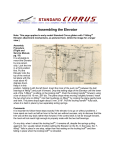
View Report
This item generates a job report in the form of a page of
HTML which you can subsequently export via email,
Dropbox, etc. The report shows a simplified polar chart
and a table containing the polar point details. You can
select from the following options which determine the
points to be included in the report:
All Points - all of the job's points are included.
Interesting Points - all “interesting” points are included.
Interesting points are those that have notes, the start
point, the first and last points and any other point that
differs markedly (in terms of the IPS and Deg values) from
the previous included point.
First And Last Points - only the first and last points are
included.
The report is formatted for a minimum screen width of
800 pixels and it is best viewed using a recent Web
Browser (i.e. Chrome, Firefox, IE9) on a PC/laptop. Use
the Export menu option to export the report from the
Android device.
Fig 9.1. Propeller Balance Report
www.smartavionics.com
43
Job Setup Dialog
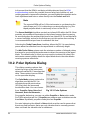
9.2. Job Setup Dialog
This dialog provides the means to configure the current job. Some of the
configuration values are specific to the job's mode (propeller or rotor). The
common values are:
Locked
A checkbox that, when checked, “locks” the job and all
of its points and spectra so that it cannot be configured,
deleted, renamed, etc.
Mode
The job's mode, Propeller or Rotor.
Tacho Channel
The tachometer channel to use, Internal or External.
Primary Axis
The primary accelerometer axis (X or Y).
Capture Both Axes A checkbox that, when checked, enables data capture for
both accelerometer axes.
Also Capture
Spectra
When this checkbox is checked, a spectrum will be
captured immediately after a point is captured.
Show Point Details When this checkbox is checked, the captured point dialog
After Capture
is displayed automatically after a point is captured.
X Axis Alias
An alternative name for the X axis which will be used in
all views.
Y Axis Alias
An alternative name for the Y axis which will be used in
all views.
9.2.1. Propeller mode job setup
For propeller mode jobs, this item can be configured:
PSRU Ratio
Here you can specify the gearbox ratio of the engine's
Propeller Speed Reduction Unit (PSRU). This ratio is used
for two purposes:
• In propeller mode, the PB-3 averages multiple propeller
cycles for each reading it takes to reduce the effect of
engine vibration. The optimal number of propeller
cycles to average per reading depends on the PSRU
ratio.
• Given the PSRU ratio, the app can determine the engine
RPM which is displayed on the data view and also used
to label spectra displayed by the spectrum view.
You can specify the PSRU ratio by either selecting one of
the known engine types from the Engine spinner or by
entering the ratio directly into the Ratio text field. The
known ratios are:
44
www.smartavionics.com
Rotor mode job setup
Ratio
Engine type
1.0
No PSRU (direct drive engine or gyroplane
rotor)
1.82
Subaru (Eggenfellner)
2.12
Subaru (NSI)
2.27
Rotax 912
2.43
Rotax 912S & 914
9.2.2. Rotor mode job setup
For rotor mode jobs, 3 angles (in degrees) can be entered:
• The directions of the positive X and Y accelerometer axes.
• The direction of the master blade at the point at which the tachometer is
triggered.
The angles are measured to the datum in the direction of rotation (the datum
is located at the 12 o'clock position on the polar chart).
For example, if the X accelerometer positive axis was orientated in the 3
o'clock direction, the angle from it to the datum would be 90 degrees. Note
that it is also possible to configure these angles graphically using the move
markers polar chart context menu item.
9.3. Point Logger Submenu
The PB-3 has the capability to autonomously log polar points. Once logging
has been configured and enabled, the PB-3 will continue to capture polar
points as long as it is switched on. Later, the logged polar points can be
fetched from the PB-3 to the Android device.
The point logger works like this: the PB-3 continuously captures polar points
(each point is a triple of RPM, IPS, DEG and their associated standard
deviations) and accumulates each polar point into a “bucket”. There can be
a number of buckets configured and which bucket a particular point is
accumulated into depends on the point's RPM. The configuration dialog
described below allows you to specify the minimum and maximum RPM
values the buckets cover and how wide (in terms of RPM) each bucket is.
The point logger submenu contains these items:
Start Logger
www.smartavionics.com
Activates the logger – if the logger already has some
logged data, you will be asked if you want to clear that
data first. Once the logger has been activated, you may
45
Point logger configuration dialog
quit the app and the logger will continue to log data. If
you turn the PB-3 off, the next time you turn it on again
it will continue to log data.
Stop Logger
Deactivates the logger.
Get Logged Data Fetches the logged data from the PB-3 and enters it into
the polar point database. The logged data is cleared from
the PB-3. You do not need to stop the logger before
fetching the data.
Clear Logged Data Deletes any logged data stored in the PB-3 (does not
delete any polar points from the database).
Configure Logger Pops up the logger configuration dialog described next.
9.3.1. Point logger configuration dialog
The point logger configuration dialog
contains these items:
Min RPM – the minimum RPM of
interest, all polar points that have an
RPM less than this will be ignored.
Max RPM – the maximum RPM of
interest, all polar points that have an
RPM greater or equal to this will be
ignored.
Width – the width (in RPM) of a single
logger bucket.
Fig 9.2. Point Logging
Log X & Log Y – a pair of checkboxes that determine which axes will be
logged.
Use the Android device's back button to dismiss the dialog.
1
The values shown in the example dialog would produce 20 logger buckets
and the RPM ranges of the buckets would be 1000-1049, 1050-1099,
1100-1149 ... 1950-1999. Both the X and Y axes would be logged.
When the logged data is uploaded from the PB-3, each non-empty bucket
will provide a single polar point which is an average of the points that were
accumulated into the bucket.
9.4. Database Submenu
The database holds all of the polar points and spectra that have been
captured. It is stored on the Android device as an sqlite database file that is
1
(2000 - 1000) / 50
46
www.smartavionics.com
Export Data Submenu
not directly accessible by other apps. The database submenu provides actions
for sharing, saving, loading and clearing the contents of the database.
Note
Two of the actions described below require the user to choose the
name of a file located on the Android device's external storage (SD
card). Unfortunately, the Android system earlier than version 4.4
(KITKAT) does not provide a file chooser. To obtain that
functionality, you need to install a compatible File Manager app.
Currently, the only compatible app is the OI File Manager which
may be installed from the Market or downloaded from
www.openintents.org.
The database submenu contains these items:
Share Database
This saves the current database into a temporary sqlite
file and then prompts you to select an app to share
(export) that file. Most devices should already have an
email client (gmail) that can share the database file as
an attachment. If you install a cloud storage app like
dropbox, you can use that to send the database file
directly to other computers.
Save Database
This invokes a file chooser so that you can specify the
name and location of a file to save the database into
(sqlite format). A default filename is supplied but you can
alter that if you wish.
Load Database
This menu item invokes a file chooser so that you can
select the sqlite file whose contents will be loaded (after
confirmation) into the database. Loading a file into the
database will delete all of the existing data in the
database so if you want to access that data again, save
the database first.
Clear Database
After confirmation, all of the data in the database is
deleted. Save the database first if you want to access
that data again.
9.5. Export Data Submenu
The export data submenu provides the means to export polar point or
spectrum data from the app. You can export the data in either CSV (Comma
Separated Values) format which is suitable for importing into spreadsheet
applications or as SQL statements that may be imported into the propeller
balancer app on another Android device. You can limit the data output to a
specific job or you can output data for all jobs.
The submenu provides these items:
www.smartavionics.com
47
Import Data Submenu
Export CSV Data This menu item pops up a dialog that let's you specify
which items are to be shared. You can select either polar
points or spectra to be output as CSV data which is
suitable for importing into a spreadsheet. The spectral
line values can be output as velocities (V) or accelerations
(A). The CSV data format is described in Appendix A.
Export SQL Data This menu item pops up a dialog that let's you specify
which items are to be shared. You can select polar point
and/or spectrum data to be output as SQL statements
which are suitable for importing into the propeller balancer
app (or another sqlite compatible application.)
9.6. Import Data Submenu
The import data submenu provides the means to import data (points and/or
spectra) that has previously been exported from the app as SQL statements.
Note
The action described below requires the user to choose the name
of a file located on the Android device's external storage (SD card).
Unfortunately, the Android system earlier than version 4.4 (KITKAT)
does not provide a file chooser. To obtain that functionality, you
need to install a compatible File Manager app. Currently, the only
compatible app is the OI File Manager which may be installed from
the Market or downloaded from www.openintents.org.
The submenu provides this item:
Import SQL Data This menu item invokes a file chooser so that you can
select the file containing SQL statements to be imported.
9.7. Preferences View
This view is accessed through the options menu. It contains these items:
9.7.1. Display Preferences
Screen Orientation A spinner that lets you select one of Unspecified, Portrait
or Landscape. Selecting either Portrait or Landscape will
force the app to use that screen orientation irrespective
of the orientation of the Android device. Otherwise, the
screen orientation will be determined by the Android
device's global settings.
48
www.smartavionics.com
General Preferences
Divide Screen
A spinner that determines whether the screen should be
divided into two areas when displaying lists of points or
spectra. The choices are:
Yes
Always divide the screen (even when it is small).
No
Never divide the screen (even when it is large).
Auto
Divide the screen if the largest dimension is at
least 480 pixels.
Hide Status Bar
A checkbox that, when enabled, hides the Android status
bar. If you change this parameter, you will need to exit
the app and restart it for the change to have an effect.
Hide Title Bar
A checkbox that, when enabled, hides the app's title bar.
If you change this parameter, you will need to exit the app
and restart it for the change to have an effect.
Hide Tabs
A checkbox that enables the hiding of the view select tabs
immediately after a view has been selected. When the
tabs are hidden, the first item in the options menu will
redisplay the tabs so you can then select a different view.
If the height of the Android device's screen is limited,
enabling this option makes better use of the available
screen area.
Show Zoom
Controls
A checkbox that enables the display of zoom controls
when zooming is possible (i.e. when the polar chart view
is in pan-zoom mode). If your Android device supports
multi-touch, you can hide the zoom controls and use
“pinch-zoom” gestures to zoom the display.
Use Legacy Polar A checkbox that enables the legacy modal polar
Pan & Zoom
pan-zoom behaviour.
Auto-start Big
Capture Button
Enabling this checkbox will automatically open the big
capture button view when the app starts.
User Interface
Language
The language to use for all User Interface text (buttons,
menus, etc.) Can be set to “System Default”, “English” or
“French”. Please note that due to a limitation of the
Android system, changing the language here doesn't have
an immediate effect. Rotating the screen and selecting
the options menu can be sufficient to cause the displayed
language to change but you may actually have to
completely kill the app and restart it to get the desired
result.
9.7.2. General Preferences
Confirm Quit
www.smartavionics.com
A checkbox that enables the confirm quit dialog.
49
Dummy Data Setup Dialog
Data Source
A spinner that chooses the source of the acceleration and
tachometer data used by the app. In normal operation
this should be set to PB-3 so that you can carry out real
propeller balancing but it may be set to Dummy in which
case the app just uses simulated data.
If you change this parameter, you will need to exit the app
and restart it for the change to have an effect.
When using simulated data, the app no longer shows any
PB-3 related menu items or dialogs. Instead, there is a
dummy data setup dialog that is accessed through the
options menu.
Exported Image
Format
A spinner that chooses the format for exported images.
The choices are JPG and PNG.
CSV File Suffix
The file suffix used for exported CSV files (default “csv”).
SQL File Suffix
The file suffix used for exported SQL files (default “sql”).
9.8. Dummy Data Setup Dialog
This dialog features a number of
sliders that adjust the parameters
used to generate the simulated
data values.
If the display is tall enough, the
dialog will also contain a polar
chart that shows a single polar
point that has been generated from
the current parameter values.
Fig 9.3. Dummy Data Setup
50
www.smartavionics.com
Chapter 10. PB-3 Options Submenu
The PB-3 options submenu is accessed from the main options menu and it
contains these items:
Select PB-3
If you have paired your Android device with more than
one PB-3, this menu entry is available to let you select
the PB-3 to use.
Internal Tacho
Options
Opens the internal tacho options dialog that contains
options that control the behaviour of the internal optical
tachometer.
Polar Options
Opens the polar options dialog that lets you configure the
polar data source.
Accelerometer
Scaling
Opens the accelerometer scaling dialog.
View Messages
Displays any diagnostic messages that the PB-3 has sent
to the app.
10.1. Internal Tacho Options Dialog
When the internal optical tachometer is working correctly, it detects the
passage of the reflective tape once per propeller revolution. For that to occur,
a threshold value, the tacho level, must be set to an appropriate value for the
given conditions (ambient light strength, distance from the PB-3 to the
reflective tape, angle of incidence of the infrared beam, etc.)
If the tacho level is too low, spurious
reflections are detected and the RPM
will appear erratic. If the tacho level
is too high, the RPM will be erratic or
not detected at all.
The PB-3 has the ability to
automatically adjust the tacho level
and it is recommended that you
normally select the Auto Tacho Level
checkbox.
The Tacho Level field shows the
current tacho level and you can
Fig 10.1. Internal Tacho Options
expect it to change every few
seconds owing to the automatic level
adjustment. The dialog also displays the current propeller RPM so you can
see if it is being reliably detected.
www.smartavionics.com
51
Polar Options Dialog
In the event that the RPM is not being reliably detected (see the RPM
troubleshooting section for possible reasons why that could be so) and
nothing appears to improve the situation, you can disable the automatic tacho
level adjustment and enter a value directly into the Tacho Level field.
Note
The reported RPM will be 0 if the tachometer is not detecting the
optical tape and 1 if it is detecting a constant reflection (e.g. the
taped propeller blade is stationary in front of the PB-3).
The Sensor Backlight checkbox controls an infrared LED within the PB-3 that
provides extra ambient illumination to the infrared sensor, thus increasing
its sensitivity when the ambient light level is low. Not all PB-3's are fitted with
a sensor backlight and so for those that are not, this option does nothing. It
is recommended that you leave it enabled all the time.
Selecting the Tacho Power Save checkbox allows the PB-3 to save battery
power when the reflection from the taped blade is sufficiently bright.
The Min Tacho Pulses spinner sets the minimum number of infrared pulses
that must be received by the tachometer to detect the passing of the taped
blade. The default value is 4 but you may need to increase the value if the
tachometer cannot reliably detect the taped blade due to the other blades
causing spurious reflections.
10.2. Polar Options Dialog
This dialog contains options that
select the origin of the polar point
data and how the PB-3 averages that
data. These options have no effect
on the spectrum display.
The Polar Mode spinner selects the
algorithm used by the PB-3 to
calculate the polar point values
(IPS/Deg) from the measured
acceleration data. You can choose
from: Propeller, Rotor, Rotor 2nd
Harmonic, Rotor 3rd Harmonic, ...
Fig 10.2. Polar Options
For propeller balancing, you can use either Propeller or Rotor polar mode.
For PSRU ratios that are not 1, Propeller can produce more consistent results
than Rotor. By default, propeller mode jobs use Propeller.
For rotor balancing, the default is Rotor which must be used to ensure that
the strong 2nd harmonic (twice per rev) vibration that is normally present
does not mask the vibration due to imbalance.
52
www.smartavionics.com
Accelerometer Scaling Dialog
If you are interested in determining the amplitude and phase of a particular
harmonic, use the appropriate Rotor ? Harmonic option.
The Average Points spinner sets the number of polar points to average when
calculating the current RPM, IPS and DEG values and their associated standard
deviations. The default value is 5.
When the polar mode is set to Propeller, the acceleration data is averaged
over multiple propeller cycles to reduce the effect of spurious vibration. If the
PSRU ratio has been set to 1.0, the number of cycles averaged is an even
number that is proportional to the sensed RPM. The higher the RPM, the more
cycles are averaged.
The Min Cycles spinner sets the minimum number of cycles to be averaged
when the PSRU ratio is 1.0. The default value is 4.
10.3. Accelerometer Scaling Dialog
The ADC counts per G values
determine the scaling of the
accelerometer inputs. Unless the
characteristics of the PB-3 or the
accelerometer are altered, these
values should not need changing
1
from the default . For each of the
accelerometer axes (X and Y), the
current ADC counts value is displayed
along with the calculated G value and
the counts per G configuration value
which may be edited to alter the
scaling.
Fig 10.3. Accelerometer Scaling
Note
As the accelerometers are DC coupled you can use gravity to
calibrate them. With an accelerometer sensing axis pointing straight
down, the reported G value should be close to either + or - 1G. If
you then reorientate the accelerometer so that the sensing axis is
straight up, the reported G value should be close to 1G again but
in the other direction (i.e. if it was +ve before, now it should be -ve,
and vice versa).
Some offset is to be expected (and does not affect the operation
of the balancer) so the aim is to get the span to be equal to 2G. For
example, -0.95 to 1.05 has a span of 2.
To calibrate an accelerometer axis, simply subtract the smaller of
the ADC counts per G values from the larger and divide the result
1
If the ADC counts per G value is not shown on the accelerometer label, assume a default of 1123.
www.smartavionics.com
53
Accelerometer Scaling Dialog
by 2. Enter that number in the input field and then check that the
span really is 2G.
54
www.smartavionics.com
Chapter 11. Propeller Balancing
11.1. Minimising Other Sources of Vibration
Propeller mass imbalance can be a major source of vibration. However, there
are other sources of vibration as well. To minimise the overall vibration level
and to make the dynamic balancing process more effective, all other sources
of vibration must be minimised before dynamic balancing is carried out.
Important
Unless the engine is running smoothly, there is little point in trying
to balance the propeller. Carburettor imbalance, dirty plugs, loose
engine mounts and general wear and tear are just some of the
reasons why the engine could be producing excess vibration.
Propellers with an adjustable blade pitch will produce a lot of vibration if all
the blades are not set to the same pitch. This is critical: if a blade's pitch
differs from its neighbours' by even a fraction of a degree, it will produce
vibration that appears to be caused by mass imbalance but cannot actually
be removed by mass balancing.
Important
Before attempting to dynamically balance a variable pitch propeller
(either ground adjustable or in-flight adjustable), confirm that the
blades' pitch are equal to within the tolerance specified by the
propeller's manufacturer (typically, 0.25°).
11.2. Propeller mass imbalance
A major source of propeller vibration is propeller mass imbalance. When an
object rotates around an axis, if the mass of the object is not uniformly
distributed around that axis, a force (the centripetal force) will be generated
and will cause vibration. As the magnitude of the force is proportional to the
square of the rotational velocity, at high RPMs (high rotational velocity) even
a small mass imbalance in a propeller will generate an appreciable amount
of force (and hence vibration). This vibration can be measured by mounting
a sensor on the engine as close to the propeller as possible. Conventionally,
the magnitude of a propeller's vibration is reported as a peak velocity in units
of Inches Per Second (IPS).
11.3. Static Propeller Balancing
A propeller can be statically balanced in the workshop using a static balancing
tool. This often involves suspending the propeller from its central axis. If the
www.smartavionics.com
55
Dynamic Propeller Balancing
1
propeller is statically balanced, the blades should be level . If one blade is
heavier than the others (or its centre of mass is further from the centre of the
propeller), it will dip towards the floor. If this occurs, weight can be added to
the hub on the opposite side of the central axis to the dipping blade to bring
the propeller level.
All propellers should be manufactured with blades that have equal mass (and
mass distribution) and so a new propeller should not require static balancing.
Propellers that have suffered damage to the blades (stone chips or tip
abrasion) may well benefit from being statically balanced.
While statically balancing a propeller is worthwhile, the best results will be
obtained if the propeller is dynamically balanced together with the spinner.
11.4. Dynamic Propeller Balancing
Dynamic propeller balancing involves measuring the actual rotational vibration
generated at a realistic propeller RPM and then adding weights to the propeller
hub or spinner backplate to minimise the measured vibration level. Because
the balancing operation is carried out with the propeller and spinner attached
to the engine, the best possible solution is obtained.
The vibration is measured using a sensor known as an accelerometer. The
accelerometer is securely attached to the engine as close to the propeller as
possible and it measures the acceleration of the front of the engine in one
direction (normal to the propeller shaft). If the propeller is out of balance, as
the centre of mass rotates around the axis of rotation, the resulting centripetal
force tries to pull the propeller (along with the spinner and engine) towards
the centre of mass. This rotating imbalance force acts on the mass of the
engine/propeller combination and accelerates it. It is this acceleration that
is measured by the accelerometer.
If the accelerometer was very selective and
+ve
measured only the vibration caused by the
rotating out-of-balance propeller, the signal it
produced for one rotation of the propeller would
look like a sine wave as shown here. In reality,
0
the measured acceleration waveform is much
more complex than a simple sine wave. This is
mainly because of the vibration generated by
the engine and also the turbulence generated
by the rotating propeller blades. The dynamics -ve
of the engine mountings also affect the
waveform.
Fig 11.1. Sine Wave
The balancer's processing unit digitises the
measured acceleration waveform and uses the resulting numbers to calculate
1
The propeller will be statically balanced when the mass of each blade multiplied by the distance from the
blade's centre of mass to the centre of the propeller is the same for all the blades.
56
www.smartavionics.com
Taking a Vibration Reading
the magnitude of the vibration signal. This magnitude is reported as a peak
velocity in units of Inches Per Second (IPS).
The accelerometer senses the magnitude of the vibration but more information
is required to carry out the balancing process. This is because it is not
sufficient to know just the magnitude of the vibration signal. It is also
necessary to know the phase of that signal. The phase of the signal is the
relationship of the signal waveform to the angular position of the propeller.
Given the phase information, it is possible to determine where the weight is
required to be added to reduce the vibration. By detecting when one particular
propeller blade passes an optical sensor, the balancer can measure and
report the phase of the vibration waveform. The optical sensor also works as
a tachometer to measure the propeller RPM.
11.5. Taking a Vibration Reading
Warning
Propellers can kill.
Make sure that the engine ignition is switched off before touching
the propeller.
Always assume that the engine could fire when the propeller is
being moved.
Make sure that the aircraft is securely chocked or tied down while
carrying out the balancing process.
Please see the PB-3 Propeller Balancer Manual for a description of the PB-3
sensors and how they are attached to the aircraft.
For maximum accuracy, the dynamic balancing process should only be carried
out in light winds. Ideally, the wind should be less than 5 kts. The aircraft
should be positioned so that it is pointing into any wind.
Important
Before you start the engine, check that the job parameters and
PB-3 options are all set appropriately.
Make sure the engine is thoroughly warm before taking any readings.
Firstly, you need to decide what propeller RPM you are going to use while
balancing. For a typical propeller, an RPM in the range 1500-2000 is often a
good choice. Using the polar chart view, observe the movement of the current
polar point circle and its associated grey “standard deviation ellipse”. If you
think it is necessary, adjust the throttle to find the RPM that minimises the
variation in the current point's position and the size of the ellipse.
www.smartavionics.com
57
Taking a Vibration Reading
Note
When you adjust the throttle it will take a few seconds for the
readings to settle down and a “Toast” will pop up to tell you that
the RPM is not steady enough to capture a reading.
Important
Once you have determined the best RPM to use, it is important to
use the same RPM for each balancing run so that you get consistent
results.
With a steady RPM being reported by the balancer, press the Capture button
to capture a polar point. The point's details will be displayed in the captured
point dialog – press the back button twice to return to the polar chart view.
Capture a few points – if the propeller is obviously out of balance, the points
will be clustered together some distance away from the centre of the chart.
Now stop the engine and double-check that the ignition is switched off.
If the vibration level is already 0.15 IPS or less, the propeller can be considered
reasonably well balanced – in ideal conditions, the balancer is capable of
balancing a propeller down to about 0.03 IPS so you may wish to continue
the process to achieve a better result. If you want to improve the balance,
you must carry out the balancing procedure as described in the next section.
Tip
To reduce battery drain in the PB-3 and the Android device, it is
best to exit the app using the back button when you are not actually
capturing points or viewing the live data. When you are ready to
capture a new point, just restart the app.
58
www.smartavionics.com
Balancing Procedure
11.6. Balancing Procedure
Important
It is the operator's responsibility to ensure that any procedures or
guidelines that have been issued by the manufacturers of the
propeller, engine or aircraft or some other agency (e.g. the
FAA/CAA/LAA/BMAA), that specify how the propeller is to be
balanced, are adhered to.
The following instructions describe the balancing process from the
point of view of operating the balancer and determining where
balance weights are to be attached. The exact detail of how balance
weights are attached to the hub or spinner backplate is beyond the
scope of this document. If you have any doubt, please consult your
inspector/engineer.
The position and the mass of the required balance weight is determined as
follows:
2
1. With no balance weights attached to the propeller , capture one or more
points. Using the captured point dialog, choose one of those points to be
the start point.
2. Now attach a trial weight. The angular position of the weight is not
important at this stage. For a typical composite propeller, a few AN970
washers would be a reasonable initial trial weight. So, having checked the
ignition is switched off, securely attach the trial weight using an approved
method.
3. With the trial weight in place, capture a few more points. When each point
is captured, the resulting captured point dialog shows a solution that tells
you how the amount of weight and its position should be altered to improve
the balance. If the propeller is well out of balance, all of the displayed
solutions should be quite similar. If the propeller is only slightly out of
balance or there is an appreciable amount of vibration from other sources,
the solutions will vary more and you will have to interpolate between them.
Adjust the position and amount of weight accordingly and capture some
more points to see what difference that has made.
Note
If you need to attach the weight at a position that falls between
the available attachment points, it should be possible to attach
two smaller weights either side of that position such that their
combined influence is equal to the influence required – i.e. if
you need to have 3 washers at a position that is 1/3 of the way
2
Apart from any weights that were added during static balancing – don't remove those.
www.smartavionics.com
59
After Balancing
between two attachment points, you could put 2 washers on the
preceding attachment point and 1 washer on the next attachment
point (this assumes the attachment points are not more than,
say, 60° apart).
Depending on the quality of the captured points and how closely you follow
the instructions, you may well have to repeat this step a few times to get
the best result.
Note
The app does not actually say that the propeller is balanced or
not; it's left up to the operator to decide when to stop the process
based on the IPS achieved.
11.7. After Balancing
When the balancing has been completed, double-check that all balance
weights are securely attached. If you have been using temporary weights to
carry out the balancing, they should be replaced with permanent weights
whose mass and position are such that they have the same effect as the
temporary weights. If in doubt, recheck the balance once the permanent
weights are installed.
Remove the sensors and the tape from the propeller blade. Make an entry in
the appropriate log book to record the vibration level achieved and the RPM
used.
11.8. Troubleshooting
This section provides answers to common problems that can arise when
balancing.
11.8.1. The displayed RPM is erratic or wrong
The RPM could be unsteady for the following reasons (most likely first):
• The optical sensor is not pointing at the reflective tape or the tape is not
parallel with the sensor's window. It may help to add one or more further
strips of reflective tape to increase the width of the reflective area.
• The sun is shining directly into the optical sensor's window or being
“chopped” by the propeller.
• The optical sensor is either too close (< 15cm) or too far away (> 30cm)
from the propeller.
60
www.smartavionics.com
The current polar point position varies
widely
• The angle of incidence of the infrared beam on the propeller blade is outside
the acceptable range (15 - 40°).
• The sensor is being confused by extra reflections from shiny propeller
blades. Try increasing the value of Min Tacho Pulses. You can also try
adding non-reflective tape to the other blades in the same position as the
reflective tape.
• The engine RPM really is changing!
11.8.2. The current polar point position varies widely
This indicates that the vibration waveform is not consistent from one propeller
revolution to the next. This implies that some (perhaps most) of the measured
vibration is out of phase with the propeller. Any of the following problems will
cause the position of the polar point to vary:
• The incorrect PSRU ratio is being used.
• You are using the wrong accelerometer axis.
• The RPM is not being reliably detected. Unless the RPM is correct, the IPS
and DEG and their associated standard deviations are meaningless.
• The wind is gusting. At low vibration levels, just a few knots of wind can
make it appreciably harder to obtain reliable data.
• The engine is not running smoothly or the engine mounts are in poor
condition.
• You are using an RPM that is triggering an airframe resonance.
• The accelerometer is not securely mounted or the sensing axis is not
pointing at the propeller's axis of rotation or the sensing axis is parallel
with the direction of movement of the engine's pistons.
• The spinner is wobbling.
• The engine cowling is not fitted to minimise the effects of turbulence.
11.8.3. Adding weight does not reduce the vibration level
If the balancer shows a significant level of vibration with a small standard
deviation and adding weight doesn't appear to reduce the level or substantially
change the angle, any of the following could be true:
• The incorrect PSRU ratio is being used.
• You are using the wrong accelerometer axis.
www.smartavionics.com
61
Adding weight does not reduce the vibration
level
• The propeller is suffering from pitch imbalance (the blades don't have equal
pitch). Pitch imbalance has to be corrected before the propeller can be
dynamically balanced.
• The amount of weight being added is too small to have an effect. The
heavier the propeller/spinner, the more weight has to be added to reduce
a given level of vibration.
• The weight is not being added at the correct position.
62
www.smartavionics.com
Chapter 12. Rotor Balancing
Acknowledgement
Smart Avionics gratefully acknowledges the assistance freely given
by Mike Goodrich during the development and testing of the app's
rotor balancing capabilities. Mike provided much useful knowledge
that aided the development process and has tirelessly been the
guinea pig testing numerous versions of the software. Any errors
or omissions in the hardware, software or documentation are the
responsibility of Smart Avionics Ltd. and not Mike Goodrich.
This chapter aims to provide an overview of the rotor balancing process.
Although the emphasis is on gyroplane rotor balancing, it is also largely
applicable to helicopter rotors.
Please see the PB-3 Propeller Balancer Manual and the Red LED Tacho Sensor
Manual for details of how the sensors are attached to the aircraft.
12.1. Causes Of Rotor Vibration
Mass imbalance is one of the causes of rotor vibration and the PB-3 system
can help you balance the rotor to eliminate that vibration. Other vibrations
may also be present. In particular, gyroplanes often suffer strong vibration
at twice the rotor frequency. This “× 2” (times 2) vibration is often much larger
than the vibration due to imbalance and so even when the rotor has been
mass balanced satisfactorily, vibration will still be noticeable to the occupants.
Fig 12.1. Rotor Spectrum With Large × 2 Peak
www.smartavionics.com
63
Rotor Mass Balancing
The above spectrum is from a gyroplane rotor that shows the very large × 2
vibration still present after the rotor was balanced. You can see that the
vibration at the rotor RPM (350) was only 0.06 IPS but the × 2 vibration at 750
RPM was 2.93 IPS, that's nearly 50 times larger!
Unlike, rotor mass imbalance, the × 2 vibration cannot be suppressed by
simply adding weights. It is fundamental to the geometry of a (2 bladed) rotor
system and the physical properties of its components (blades, hub, mast,
etc.) The × 2 vibration can be caused by a variety of reasons. Some
possibilities are:
• The rotor “teeter height” is wrong.
• The rotor blades are exhibiting in-plane resonance which is excited twice
per revolution when the blades are perpendicular to the machine's direction
of flight.
• When the blades are perpendicular to the direction of flight more drag is
produced.
Furthermore, the amount of × 2 vibration being produced is influenced by the
flight conditions (rotor speed, airspeed, etc.) At this time, the PB-3 system
can only report the magnitude of the × 2 vibration and it does not offer any
suggestions as to how the level of vibration can be reduced. Perhaps in the
future when the causes of the × 2 vibration are better understood, it will be
able to make helpful suggestions.
12.2. Rotor Mass Balancing
When a propeller is balanced, it is normally the case that the balance weight
can be added almost anywhere on spinner backplate and so both the angular
position and amount can be varied as required. By contrast, gyroplane rotors
1
are mass balanced by making adjustments in one or two fixed axes :
Spanwise
The spanwise balance of a gyroplane rotor can be adjusted by
adding weight to one rotor blade tip or the other.
Chordwise
The chordwise balance of a gyroplane rotor is most often
adjusted by shifting the mass of the rotor blades along the
teeter pivot. Exactly how this is done depends on the
mechanical design of the particular rotor system but it could
involve changing shims or adjusting a threaded component
(nut, barrel, etc.) The amount of movement required is often
small (a fraction of a mm).
What you need to know to balance the rotor is how much adjustment
(magnitude and sense) is required for each of these axes. You can determine
that information using a polar chart that has been augmented with move
1
Don't confuse these axes with the accelerometer axes, they are different.
64
www.smartavionics.com
Defining move lines
lines. A move line is literally a line drawn on a polar chart that shows the
direction a polar point would move when a particular adjustment is made to
the system. For a gyroplane rotor, two move lines are required, one for the
spanwise balance and another for the chordwise balance.
Important
Before you start capturing any data, please ensure that the current
job has been configured correctly using the job setup dialog. It is
strongly recommended that you use the big capture button to
capture the data while flying as this greatly simplifies the user
interface. Also, if the machine has an open cockpit, take precautions
to avoid the Android device disappearing aft through the propeller!
If possible, attach it firmly to a knee pad or to the aircraft structure.
12.2.1. Defining move lines
It is straightforward to define a move line. All you have to do is capture two
or more polar points that correspond to known conditions and tell the app
what those conditions were.
For example, to define the spanwise move line you would add weight to one
of the rotor blade tips, capture a few polar points, move the weight to the
other rotor blade tip, capture a few more points, remove the weight again (to
return the rotor to the original condition) and, finally, define the move line.
The process can be repeated to define the chordwise move line. This time
the adjustments would involve shifting the rotor mass on the teeter pivot.
Once both move lines are defined, you can balance the rotor.
Important
To ensure that the move lines are good, follow this advice:
• Only make one adjustment at a time.
• Always fly the aircraft at the same speed and weight when
capturing the data.
• Fly smoothly and avoid turbulence.
• Capture multiple points (3, say) to avoid being fooled by a “rogue
point”.
• Make the adjustment large enough to produce a noticeable effect.
If you are unsure how big an adjustment to make, start small and
keep doubling the adjustment until it produces at least 0.5 IPS
(preferably 1 IPS) of movement on the polar chart compared to
the original condition.
www.smartavionics.com
65
Using the move lines to balance
Note
Move lines are only valid for a given flight condition (airspeed, AUW,
etc.) and sensor configuration. If you move the sensors or, say,
invert an accelerometer axis, the move lines will no longer valid.
Aircraft of the same type and configuration should have very similar
move lines so you may well be able to use move lines defined on
one aircraft on another aircraft.
12.2.2. Using the move lines to balance
With the move lines defined, fly again in the original configuration (no weights
added or rotor shifting) and capture a few polar points. If you now select one
of those points in the polar point list the point's captured point dialog will
show the suggested adjustments required to improve the balance. Carry out
the suggested adjustment and capture some more points. Repeat as required.
Although multiple adjustments may be suggested, it is recommended that
you only make one adjustment at a time and then capture further polar points
for comparison. It is also recommended that you make use of the feature that
allows you to add a note (some text) to a polar point so that you can track
the adjustments you make.
66
www.smartavionics.com
Chapter 13. Two Plane Balancing
This manual has so far described how propellers and rotors can be balanced
by measuring the vibration in a single plane (I'm referring to the abstract
geometric surface, not the aircraft!) The accelerometer has been mounted
as close as possible to the hub of the propeller/rotor and orientated such that
it is sensing the vibration in the propeller/rotor's plane of rotation.
Single plane balancing generally works well when the diameter of the object
being balanced is much greater than its depth and also when it is attached
to the supporting shaft at exactly 90°. Aircraft propellers and
gyroplane/helicopter rotors typically satisfy those conditions and so can be
balanced satisfactorily using the single plane method. When the depth of the
object being balanced is increased relative to its diameter or if it "wobbles"
on the supporting shaft, two plane balancing is required. This chapter
describes how the app can be used to carry out two plane balancing using
the two plane balancing view which is accessible through the options menu.
13.1. Two Plane Balancing Method
The two plane balancing method is really very similar to the single plane
balancing method. It involves measuring the vibration when no trial mass is
attached, measuring the vibration with trial mass attached and then
calculating a solution from those measurements. The difference is that the
trial mass is attached twice, once in each plane, and for each position of the
trial mass (not present, attached in plane 1 and attached in plane 2), vibration
readings are captured from both planes. So that means that 6 IPS/DEG values
are required to be able to calculate the two plane balance solutions that are
needed.
13.1.1. Measurement and correction planes
The planes in which the accelerometer(s) are mounted are called
measurement planes. The planes in which the trial masses and the final
correction masses are attached are called the correction planes. Typically,
accelerometers are mounted as close as possible to the bearings that support
the object being balanced. Generally speaking, the object being balanced is
either supported by bearings at each end so that its mass is (mostly) between
the bearings or it has significant mass that overhangs one bearing. For items
that are supported at both ends, the measurement and correction planes may
be close together as is shown in the next figure.
www.smartavionics.com
67
Two Plane Balancing View
CORRECTION PLANES
1
2
1
2
MEASURING PLANES
Fig 13.1. Two Plane Balancing An Object Supported At Both Ends
For overhung items, the configuration is as shown in the next figure. Note
how the #1 measurement plane is close to the #1 correction plane but the
#2 measurement plane is far from the #2 correction plane.
CORRECTION PLANES
1
2
2
1
MEASURING PLANES
Fig 13.2. Two Plane Balancing An Overhung Object
13.2. Two Plane Balancing View
The two plane balancing view presents a table into which the 6 required
IPS/DEG values are entered. Each of the values is entered by pressing the
appropriate button and selecting a polar point from a list that contains the
current job's polar points. Once the data has been entered, the resulting
solutions are shown below the table in the same format (ANGLE × SCALE) as
the propeller mode polar chart solutions. There are two solutions, one for
each correction plane. Here is the two plane balancing view that already has
the IPS/DEG data entered into it and is therefore displaying solutions.
68
www.smartavionics.com
Single accelerometer procedure
Fig 13.3. Two Plane Balancing View
Use the Android back button when you want to leave the two plane balancing
view. The data values entered are persistent so you can leave the view and
return to it and the values will still be there. An option menu item is provided
to zero all of the data values which is a good idea when starting a new
calculation.
13.2.1. Single accelerometer procedure
The two plane balancing procedure when using a single accelerometer is as
follows:
• Mount the accelerometer so that it is sensing vibration in measurement
plane 1.
• With no trial mass attached in either correction plane, capture a couple of
points
• Attach a trial mass so that it is in correction plane 1 and capture a couple
of points, mark the position of the mass and remove it.
• Now attach the same mass so that it is in correction plane 2 and capture
a couple more points. Mark the position of the mass and remove it. You
now have data for the 3 points in the left hand column of the table.
• Move the accelerometer so that it is now sensing vibration in measurement
plane 2.
www.smartavionics.com
69
Dual accelerometer procedure
• As above, capture 3 further sets of readings for the no-mass, mass in
correction plane 1 and mass in correction plane 2 configurations to provide
the data for the 3 points in the right hand column. It is important that when
you attach the trial mass you use the same positions as you did previously.
It is also important that all of the points have the same RPM.
• Enter all 6 points into the two plane balancing view and you will get two
solutions, one for the mass in each correction plane.
In the example shown above, the plane 1 solution is -50° × 1.18 which says
attach a mass that is 1.18 times the trial mass in a position that is 50°
backwards (against the direction of rotation) from the position of the trial
mass. The plane 2 solution is +82° × 1.14 which says attach a mass that is
1.14 times the trial mass in a position which is 82° forwards (in the direction
of rotation) from the position of the trial mass.
13.2.2. Dual accelerometer procedure
The procedure when using dual accelerometers is as follows:
• Mount the two accelerometers such that one is sensing the vibration in
measurement plane 1 and the other is sensing the vibration in measurement
plane 2.
• With no trial mass attached in either plane, capture a couple of points from
each accelerometer.
• Attach a trial mass so that it is in correction plane 1 and capture a couple
of points from each accelerometer. Mark the position of the mass and
remove it.
• Now attach the same mass so that it is in correction plane 2 and capture
a couple of points from each accelerometer. Mark the position of the mass
and remove it. You now have all 6 points required. Take care to select the
correct points when entering the data into the view.
70
www.smartavionics.com
Appendix A. Exported CSV Data Formats
A.1. Polar Point Data Format
The polar point CSV data contains one row per exported point and each row
contains these columns:
Date
The date the point was captured.
Time
The time the point was captured.
Axis
The point's axis, 'X' or 'Y'.
Rpm
The propeller RPM.
RpmSD The Standard Deviation of the propeller RPM.
Ips
The vibration magnitude.
IpsSD
The Standard Deviation of the vibration magnitude.
Deg
The vibration phase angle.
DegSD The Standard Deviation of the vibration phase angle.
Attrs
A bit mask of attributes. The bits have these meanings:
Bit 0
Accelerometer channel used (0 = X, 1 = Y).
Bit 1
Tachometer channel used (0 = internal, 1 = external).
Bit 2
Logger status (0 = point was manually captured, 1 = point
was captured by the logger).
Bit 8
Start point status (0 = point is not a start point, 1 = point is
a start point).
Tag
The point's Job Tag (an empty string if it doesn't have a Job Tag).
Notes
A string containing any notes associated with the point.
A.2. Spectrum Data Format
The spectrum CSV data contains one row per exported spectrum and each
row contains these columns:
Date
The date the spectrum was captured.
Time
The time the spectrum was captured.
www.smartavionics.com
71
Spectrum Data Format
72
Axis
The spectrum's axis, 'X' or 'Y'.
PropRpm
The propeller RPM.
EngineRpm
The engine RPM (i.e. PropRpm х PSRU ratio).
RpmPerLine
The “width” of each of the spectral lines.
PropIps
The vibration magnitude at the propeller RPM.
NumLines
The number of spectral lines (magnitudes).
Attrs
A bit mask of attributes. The bits have these meanings:
Bit 0
Accelerometer channel used (0 = X, 1 = Y).
Bit 1
Tachometer channel used (0 = internal, 1 =
external).
Bits 8-9
FFT Window type used (0 = None, 1 = Hann, 2 =
Flat Top).
Tag
The spectrum's Job Tag (an empty string if it doesn't have a
Job Tag).
Notes
A string containing any notes associated with the spectrum.
V… or A…
NumLines number of vibration magnitudes expressed as
either velocities (in IPS, column name begins with a V) or
accelerations (in G, column name begins with an A).
www.smartavionics.com
Index
A
accelerometer, 56
accelerometer scaling, 53
alias
axis, 44
analyse
spectrum, 24, 36
app installation, 1
auto-pause IPS level, 25
auto-start big capture button, 49
average points, 53
axes
switch, 42
axis, 3
alias, 44
primary, 44
B
balance
solution, 16
balancing
procedure, 59
battery level
PB-3, 4
big capture button view, 39, 41, 65
auto-start preference, 49
Bluetooth
pairing with PB-3, 5
remote capture button, 6
C
capture
button, 7, 20, 26
polar point, 58
remote button, 6
spectrum, 24
captured point dialog, 32
cartesian
coordinates, 21
centripetal force, 55-56
colours
vibration level, 4
confirm quit, 49
correction planes, 67
www.smartavionics.com
D
data
export, 47
import, 48
database
submenu, 47
data source, 50
data view, 19
datum, 9
delete
points, 31
spectra, 37
direction of rotor rotation, 16
divide screen, 49
dropbox, 47
dummy data, 50
E
edit notes, 33
ellipse
standard deviation, 7
engine type, 44
export data, 47
exported image format, 50
exporting images, 4
F
FFT window, 25
file chooser, 47-48
frequency domain, 23
G
graph view, 21
H
help, 41
hide
status bar, 49
tabs, 49
title bar, 49
I
image
export, 4
import data, 48
Inches Per Second, 4, 55
internal tacho
options, 51
73
J
job
mode, 3, 44
L
Language
user interface, 49
locked, 3
lock job, 44
log book, 60
logger, 4
M
marker, 11
master blade, 9
measurement planes, 67
min cycles, 53
min tacho pulses, 52
move line, 10, 64
O
options
internal tacho, 51
polar, 52
options menu, 41
P
pan & zoom
modal, 49
pan-zoom mode, 18
paused
options menu item, 41
PB-3
average points, 53
battery level, 4
options menu, 51
peak velocity, 55
phase, 57
phase angle, 7, 20-21
point logger
bucket, 45
configuration, 46
submenu, 45
polar
coordinates, 21
polar chart
pan-zoom mode, 18
polar chart view, 7
74
polar options, 52
polar point
edit notes, 33
polar point list, 29
primary axis, 9, 44
propeller
dynamic balancing, 56
mass imbalance, 55
mode, 44
pitch imbalance, 55, 62
static balancing, 55
PSRU, 3
incorrect ratio, 61
PSRU ratio, 44
Q
quit
confirm, 49
R
related spectrum, 33
release history, 41
rotor
direction of rotation, 16
mode, 44
RPM
choice, 57
erratic, 60
S
screen
divide, 49
orientation, 48
sensor backlight, 52
Share
CSV Data, 26
show tabs, 41
show zoom controls, 49
simulated data, 50
solution
bubble, 16
space key, 41
spectrum
analysis, 24, 36
capture, 24
delete, 36
list, 35
related, 33
www.smartavionics.com
spectrum view, 23
sqlite, 46
standard deviation ellipse, 7
start point, 8, 29, 32
choose, 59
define, 33
status bar, 3
hide, 49
switch axes, 42
T
tabs
hide, 49
show, 41
tachometer, 3, 57
channel, 44
min pulses, 52
power save, 52
set level, 51
time domain, 21
title bar
hide, 49
trial weight, 59
two plane balancing, 67
two plane balancing view, 41, 68
U
user interface language, 49
V
vibration level colours, 4
volume buttons, 16, 24
W
wind, 61
Z
zoom controls
visibility, 49
www.smartavionics.com
75
76
www.smartavionics.com