1
What’s New in @RISK 4.5
Overview
@RISK 4.5 brings a set of new analyses and new options to allow
easier modeling and more in-depth studies on @RISK 4.0 models.
New enhancements include:
•
Three New Advanced Analyses - Advanced Sensitivity
Analysis, Stress Analysis, and Goal Seek (@RISK Professional
and Industrial only)
•
Alternate Parameters for Probability Distributions, allowing the
entry of percentile parameters as arguments to many input
probability distributions. These alternate parameters are
available in both the pop-up Define Distribution window or in
distribution functions in Excel.
•
Cumulative Descending Percentiles, where percentile
probabilities can be optionally reported as cumulative descending
values as well as cumulative ascending values. Alternate
percentile parameters for probability distributions can also be
entered as cumulative descending percentiles.
•
Quick Reports - single one page reports in Excel containing
statistics and graphs for a simulation result, formatted for
printing.
•
Enhanced Define Distribution window, with point and click
selection of references from Excel, a pop-up distribution palette
for selecting distributions, a new right-click menu and other
enhancements.
•
Improved Error Reporting during simulation, where the Pause
On Error option now identifies the output(s) with errors and the
cells in your model that caused the error for each.
The RISK45 directory on your system contains multi-media tutorials
that illustrate the new capabilities of @RISK 4.5. These tutorials
require a media player capable of running .WMV files and a PC with
audio.
Description of New Features
Advanced Analyses
The Advanced Analyses include Advanced Sensitivity Analysis,
Stress Analysis, and Goal Seek. Each of these uses @RISK's multiple
simulation capability to analyze a simulation model.
•
Goal Seek allows you to find a specific simulated statistic for
a cell (for example, the mean or standard deviation) by
adjusting the value of another cell.
•
Stress Analysis allows you to analyze the effects of stressing
@RISK distributions. Stressing a distribution restricts samples
drawn from the distribution to values between a specified
pair of percentiles or samples a new “stress” distribution
instead of the original distribution in your model.
•
Advanced Sensitivity Analysis allows you to determine the
effects of inputs on @RISK outputs. An input can be either an
@RISK distribution or a cell in your Excel workbook.
Advanced Sensitivity Analysis runs a full simulation at each
of a set of possible values for an input, tracking the simulation
results at each value.
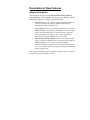
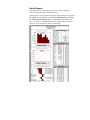
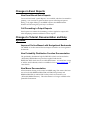
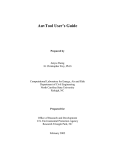
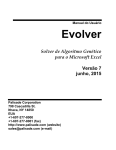
Each of these analyses has its own dialogs and generates a set of preformatted reports and graphs in Excel.
Advanced
Analysis Report
in Excel
Alternate Parameters for Probability Distributions
@RISK 4.5 allows the entry of percentile parameters as arguments to
many input probability distributions. This allows you to specify
values for specific percentile locations of an input distribution as
opposed to the traditional arguments used by the distribution. For
example, the distribution:
RiskNormal(100,20) – specifying a normal distribution with a mean
of 100 and a standard deviation of 20
could also be entered as:
RiskNormalAlt(5%, 67.10, 95%, 132.89) - specifying a normal
distribution with the 5th percentile at the value of 67.10 and the 95th
percentile at the value of 132.89.
Percentiles may also be mixed with the standard distribution
arguments, such as:
RiskNormalAlt("mu", 100, 95%, 132.89) - specifying a normal
distribution with a mean of 100 and the 95th percentile at the value of
132.89.
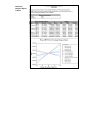
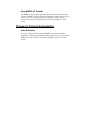
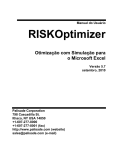
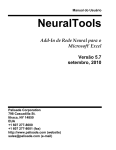
These alternate parameter functions may be entered directly in your
spreadsheet as with other @RISK distribution functions, or in the
Define Distribution window:
The ALT icon
Clicking the ALT icon allows you to switch from standard
distribution arguments to alternate percentile arguments:
A set of percentile arguments may be set as the default for a given
distribution type, so that every lognormal distribution, for example,
will be entered using a 10th and 90th percentile value.
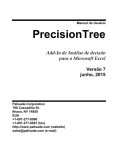
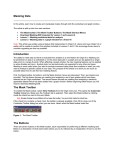
Sampling
Distributions
with Alternate
Parameters
During a simulation @RISK calculates the appropriate distribution
whose percentile values equal those alternate parameter values
entered and then samples that distribution. Just like all @RISK
functions, the entered arguments may be references to other cells or
formulas, and argument values may change iteration to iteration
during a simulation.
For more information on the @RISK distributions that are available
using alternate parameters, see the Reference: @RISK Functions
chapter of this manual, or check the list shown when the class of
functions titled @RISK Distrib (Alt Params) is shown in the Function
Wizard in Excel.
Cumulative Descending Percentiles
@RISK 4.5 can report percentile probabilities as cumulative
descending values as well as cumulative ascending values. This
option causes reports to display percentiles as the probability of
obtaining a value above a given threshold. The display of cumulative
descending percentiles is selected on the @RISK add-in menu Options
command.
Cumulative descending percentiles may also be used in specifying
alternate percentile parameters for probability distributions. In
addition, arguments to the RiskCumul probability distribution may
be entered using descending probabilities. A new set of @RISK
functions allow the entry of these cumulative descending values.
Each of these functions has a "D" after the function name, such as
RiskCumulD, RiskNormalAltD, etc. For more information on using
these functions, see the Reference: @RISK Functions chapter of this
manual.
Quick Reports
Quick Reports are single one page reports in Excel containing
statistics and graphs for a simulation result.
Quick reports can be generated by simply right clicking on a graph in
the @RISK Results Window and selecting Quick Report, or through
the @RISK Report Settings dialog. Using the Settings dialog, you
may also choose to automatically generate Quick Reports for each
output in your model at the end of a simulation.
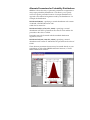
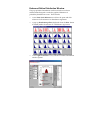
Enhanced Define Distribution Window
The pop-up Define Distribution window includes several new
enhancements designed to make the graphical definition of
probability distributions easier. These include:
•
A new Enter Excel Reference icon allows the point and click
selection of cell references for distribution arguments
•
A pop-up distribution pallete (displayed when the Dist.. button
is clicked) makes the selection of a distribution type easier
•
A new right-click menu for easy selection of Define Distribution
window options
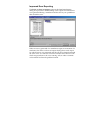
Improved Error Reporting
The Pause on Error in Outputs option in the Simulation Settings
dialog now provides a detailed listing of the outputs for which errors
were generated during a simulation and the cells in your spreadsheet
that caused the error.
When an error is generated for a simulation output in an iteration of a
simulation, the Pause on Error in Outputs dialog shows each output
for which an error was generated and the cell whose formula returned
the error value. You can also review the formulas and values for cells
which are precedents to the "error causing" cell, in order to examine
values which feed into the problem formula.
Detailed Listing of New and Changed
Features
Changes to the @RISK Add-In Interface
New @RISK Sub-Menus
The main @RISK menu in Excel contains two new sub-menus. The Options
submenu contains three general program options described below: Show
Expanded Toolbar, Prompt for Output Names, and Display Cumulative
Descending Percentiles. The Advanced Analyses sub-menu contains three new
analyses: Goal Seek, Stress Analysis, and Advanced Sensitivity Analysis, which
are described in the next section.
Expanded and Collapsed Toolbars
@RISK 4.5’s toolbar can be in two modes of operation. The “collapsed”
mode displays all the same icons as @RISK 4.0’s toolbar. The “expanded”
mode displays advanced options available in the Professional and Industrial
Edition of @RISK, including distribution fitting, goal seek, advanced
sensitivity analysis, and stress analysis. You can switch between the two
toolbar modes by clicking the last icon on the toolbar, or by selecting the
Show Expanded Toolbar item in the @RISK/Options menu.
Prompting for Output Names
When you add an output using the Add Output icon, @RISK will now prompt
you for an output name. You can turn this feature off and on by selecting the
Prompt for Output Names item in the @RISK/Options menu.
Descending Percentiles Mode
@RISK now allows you to specify that reports and statistics use cumulative
descending percentiles values instead of the default cumulative ascending
percentiles. This option is accessed using the Display Cumulative Descending
Percentiles item in the @RISK/Options menu.
@RISK “Splash Screen” Removed
For improved launching speed, @RISK no longer shows the @RISK “splash
screen” when it launches.
New Advanced Analyses
The Professional and Industrial versions of @RISK 4.5 come with three new
advanced analyses: Goal Seek, Stress Analysis, and Advanced Sensitivity
Analysis. Each of these is described in detail in the new @RISK 4.5
multimedia tutorial.
Goal Seek
The @RISK Goal Seek is analogous to Excel’s built in Goal Seek, but modified
to take advantage of simulation. By running multiple simulations, @RISK’s
Goal Seek allows you to change a specific cell to reach a target goal for the
output (such as a standard deviation of 1000, or a mean of a 5000.) To run
this analysis, click the Goal Seek icon on the “expanded” @RISK toolbar, or
choose the Goal Seek item from the @RISK/Advanced Analyses menu.
Stress Analysis
Stress analysis allows you to see the effects of “stressing” an input to an
extreme range of its domain. For example, if you have a distribution for
“Cost” in your simulation model, stress analysis would let you quickly see
the effects of forcing the “Cost” distribution in the highest 90 percentile. You
can start this analysis by clicking on the Stress Analysis icon on the
“expanded” @RISK toolbar, or by choosing the Stress Analysis item from the
@RISK/Advanced Analyses menu.
Advanced Sensitivity Analysis
Advanced sensitivity analysis allows you to see the impact of changing
model parameters on the outputs of a simulation. This analysis creates a
large number of statistics and graphs, including spider plots, box plots, and
histograms that allow you to analyze the impact of your changing cells. You
can start this analysis by clicking on the Advanced Sensitivity Analysis icon on
the “expanded” @RISK toolbar, or by choosing the Advanced Sensitivity
Analysis item from the @RISK/Advanced Analyses menu.
Changes in Simulation Options
Improved Pause on Error Option
The Pause on Error in Outputs option has been improved, and now allows you
to scroll through your spreadsheet, so you can better identify and correct
modeling errors. This option is available on the Iterations tab of the
Simulation Settings Dialog.
New Multiple CPUs Option
A new option for users of the Industrial Edition of @RISK is available on the
Iterations tab of the Simulation Settings Dialog. The Use Multiple CPUs
option allows you to make use of all the CPUs on your multiple CPU
machine when running an @RISK simulation. See the user’s manual for
more information.
Changes to Spreadsheet Functions
Alternate Distribution Parameters
You can now specify “alternate” distribution parameters for many kinds of
distributions. For example, you can specify a normal distribution with a 5th
percentile of 10 and a 95th percentile of 20 using the function
RISKNormalAlt(5%, 10, 95%, 20). To specify alternate parameter distribution
using cumulative descending percentiles, use the “AltD” function. For
example, RISKNormalAltD(95%, 10, 5%, 20). See the @RISK manual for
more information.
New RISKCumulD Distribution
The function RISKCumulD has been added so you can specify a customized
distribution in terms of cumulative descending percentiles.
New RiskTargetD and RiskPercentileD Statistics
Functions
These two new functions allow you to generate target and percentile values
in terms of descending percentile values.
Changes to the Define Distribution Window
New Distribution Palette
The Define Distribution Window now contains a distribution palette for the
quick selection of distributions. Access the palette by clicking the “Dist...”
button. This palette also appears when adding an overlay to a graph.
New Select Excel Reference Icon
While you have always been able to type references directly into the Define
Distribution Window, you now can click on Excel references directly, using
the Select Excel Reference icon.
New Menu Options for Controlling Distribution
Overlays
Several new menu items have been added to the right-click popup menu for
adding, removing, and editing overlays. Simply right-click on a
distribution’s graph in the Define Distribution Window.
Improved Default Distribution Parameters
The Define Distribution Window now generates smart default parameters
for your distributions when you add overlays or switch between different
distribution types.
New Alternate Parameters
You can now specify “alternate” distribution parameters for many
distributions using percentiles. For example, you can specify a normal
distribution with a 5th percentile of 10 and a 95th percentile of 20. Click the
Alternate Parameters icon to show the Alternate Parameters Dialog.
Changes in the @RISK-Model Window
Toolbar Changes
Two toolbar changes have been made to improve navigation in the @RISKModel window. First, a new Insert toolbar is available for creating new
windows and Fit Tabs. Second, the Fitting toolbar has been made context
sensitive, and will only appear when the active tab is a Fit Tab.
Generating @RISK Functions from @RISK-Model
Windows
You many now put @RISK distribution functions directly into Excel from an
Artist, Distribution, or Fit Result window, using the Write Function to Excel
command, which is available on the right-click menu for these windows. In
addition, for an Artist Window, this command is available on the Artist
toolbar, and the Artist menu.
Generating @RISK Distribution Windows from an
Artist Window
When you choose the Create Distribution command from an Artist Window,
you now get a distribution that only reflects the “marked” points of the
Artist Window. To change the number of data points in the distribution you
generate, change the number of markers.
Deleting of @RISK Input Functions
In @RISK 4.0, you were able to remove @RISK output functions from your
spreadsheet using the Model menu’s Remove Functions command. In @RISK
4.5, you may now also remove input function using the same command.
This command is also available on the right-click context menu of the input
and output explorer list.
Changes in the @RISK-Results Window
Improved Filter Dialog
The Filter Dialog, available under the Results menu, has been improved with
a new grid for entering filters, and options for globally disabling and
enabling filters.
New Automatic Bin Minimum and Maximum Options
For Histograms
There are now two automatic histogram binning options. The default “auto”
option uses the range of the data set to determine the histogram’s minimum
and maximum, regardless of the graph’s x-axis scaling. The “auto (axis
scale)” option forces the bins to be also within the range of displayed x-axis.
This was the default binning options in @RISK 4.0.
Relative Frequency Histograms
You can create histograms that display relative frequency instead of density
by selecting the Relative Frequency option in the Histogram Options section of
Format Graph Dialog.
Errors Reported in Statistics Summary Window
Any errors encountered during a simulation are now summarized in the last
column of the Summary Statistics Window. Previously, this information was
available only in the Detailed Statistics Window.
New Quick Report Option for Outputs
A new option on the right-click context menu in the explorer list allows you
to generate a “Quick Report” of an output. This quick report is placed in
Excel, and is formatted to fit exactly on a single printable page.
New Graph Icon in Insert Toolbar
A new icon in the Insert toolbar for graphing the active selection in the
explorer list has been added. This icon duplicates the same options available
on the Insert\Graph menu.
Changes in Excel Reports
New Excel-Based Quick Reports
Two new Excel-based “Quick Reports” are available, which are formatted for
printing. You can select to generate these reports in the Report Options
Dialog, or by right clicking on an @RISK output in the @RISK-Results
Window and choosing the Quick Report command.
Cell Formatting in Output Reports
Excel reports now mimic the formatting you have applied to output cells
when displaying statistics and data for those outputs.
Changes to Tutorial, Documentation and Help
Systems
Improved On-line Manual with Navigational Bookmarks
The @RISK 4.5 on-line manual has been improved with a set of navigational
bookmarks.
New Probability Distribution Function Documentation
The probability distribution help file PDF.HLP (which was located in the
\DTOOLS\SYSTEM directory) has been replaced with the file
DISTFUNC.PDF, which is now in Adobe PDF format. You must have a copy
of Adobe Acrobat Reader, which is available for free at www.adobe.com, to
view this file.
New Macro Documentation
All information relating to the control of @RISK using VBA macros has been
moved to the files RISKMACRO.CHM (in HTML-Help format) and
RISKMACRO.PDF (in Adobe PDF format), which are located in your
\DTOOLS\RISK45 directory. This information is no longer available in the
printed documentation.
New @RISK 4.5 Tutorial
The @RISK 4.5 tutorial been updated to demonstrate the significant new
features of @RISK. The new tutorial is in Window’s Media Viewer (.wmv)
format. You can start the tutorial by choosing the Programs/Palisade
DecisionTools/Tutorials/The @RISK 4.5 Tutorial item in Window’s “Start”
menu.
Changes in Product Authorization
Auto-Authorize
If you are connected to the Internet, @RISK 4.5 can be automatically
authorized. When the authorization dialog appears when you first launch
@RISK, choose the Authorize Now button, and then select the Automatic
option.