1
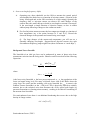
R. J. Jones
Optical Sciences
OPTI 511L
Fall 2013
Semiconductor Lasers
(~1-2 weeks)
Semiconductor (diode) lasers are by far the most widely used lasers today. Their small
size and properties of the light output take some getting used to. Also these devices are
extremely power and static sensitive. The most basic elements of a theory of laser diode
operation can be found in Yariv; for a more extensive and modern treatment see e.g.
"Fundamentals of Photonics" by Saleh & Teich. Detailed characteristics of a particular
laser diode can be obtained from the manufacturers User's Manual.
The popularity of laser diodes is largely due to a host of desirable characteristics, such as
wavelength availability, ruggedness, reliability, compactness, light weight, high
efficiency, low cost etc. From a laser physics standpoint diode lasers are also of interest
because they make it relatively easy to observe two basic aspects of laser operation:
1. Exploration of laser characteristics near threshold, including buildup of laser
oscillation from noise as excitation increases through the threshold value.
2. Measurement of the fundamental laser linewidth.
One of the challenges in using diode lasers for spectroscopic applications is controlling
the laser frequency. We will explore the basic properties of the diode lasers in this lab,
and return to use them for saturated absorption spectroscopy and laser cooling and
trapping experiments in the future.
We will investigate the following properties of the diode laser:
I. Becoming familiar with device properties.
a. Threshold current, output power, temperature dependence.
II. Controlling and tuning for single frequency operation.
a. Wavelength dependence on current, temperature.
b. Mode-hopping.
c. External feedback for precision control.
III. Measurement of a laser’s linewidth.
a. Fabry-Perot cavity measurement.
b. Heterodyne beatnote detection.
Semiconductor Lasers, F2013
1
Part I. Laser Characteristics
1. Beam shape.
A. Use a diode without a collimating lens (ask your TA). Measure the diode laser
beam divergence for two orthogonal directions. Also record the uncertainties in
your measurements that are consistent with your choice of measurement
method. For this part, you may simply estimate the beam diameter “by eye”.
Q: Why is the laser beam elliptical? How is the beam elongation oriented
with respect to the p-n junction? Please sketch this in you lab book.
B:
Assuming the beam is diffraction limited, what is the effective size of the
radiating region (at the exit facet of the semiconductor) based on your
measurements?
2. Polarization.
Q: How would one expect a diode laser beam to be polarized?
A.
Measure the state of polarization of the laser output beam.
B.
What is the relationship between polarization and laser resonator orientation?
3. Threshold behavior and output power
A.
Use the laser diode that has temperature and current control. Use the spherical
collimating lens to couple light out of the diode. Stabilize the laser
temperature at 22°C. Plot the laser output power versus injection current.
Determine the value of the threshold current (compare with specifications if
available).
B.
Repeat at 19°C and 16°C. Does the threshold change?
4. Aspect Ratio
One way to adjust the aspect ratio of the elliptical beam is to use a pair of
matched prisms that, when set up properly, widens (or shrinks) one of the
beam's transverse dimensions without focusing. (A pair of cylindrical lenses
might also be used for this purpose.)
Semiconductor Lasers, F2013
2
A.
We have available a pair of such prisms. These are called an anamorphic
prism pair. Can you achieve an approximately 1-to-1 aspect ratio? Insert the
prism pair on the supplied optical mount and adjust them to try and obtain a
round beam. You likely need to adjust the orientation and spacing of the
prisms.
5. Laser modes.
Using an optical spectrum analyzer
Commercial diffraction grating spectrometers are often used in spectrum analysis of
diode lasers. We have a commercial optical spectrum analyzer (OSA) available. The
device takes input from an optical fiber, and the light propagating through the fiber is
sent through the spectrometer. The device displays an automatically calibrated trace
of the spectrum of the light, with a resolution bandwidth down to 0.1 nm.
Using the spectrum analyzer, look at the characteristics of the laser as you increase
the current through and beyond threshold. It may be useful to use a log scale to
display the spectrum so you can more easily see the ASE and the laser cavity
Fabry-Perot modes when you are below and at lasing threshold. Keep the laser at a
fixed temperature for this measurement. This is an expensive instrument, so please
handle appropriately! Also, be careful handling the optical fiber, especially near the
input to the OSA. Try to observe the following features using the OSA, and make
sketches in your notebook as appropriate:
A. Significant “amplified spontaneous emission” (ASE) can be seen below and even
above the lasing threshold. At what current does a single longitudinal mode have
nearly all of the laser power? This is the threshold current. By operating the laser
well above threshold, you may also observe the Fabry-Perot modes from residual
ASE power. How many of the diode laser Fabry-Perot cavity longitudinal modes
can you resolve in the entire spectrum when the current is just below threshold?
(This requires good coupling of light into the OSA)
B. What is the FSR of the laser (in frequency units)? Be sure you record this number.
Determine this by looking at the resonances seen in the ASE due to the diode chip
Fabry-Perot cavity. If the index of refraction of the gain medium is 3.6, what is
the laser diode chip cavity length in microns?
C. Would this OSA be useful for analyzing the frequency spectrum of a gas laser?
Remember, the resolution bandwidth of this OSA is ~0.1nm. To answer this
question, calculate the resolution of the OSA in the frequency domain, and
consider the cavity length of typical gas lasers you have used so far.
Semiconductor Lasers, F2013
3
6. Laser wavelength (frequency shifts)
A.
Operating now above threshold, use the OSA to measure the central optical
wavelength of the diode laser as a function of injection current. (Zoom in to the
lasing wavelength and set the OSA resolution to a high setting.) Quantify the
frequency shift vs. injection current you observe for small changes of the
current. Does this mode shift up or down in wavelength as current is increased?
Is the wavelength a simple function of injection current, or does it exhibit
sudden jumps when large changes to the current are made?
B. For fixed injection current, measure the laser output wavelength as a function of
laser temperature (try a few points between 16 C and 30 C). Record the
observed changes to the spectrum and central lasing wavelength.
Q: For large changes of the current and temperature, you will not see a
smoothly changing wavelength. Suggest/discuss physical reasons why such
discontinuous frequency jumps might occur (these are known as “mode-hops”).
Background: Laser linewidth
The linewidth of an ideal gas laser can be understood in terms of phase noise from
spontaneous emission into the lasing mode. Shawlow and Townes derived the following
expression
N2 π hν ( Δν cavity )
Δν =
,
N2 − N1
P
2
where
Δ νcavity =
c 1−R
2π L R
is the laser cavity linewidth, P the laser power output and N1 , N2 the populations of the
lower and upper lasing level. For many solid-state lasers such as the HeNe where the
cavity losses are small (and the resulting cold cavity linewidth Δν cavity is narrow), the
Schalow-Townes linewidth is at the ~1 Hz level! This is physically difficult to actually
measure due to the technical noise that fluctuates the cavity optical path length (eg
pressure fluctuations or vibrating mirror mounts), resulting in an effective broadening of
the measure laser linewidth.
For semiconductor lasers there is an additional broadening that occurs due to the high
density of charge carriers,
2
Δ ν ′ = Δν (1 + α ) ,
Semiconductor Lasers, F2013
4
where the term (1 + α 2 ) typically has a value of 20 or more. This is sometimes referred
to as the "modified Shawlow-Townes limit". A rule of thumb to estimate linewidth of
GaAs diode lasers is
(output
power ) × (linewidth ) = 100 mW MHz .
For typical laser diode output powers this is in a measurable range. In addition, due to the
monolithic structure of diode lasers, they often do not suffer from the same technical
noise (cavity length fluctuations) as many solid-state lasers.
7.
Fabry-Perot measurement of single frequency performance and laser linewidth.
A. Use the 1.5 GHz FSR Thorlabs FPI to confirm single frequency operation and to
measure the linewidth of the diode laser. Compare this to the modified ShawlowTownes limit, assuming that the diode laser facets have ~ 30% reflectivity. See if
you can you measure/observe the power dependence on the linewidth (or are you
just limited by the resolving power of the FPI?).
Note: During this measurement it is important to minimize optical feedback into the
laser. Do this by locating the FPI as far away as you can while still obtaining
a visible signal. If you need to use a focusing lens, misalign it so that the lens
is tilted very slightly with respect to the beam path(use the lens only to make
the beam converge, but not focus, at the entrance hole).
B. Measure the shift of the laser frequency versus current. You tried this previously
with the OSA, but you should now be able to make a more precise measurement
of small laser frequency shifts with only a few mA change in injection current.
Current control is a common way to quickly adjust the frequency of a diode laser,
over a range where the laser does not “mode-hop”. Give the value for the
measured “actuator coefficient” in units of [MHz/mA].
8. External cavity diode laser (ECDL)
This part of the lab explores the use of an external cavity consisting of a diffraction
grating to force single-frequency laser operation and control the lasing wavelength. The
principles are similar to those found in an upcoming lab, and we begin to explore the
techniques here.
You are to follow the TA's instructions for setting up this part of the lab. In class we
discussed two common external cavity configurations, the “Littrow” configuration in
which the first order beam from the external diffraction grating is retro-reflected back
into the diode laser, and the “Littman-Metcalf” configuration in which the first-order
beam is sent to a mirror, and then reflected back into the diode laser. In both cases the 0th
order beam is used as the output. Here, we will use the latter configuration (Littman) such
that the output (0th order beam from the external grating) does not move when the cavity
is adjusted.
First, align an external grating such that the 1st order beam is sent back near the laser
diode, but with sufficient room to place an end mirror to form the external cavity. (The
Semiconductor Lasers, F2013
5
grating should be placed about 10-20 cm from the diode laser so the cavity is not too
long.) Then align the 0th order beam into the OSA (and also the FPI if there is sufficient
power). Now, adding a mirror to reflect the light from the 1st order beam should enable
you to control the laser operating frequency. With proper alignment, the beam that
returns to the laser diode will cause additional light build-up for one particular FabryPerot cavity mode, whichever one is properly retro-reflected back to the laser.
(1) Look at the OSA and compare the laser operation with versus without optical
feedback from the external cavity by blocking and unblocking the external cavity
end mirror. Align the retro-reflecting mirror such that one mode near the peak of
the laser spectrum grows in strength. Then, scan the horizontal tilt of the mirror.
Try to observe the effects of feedback as you successively inject one Fabry-Perot
mode after another.
(2) You may find that the laser may operate in primarily two axial modes
simultaneously when you inject the retro-reflected beam. One of these modes
will be due to the injected optical feedback, the other will be the primary natural
lasing mode for the particular current and temperature with which you are
working. Estimate the fraction of the total light power that can be put into the
injected mode. Can you force the laser to operate almost entirely in a mode other
than its natural lasing mode?
Determine the wavelength range (ie tuning range) over which you can now force
the laser to operate single frequency. What is the side-mode suppression ratio at
the extremes of this tuning range? Note: the side-mode suppression ratio is the
amplitude difference between the primary lasing frequency, and the next highest
peak of light you see on the OSA. When you are lasing near the center of the
spectrum, this second peak (from the “feedback-free lasing mode”) will be almost
entirely suppressed.
(3) If you have sufficient power to see a signal on the FPI, confirm single frequency
operation again with the optical feedback. Observe the linewidth with versus without
the external cavity feedback. Can you observe a narrower linewidth with feedback, or
is the FPI resolution too low?
Semiconductor Lasers, F2013
6
9. Heterodyne beatnote detection for measurement of the laser linewidth.
In his part of the lab you will use optical heterodyne detection between 2 lasers to study
the linewidth and noise present in a laser. For comparison, we will investigate both a
HeNe laser (short cavity and nearly single frequency) and a semiconductor laser.
To detect a beatnote between two lasers, both beams must be carefully spatially
overlapped and detected with a fast photodiode. The photocurrent will yield a DC
component as well as the difference frequency between the two lasers. The frequency of
this beatnote must fall within the bandwidth of the detection electronics (~1 GHz in our
lab). The noise present on both lasers will be observable in the heterodyne beatnote (ie
the observed beatnote linewidth will be the convolution of the linewidth of the individual
lasers). Noise processes occur on different timescales, so what you observe will depend
on the observation time of the detection system. For example, adjust the resolution
bandwidth (RBW) and video bandwidth (VBW) on the RF spectrum analyzer to see how
that affects the beatnote. Slow noise processes such as drift of the laser cavity length will
be seen as a drift of the beatnote, while fast noise processes (including the quantum
limited noise) will contribute to the linewidth of the observed beatnote.
By measuring the beatnote between two nearly identical lasers, one can attribute the
observed noise as coming equally from both. If using two different lasers and one laser is
known to be very stable, then the observed noise can be assumed to all come from the
second laser.
Start with 2 HeNe lasers and observe the beatnote between them. Be sure to have good
spatial overlap of the two beams incident on the photodiode.
Compare what you observe from the HeNe lasers with the beatnote from 2 semiconductor
diode lasers. For the semiconductor lasers, you will need to carefully control the current
and temperature. The maximum RF detection bandwidth (determined by the bandwidth
of the detection photodiode system) will be < 1 GHz, and therefore the lasers relative
frequencies will need to be within this range in order to see the beatnote. For this part,
you will use your home-made external cavity diode laser and compare it with the
commercial Vescent diode laser. The Vescent diode laser is based on a monolithic
external cavity design, resulting in a very stable and slowly drifting single frequency
laser. You will need to adjust the home-made ECDL very carefully in order to get the
frequency of both lasers to within 1 GHz (start by using the OSA to get them close). You
may also want to cover up the ECDL with a simple box (e.g any cardboard box) to reduce
fluctuations of the laser frequency.
References:
"Fundamentals of Photonics, Saleh and Teich, Wiley (1991)
Semiconductor Lasers, F2013
7