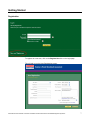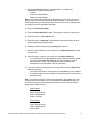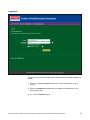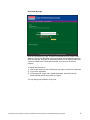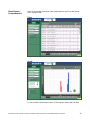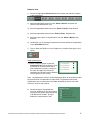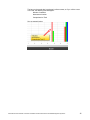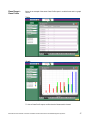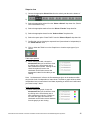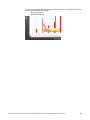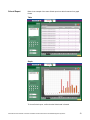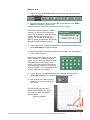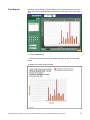
1
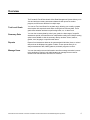
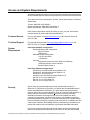
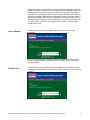
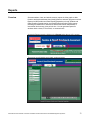
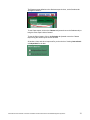
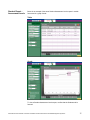
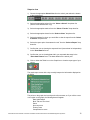
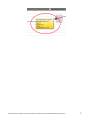
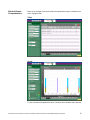
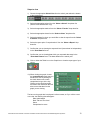
Administrator
User’s Manual for
The Fountas & Pinnell
Benchmark Assessment Online
Data Management System
International Version
Copyright © 2009 Heinemann. All rights reserved.
Table of Contents
Overview ................................................................................................................................ 4
Access and System Requirements ...................................................................................... 5
Customer Service ............................................................................................................................................. 5
Technical Support............................................................................................................................................. 5
System Requirements ...................................................................................................................................... 5
Security .............................................................................................................................................................. 5
User’s Manual.................................................................................................................................................... 6
Product Tour...................................................................................................................................................... 6
Getting Started....................................................................................................................... 7
Registration ....................................................................................................................................................... 7
Logging In........................................................................................................................................................ 10
Password Reminder ....................................................................................................................................... 12
Managing Your Account ..................................................................................................... 13
Update Account Information.......................................................................................................................... 13
Add Product Keycodes .................................................................................................................................. 14
Expired Product Keycodes ............................................................................................................................ 14
Manage Users ...................................................................................................................... 16
Overview .......................................................................................................................................................... 16
Search for Users ............................................................................................................................................. 16
Delete Users .................................................................................................................................................... 17
Exit the Manage Users screen ....................................................................................................................... 18
General Help ........................................................................................................................ 19
Logging Out ......................................................................................................................... 20
Terms of Use and Privacy Policy ....................................................................................... 21
School Data.......................................................................................................................... 22
Overview .......................................................................................................................................................... 22
Text Level Goals.............................................................................................................................................. 22
Viewing School Summary Data ..................................................................................................................... 25
Sorting School Summary Data ...................................................................................................................... 27
Sort Order ..................................................................................................................................................... 27
Restore Default View .................................................................................................................................... 28
Display data as: ............................................................................................................................................ 29
Exporting School Summary Data .................................................................................................................. 30
Print School Summary Data........................................................................................................................... 31
Reports ................................................................................................................................. 33
Overview .......................................................................................................................................................... 33
Student Report – Assessment Levels .......................................................................................................... 35
Table............................................................................................................................................................. 35
Graph............................................................................................................................................................ 35
Steps to view ................................................................................................................................................ 36
Student Report – Comprehension................................................................................................................. 38
Table............................................................................................................................................................. 38
Graph............................................................................................................................................................ 38
Steps to view ................................................................................................................................................ 39
Class Report – Assessment Levels .............................................................................................................. 41
Log ................................................................................................................................................................ 41
Table............................................................................................................................................................. 41
Graph............................................................................................................................................................ 42
Steps to view ................................................................................................................................................ 42
Class Report – Comprehension .................................................................................................................... 44
Table............................................................................................................................................................. 44
Administrator User’s Manual: Fountas & Pinnell Benchmark Assessment Online Data Management System ©
2
Graph............................................................................................................................................................ 44
Steps to view ................................................................................................................................................ 45
Class Report – Class Profile .......................................................................................................................... 47
Table............................................................................................................................................................. 47
Graph............................................................................................................................................................ 47
Steps to view ................................................................................................................................................ 48
School Report.................................................................................................................................................. 50
Table............................................................................................................................................................. 50
Graph............................................................................................................................................................ 50
Steps to view ................................................................................................................................................ 51
Print Reports ................................................................................................................................................... 52
Administrator User’s Manual: Fountas & Pinnell Benchmark Assessment Online Data Management System ©
3
Overview
The Fountas & Pinnell Benchmark Online Data Management System allows you to
view and analyze summary assessment data and view reports on student
progress, as well as sort the data in multiple ways.
Text Level Goals
You can set Text Level Goals for any date range, allowing you to easily compare
actual results with expected results when viewing school summary data. These
goals define whether students are performing below, on, or above level.
Summary Data
You can view summary data by school year, grade, the date range of a specific
assessment period, and Instructional or Independent reading level. Multiple sorting
options are available to view the summary data by students’ school, teacher,
gender, race, language, or special needs status.
Reports
Reports from Assessment data can be generated with individual, class, or school
data, and can be displayed as graphs or tables. These reports allow you to
analyze assessment data, identify patterns, and track progress over time.
Manage Users
You can view teacher account information as well as manage a teacher’s access
to the application. District-Level Administrators can manage the accounts for
School-Level Administrators as well as for Teachers.
Administrator User’s Manual: Fountas & Pinnell Benchmark Assessment Online Data Management System ©
4
Access and System Requirements
Access the International Version of the Fountas & Pinnell Benchmark Assessment
Online Data Management System at https://fpdms.heinemann.com/benchmark-intl.
There are three levels of subscription: Teacher, School Administrator, and District
Administrator.
Teacher: ISBN 978-0-325-03085-2
School Administrator: ISBN 978-0-325-03151-4
District Administrator: ISBN 978-0-325-03150-7
Each Teacher subscription costs $100 (USD) per user, per year, and includes
unlimited access for school and district administrators.
Customer Service
For more information, visit www.heinemann.com or call Customer Service at
603-431-7894.
Technical Support
For technical questions email [email protected] or call
603-570-4766. (In Canada only - 877-331-7290)
System
Requirements
Client Side Hardware Configuration:
Windows® based client configuration:
2GHz Processor
1GB Memory
Macintosh® client configuration:
1.83 GHz Processor
1 GB Memory
Common:
High-speed internet connection (Minimum 256kbit/s)
1024x768 minimum screen resolution
Adobe® Flash® Player 8
Client Side Software Configurations:
Windows XP, with Microsoft® Internet Explorer 6.0
Windows XP, with Microsoft Internet Explorer 7.0
Windows XP, with Firefox® 2.x
Windows Vista, with Microsoft Internet Explorer 7.0
Mac OS 10.4, running Safari® 2.0.1
Mac OS 10.4, running Safari 3.0
Mac OS 10.4, running Firefox 2.x
Security
We use security systems designed to prevent unauthorized access to, or
disclosure of, information you provide to us, and we take all reasonable steps to
secure and safeguard this information. Our Site's password protected section
requires users to give us unique identifiers, such as a username and password, to
retrieve their own information. Moreover, all systems that store personally
identifiable information are designed to be secure and isolated from direct
connection to the Internet, and we provide access to our databases containing
personally identifiable information on a need-to-know basis only. Houghton Mifflin
Harcourt Publishing Company employees (and employees of our affiliates and Site
Vendors) are required to acknowledge that they understand and will abide by our
policies with respect to the confidentiality of personally identifiable information.
Our security systems are therefore structured to deter and prevent hackers and
others from accessing information that you provide to us. We also use software
Administrator User’s Manual: Fountas & Pinnell Benchmark Assessment Online Data Management System ©
5
programs to monitor network traffic to identify unauthorized attempts to upload or
change information, or otherwise cause damage. Please understand, though, that
this information should not be construed in any way as giving business, legal, or
other advice, or warranting as fail-proof, the security of information provided by or
submitted to Houghton Mifflin Harcourt Publishing Company. Due to the nature of
Internet communications and evolving technologies, we cannot provide, and we
expressly disclaim, assurance that the information you provide us will remain free
from loss, misuse, or alteration by third parties who, despite our efforts, obtain
unauthorized access.
User’s Manual
Access the Administrator User’s Manual through the Log In screen of the
application:
Click on the “Administrator” hyperlink to launch the Administrator User’s Manual
PDF in a separate window. You can save the User’s Manual to your hard drive
from this window.
Product Tour
View a five-minute tour of the Fountas & Pinnell Benchmark Assessment Online
Data Management System by clicking on the “Take a product tour” link on the Log
In screen:
The tour will launch in a separate browser window.
Administrator User’s Manual: Fountas & Pinnell Benchmark Assessment Online Data Management System ©
6
Getting Started
Registration
To register as a new user, click on the Register Now link on the Login page.
This will take you to the User Registration screen.
Administrator User’s Manual: Fountas & Pinnell Benchmark Assessment Online Data Management System ©
7
1) Choose the User Type “School-Level Administrator” or “District-Level
Administrator” from the following choices:
Teacher
School-Level Administrator
District-Level Administrator
Note: User Types are associated with each Product Keycode, and you will only be
granted a level of access that matches the Product Keycode. If you select a level of
access beyond what your Keycode provides, you will receive an error message when
you attempt to save the registration information.
2) Enter your first and last names.
3) Enter the Product Keycode provided. This keycode is valid for one school year.
4) Enter and confirm a valid e-mail account.
5) Enter and confirm a password. The password is case-sensitive and must be at
least six alphanumeric characters long.
6) Select your school’s country from the Country drop down list.
7) Select the political division for your school from the Political Division drop down
list. (See Note)
8) Select the district / region for your school from the District / Region list.
To narrow down the choices that appear, begin entering your district’s postal /
zip code into the Postal / Zip Code text field. Only the districts / regions
associated with a postal / zip code beginning with the alpha-numeric
characters you enter will appear in the list. (See Note)
9) If you are a School-Level Administrator, select your school from the School drop
down list. (See Note)
The School drop down list will be grayed out and disabled if you are a DistrictLevel Administrators, because District-Level Administrators are not limited to a
particular school.
Note: If your District / Region or School does not appear in the available list, e-mail
Customer Service by clicking on the link provided above the School drop down list.
You will be asked to provide the following information in order to add your District /
Region and/or School to the list:
District Details
Country:
State / Political Division:
District / Region Name:
Postal / Zip Code:
School Details
Country:
State / Political Division:
District / Region Name:
School Name:
Administrator User’s Manual: Fountas & Pinnell Benchmark Assessment Online Data Management System ©
8
10) Read the Terms of Use document, available from the “Terms of Use” link on the
Registration screen. If you have read and agree to them, click on the checkbox
next to the statement “I have read and agree to the Terms of Use.” This will
activate the Save button.
11) Click the Save button to complete your registration. If any portion of the
registration process is incomplete, a message will appear above the Registration
area indicating any necessary corrections.
Click the Cancel button at any time to leave the User Registration screen without
saving any of the data you entered. A warning message will appear, prompting you to
confirm that you want to cancel the registration. Click the OK button. You will then be
returned to the login screen.
Administrator User’s Manual: Fountas & Pinnell Benchmark Assessment Online Data Management System ©
9
Logging In
To log in the Fountas & Pinnell Benchmark Assessment Online Data Management
System:
1) Enter your registered e-mail account in the E-mail text field on the Log In
screen.
2) Enter the password associated with your registered e-mail account in the
Password text field.
3) 3.) Click the Continue button.
Administrator User’s Manual: Fountas & Pinnell Benchmark Assessment Online Data Management System ©
10
Remember My Login
Once the “Remember my Login” check box is selected, the most recent e-mail
address to log into the application from that computer will automatically appear in
the E-mail text field, along with its associated password in the Password text field.
You will no longer have to enter this information every time you launch the
program.
To change this preference:
1) Click on the check box next to Remember my Login to remove the checkmark.
2) Log in to the application.
3) The program will “forget” that e-mail and password, and the E-mail and
Password fields will be empty when you logout.
You can change this preference at any time.
Administrator User’s Manual: Fountas & Pinnell Benchmark Assessment Online Data Management System ©
11
Password Reminder
If you forget your password, click on the Did you forget your password? link on
the Log In screen. The Retrieve Password screen will load:
1) Type your registered e-mail address into the E-mail text field.
2) Click the Continue button.
Administrator User’s Manual: Fountas & Pinnell Benchmark Assessment Online Data Management System ©
12
Managing Your Account
Update Account Information
You can view and edit your account information on the My Account screen,
accessible via the My Account link in the upper right on any screen while you are
logged in.
The account’s User Type and current keycodes will be visible, but they cannot be
changed.
Editable information includes:
First Name
Last Name
E-mail account
Password
You can also add a new Product Keycode on this screen, as described in the next
section.
Administrator User’s Manual: Fountas & Pinnell Benchmark Assessment Online Data Management System ©
13
Click the Save button to save any changes that you make to the information in My
Account
Click the Cancel button to leave My Account without saving any of the data you
entered. A warning message will appear, prompting you to confirm that you want to
cancel. Click the OK button. You will then be returned to the last screen you viewed.
Add Product
Keycodes
You can add a new Product Keycode to your account to extend access to the
product for another school year.
Copy and paste the new product keycode into the text field, then click the Add
button. The new keycode will then appear in the “Current Keycodes” list.
Expired Product
Keycodes
If your product keycode has expired you will not be able to log in to the system and
you will need to obtain a new product keycode.
Once you obtain a new product keycode, go to the Log In screen.
1) Enter your E-mail address.
2) Enter your Password.
3) Click the Continue button.
A screen will load notifying you that your keycode is no longer valid. You can add a
new product keycode to your account on this screen:
Administrator User’s Manual: Fountas & Pinnell Benchmark Assessment Online Data Management System ©
14
4) Enter the new Keycode in the text field.
5) Click the Continue button.
If the new product keycode is valid, the keycode will be added to your account, and
you will be logged in to the system.
Administrator User’s Manual: Fountas & Pinnell Benchmark Assessment Online Data Management System ©
15
Manage Users
Overview
View account information for the teachers with active accounts in your school or
district and manage their access to the application. District-Level Administrators
can manage the accounts for School-Level Administrators as well as for Teachers.
Search for Users
Access the Manage Users screen through the Manage Users link in the upper
right of any screen:
The Manage Users screen will initially appear blank:
1) Select a school from the School Name drop down list. (District-Level
Administrators only)
2) Select a user type from the User Type drop down list, or type the registered email address of an active user in the User E-mail Address text field.
Note: Only District-Level Administrators will have the option “School-Level
Administrator” in the User Type drop down list.
Administrator User’s Manual: Fountas & Pinnell Benchmark Assessment Online Data Management System ©
16
3) Click the Search Users button.
You will be able to see a list of all active users based on search criteria and your
user type:
School-Level Administrators: You will only be able to get search results on
active accounts with user type Teacher. If you search on the registered e-mail
account of another School-Level Administrator or a District-Level Administrator,
you will get no search results.
District-Level Administrators: You will only be able to get search results on
active accounts with user type Teacher or School-Level Administrator. If you
search on the registered e-mail account of another District-Level Administrator, you
will get no search results.
Delete Users
Deleting a user on the Manage Users screen removes them from the list of active
users in the search results and disables that user account. That user will no longer
be able to log in to the application, and no other users will be able to see that user
in their search results. Only Customer Service can re-activate an account.
To delete a user:
1) Perform a search for a list of users or for a specific user, following the steps in
the “Search for Users” section above.
2) Click the Delete button next to the user that you would like to delete:
Administrator User’s Manual: Fountas & Pinnell Benchmark Assessment Online Data Management System ©
17
A Remove User popup will appear, prompting you to confirm that you want to
delete this user:
3) Click the Delete button to remove this user from the search results list and
disable that account. The Remove User popup will close, and the user’s row of
information will immediately disappear from view.
OR
Click the Cancel button to close the Remove User popup without making any
changes. The user’s information will still be visible in search results to you and
other users whose account type gives them access to search.
Note:
Deleted teacher accounts will still appear in the Reports drop down list, and
deleted accounts’ summary data will remain intact. You will still be able to view the
student assessment data from that account.
Exit the Manage
Users screen
Exit the Manage Users screen at any time by clicking the Exit button in the upper
right of the Manage Users area:
This will return you to the screen you were viewing when you clicked the Manage
Users link.
Administrator User’s Manual: Fountas & Pinnell Benchmark Assessment Online Data Management System ©
18
General Help
Access general help at any time through the Help link, which appears in the upper
right on any screen while you are logged in.
This popup includes a link to the Administrator User’s Manual.
Click the Close button to close the window.
Administrator User’s Manual: Fountas & Pinnell Benchmark Assessment Online Data Management System ©
19
Logging Out
Log out of the application at any time by clicking the Log Out link in the upper right
on any screen while you are logged in.
1) Click the Log Out link.
2) A confirmation popup will appear, asking you to confirm that you want to exit.
3) Click the OK button to exit. This will log you out of the application and take you
to the Log In screen.
OR
Click the Cancel button to remain logged in. This will close the confirmation
popup and return you to the screen you were viewing when you clicked the
Log Out link.
Administrator User’s Manual: Fountas & Pinnell Benchmark Assessment Online Data Management System ©
20
Terms of Use and Privacy Policy
You can access the Terms of Use and the Privacy Policy through the links at the
bottom of any screen:
Administrator User’s Manual: Fountas & Pinnell Benchmark Assessment Online Data Management System ©
21
School Data
Overview
You can view summary data by school year, grade, the date range of a specific
assessment period, and Instructional or Independent reading level. Multiple sorting
options are available to view the summary data by students’ school, teacher,
gender, race, language, or special needs status.
Text Level Goals
Use Text Level Goals to establish Below Level, On Level, and Above Level criteria
for the students in your school or district. All summary data that you view in School
Data will be organized based on the Text Level Goals that you enter. You can
change these goals during the year and from year-to-year as needed. You do not
need to enter both Instructional and Independent level goals.
Note: Summary data in the School Data screen is only accessible after you enter
text level goals for specific assessment periods.
When you login to your account for the first time, the Text Level Goals popup will
automatically appear over the School Data screen:
1) Choose the school year for which you are entering text level goals from the
School Year drop down list.
2) Choose the grade level for which you are entering text level goals from the
Grade drop down list.
The program displays three empty rows of Text Level Goals for your convenience.
You do not have to fill in all (or any) of them. You can add additional rows by
clicking the plus (+) symbol to the left of the Text Level Goals chart. This will add
an empty row below the existing rows.
Administrator User’s Manual: Fountas & Pinnell Benchmark Assessment Online Data Management System ©
22
In these rows, you can enter the text level goals for the beginning, middle, and end
of the year.
Click on the Help (?) icon above the Grade drop down list if you need help
determining text level goals. In the Help popup, click on the link “Approximate Start
Level Based on Grade-Level Performance”. This will open a new window with
suggested instructional text level goals for grade levels K-12.
3) Enter a Start Date and End Date for each assessment period that your
school/district has established. (For example, if your district conducts
assessments 3 times per year, your first assessment period might be
September 1 to November 30; your second assessment period might be
December 1 to March 31, etc.) Click on the calendar icon, then click on a date
from the calendar popup:
Administrator User’s Manual: Fountas & Pinnell Benchmark Assessment Online Data Management System ©
23
On the calendar popup, the arrows in the top corners will navigate forward or
backward one month at a time.
4) Click on the Independent and/or Instructional Level drop down lists to select
text level goals for that assessment period.
5) Click the Save button to save the text level goals for this School Year/Grade
combination. The text level goals will be saved, and the Text Level Goals
popup will remain open for you to add text level goals to another School
Year/Grade combination.
Click the Save & Close button to save the text level goals for this School
Year/Grade combination and close the Text Level Goals popup. You will then
be on the School Data screen.
Click the Cancel button to leave the Text Level Goals popup without saving
any of the data you entered since the last time you saved.
6) To access the Text Level Goals popup again to view, add, or edit text level
goals, click on the Text Level Goals button on the upper right side of the
School Data screen, as shown below:
Administrator User’s Manual: Fountas & Pinnell Benchmark Assessment Online Data Management System ©
24
Viewing School Summary Data
View school/district instructional or independent summary data by assessment
period for a particular school year/grade combination.
To view summary data, you must first narrow the data down to a particular School
Year, Grade, and Date Range.
Note: The Grade drop down list will not be active until a School Year is selected,
and the Date Range drop down list will not be active until a Grade is selected.
1) Select a school year from the School Year drop down list. This will activate
the Grade drop down list.
2) Select a grade from the Grade drop down list. This will activate the Date
Range drop down list.
3) Select a date range from the Date Range drop down list, if available. This will
activate the Instructional and Independent radio buttons.
Data in the date range drop down list is taken directly from the Start and End
Dates saved in the Text Level Goals popup. This data will only be available if you
have saved text level goals for that particular School Year/Grade combination, as
shown below:
Administrator User’s Manual: Fountas & Pinnell Benchmark Assessment Online Data Management System ©
25
If no text level goals have been saved for that School Year/Grade combination, no
options will be available in the Date Range drop down list, as shown below:
If no Date Range options are available, you will need to return to the Text Level
Goals popup and save text level goals with start and end dates.
4) Select the Instructional or Independent radio button to show data for that
particular benchmark level. The Instructional radio button is selected by
default.
If all of the results do not fit on the screen, you will be able to scroll through the
results using the arrows at either side of the data area, as shown below:
Click on the right arrow (shown above) to navigate to the next page of results.
Continue clicking on the right arrow to navigate through all available results. Click
on the left arrow to navigate back in the other direction.
Administrator User’s Manual: Fountas & Pinnell Benchmark Assessment Online Data Management System ©
26
Sorting School
Summary Data
Sort the summary data by students’ school, teacher, gender, language, or special
needs status using the sort options.
Sort Order
In the Sort Order popup, you can choose up to four levels of sorting, as shown
below:
1) Click on the yellow “Sort Options…” link (School-Level Administrator) or the
yellow “More Sort Options” link (District-Level Administrator) to open the Sort
Order popup.
2) Choose the order in which you would like to sort the data, using the following
available options:
School (District-Level Administrator only)
Teacher
Gender
ELL (English Language Learner)
SPED (Special Education Services)
Add’l Reading Serv. (Additional Reading Services)
3) Click the OK button in the popup to sort the data in the chosen order.
Click the Cancel button in the Sort Order popup if you do not want to change how
the data is already sorted. This will return you to the School Data screen with no
change to the sort order.
Administrator User’s Manual: Fountas & Pinnell Benchmark Assessment Online Data Management System ©
27
Restore Default View
After performing a sort in the Sort Order popup, you can return to the default sort
order. Click the Restore Default View button in the lower left corner of the School
Data screen:
In the example above, a District-Level Administrator has sorted the summary data
by Teacher, then by Gender, then by ELL status.
If the administrator clicks the Restore Default View button, the summary data will
return to its default sort order.
For District-Level Administrators, data is sorted by School by default.
For School-Level Administrators, data is sorted by Teacher by default.
Administrator User’s Manual: Fountas & Pinnell Benchmark Assessment Online Data Management System ©
28
Display data as:
You can display the sorted data as:
Number of students (# of Students)
OR
Percentage of students (% of Students)
For all Administrator users, data is displayed by number of students by default.
Click the radio button next to either option to select how you would like to view the
data.
For example, in the screenshot below, a District-Level Administrator has chosen to
view the data by the # of Students and can see that 24 grade 3 students in the
Clearmount School were performing On Level during the first assessment period of
the year:
If the % of Students radio button is selected, the administrator will see that 36% of
the grade 3 students in the Clearmount School were performing On Level during
the first assessment period of the year:
Administrator User’s Manual: Fountas & Pinnell Benchmark Assessment Online Data Management System ©
29
Exporting School
Summary Data
You can export class data from the class list by clicking on the Export Data button:
1.) Click on the Export Data button.
2.) Click the OK button in the Export confirmation window that appears. (Or click
the Cancel button if you decide not to export the current summary data; this will
close the export confirmation window and return you to the School Data screen.)
3.) The “select location” window will pop up. Select the location where you would
like to download the exported file and click the Save button:
The system will save the file to your chosen location with the default name
“benchmark.csv”. You can change this name in the “select location” window before
you click the Save button.
Administrator User’s Manual: Fountas & Pinnell Benchmark Assessment Online Data Management System ©
30
Note: The exported file will include the information that was displayed on the
School Data screen when you clicked the Export Data button, and will appear in
the same sort order you specified on the School Data screen (or in the default sort
order, if you did not specify another sort order).
Print School
Summary Data
You can print the summary data as it appears on the screen by clicking on the
Print button:
Click on the Print button.
Select your printer from the “Print” window that pops up, and click the Print button.
This printout will include the following headers:
Benchmark Assessment Online Data Management System
Summary Report
The printed summary report will include only the information that is shown in the
School Data view online, exactly as it was sorted in that view(or in the default sort
order, if you did not specify another sort order).
In the example above, a District-Level Administrator has sorted the summary data
by Teacher, then by Gender, then by ELL status.
That Administrator’s printout will show the same information, as shown below:
Administrator User’s Manual: Fountas & Pinnell Benchmark Assessment Online Data Management System ©
31
Administrator User’s Manual: Fountas & Pinnell Benchmark Assessment Online Data Management System ©
32
Reports
Overview
Generate student, class, and school summary reports in either graph or table
format to analyze assessment data, identify patterns, and track progress over time.
Reports include Student and Class Reading Assessment Levels, Student and
Class Reading Comprehension, and Class Profile and School Profile reports
indicating the distribution of students at different benchmark independent or
instructional levels at any given point in time. You can generate reports for
students within a class, in one school, or across schools.
Access the Reports area by clicking on the Reports tab at the top of the screen:
The screen you will initially see is blank, as shown below:
Administrator User’s Manual: Fountas & Pinnell Benchmark Assessment Online Data Management System ©
33
The Reports screen defaults to the Students report choices, so the Students tab
will appear “forward”:
To see Class reports, click on the Classes tab (located next to the Students tab) to
bring the Class report choices forward.
To see the School report, click on the Schools tab (located next to the Classes
tab) to bring the School report choices forward.
All student, class, and school reports offer you the choice of viewing Instructional
or Independent Level data:
Administrator User’s Manual: Fountas & Pinnell Benchmark Assessment Online Data Management System ©
34
Student Report –
Assessment Levels
Below is an example of the same Student Assessment Levels report in a table
format and in a graph format:
Table
Graph
To view a Student Assessment Levels report, confirm that the Students tab is
forward.
Administrator User’s Manual: Fountas & Pinnell Benchmark Assessment Online Data Management System ©
35
Steps to view
1) Choose the appropriate School Year from the school year tabs at the bottom
of the reports area:
2) Select the appropriate school from the “Select a School” drop down list.
(District-Level Administrator only)
3) Select the appropriate teacher from the “Select a Teacher” drop down list.
4) Select the appropriate class from the “Select a Class” drop down list.
5) Select the student for whom you would like to view the report from the “Select
a Student” drop down list.
6) Select the report option “Assessment Levels” from the “Select a Report” drop
down list.
7) Confirm that you are viewing the expected Level (Instructional or Independent)
in the “Show data for” area.
8) Confirm that you are viewing data within your expected date range in the
“Show data between” area. The dates default to the school year.
9) Click on either the Table icon or the Graph icon to view the report type of your
choice:
The graph report comes with a key to easily interpret the information displayed on
the graph:
The points on the graph also have dynamic rollover states, so if you roll the cursor
over a point on the graph, the following data will appear:
Date Administered
Book Title and Text Level
Genre
Accuracy score
Fluency score
Comprehension score
Administrator User’s Manual: Fountas & Pinnell Benchmark Assessment Online Data Management System ©
36
Administrator User’s Manual: Fountas & Pinnell Benchmark Assessment Online Data Management System ©
37
Student Report –
Comprehension
Below is an example of the same Student Comprehension report in a table format
and in a graph format:
Table
Graph
To view a Student Comprehension report, confirm that the Students tab is forward.
Administrator User’s Manual: Fountas & Pinnell Benchmark Assessment Online Data Management System ©
38
Steps to view
1) Choose the appropriate School Year from the school year tabs at the bottom
of the reports area:
2) Select the appropriate school from the “Select a School” drop down list.
(District-Level Administrator only)
3) Select the appropriate teacher from the “Select a Teacher” drop down list.
4) Select the appropriate class from the “Select a Class” drop down list.
5) Select the student for whom you would like to view the report from the “Select
a Student” drop down list.
6) Select the report option “Comprehension” from the “Select a Report” drop
down list.
7) Confirm that you are viewing the expected Level (Instructional or Independent)
in the “Show data for” area.
8) Confirm that you are viewing data within your expected date range in the
“Show data between” area. The dates default to the school year.
9) Click on either the Table icon or the Graph icon to view the report type of your
choice:
10) When viewing the graph, choose
the comprehension types that you
would like to view by clicking on
the check boxes next to each
comprehension type in the key.
Clicking on the check box again
will remove the checkmark and will
also remove that data from the
graph you are viewing.
The bars on the graph also have dynamic rollover states, so if you roll the cursor
over a bar, the following data will appear:
Date Administered
Book Title and Text Level
Genre
Comprehension score
Administrator User’s Manual: Fountas & Pinnell Benchmark Assessment Online Data Management System ©
39
Administrator User’s Manual: Fountas & Pinnell Benchmark Assessment Online Data Management System ©
40
Class Report –
Assessment Levels
Below is an example of the same Class Assessment Levels report in a log format,
in a table format, and in a graph format:
Log
Table
Administrator User’s Manual: Fountas & Pinnell Benchmark Assessment Online Data Management System ©
41
Graph
To view a Class Assessment Levels report, confirm that the Classes tab is forward.
Steps to view
1) Choose the appropriate School Year from the school year tabs at the bottom
of the reports area:
2) Select the appropriate school from the “Select a School” drop down list.
(District-Level Administrator only)
3) Select the appropriate teacher from the “Select a Teacher” drop down list.
4) Select the appropriate class from the “Select a Class” drop down list.
5) Select the report option “Assessment Levels” from the “Select a Report” drop
down list.
6) Confirm that you are viewing the expected Level (Instructional or Independent)
in the “Show data for” area.
7) Confirm that you are viewing data within your expected date range in the
“Show data between” area. The dates default to the school year.
8) Click on the Log icon, the Table icon, or the Graph icon to view the report type
of your choice:
Administrator User’s Manual: Fountas & Pinnell Benchmark Assessment Online Data Management System ©
42
The graph report comes with a key to easily interpret the information displayed on
the graph:
The bars on the graph also have dynamic rollover states, so if you roll the cursor
over a bar, the following data will appear:
Date Administered
Student Name
Book Title
Genre
If more than one data point appears in approximately the same area, the rollover
text will start with the header:
“[#] of [#] Press mouse for next.”
The data for one user will appear under that header.
Click the mouse on the data point to cycle to the next student’s rollover data. The
data will continue to cycle as you click, allowing you to see the text for the
remaining students that are covered by that data point.
See an example below:
Administrator User’s Manual: Fountas & Pinnell Benchmark Assessment Online Data Management System ©
43
Class Report –
Comprehension
Below is an example of the same Class Comprehension report in a table format
and in a graph format:
Table
Graph
To view a Class Comprehension report, confirm that the Classes tab is forward.
Administrator User’s Manual: Fountas & Pinnell Benchmark Assessment Online Data Management System ©
44
Steps to view
1) Choose the appropriate School Year from the school year tabs at the bottom
of the reports area:
2) Select the appropriate school from the “Select a School” drop down list.
(District-Level Administrator only)
3) Select the appropriate teacher from the “Select a Teacher” drop down list.
4) Select the appropriate class from the “Select a Class” drop down list.
5) Select the report option “Comprehension” from the “Select a Report” drop
down list.
6) Confirm that you are viewing the expected Level (Instructional or Independent)
in the “Show data for” area.
7) Click on either the Table icon or the Graph icon to view the report type of your
choice:
Graph report options:
11) When viewing the graph, choose the
assessments that you would like to view
by clicking on the check boxes next to
each assessment in the key. Clicking on
the check box again will remove the
checkmark and will also remove that data
from the graph you are viewing.
Note: “1st Assessment” refers to the first assessment given to the student at which
they had the level of Independent or Instructional. The graph will show either
Independent Level or Instructional Level data, depending on which Level radio
button you chose in step 6 above.
8) Choose the type of Comprehension
score you would like to view by choosing
one of the radio button options below the
“F&P Benchmark” header. The type
defaults to Comprehension Total.
Administrator User’s Manual: Fountas & Pinnell Benchmark Assessment Online Data Management System ©
45
The bars on the graph also have dynamic rollover states, so if you roll the cursor
over a bar, the following data will appear:
Number of students
Assessment Number
Comprehension Total
See an example below:
Administrator User’s Manual: Fountas & Pinnell Benchmark Assessment Online Data Management System ©
46
Class Report –
Class Profile
Below is an example of the same Class Profile report in a table format and in a graph
format:
Table
Graph
To view a Class Profile report, confirm that the Classes tab is forward.
Administrator User’s Manual: Fountas & Pinnell Benchmark Assessment Online Data Management System ©
47
Steps to view
1) Choose the appropriate School Year from the school year tabs at the bottom of
the reports area:
2)
3) Select the appropriate school from the “Select a School” drop down list. (DistrictLevel Administrator only)
4) Select the appropriate teacher from the “Select a Teacher” drop down list.
5) Select the appropriate class from the “Select a Class” drop down list.
6) Select the report option “Class Profile” from the “Select a Report” drop down list.
7) Confirm that you are viewing the expected Level (Instructional or Independent) in
the “Show data for” area.
8) Click on either the Table icon or the Graph icon to view the report type of your
choice:
Table report options:
9) When viewing the table, choose the
assessments that you would like to view
by clicking on the check boxes next to
each assessment number. Clicking on the
check box again will remove the
checkmark and will also remove that
assessment’s data from the table you are
viewing.
Note: “1st Assessment” refers to the first assessment given to the student at which
they had the level of Independent or Instructional. The table or graph will show either
Independent Level or Instructional Level data, depending on which Level radio button
you chose in step 7 above.
Graph report options:
10) When viewing the graph, choose the
assessments that you would like to view
by clicking on the check boxes next to
each assessment in the key. Clicking on
the check box again will remove the
checkmark and will also remove that data
from the graph you are viewing.
Administrator User’s Manual: Fountas & Pinnell Benchmark Assessment Online Data Management System ©
48
The bars on the graph also have dynamic rollover states, so if you roll the cursor over
a bar, the following data will appear:
Number of students
Assessment Number
Administrator User’s Manual: Fountas & Pinnell Benchmark Assessment Online Data Management System ©
49
School Report
Below is an example of the same School report in a table format and in a graph
format:
Table
Graph
To view a School report, confirm that the Schools tab is forward.
Administrator User’s Manual: Fountas & Pinnell Benchmark Assessment Online Data Management System ©
50
Steps to view
1) Choose the appropriate School Year from the school year tabs at the bottom
of the reports area:
2) Select the school(s) for which you would like to view data in the first “Show
data for” school area, as seen below:
(Only District-Level Administrators will see more than one school.)
Check boxes appear next to the available
schools. You can click on a check box to
remove the checkmark; this will remove that
school’s data from the report you are
viewing. You can click on the check box
again to replace the checkmark; this will add
that school’s data back into the report.
3) Confirm that you are viewing the expected Level (Instructional or Independent)
in the “Show data for” reading level area.
4) Select the grade(s) for which you would like to view data in the “Show data for
grade:” check box area.
Check boxes appear next to all of the grade
options, whether or not data exists for all
grades. You can click on a check box to add
that grade’s data into the report you are
viewing, or you can uncheck a check box to
remove that grade’s data from the report by
clicking on it again. You can check boxes for
as many grades as you would like.
5) Confirm that you are viewing data within your expected date range in the
“Show data between” area. The dates default to the school year.
6) Click on either the Table icon or the
Graph icon to view the report type of
your choice:
The bars on the graph also have
dynamic rollover states, so if you roll
the cursor over a bar, the following
data will appear:
Number of students
Administrator User’s Manual: Fountas & Pinnell Benchmark Assessment Online Data Management System ©
51
Print Reports
All reports can be printed in full color. While you are viewing the report you would
like to print, click on the Print button located in the lower right corner of the report
view:
1.) Click the Print button.
2.) Select your printer from the “Print” window that pops up, and click the Print
button.
An example of a printed report is below:
Administrator User’s Manual: Fountas & Pinnell Benchmark Assessment Online Data Management System ©
52
The Report printout will include all of the information that is shown in the report
view online.
This printout will include the relevant combination of the headers:
Fountas & Pinnell Benchmark Assessment
Report Name
Student Name
Class Name
Teacher Name
School Name
Instructional or Independent Level
Dates
School Year
Report Key/Legend
The Reports printout will be in the same format (log, table, or graph) that you are
viewing when you click the Print button.
Built by:
Administrator User’s Manual: Fountas & Pinnell Benchmark Assessment Online Data Management System ©
53