1
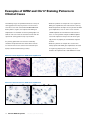
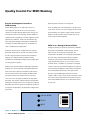
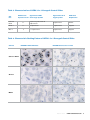
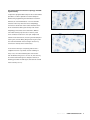
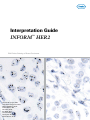
Interpretation Guide INFORM HER2 TM DNA Probe Staining of Breast Carcinoma Thomas M. Grogan, M.D. Lidija Pestic-Dragovich, Ph.D. Abigail McElhinny, Ph.D. Frank Vladich, M.S. Hiro Nitta, Ph.D. Eric Walk, M.D. Christina Reita Christopher Roberts Patrick Roche, Ph. D. INTRODUCTION 1 Quality Control for SISH Staining 14 General Description of INFORM™ HER2 DNA Probe 1 Positive and Negative Controls for SISH Staining 14 Purpose of Interpretive Guide 1 HER2 3-in-1 Xenograft Control Slides 14 Identification of Appropriate Staining Pattern HER2 Gene Status 2 16 Fixation 16 Signal Visualization and Enumeration of SISH Staining4 Sample Thickness 16 Target Area 4 Other Considerations 16 Slide Adequacy 5 Selecting Carcinoma Nuclei for Enumeration 6 Additional Observations 6 Determining HER2 Gene Status Method 1: Semi-Quantitiative Method 2 Pre-Analytical Considerations and Optimization of the Assay 8 18 References 21 Appendix A 22 9 Method 2: Quantitative Method 10 Method 2A: Additional Quantitation 11 Examples of HER2 and Chr17 Staining Patterns in Clinical Cases Troubleshooting 12 Score Sheets 22 Introduction General Description of INFORM™ HER2 DNA Probe Purpose of Interpretive Guide Ventana Medical Systems’ INFORM HER2 DNA Probe patterns that may be present in breast biopsies when is designed to quantitatively detect amplification of the stained with INFORM HER2 DNA Probe and Chromosome HER2 gene via chromogenic silver in situ hybridization 17 Probe. The photomicrographs allow new users to (SISH) in formalin-fixed, paraffin-embedded human become familiar with the spectrum of staining patterns breast cancer tissue specimens, following staining on including single-copy staining of HER2 and Chromosome Ventana automated slide stainers using light microscopy. 17, amplified gene copies and clusters of HER2 staining, The INFORM HER2 DNA Probe is indicated as an aid as well as artifact staining that they may encounter. in the assessment of patients for whom Herceptin® Additionally, the images allow users to become familiar (trastuzumab) treatment is being considered. Results with determination of slide adequacy, enumeration from the INFORM HER2 DNA Probe are intended for methods, and troubleshooting of the assay. The intent use as an adjunct to existing clinical and pathologic is to provide pathologists with a tool to facilitate information currently used for estimating prognosis in interpretation of INFORM HER2 DNA and Chromosome patients with invasive breast cancer. 17 Probes’ staining patterns. Any staining performed The following cases illustrate the variety of staining in the end user’s lab should be interpreted within the A qualified reader experienced in the microscopic context of the controls run with the clinical cases at the interpretation of breast carcinoma specimens, ISH time of evaluation. See the package insert provided with procedures and the recognition of single and amplified these products for further information, and the Quality HER2 copies (which may require microscopic examination Control section of this guide. using objectives as high as 40X to 60X) must evaluate controls before interpreting results. The images contained in this interpretive guide were obtained using the INFORM HER2 DNA and Chromosome 17 Probes in the assay developed and validated on Ventana automated slide stainers under the direction of Ventana Medical Systems, Inc. 800 227 2155 www.ventanamed.com 1 Identification of Appropriate Staining Pattern HER2 Gene Status ratio is either equal to or falls between 1.8 and 2.2 (Figure The HER2 gene is located on human Chromosome 17 1, Case 2). Finally, if the HER2/Chr17 ratio is greater than and encodes the HER2 protein. Amplification of the 2.2, a sample is positive for HER2 gene amplification HER2 gene occurs in approximately 15 to 25 percent of (Figure 1, Case 3). These classifications are summarized breast cancers, and is associated with aggressive tumor in Table 1. behavior.1-5 In many clinical studies, amplification and/or overexpression of HER2 has been shown to be associated Ventana has designed this assay so that the INFORM with a poor clinical outcome for women with invasive HER2 DNA Probe is detectable on one slide and the breast cancer and correlated with several negative INFORM Chromosome 17 Probe is detectable on a prognostic variables, including estrogen receptor (ER) matched slide. The probes are visualized using silver in negative status, high S-phase fraction, positive nodal situ hybridization (SISH) and appear as discrete black status, mutated p53, and high nuclear grade.6,7 dots in the nuclei of normal cells (serving as internal positive controls for staining) and in invasive carcinoma. HER2 gene status is reported as a function of the ratio This strategy allows HER2 gene status to be determined of the average number of copies of the HER2 gene to the in the context of its chromosomal state, using standard average number of copies of Chromosome 17 (Chr17) per light microscopy with 20X, 40X, and/or 60x objectives. cell in an invasive breast carcinoma. HER2 gene status Ventana has developed two methods for enumerating is classified using the following guidelines.22 A sample HER2 gene status: a semi-quantitative method (Method is negative for HER2 gene amplification if the HER2/ 1) and a quantitative method (Method 2). These methods Chr17 ratio is less than 1.8 (Figure 1, Case 1). A sample is are discussed in greater detail in the Determining HER2 equivocal for HER2 gene amplification if the HER2/Chr17 Gene Status Section. Figure 1. HER2 Gene Status in Representative Cases Case 1 is negative for HER2 gene amplification Case 1: H&E 20X 2 Ventana Medical Systems HER2 60X a member of the Roche Group Chr17 60X Figure 1. (cont.) HER2 Gene Status in Representative Cases Case 2 is equivocal for HER2 gene amplification Case 2: H&E 20X HER2 60X Chr17 60X Case 3 is positive for HER2 gene amplification Case 3: H&E 20X HER2 60X Table 1. HER2 Testing Reported Results Average HER2/ Chr17 ratio Reported Result Chr17 60X Table 2. Signal Enumeration Single Copy Count as 1. HER2/Chr17 < 1.8 Negative for HER2 gene amplification 1.8 ≤ HER2/Chr17 ≤ 2.2 Equivocal for HER2 gene amplification Count as 2. HER2/Chr17 > 2.2 Positive for HER2 gene amplification Small Clusters Multiple Copies Count as 8. One small cluster (6) and 2 discrete dots are present. Large Cluster Count as 16. One large cluster (12) and 4 discrete dots are present. 800 227 2155 www.ventanamed.com 3 Signal Visualization and Enumeration of SISH Staining the relative number of amplified copies in the cancer nuclei. Figure 2, Case 5 shows a number of nuclei in which multiple discrete copies are visible. SISH signals are visualized as single copies, multiple copies, and clusters (Table 2). Clusters Single Copy In some nuclei, clusters of dots representing many copies A discrete dot is counted as a single copy of HER2 or of HER2 gene are apparent. A small cluster of multiple Chr17. Discrete single dots visualized in the internal signals is counted as six signals, and a large cluster as 12 positive control nuclei represent the size of a single copy signals. It is possible for a single nucleus to have multiple in invasive carcinoma cells (See Figure 2, Case 4). It is small clusters, multiple large clusters, or a combination of important to note that the discrete dots representing a large and small clusters. Figure 2, Case 6 shows a number single copy of either HER2 or Chr17 may appear larger of nuclei in which clusters are visible, both small and large. in some patient samples than in others. Because of this, it is important to use the single dots visualized in the internal positive control nuclei adjacent to the target area as a reference. The internal positive control nuclei occur Target Area within normal adjacent stromal cells (e.g. fibroblasts, It is important that the reader identify acceptable target fibrocytes, and endothelials) and leukocytes (e.g. areas for signal visualization and enumeration within the lymphocytes and macrophages) (Figure 3). sample. An acceptable target area must be located within the invasive breast carcinoma; carcinoma in situ should Multiple Copies not be scored. As described above, discrete single dots visualized in the internal positive control nuclei represent the size Once located, the target area must satisfy two criteria to of a single copy in invasive carcinoma cells. The size of be deemed adequate for enumeration. This is discussed these single dots is used as a reference to determine thoroughly in Slide Adequacy (D). Figure 2. Signal Visualization Single Copy Case 4: H&E 60X HER2 60X Chr17 60X A B Case 5: H&E 60X Multiple copies and small clusters 4 Ventana Medical Systems Case 6: HER2 60X Small (A) and large (B) clusters a member of the Roche Group A Slide Adequacy that single-copy SISH signals are visible in normal cells Before enumerating a HER2 or Chr17 stained slide, it within and/or adjacent to the target area (See Figures is critical that the reader determine whether the target 1-3). Figure 4 shows an example of a slide that would be area is adequately stained. The target area must satisfy considered inadequate due to a lack of internal positive two criteria to be deemed adequate for enumeration. control staining in or adjacent to the target area. If the slide does not meet these criteria, it cannot be enumerated. The user should refer to the troubleshooting SISH staining within the invasive breast carcinoma section and evaluate the appropriate conditions for re- cells in the target area must be enumerable staining the slide. Using 20X, 40X, and/or 60X objectives, the invasive breast carcinoma in the target area must exhibit an enumerable Internal Positive Control Staining must be present Normal HER2 or Chr17 signals (one to two copies per cell that are visible as distinct “Single Copy” staining) act as internal positive controls and should be visible using 20X, 40X, or 60X objectives. This distinct nuclear staining may be located in various non-neoplastic cells including: stromal fibroblasts, endothelial cells, lymphocytes, and benign breast epithelial cells (Figure 3). Due to truncation artifacts in the plane of sectioning, it usually is not possible to visualize single HER2 gene or Chr17 copy number in all cells on the slide, nor in all regions field of HER2 or Chr17 SISH signals. Due to truncation in the plane of sectioning, it is likely that not every carcinoma nucleus will contain SISH signals. However, it is important that the target area contains an acceptable region that is enumerable. If a particular target area is deemed too weak to enumerate, it is often possible to enumerate a different target area on the same slide. If acceptable SISH staining within any of the target areas is not present, then the slide is considered inadequate and cannot be enumerated. Figure 5 is an example of a target area that would be considered inadequate. of the tissue. However, accurate enumeration requires Figure 3. Normal Staining in Internal Positive Control Nuclei Case 2 is equivocal for HER2 gene amplification Case 7: H&E 60X HER2 60X Chr17 60X Figure 4. Inadequate Due to a Lack of Figure 5. Inadequate Due to Weak Internal Positive Control Staining in or SISH Staining Within the Target Area Adjacent to the Target Area Case 8: HER2 60X Case 9: HER2 60X 800 227 2155 www.ventanamed.com 5 Selecting Carcinoma Nuclei for Enumeration for HER2 copy number. In these cases, there can be a Once a target area that exhibits adequate SISH staining and/or a mixture of nuclei containing various numbers of is located, only representative carcinoma nuclei should copies of HER2. This may be observed among carcinoma be enumerated. Signal enumeration should not be cells within the same target area, or between two performed in areas that contain weak SISH signals (i.e., different target areas within the tissue. It is recommended no internal control cell staining present), compressed that the nuclei with the higher numbers of HER2 or overlapping nuclei, or necrosis. Additionally, signal copy number be chosen for enumeration, but that the enumeration should not be performed in nuclei that are heterogeneity in relative copy number be noted on the not representative of the general population of invasive patient’s report. mixture of nuclei that are amplified and not amplified carcinoma nuclei in the target area. Abnormal, giant nuclei (2-fold or greater the size of other carcinoma Polysomy nuclei) and small nuclei (about half the size of the other Polysomy is a condition in which the carcinoma nuclei carcinoma nuclei) should not be enumerated. Finally, in contain at least one more chromosome than normal target areas that are genetically heterogeneous for HER2 (i.e. the average number of Chromosome 17 copies is copy number, count only nuclei that are representative not diploid). In these nuclei, there may be three or more of the population of invasive carcinoma nuclei with the copies of the chromosome (Figure 6, Case 11 and Case highest average number of signals. Heterogeneity is 12). Note: This is not to be confused with diploid, dividing discussed in greater detail in Additional Observations. nuclei present throughout the tissue that contain 3-4 copies of Chromosome 17). Monosomy Additional Observations Monosomy is a condition in which the carcinoma nuclei Other observations regarding the HER2 or Chr17 SISH contain only one copy of Chromosome 17. staining may be clinically significant and should be noted as comments on the pathologist’s report. Monoallelic Deletion Monoallelic Deletion is the deletion of the HER2 gene Heterogeneity from Chromosome 17 (Figure 6, Case 12). Occasionally, tissue samples may contain breast carcinoma nuclei that are genetically heterogeneous 6 Ventana Medical Systems a member of the Roche Group Figure 6. Additional Observations Regarding HER2 or Chr17 Staining The HER2 image for Case 10 contains both invasive carcinoma (A) and atypical ductal hyperplasia (B). If the hyperplasia were enumerated, the case would be negative. It is important to only enumerate invasive carcinoma and use the H&E slide as a guide. B B A Case 10: H&E 60X HER2 60X A Chr17 60X Case 11 is positive for HER2 gene amplification but note coincidental Polysomy Chromosome 17. Case 11: HER2 60X Case 9: HER2 60X Chr17 60X HER2 copy number for Case 12 is approximately 2, but note that Chromosome 17 is polysomic. Thus, Chromosome 17 was duplicated, but there was also a genetic loss of the HER2 allele. The case report should note Monoallelic Deletion for Case 12. Case 12: H&E 60X HER2 60X Chr17 60X 800 227 2155 www.ventanamed.com 7 Determining HER2 Gene Status In a study 23 that analyzed fluorescence in situ Figure 7. Frequency Distribution of hybridization (FISH) testing in clinical laboratories, HER2/Chr17 Ratios by FISH the frequency of HER2/Chr17 ratios in invasive breast 400 carcinoma was determined to have the distribution shown 350 the workflow of a pathology laboratory and generates 300 results that are reproducible between readers, Ventana 250 has developed a two-part approach (Figure 8). Frequency in Figure 7. To develop a scoring algorithm that fits within 15.3% 200 150 100 50 Method 1 Method 2 Semi-Quantitatively determine HER2/Chr17 Ratio Quantitatively determine HER2/Chr17 Ratio Ratio? 1.4 ≤ Ratio ≤ 4.0 12.00 11.40 10.80 10.20 9.60 9.00 8.40 7.80 7.20 6.60 6.00 FISH Ratio Figure 8. Overview of HER2 SISH Scoring Algorithm <1.4 5.40 4.80 4.20 3.60 3.00 2.40 1.80 0.60 1.20 0 <1.8 Ratio? >2.2 >4.0 Negative Positive Negative Equivocal Positive Method 1 allows the reader to rapidly and semi- to Method 2, a quantitative method. This is recommended quantitatively determine HER2 gene status for to ensure accuracy in determining HER2 gene status. As approximately 85% of all cases, which are either clearly cited above23, approximately 15% of breast carcinoma negative or positive for HER2 gene amplification (i.e., cases will fall within the range of 1.4 and 4.0. cases with a HER2/Chr17 ratio less than 1.4 or greater than 4.0). This is done by analyzing the overall staining patterns Alternately, a reader may choose to skip Method 1 and of HER2 and Chromosome 17 within a target area. proceed directly to Method 2, the quantitative method, for enumeration of the HER2/Chr17 ratio. For the minority of cases in which the HER2/Chr17 ratio falls within the range of 1.4 to 4.0, the reader must proceed 8 Ventana Medical Systems a member of the Roche Group Method 1: Semi-Quantitative Method HER2 and Chr17 within the target area. Calculate the Using Method 1, the reader semi-quantitatively estimates HER2/Chr17 ratio by dividing the average number of the average number of HER2 and Chr17 signals in the HER2 signals by the average number of Chr17 signals. target area and records the HER2/Chr17 ratio. Cases with a HER2/Chr17 ratio less than 1.4 are negative for HER2 gene amplification while cases with a HER2/ Utilizing stained serial slides that meet the criteria Chr17 ratio more than 4.0 are positive for HER2 gene for Slide Adequacy, locate the same target area on amplification and can be reported as such. Cases with a each slide of HER2 and Chr17 and determine, semi- HER2/Chr17 ratio that is either equal to or falls between quantitatively, the average number of signals in the Target 1.4 and 4.0 must be enumerated using Method 2 to Area according to Table 2—Signal Enumeration. This is ensure accuracy (Figure 9). performed by analyzing the overall staining pattern for Figure 9. Method 1 Scoring Algorithm 1.4 HER2/Chr17 Ratio 1.0 4.0 2.0 Negative for HER2 Gene Amplification Start 3.0 5.0 Go to Method 2 HER2 stained slide Slide adequate? 6.0 Positive for HER2 Gene Amplification Method 1 No Unsatisfactory Yes Identify and select target area 1 Semi-quantitatively determine the average number of HER2 signals Chr17 stained slide Slide adequate? No Unsatisfactory Yes Locate target area 1. Semi-quantitatively determine the average number of Chr17 signals Calculate HER2/Chr17 ratio Report Results Is Negative HER2/Chr17 < 1.4 1.4 ≤ HER2/Chr17 ≤ 4.0 No Positive ? HER2/Chr17 > 4.0 Yes Use Method 2 800 227 2155 www.ventanamed.com 9 Method 2: Quantitative Method Signal Enumeration. Calculate the HER2/Chr17 ratio by Using Method 2, the reader records the quantitative dividing the total number of HER2 signals by the total enumeration of HER2 and Chr17 signals in 20 nuclei number of Chr17 signals. Cases with a HER2/Chr17 ratio within a target area, and calculates the HER2/Chr17 ratio. less than 1.8 are negative for HER2 gene amplification, while cases with a HER2/Chr17 ratio greater than 2.2 are Utilizing stained serial slides that meet the criteria for positive for HER2 gene amplification and can be reported Slide Adequacy, locate the same target area on each slide as such. Cases with a HER2/Chr17 ratio that is either of HER2 and Chr17 and count the number of signals in 20 equal to or falls between 1.8 and 2.2 must be enumerated cells located in the Target Area according to Table 2— using Method 2A to ensure accuracy (Figure 10). Figure 10. Method 2 Scoring Algorithm 1.8 HER2/Chr17 Ratio 1.0 2.2 3.0 2.0 Go to Negative for HER2 Gene Amplification Method HER2 stained slide Slide adequate? Method 2 No Unsatisfactory Yes Identify and select target area 1 Count HER2 signals in 20 nuceli Chr17 stained slide Slide adequate? No Unsatisfactory Yes Locate target area 1. Count Chr17 signals in 20 nuceli. Calculate HER2/Chr17 ratio by dividing the total number of HER2 signals from target area 1 by the total number of Chr17 signals fron target area 1 Is 1.8 ≤ HER2/Chr17 ≤ 2.2 No ? Yes Method 2A 10 Ventana Medical Systems 6.0 Positive for HER2 Gene Amplification 2A Start 5.0 a member of the Roche Group Report Results Negative HER2/Chr17 < 1.8 Positive HER2/Chr17 > 2.2 Method 2A: Additional Quantitative in both target areas (40 cells) by the total number of For cases that have been enumerated using Method 2 Chr17 signals in both target areas (40 cells). Results are and have a HER2/Chr17 ratio either equal to or between reported as: 1.8 and 2.2, Method 2A must be utilized. The reader a. N egative for HER2 gene amplification. Defined as a HER2/Chr17 ratio less than 1.8. selects a second target area for each of HER2 and Chr17 b. E quivocal for HER2 gene amplification. Defined as a and counts the number of signals in 20 additional nuclei. The HER2/Chr17 ratio using counts from both target HER2/Chr17 ratio equal to or between 1.8 and 2.2. areas is then calculated. A total of 40 nuclei will have c. P ositive for HER2 gene amplification. Defined as a HER2 Chr17 ratio greater than 2.2. been read between both target areas. Calculate the HER2/ Chr17 ratio by dividing the total number of HER2 signals Figure 11. Method 2A Scoring Algorithm 1.8 HER2/Chr17 Ratio 1.0 2.2 3.0 2.0 Negative for HER2 Gene Amplification Equivocal 5.0 6.0 Positive for HER2 Gene Amplification Method 2A Start Method 2A HER2 stained slide Identify and select target area 2 Count HER2 signals in 20 nuceli Chr17 stained slide Locate target area 2. Count Chr17 signals in 20 nuceli. Calculate HER2/Chr17 ratio by dividing the total number of HER2 signals from target area 1 and 2 by the total number of Chr17 signals fron target area 1 and 2 Report Results Negative HER2/Chr17 < 1.8 Equivocal 1.8 ≤ HER2/Chr17 ≤ 2.2 Positive HER2/Chr17 > 2.2 800 227 2155 www.ventanamed.com 11 Examples of HER2 and Chr17 Staining Patterns in Clinical Cases The following images are provided to illustrate a variety of • Photoset A provides an example of a case negative for staining patterns that may be present in invasive breast HER2 gene amplification, with matched Chr17 staining. carcinoma cases when stained with INFORM HER2 DNA • Photoset B provides examples of cases positive for HER2 Probe: positive, negative, and equivocal for HER2 gene gene amplification, cases 14 and 15. Case 16 shows amplification. The intended use of these photographs is to a HER2 amplified case with H&E and matched Chr17. allow the new user of this test to become familiar with the Cases 17 and 18 provide examples of HER2 amplified spectrum of staining patterns they may encounter. cases with emphasis on the presence of normal gene copy number in lymphocytes and fibroblasts adjacent Any staining performed in the end user’s laboratory should be interpreted within the context of the controls to tumor. •P hotoset C provides an example of a case that was run with the clinical cases at the time of evaluation (See initially equivocal for HER2 gene amplification, corrected Quality Control for SISH Staining section). to negative by polysomy Chr17 staining. This case illustrates the importance of a dual HER2/Chr17 result. Photoset A. Case Negative for HER2 Gene Amplification Case 13: H&E 60X HER2 60X Photoset B. Cases Positive for HER2 Gene Amplification Case 14: HER2 60X 12 Ventana Medical Systems Case 15: HER2 60X a member of the Roche Group Chr17 60X Photoset B. (cont) Cases Positive for HER2 Gene Amplification Case 16: H&E 60X HER2 60X Chr17 60X Note normal lymphocytes and fibroblasts (denoted with an arrow) adjacent to tumor. Case 17: HER2 60X Case 18: HER2 60X Photoset C. A Case Initially Equivocal for HER2 Gene Amplification Corrected to Negative by Polysomy 17 Case 19 is an initially borderline HER2 case corrected by polysomy 17 chromosome ratio to negative for HER2 gene amplification. Case 19: HER2 60X Chr 17 60X 800 227 2155 www.ventanamed.com 13 Quality Control For SISH Staining Positive and Negative Controls for SISH Staining Separate positive controls are not required. Normal HER2 signals (1 to 2 copies per cell) act as Since the HER2 gene and Chromosome 17 are present in internal positive controls for each case and must be every human cell, there is no true negative tissue control. visible in the sample. Specific SISH nuclear staining may For the purpose of a negative reagent control, Ventana be located in various cells including: stromal fibroblasts, produces an ISH negative control reagent that can be endothelial cells, lymphocytes, and non-neoplastic breast used in place of the DNA probes. epithelial cells. However, not all cells will exhibit single gene copy due to biological heterogeneity and plane of sectioning. If normal HER2 signals are not evident, the HER2 3-in-1 Xenograft Control Slides slide is inadequate for interpretation. Xenograft controls are useful for a preliminary validation A positive control may be included with every staining of the processing methods used for staining clinical procedure performed. The controls are used to confirm slides, and for use as controls on individual runs. that the reagents and the instrument have functioned Ventana offers the HER2 3-in-1 Xenograft Control Slides properly. (It is important that the optimal staining (p/n 783-4332), containing three distinct xenograft conditions be established on biopsy control samples prior sections that are formalin-fixed and embedded in a to running patient samples.) single paraffin block (Figure 12). The cell lines (Calu-3 or BT474, ZR-75-1, and MCF-7), generated as xenograft Positive tissue controls should include biopsy specimens sections, have been selected based upon their molecular prepared in a manner identical to the patient specimens characterization of HER2 gene copy number and protein to be tested. These specimens should be used because levels (from published literature), and represent the they are known to have normal copies of HER2 in both dynamic range of HER2 copies observed in clinical the control stromal cells and the invasive carcinoma samples (Tables 3 and 4). Note that the xenografts contain cells. These serve as quality controls for all steps of the host mouse cells interspersed with the human carcinoma procedure, from the pre-analytical specimen preparation cells. Human HER2 and Chr17 are not detectable in these through the staining process. Use of a specimen prepared mouse cells. differently from the test specimens will provide control for all reagents and procedures except fixation and specimen processing. ZR-75-1 MCF-7 Figure 12. HER2 3-in-1 Xenograft Control Slides 14 Ventana Medical Systems a member of the Roche Group HER2 Control Calu-3 or BT474 Table 3. Characterization of HER2 3-in-1 Xenograft Control Slides Cell Line HER2 Protein Approximate HER2 Expression Level Gene Copy# by FISH Approximate Chr17 Copy# by FISH HER2 Gene Amplification Calu-3 or BT474 3+ Equal to or greater than 20 copies/nuclei 3 copies/nuclei Positive ZR-75-1 1+ 3 copies/nuclei 2 copies/nuclei Negative 1-2 copies/nuclei 2 copies/nuclei Negative MCF-7 0 Table 4. Characteristic Staining Pattern of HER2 3-in-1 Xenograft Control Slides Cell Line INFORM™ HER2 DNA Probe INFORM Chromosome 17 Probe Calu-3 or BT474 ZR-75-1 MCF-7 800 227 2155 www.ventanamed.com 15 Pre-Analytical Considerations and Optimization of the Assay Pre-analytical sample preparation is an essential factor involves treatment of the tissue with a stronger protease to consider before using any in situ hybridization assay. (e.g., ISH Protease 2 for four minutes or ISH Protease 3 for For the INFORM HER2 DNA Probe, Ventana recommends 12-24 minutes). For additional information on fixation for that the tissue be fixed in 10% neutral buffered formalin ISH, refer to the CAP/ASCO Guideline Recommendations (NBF) for 6-24 hours, paraffin embedded, and sectioned for HER2 Testing.22 at approximately four microns. Ventana has developed the INFORM HER2 DNA Probe assay with protease treatment options that will enable optimization of the assay in different laboratories, and for subsequent troubleshooting Sample Thickness of individual slides that may exhibit sub-optimal staining. Samples with a thickness of greater than four microns It is recommended that each laboratory perform staining likely will require the use of a stronger protease runs on representative biopsy samples that have been treatment, such as Ventana’s ISH Protease 2 for a prepared under the identical conditions as the clinical treatment time of four minutes or longer. This protease samples to be tested. This will aid in optimizing the specific treatment is effective at unmasking DNA in thicker SISH staining conditions for individual laboratories that samples. Thinner sections may require gentler protease may vary in their exact specimen preparation procedures. treatments (i.e., ISH Protease 3 for four minutes) if excessive nuclear background staining is observed (See Troubleshooting). Fixation For samples fixed in 10% NBF and sectioned at approximately four microns, Ventana ISH Protease 3 is Other Considerations recommended for eight minutes, for both HER2 and Chr17 Type of specimen probes. Tissue fixed in either 10% NBF (recommended) It also is important to consider the type of specimen to be or Zinc formalin are suitable specimen types for the tested in the assay (for example, tissue obtained from a INFORM HER2 DNA Probe Assay. Tissue fixed in needle biopsy vs. an excisional biopsy). Optimizing the ISH alcoholic formalin may be a suitable specimen type but Protease treatment conditions on each specimen type may may not stain as robustly as tissue fixed in either 10% be necessary if differences in staining quality are observed. NBF or Zinc formalin. Prefer and Bouin’s fixatives were demonstrated to be incompatible with this Overall sample quality assay, as samples fixed using these two fixatives SISH staining may be sub-optimal in tissue containing failed to yield single copy gene detection. Tissues areas of crush artifact, necrosis, or in tissue of overall that have been fixed inappropriately sometimes can be poor morphology. It is recommended that H&E staining identified by the presence of peripheral SISH staining, be evaluated from each case to evaluate overall specimen with weak or absent staining in the center of the tissue. morphology. Troubleshooting for weak or absent staining, as discussed in the Troubleshooting Section, is recommended. This 16 Ventana Medical Systems a member of the Roche Group The balance between nuclear morphology and SISH signal intensity. In specimens prepared differently from the recommended procedures, it often is possible to visualize adequate SISH staining by optimizing the ISH Protease treatment. However, the use of ISH Protease 2 or 3 for extended amounts of time may affect the nuclear morphology and nuclear counterstain. Each reader should be aware of this and balance SISH signal intensity with nuclear morphology and counterstain. Furthermore, HER2 or Case 20 Chr17 SISH staining may decrease in intensity if too harsh a Protease treatment is used. (For samples that exhibit a weak counterstain, increasing the Hematoxylin II staining time, and the Bluing Reagent staining time, from the recommended four minutes to eight minutes may enhance the intensity of the counterstain). Tissue that has been pre-analytically processed in a suboptimal manner may exhibit “nuclear bubbling”. In many cases, the nuclear bubbling does not interfere Case 21 with the SISH staining such as in Case 20, and cells may be enumerated if SISH signal is adequate. However, if bubbling precludes the SISH signal, affected cells should not be scored (Case 21). 800 227 2155 www.ventanamed.com 17 Troubleshooting This section addresses issues that may be encountered must be re-run. Check that the instrument and reagent with the assay. dispensers are functioning properly, and that the bulk reagents are adequately filled. Also check to make sure Lack of Staining on Xenograft Control Slides that the dispensers have not been stored without their If there is a lack of expected staining of the HER2 3-in-1 caps on, as silver acetate is known to oxidize over time. Xenograft Control Slides (i.e., an absence of single copy staining of HER2 or Chromosome 17), check to ensure that all dispensers are functioning properly. Non-Specific Staining—Nuclear Dust or Haze If the slides exhibit excessive background staining that interferes with enumeration of the specific SISH signals (i.e., nuclear dust or haze), the use of a gentler protease Weak or Absent Staining When cases (both HER2 and Chr17) exhibit weak or treatment (e.g., ISH Protease 3 for four minutes, instead of 8 minutes), is recommended. absent staining (and the weak staining is found to interfere with cell signal enumeration), this often indicates a problem Weak or Absent Staining of Positive Control with specimen preparation. Repeat staining on the case If the positive control is negative or exhibits weaker using a stronger protease treatment (e.g., ISH Protease staining than expected, other positive controls stained on 2 for four minutes) or a hybridization time longer than six the same staining run should be checked to determine hours. If a case has stained appropriately for one probe whether the failure is due to the control slide or the but not for the other (e.g., HER2 stains appropriately but reagents used. Ventana’s HER2 3-in-1 Xenograft Control Chr17 exhibits absent staining), repeat the staining of the Slides serve as run controls to ensure that the reagents affected slide utilizing the same protocol. If the staining and instrument are functioning properly. is still inadequate, this often indicates a problem with specimen preparation and staining should be repeated utilizing a stronger protease treatment or a longer hybridization time. Oxidizing or Fading of SISH Signal Oxidation, fading, and/or disappearance of the SISH signal may be due to certain brands of mounting media. The following mounting media are known to cause Weak or Absent Counterstain oxidation: EUKITT (EMS), Entellan (Merck), and For cases that exhibit a nuclear counterstain that is weak Entellan NEW (Merck). Please refer to Table 5 for or absent (making it difficult to discern nuclear mounting media compatibility. If the mounting media you boundaries), increase the counterstaining conditions from are using is not included in this list, we recommend that 4 minutes to 8 minutes. Weak counterstaining can indicate you validate that the media is compatible with the test that the specimen has not been prepared as recommended. system prior to use with patient samples. Internal studies Also, see the Pre-Analytical Considerations section have shown that fading usually occurs within a few hours for more information on the balance between nuclear to a week. morphology and SISH signal intensity. As further guidance, Table 6 has been created to help Non-Specific Staining—Slide Drying Artifact troubleshoot some of the issues described above. If a case or xenograft control slide exhibits uninterpretable SISH staining, with brown or black background For additional information, refer to the Step-By-Step throughout the tissue, the slide has dried and must be Procedure section in the automated slide stainer re-run. If excess silver is deposited on the slide, making it difficult to enumerate the nuclear SISH signal, the slide 18 Ventana Medical Systems a member of the Roche Group Operator’s Manual or contact your local Ventana office. Table 5. Mounting Media Compatibility Compatible with SISH? Mounting Media Manufacturer Eukitt EMS No Entellan New Merck No Entellan Merck No Cytoseal XYL Richard Allan Scientific Yes Paramount Protaqs Quartett: Dako Yes DPX BDH: Raymond Lamb Yes Cytoseal 60 Richard Allan Scientific Yes Permount Fisher Yes Histomount Raymond Lamb Yes Ultramount Dako Yes Thermo EZ Mount Thermo Scientific Yes SureMount Triangle Biomedical Sciences Yes Flo-Texx Lerner Labs Yes Mountex Histolab Yes Shandon Consul mount Thermo Scientific Yes MM24 SurgiPath Yes Pertex Cell Path Yes MicroMount SurgiPath Yes Diamount Diapath Yes Alcolmount Diapath Yes BioMount 2 BB International Yes Acrytol SurgiPath Yes Gel Mount Biomeda Yes Mount-Quick Daido Sangyo Co. Yes 800 227 2155 www.ventanamed.com 19 Table 6. Troubleshooting Lack of staining on xenograft control slides If there is a lack of expected staining in the HER2 3-in-1 Xenograft Control Slides (i.e., an absence of single copy staining of HER2 or Chromosome 17), the run is invalid. Check to ensure that all dispensers are functioning properly. Determine if weak staining interferes with slide enumeration. Weak or absent staining If staining is weak or absent, use a stronger protease treatment and/or increase the hybridization time to greater than 6 hours. Determine if weak counterstaining interferes with slide enumeration. Weak or absent counterstain If weak counterstaining interferes with slide enumeration, then repeat the staining of the affected slide(s) and either increase the counterstain time or utilize a gentler protease treatment (i.e., ISH Protease 3 for 4 min.). F or more information regarding the balance between nuclear morphology and SISH signal intensity, review the section on Pre-Analytical Considerations and Optimization of the assay. Check to make sure all bulk fluids are filled and reagent dispensers are working properly. Non-specific staining: slide drying artifact Repeat the staining of the affected slide(s) using the same protocol. If staining is still unacceptable, follow instrument user’s manual troubleshooting. Non-specific staining: nuclear dust or haze Weak or absent staining of positive control Determine whether non-specific staining interferes with slide eneumeration. If non-specific staining interferes with slide enumeration, then repeat the staining of the affected slide with a gentler protease treatment (i.e., ISH Protease 3 for 4 min.) and/or reduce hybridization time to less than 6 hours. If the positive control is negative or exhibits weaker staining than expected, other positive controls stained on the same staining run should be checked to determine whether the failure is due to the control slide or the reagents used. Ventana’s HER2 3-in-1 Xenograft Control Slides serve as run controls to ensure that the reagents and instrument are functioning properly. This may be due to certain brands of mounting media. Oxidizing or fading of SISH signal If the SISH signal of the sample begins to oxidize (turning orange) or completely disappears, restain the case and coverslip using a different mounting media. If a condition persists across multiple cases and repeated attempts to correct the condition, contact your local Ventana office. 20 Ventana Medical Systems a member of the Roche Group References 1. Slamon DJ, Godolphin W, Jones LA, et al. Studies of the HER-2/neu proto-ongene in human breast and ovarian cancer. Science 1989; 244:707-712. 2. Gschwind A, Fischer OM, Ullrich A. The discovery of receptor tyrosine kinases: target for cancer therapy. Nat Rev Cancer 2004; 4;361-370. 3. Muleris M, et al., Assignment of v-erb-b2 avian erythroblastic leukemic viral oncogene homolog 2 (ERBB2) to human chromosome band 17121.1 by in situ hybridization. Cytogenet Cell Genet 1997; 76:34-5. 4. Coussens L, Yang-Feng TL, Liao Y-C, Chen E, Gray A, McGrath et al. Tyrosine kinase receptor with extensive homology to EGF receptor shares chromosomal location with neu oncogene. Science 1985; 230:1132-1139. 5. Slamon DJ, Clark GM, Wong SG et al. Human breast cancer: correlation of relapse and survival with amplification of the HER-2/neu oncogene. Science 1987; 235:177-182. 6. Narita M, Nakao K, Ogino N, et al. Independent prognostic factors in breast cancer patients. Am J Surg 1998; 175:73-75. 7. O’Reilly SM, Barnes DM, Camplejohn RS, et al. The relationship between c-erbB-2 expression, S-phase fraction, and prognosis in breast cancer. Br J Cancer 1991; 63:444-446. 8. Pegram MD, Finn RS, Arzoo K, et al. The effect of HER-2/neu overexpression on chemotherapeutic drug sensitivity in human breast and ovarian cancer cells. Oncogene 1997; 15:537-547. 9. Press MF, Pike MC, Chazin VR, et al. HER-2/neu expression in node-negative breast cancer: Direct tissue quantitation by computerized image analysis and association of overexpression with increased risk of recurrent disease. Cancer Res 1993; 53:4960-4970. 10.Press MF, Bernstein L, Thomas PA, Meisner LF, et al. HER-2/neu gene amplification characterized by fluorescence in situ hybridization: Poor prognosis in node-negative breast carcinomas. J Clin Oncol 1997; 15:2894-2904. 11. Gusterson BA, Gelber RD, Goldhirsch A, et al. Prognostic importance of c-erbB-2 expression in breast cancer. J Clin Oncol 1992;10:1049-1056. 12.Bianchi S, Paglierani M, Zampi G, et al. Prognostic significance of c-erbB-2 expression in node negative breast cancer. Br J Cancer 1993; 67:625-629. 13. Kallioniemi O-P, Holli K, Visakorpi T, et al. Association of c-erB-2 protein expression with high rate of cell proliferation, increased risk of visceral metastasis and poor long-term survival in breast cancer. Int J Cancer 1991; 49:650-655. 14. Vogel CL, Cobleigh MA, Tripathy D, et al. Efficacy and safety of trastuzumab as a single agent in first-line treatment of HER2-overexpressing metastatic breast cancer. J Clin Oncol 2002; 20:719-726. 15.Baselga J, Carbonell X, Castaneda-Soto NJ, et al. Phase II study of efficacy, safety, and pharmacokinetics of trastuzumab monotherapy administered on a 3-weekly schedule. J Clin Oncol 2005; 23:2162-2171. 16.Slamon DJ, Leyland-Jones B, Shak S, et al. Concurrent administration of anti-HER2 monoclonal antibody and first-line chemotherapy for HER2-overexpressing metastatic breast cancer. A phase III, multinational, randomized controlled trial. N Engl J Med 2001; 344:783-792. 17. M arty M, Cognetti F, Maraninichi D, et al. Randomized phase II trial of the efficacy and safety of trastuzumab combined with docetaxel in patients with human epidermal growth factor receptor 2-positive metastatic breast cancer administered as first-line treatments: The M77001 Study Group. J Clin Oncol 2005; 23:42654274. 18.Piccart-Gebhart MJ, Procter M, Leyland-Jones B, et al. Trastuzumab after adjuvant chemotherapy in HER2-positive breast cancer. N Engl J Med 2005; 353:1659-1672. 19. Romond EH, Perez EA, Bryant J, et al. Trastuzumab plus adjuvant chemotherapy for operable HER2-positive breast cancer. N Engl J Med 2005; 353:1673-1684. 20.Bilous M et al. Current perspectives on HER2 Testing: A review of national testing guidelines. Mod Pathol 2003:173-182. 21. Sheehan DC, Hrapchak BB. Theory and practice of histotechnology, 2nd Edition. The C.V. Mosby Company, St. Louis, 1980. 22. Wolff, AC, Hammond, MEH, Schwartz, JN, et al. American Society of Clinical Oncology/College of American Pathologists Guideline Recommendations for Human Epidermal Growth Factor Receptor 2 Testing in Breast Cancer. Arch Pathol Lab Med 2007; 131: 18-43. 23.Press MF et al, Diagnostic Evaluation of HER-2 as a Molecular Target: An Assessment of Accuracy and Reproducibility of Laboratory Testing in Large, Prospective Randomized Clinical Trials, Clin Cancer Res 2005; 11 (18) September 15, 2005. 800 227 2155 www.ventanamed.com 21 Appendix A: Score Sheets Interpretation of Results – Score Sheet for Method 1 Method #1 HER2: Estimated average number of HER2 Signals in Target Area 1 a Chr17: Estimated average number of Chr17 Signals in Target Area 1 b HER2/Chr17 Ratio c = a/b Negative: HER2/Chr17 < 1.4 Positive: HER2/Chr17 > 4.0 1.4 ≤ HER2/Chr17 ≤ 4.0 Use Method #2 Interpretation of Results – Score Sheet for Method 2 and Method 2A Method #2 Target Area 1 Cell Target Area 2 HER2 Count Cell Chr17 Count Cell HER2 Count Cell 1 1 1 1 2 2 2 2 3 3 3 3 4 4 4 4 5 5 5 5 6 6 6 6 7 7 7 7 8 8 8 8 9 9 9 9 10 10 10 10 11 11 11 11 12 12 12 12 13 13 13 13 14 14 14 14 15 15 15 15 16 16 16 16 17 17 17 17 18 18 18 18 19 19 19 19 20 20 20 20 Total number of HER2 signals in Target Area 1 Total number of Chr17 signals in Target Area 1 d Total number of HER2 signals in Target Area 2 e Target Area 1 HER2/Chr17 Ratio Total number of Chr17 signals in Target Area 2 g k = (d+g)/(e+h) Negative: HER2/Chr17 < 1.8 Negative: HER2/Chr17 <1.8 Positive: HER2/Chr17 > 2.2 Positive: HER2/Chr17 > 2.2 1.8 ≤ HER2/Chr17 ≤ 2.2 Use Method #2A Equivocal: 1.8 ≤ HER2/Chr17 ≤ 2.2 Ventana Medical Systems h Target Areas 1 and 2 HER2/Chr17 Ratio f = d/e 22 Chr17 Count a member of the Roche Group Patient Centric Pathology W O R K F L O W | D I A G N O S T I C S Ventana Medical Systems, Inc. 1910 E. Innovation Park Drive Tucson, Arizona 85755 USA +1 (520) 887 2155 (800) 227 2155 (USA only) Roche Diagnostics GmbH Sandhofer Strasse 116 68305 Mannheim Germany www.ventanamed.com © 2008 Ventana Medical Systems, Inc. VENTANA® and BenchMark® are registered trademarks of Ventana Medical Systems, Inc. INFORM™ is a trademark of Ventana Medical Systems, Inc. HERCEPTIN® is a registered trademark of Genentech, Inc. E616 1008B