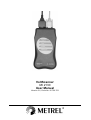
1
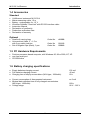
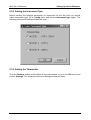
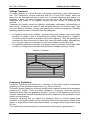
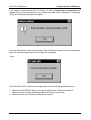
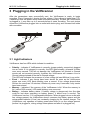
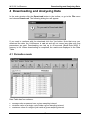
VoltScanner
MI 2130
User Manual
Version 3.0, Code No. 20 750 703
Distributor:
Manufacturer:
METREL d.d.
Ljubljanska cesta 77
1354 Horjul
Slovenia
web site: http://www.metrel.si
e-mail: [email protected]
Mark on your equipment certifies that this equipment meets the requirements of the EU
(European Union) concerning safety and interference causing equipment regulations
© 2000 METREL
No part of this publication may be reproduced or utilized in any form or by any means
without permission in writing from METREL.
2
MI 2130 VoltScanner
Table of contents
1. Introduction ----------------------------------------------------------------------------------------------- 4
1.1 Features----------------------------------------------------------------------------------------------- 4
1.2 Applied standards ---------------------------------------------------------------------------------- 4
1.3 Warnings---------------------------------------------------------------------------------------------- 4
1.4 Accessories ------------------------------------------------------------------------------------------ 5
1.5 PC Hardware Requirements--------------------------------------------------------------------- 5
1.6 Battery charging specifications ----------------------------------------------------------------- 5
1.7 Maintenance ----------------------------------------------------------------------------------------- 6
2
Setting Up the VoltScanner ------------------------------------------------------------------------ 7
2.1 Installing ScanLink package --------------------------------------------------------------------- 7
2.2 Selecting Language-------------------------------------------------------------------------------- 7
2.3 Sending Parameters to the VoltScanner ----------------------------------------------------- 7
2.3.1 Selecting a COM Port ------------------------------------------------------------------------ 7
2.3.2 Setting the Instrument Type ---------------------------------------------------------------- 8
2.3.3 Setting the Thresholds ----------------------------------------------------------------------- 8
2.3.4 Sending the Parameters--------------------------------------------------------------------13
3
Plugging in the VoltScanner ---------------------------------------------------------------------15
3.1 Light Indicators -------------------------------------------------------------------------------------15
4
Downloading and Analysing Data --------------------------------------------------------------17
4.1 Periodics mode-------------------------------------------------------------------------------------17
4.2 Periodics graphs -----------------------------------------------------------------------------------19
4.3 Event and Transient mode ----------------------------------------------------------------------21
4.4 Event and Transient graphs --------------------------------------------------------------------23
4.5 Supply Voltage Interruptions -------------------------------------------------------------------25
5
Managing Data ----------------------------------------------------------------------------------------27
6
Specifications -----------------------------------------------------------------------------------------29
6.1 General-----------------------------------------------------------------------------------------------29
6.2 Measurements--------------------------------------------------------------------------------------29
3
MI 2130 VoltScanner
Introduction
1. Introduction
1.1 Features
The VoltScanner is a simple instrument designed to record voltage characteristics at
the customers supply terminals in public electricity distribution systems, according to
the EN50160 standard.
It records voltage dips, swells, transient overvoltages, frequency variations and supply
interruptions.
The parameters that tell the VoltScanner what to record are set by PC using the
ScanLink package. Communication between the VoltScanner and a PC is carried via
RS232 cable and is optically coupled, so that the PC is electrically isolated.
VoltScanner can store about 3500 events.
The VoltScanner has four LEDs to provide different information about the state of the
VoltScanner (memory full, low battery, polarity, events).
1.2 Applied standards
Instrument operation: EN 50160
Safety: EN 61010-1
EMC emission: EN 50081-1
EMC immunity: EN 50082-2
1.3 Warnings
In order to reach the highest level of operator’s safety, it is necessary to consider the
following general warnings:
♦ If the instrument is used in a manner not specified in this User Manual, the
protection provided by the instrument may be impaired!
♦ Do not use the instrument and accessories, if any damage is noticed!
♦ Service intervention is allowed to be carried out only by a competent and
authorised person!
♦ Consider all generally known precautions in order to avoid the risk of electric
shock while dealing with electric installations!
♦ Use only standard or optional test accessories supplied by your distributor!
♦ Disconnect all test leads before opening the battery cover!
♦ Do not use nonrechargeable batteries
♦ If the instrument is disconnected, download Data during data retention time
(130 h with battery capacity of 600 mAh), otherwise data will be lost.
4
MI 2130 VoltScanner
Introduction
1.4 Accessories
Standard
•
•
•
•
•
•
•
•
VoltScanner instrument MI 2130 H
Mains measuring cable 1.5 m
Battery - rechargeable 4 x 1.2 V
Windows Software "ScanLink" with RS 232 interface cable
Instruction Manual
Declaration of conformity
Production verification data
Declaration of warranty
Optional
•
•
•
Small soft carrying bag
Universal test cable, 3 × 1.5 m
with 3 pcs safety test tips
Set of Alligator clips (black), 3 pcs
Order No.
A 1020
Order No
Order No.
S 1112
S 2010
1.5 PC Hardware Requirements
•
•
•
Pentium processor-based computer, with Windows 95, 98 or 2000, NT, XP
one free serial port
CD-ROM drive
1.6 Battery charging specifications
• Empty batteries charging current:
• Full batteries charging current:
• Charging time of empty accumulators (NiCd type, 1000mAh):
100 mA
40 mA
18 h
• Current consumption of disconnected instrument:
• Minimal data retention time of fully charged accumulators
ca 3 mA
(NiCd type, 1000mAh):
• Voltage range:
180 h
80 V – 265 V
5
MI 2130 VoltScanner
Introduction
1.7 Maintenance
Batteries
! The instrument is under hazardous voltage. Disconnect all test leads before
removing battery compartment cover.
If it is necessary to replace batteries, all four MUST be replaced. Ensure that
batteries are installed with correct polarity.
Do not use nonrechargeable batteries.
There may exist special environmental regulations concerning the disposal of
batteries. If requested, follow the regulations.
Cleaning
To clean the surface of an instrument, use a soft cloth slightly moistened with soapy
water or alcohol. Then leave the instrument to dry totally before use.
• Do not use liquids based on petrol or hydrocarbons!
• Do not spill cleaning liquid over the instrument!
Service and ReCalibration
For repairs under warranty, recalibration of the VoltScanner, and for further information,
please contact your distributor. It is recommended that VoltScanner is recalibrated once
every two years.
Manufacturer's address:
METREL d.d.
Ljubljanska 77
SI-1354 Horjul
tel: +(386) 1 7558 200
fax: +(386) 1 7549 095
e-mail: [email protected]
internet: www.metrel.si
6
MI 2130 VoltScanner
Setting Up the VoltScanner
2 Setting Up the VoltScanner
2.1 Installing ScanLink package
•
•
•
•
Close all other running applications, or restart Windows before installing the
ScanLink package.
Insert the ScanLink CD-ROM in your drive and run Setupex.exe.
Select the Destination Directory for the ScanLink package.
Click Next to begin the installation.
2.2 Selecting Language
Go to Config menu and choose Language option. It enables you to select one of the
available languages. You should restart the ScanLink program to apply the selected
language.
2.3 Sending Parameters to the VoltScanner
VoltScanner communicates with your PC via RS232 cable. Plug the RS232 cable into
an available COM port in your PC and into RS232 connector in the VoltScanner and
run the ScanLink.
2.3.1 Selecting a COM Port
With ScanLink program running, go to Config menu and choose COM port. The
following COM Port Configuration window will open. Choose appropriate COM port and
click OK. Baud Rate for the VoltScanner is by default 9600.
7
MI 2130 VoltScanner
Setting Up the VoltScanner
2.3.2 Setting the Instrument Type
Before sending the Settings parameters to instrument for the first time you should
select Instrument type. Go to Config menu and choose Instrument type option. The
following Instrument Settings window will open:
2.3.3 Setting the Thresholds
Click the Settings button in the toolbar in the main window, or go to the File menu and
choose Settings. The following Instrument Settings window will open.
8
MI 2130 VoltScanner
Setting Up the VoltScanner
VoltScanner can operate in two modes - Event & Transient and Periodics. Select the
appropriate menu for the VoltScanner to operate.
Event and Transient mode
In this mode the VoltScanner records single events that fall above or below the set
thresholds.
Event & Transient section has three subsections.
•
•
•
Line to Neutral
Neutral to Ground
Frequency
To change the value of any threshold click on the setting (the numbers become red)
and set the value with up and down buttons.
9
MI 2130 VoltScanner
Setting Up the VoltScanner
Voltage Swell
A voltage swell is an increase in line voltage that can last for an indefinite period. The
VoltScanner records swells that are above the set threshold for at least one cycle
(20ms/50Hz) with a 3 volts hysteresis.
Voltage swells are usually caused by fault conditions, the energization of large loads
which require high starting currents, intermittent loose connections in power wiring,
large load changes and power line switching. The fault condition can be close to or
remote from the point of interest. If swells reach too high a peak, they can damage
electrical equipment. The utility's voltage regulating equipment may not react quickly
enough to prevent all swells.
The next picture shows a short voltage swell lasting only two cycles.
Voltage Swell
Voltage Dip
A voltage dip is a decrease in line voltage that can last for an indefinite period. The
VoltScanner records dips that are below the set threshold for at least one cycle
(20ms/50Hz) with a 3 volts hysteresis.
Voltage dips are generally caused by faults occurring in the customers installations or in
the public distribution system. Common causes are short circuits on the electric power
system, motor starting, customer load additions, and large load additions in the utility
service area. Dips can cause computers and other sensitive equipment to malfunction
or simply shut off and can damage certain types of electrical equipment. The events
occur mostly in random manner. The majority of voltage dips have duration less than 1s
and depth less than 60%. The next picture shows a short voltage dip lasting only two
cycles.
Voltage Dip
10
MI 2130 VoltScanner
Setting Up the VoltScanner
Voltage Transient
A voltage transient is a short duration overvoltage which lasts a few milliseconds or
less. The VoltScanner records transients both on L-N and N-PE inputs, which are
above the set threshold and last at least 1us. It records magnitude and phase of a
transient. If there are more transients in one half cycle, the VoltScanner records
magnitude and phase of the highest transient and the number of transients that
occured.
Transients are usually caused by lightning, electrostatic discharges, load switching or
faulty wiring. Transients can erase or alter computer data and, in extreme cases, they
can even destroy electronic circuitry and damage the electrical equipment. Generally
speaking, transients can be classified into two categories:
•
•
An impulsive transient is a sudden, non-power frequency change in the steady state
condition of voltage, which is unidirectional in polarity (either positive or negative).
The most common cause of impulsive transients is lightning. They are generally not
conducted far from the source of where they enter the power system, although they
may, in some cases, be conducted for quite some distance along utility lines.
An oscillatory transient is a sudden, non-power frequency change in the steady state
condition of voltage which includes both positive and negative polarity values.
Impulsive Transient
Frequency Variations
Frequency Variations are defined as a deviation of the power system fundamental
frequency from its specified nominal value (e.g. 50 Hz or 60 Hz).
The power system frequency is directly related to the rotational speed of the generators
supplying the system. There are slight variations in frequency when the dynamic
balance between load and generator changes. The size of the frequency shift and its
duration depends on the load characteristics and the response of the generation control
system to load changes.
Frequency variations that go outside the accepted limits for normal steady state
operation of the power system can be caused by faults on the bulk power transmission
system, a large block of load being disconnected, or a large source of generation going
off- line.
The VoltScanner records frequency events whether the frequency goes above or
11
MI 2130 VoltScanner
Setting Up the VoltScanner
below the set threshold for at least three cycles.
The following picture shows a short frequency variation (high frequency), lasting only
two cycles.
Frequency Variation
Voltage Interruptions
Voltage Interruptions can be the result of power system faults, equipment failures and
control malfunctions. Interruptions can be classified into two categories:
•
•
long interruptions (longer than three and a half minutes)
short interruptions (up to three and a half minutes)
Long interruptions are often permanent and require human intervention to repair the
system for restoration. The VoltScanner records an interruption, if voltage drops below
90Vrms for at least one cycle (20ms/50Hz).
Periodics mode
In this mode the VoltScanner records the mean values of the supply voltage over a
given sampling interval. It also records the minimum and maximum cycle during each
sampling interval. This sampling interval is set in Periodics section by choosing
minutes or seconds and setting the time with up and down buttons. It can be set
between 1 second and 21 minutes at 50 Hz and 1 second and 18 minutes at 60 Hz.
The Estimated time tells you how long the VoltScanner will be recording before it runs
out of memory. If sampling interval is 1 second, this will be approximately 1 hour and for
sampling interval of 21 minutes, VoltScanner will keep recording for 47 days.
General Settings
There are some general parameters in the Instrument Settings window that have to be
set regardless of the thresholds chosen in Event & Transient or Periodics section.
Frequency
In this section the nominal frequency (50Hz or 60Hz) of the supply voltage must be set.
12
MI 2130 VoltScanner
Setting Up the VoltScanner
Voltage
In this section, the nominal value (220 - 240V or 110 - 130V) of the supply voltage must
be set.
Memory
In this section, you can choose between two modes of storing data. VoltScanner can
stop recording when memory is full, or can operate as circular FIFO (first in first out)
register and overwrite the oldest data.
Default Parameters
The VoltScanner has factory-installed threshold parameters that can be reached by
clicking the Default Parameters button.
If these factory-installed parameters don’t suit you, you can set your own default
parameters. By clicking the Save as Default button, you can save the parameters
which are currently in the Instrument Settings window as your default parameters. Note
that the factory-installed settings are erased once you save your own default
parameters.
EN 50160
By clicking the EN 50160 button, the parameters are set according to EN 50160
standard. This means:
• Voltage Swell and Voltage Dip in the Line to Neutral section are set to ±10% of the
nominal voltage
• High Frequency is set to 50,5Hz and Low Frequency to 49,5Hz.
• Sampling interval in the Periodics section is set to 10 minutes.
2.3.4 Sending the Parameters
By sending the parameters to the VoltScanner, all the data that is stored in the
VoltScanner is lost.
Click the Settings button in the toolbar and then click the Send Parameters button. The
following dialog box will appear.
13
MI 2130 VoltScanner
Setting Up the VoltScanner
If you want to proceed click the yes button. A notice Connecting to Instrument will
appear until the communication is over, which may take up to 8 seconds. If everything
is OK, the following dialog box will appear:
Click the OK button to clear the message. The VoltScanner starts to record immediately
after the communication has been successfully completed.
If not:
Click the OK button to clear the message and check the following possible errors:
•
•
•
Make sure that RS232 cable is securely plugged in the VoltScanner and PC
Make sure that no other windows program is using the serial port.
Make sure that your COM port settings are correct
14
MI 2130 VoltScanner
Plugging in the VoltScanner
3 Plugging in the VoltScanner
After the parameters were successfully sent, the VoltScanner is ready to begin
recording. Every 8 seconds it checks the line voltage. If the voltage is higher than 70V,
it wakes up from this power down mode and starts recording. So after the VoltScanner
is plugged in, it may take up to 8 seconds before it starts recording. The next picture
shows the VoltScanner plugged into an outlet with shuko plug, and universal test cable
with crocodiles.
L
N
PE
L
N
PE
Green
Blue
Black
3.1 Light Indicators
VoltScanner has four LEDs which indicate its condition:
•
•
•
•
Polarity – indicates if VoltScanner is correctly (proper polarity connection) plugged
into an outlet. If it is plugged in correctly, the LED lights steadily, otherwise it blinks
once every second. This will not damage the VoltScanner, but Neutral to Ground
events are not recorded correctly, because the VoltScanner will measure Line to
Ground voltage instead of Neutral to Ground voltage.
This LED also indicates the presence of a line voltage (at least 90Vrms) in an outlet.
Event – indicates if any events have been stored. As soon as the VoltScanner
stores one event, LED starts blinking once a second. If line voltage drops below
90Vrms for more than 3.5 minutes, it blinks only once every 8 seconds, if any events
have been stored.
Memory – indicates if the memory of the VoltScanner is full. When the memory is
full ( about 3500 events), LED starts blinking once a second.
Battery – indicates battery status. If battery voltage is dangerously low (the data
could be lost when operating on battery power), it blinks once a second. The
VoltScanner has four 1.2V rechargeable batteries. When plugged into an outlet with
line voltage present, the VoltScanner doesn't consume any battery power and the
rechargeable batteries (if low) are constantly charging by the internal charger. The
VoltScanner only operates on battery power when there is no line voltage present
(before it is plugged in, during voltage interruptions and after it is plugged out).
15
MI 2130 VoltScanner
Plugging in the VoltScanner
Note:
Before using the VoltScanner for the first time, plug it in an outlet for at least 5 hours
or over night, so that batteries will charge up.
If the VoltScanner hasn’t been used for more than two months, also plug it in an
outlet for at least 5 hours or over night before using it again.
If you don’t plan to use the VoltScanner for a longer period of time, you can always
leave it plugged into the nearest outlet (no need to be set), so that the batteries will
be full when you need it.
The LEDs only blink when line voltage is present. During longer voltage interruptions
(longer than 3.5 minutes), the VoltScanner goes into power down mode in which only
Event LED blinks every 8 seconds, if there are any events stored.
16
MI 2130 VoltScanner
Downloading and Analysing Data
4 Downloading and Analysing Data
In the main window click the DownLoad button in the toolbar, or go to the File menu
and choose DownLoad. The following dialog box will appear:
If you want to continue with the download click the Yes button. Note that once you
download the data, the VoltScanner is not set and will not record any data until new
parameters are sent. Downloading can last up to 40 seconds (Baud Rate 9600) if
memory is full. When downloading is completed, the results are displayed in the Data
Table.
4.1 Periodics mode
Data Table has four columns:
•
•
•
average value measured over a given sampling interval
minimum value of a single cycle inside a given sampling interval
maximum value of a single cycle inside a given sampling interval
17
MI 2130 VoltScanner
Downloading and Analysing Data
• date and time (at the end of each sampling interval)
If voltage was out of range, the Data Table will show the value 999.
By clicking the EN 50160 button, software performs an analysis according to the EN
50160 standard which requires:
• 95% of averages must be within the range ±10% of the nominal voltage
• all averages must be within the range +10% and -15% of the nominal voltage
This standard also requires that the sampling interval lasts 10 minutes, but the software
performs the same analysis, if sampling interval is different.
Before the analysis is performed, you must select the proper nominal voItage in order to
get the correct results.
The results of the EN 50160 analysis are presented at the top of the Data Table. The
first box shows the percentage of the measured averages that were within the range
+10%,-15% of the nominal voltage (this must be 100%) and the second box the
percentage of the measured averages that were within the range ±10% (at least 95%).
If both are OK, the overall evaluation is OK, otherwise NOT OK.
18
MI 2130 VoltScanner
Downloading and Analysing Data
At the top of the Data Table is info about the file: the File name and the mode, in which
the VoltScanner has recorded this file (Event & Transient or Periodics).
By clicking the Settings Info button, you can see with which thresholds the
VoltScanner was recording data in the current file.
Settings Info window:
4.2 Periodics graphs
By clicking the Graph button, you can view Voltage/Time graph with all three voltage
values: average, MIN and MAX.
If EN 50160 analysis was performed before drawing the graph, the graph includes red
lines that indicate high and low limit of the EN 50160 (±10% of nominal value).
Once the graph is drawn, it is easy to zoom in and out. For zooming in position the
mouse on the left upper corner of the area you want to inspect, left click and mark the
desired area by dragging the mouse. For zooming out just left click and drag the mouse
left and up.
19
MI 2130 VoltScanner
Downloading and Analysing Data
Zoom in graph:
20
MI 2130 VoltScanner
Downloading and Analysing Data
4.3 Event and Transient mode
The Data Table in the Event and Transient mode has four columns:
•
•
•
•
Begin time - date and time of the beginning of an event.
Duration,Phase - if the event is shorter than 2sec, it is displayed in number of cycles
(one cycle being 20ms at frequency 50Hz); if it is between 2sec and 2min, it is
displayed in seconds; if it is between 2min and 12h, it is displayed in hours, minutes
and seconds; if it is longer than 12h, it is displayed with date and time when the
event ended. If event is transient, the phase of the highest transient is displayed.
Magnitude - magnitude of an event in Volts or Hertz.
Event - event type.
If magnitude was out of range, Data Table will show the following values:
•
•
•
99.99 for frequency
999 for swells and dips
9999 for transients
At the bottom of the Data Table, you can choose which events you want to view in the
table. By default all boxes are checked, so that all events are in the table. If you want to
leave some events out, the box infront must be empty.
21
MI 2130 VoltScanner
Downloading and Analysing Data
It is also possible to choose the way of sorting the events. By default they are sorted by
time, but they can also be sorted by the type of event.
At the top of the Data Table you can find info about the file: the File name and the
mode in which the VoltScanner has recorded this file (Event & Transient or Periodics).
By clicking on the Settings Info button, you can see with which thresholds, VoltScanner
was recording data in the current file.
By clicking the EN 50160 button, the software performs frequency analysis according to
the EN 50160 standard which requires:
• 99.5% of the mean values measured over 10 seconds must be within the range
±1% of the nominal frequency.
This analysis also counts the interruptions and swells plus dips on the L-N line. The
results of this EN 50160 analysis are in a special table at the top of the Data Table:
•
•
•
Events - number of swells and dips on the L-N line. The limit is by default 100.
Interruptions - number of interruptions. The limit is by default 100.
Frequency - percentage of the mean values measured over 10 seconds that are
within ± 1% of the nominal frequency. The limit is 99.5%.
If all of these results are within their limits, overall EN 50160 evaluation is OK, otherwise
NOT OK.
22
MI 2130 VoltScanner
Downloading and Analysing Data
4.4 Event and Transient graphs
Click the Graph button in the toolbar and the Select and Setup Graph window will open.
You can chose between three different graphs: Data Graph, Statistics and EN 50160.
Data Graph
This graph displays the number of swell, dip, transient, frequency and interruption
events in a bar graph. You can select to view all data or just a specific time frame which
you define from date to date. In both cases you can check the box Divide into Days,
which will divide the whole graph into daily periods. Each period is then basically an
independent graph that displays how many different events have occurred in that
period.
23
MI 2130 VoltScanner
Downloading and Analysing Data
Statistics Graph
This graph is very useful, if you want to determine at which time during the day most
anomalies occur. In the Select and Setup Graph window select the number of day
subperiods. For instance, if you select three subperiods, each type of event will be
represented with three bars in the graph:
•
•
•
first bar representing events that occurred between 00.00 and 08.00
second bar representing events that occurred between 08.00 and 16.00
third bar representing events that occurred between 16.00 and 24.00
Also select if you want to view all data or just a specific time frame which you define
from date to date.
24
MI 2130 VoltScanner
Downloading and Analysing Data
EN 50160 Graph
This bar graph represents the results of EN 50160 analysis. First bar represents the
number of swells and dips, second bar the number of interruptions and third bar the
percentage of frequency values outside ±1% of nominal frequency.
The limit line for first two bars represents 100 events and for the frequency bar it
represents 0.5%.
4.5 Supply Voltage Interruptions
In both Event & Transient and Periodics mode, the VoltScanner also records supply
voltage interruptions. The VoltScanner considers interruption as an event when supply
voltage drops below 90V. After an interruption occurs, the VoltScanner stays active for
the next 3.5 minutes and continues measuring and recording events. This is very
convenient, if an interruption is shorter than 3.5 minutes, which is usually the case. The
VoltScanner can then record all anomalies and irregularities which usually occur at
voltage interruptions and when voltage comes back. If interruption lasts longer than 3.5
minutes, the VoltScanner goes into power down mode, from which it only wakes up
every 8 seconds and checks if line voltage is back.
Duration of interruptions shorter than 3.5 minutes is recorded with one second
resolution, longer interruptions are recorded with 8 seconds resolution.
In the Periodics mode, an interruption is represented as two events: the beginning and
the end of an interruption. Values for the average, min and max are all zeros as shown
in the next picture.
25
MI 2130 VoltScanner
Downloading and Analysing Data
In the Event & Transient mode an interruption is represented as one event with the
following data (as shown in the next picture): the beginning time, duration, magnitude
(which is zero) and event type (which is interruption).
26
MI 2130 VoltScanner
Managing Data
5 Managing Data
When the data is downloaded, you can analyse the results in the Data Table or in
different graphs. If this data is important enough, you can save it by clicking the Save
Data button on the toolbar or by choosing Save option in the Data menu. The following
Save window will appear. Write the name in the Data Name box and click OK.
For opening an existing data click the Open Data button in the toolbar, or choose Open
option in the Data menu. The following Open Data window will open. Write the name in
the Data Name box, or select the data from the existing list and click OK. The
Data Table will open, as it opens at downloading.
27
MI 2130 VoltScanner
Managing Data
Deleting data is possible only with the Data Table open and by selecting the Delete
option in the Data menu.
Printing data is possible only with Data Table open and by selecting the Print option in
the Data menu.
Printing graphs is possible only with Graph window open and by selecting the Print
option in the Execute menu.
Exporting and Importing data is used for transfering data from one computer to
another. First export data to the VoltScan (*.vsc) file and copy this file to another
computer. Then you can import this VoltScan file with ScanLink.
You can also export data to a Text file. Format of the text file is defined in the Export
Format window.
28
MI 2130 VoltScanner
Specifications
6 Specifications
6.1 General
•
•
•
•
•
•
•
•
•
•
•
•
•
Permanent working voltage range: 80 V -265 V
Communication: RS232 serial interface for connection to a PC, fully opto isolated,
9600 baud, 9 pin D-type connector.
Memory: 32 kB, approximately 3500 events
Dimensions (WxHxL): 103 x 51 x 199 mm
Weight: 515 g
Battery: 5 V DC (4 x 1.2 V) AA rechargeable, with internal charger
Internal fuse: T 32 mA
Overvoltage category: CATIII 300 V
Pollution degree: 2
Protection classification: double insulation
Working temperature range: 0 °C to + 40 °C
Storage temperature range: - 10 °C to + 60 °C
Max. working humidity: 85 % RH (0 °C to + 40 °C)
6.2 Measurements
Type of Detected Events
•
•
•
•
•
Voltage Swells
Voltage Dips
Transient Voltage
Voltage Interruptions
High and Low Frequency
Line to Neutral
Swells and Dips:
Range: (70 – 265) Vrms
Accuracy: ± (2 % of reading + 2 Vrms)
Resolution: 1 Vrms
Transients:
Range: (50 – 2600) V
Accuracy: ± (10 % of reading+50) V
Resolution: 5 V
Phase Angle Accuracy: ± 10°
Phase Angle Resolution: 1°
Minimum width: 1 μs
Frequency:
Range: (47-52) Hz; (57-62) Hz
Accuracy: ± 0.1 Hz
Resolution: 0.1 Hz
Interruptions:
Voltage drops below 90 Vrms
Resolution: 1 s for events up to 3.5 minutes
8 s for longer events
29
MI 2130 VoltScanner
Specifications
Neutral to Ground
Swells:
Range: (0 – 155) Vrms
Accuracy: ± (2 % of reading +2 Vrms)
Resolution: 1 Vrms
Transients:
Range: (50 – 2600) V
Accuracy: ± 10 % of reading
Resolution: 5 V
Phase Angle Accuracy: ± 10 °
Phase Angle Resolution: 1 °
Minimum width: 1 μs
Time Base Accuracy:
± 5 sec / day
30