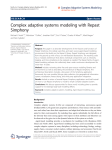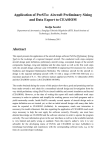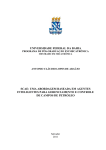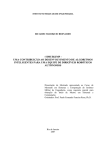
1
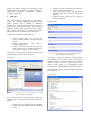
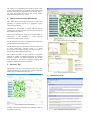
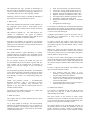
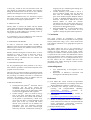
Solar intensity estimation in a geographical region based on agents. Ramos Hernanz, JA.1, Campayo Martín, J.J. 1 Zamora Belver, I.2 Puelles Pérez, E. 1, Zulueta Guerrero, E.3 1 Department of Electrical Engineering E.U.I., Vitoria-Gasteiz, University of the Basque Country Nieves Cano, 12 01006 Vitoria-Gasteiz (Spain) Phone/Fax number: +0034 945014147, fax: +0034945013270 e-mail: [email protected], [email protected], [email protected] 2 Department of Electrical Engineering E.T.S.I., Bilbao, University of the Basque Country Alameda Urquijo, s/n 48013 Bilbao (Spain) Phone/Fax number: +0034 946014063, fax: +0034946014200 e-mail: [email protected] 3 Department of Systems Engineering and Automatic E.U.I., Vitoria-Gasteiz, University of the Basque Country Nieves Cano, 12 01006 Vitoria-Gasteiz (Spain) Phone/Fax number: +0034 945014160, fax: +00349450 13270 e-mail: [email protected] Abstract. Models based on multi-agents present numerous advantages to calculate the estimation of the intensity of solar radiation. Among the different existing options, the software of simulation NetLogo, is utilized in this work. In this estimation, the possible cloudiness and existing pollution are the main variables considered. The work developed in the programming of a model based on multi-agents, followed by an analysis of the software used and of the characteristics of the proposed model are presented. Key words Agent-based modeling, NetLogo, Solar intensity. 1. Introduction Photovoltaic solar energy is one of the options to replace progressively the dependency on oil. To generate electric power from photovoltaic systems it is necessary to determine the power advantage. This aspect is conditioned, in part, by the intensity of solar radiation received in the zone where the photovoltaic plant is going to be installed. The intensity of the solar radiation that arrives at the Earth surface is reduced due to several variable factors like existing gases in the atmosphere, the reflection of clouds, pollution... Models based on agents can be used to estimate the solar intensity from variables as: quantity of cloudiness, direction and speed of clouds and existing pollution at that moment. As atmospheric situations are not predictable, the agents can change their conduct. For this reason, it is necessary to define a mathematical model that permits to estimate the solar intensity based on these agents. This model will be developed with the software of simulation NetLogo (Wilensky, 1999). This software allows to model and simulate social and natural phenomena, which evolve along the time with different number of agents, acting in a concurrent way. 2. Agent Based Modelling. (ABM) The modelling based on agents is a computer method that allows the researcher to create, analyze and experience with composed models of agents which interact inside an environment. In this model, starting from some inputs (parameters of experimental fixed values) and outputs (time during the observations of the model vanes) a process/mechanism is represented which makes a hypothesis of the real world. Agent is understood as an independent element (software, model...) with own methods and with capacity to adapt and modify itself. An agent must have the following characteristics: It’s identifiable. It’s situated. It has some goals to attain. It’s flexible and has the capability to learn. Modelling based on agents can be applied in many areas: Business and organizations, economics, infrastructure…, having a clear example in the electrical markets[4]. In many countries the electrical power supply is private, existing several providers that compete between themselves, each one with own infrastructures and with different characteristics. With this model it can be known how the market should be designed, to analyze future markets, reduce the environmental impacts or to predict fusions. The agents represent the participants in the market (companies of generation, clients, companies of transmission, distribution, independent operators, consumers, regulators). 3. NetLogo The software NetLogo, designed by Uri Wilensky in 1999[2], uses a simple programming language, friendly graphic interface and is adapted to modelation /simulation of social and natural phenomena in which there are many elements that interact. This software is adapted to model complex systems that evolve along the time, when a high number of elements that interact between themselves and with the environment exist. Settings: they allow modifying the parameters. (Sliders, switches and selectors). Views: they allow showing the information. (Monitors, plots, output text areas and graphics window). Graphics windows: The main view, where the model is developed. B. Information The principal components of the system are: Turtles, (Agents): They carry out their own activity, moving themselves through along the patches Patches, (Environment): They form a surrounding grid of 2D. Observer, (The final user): He can create new turtles and has access to reading/writing of all the agents and variables. There is only one. The NetLogo environment provides three main screens called: Interface, Information and Procedures. Fig 2. NetLog’s user Information According to conventions applied to NetLogo models, this information screen usually consists of nine sections and helps the user to find quick answers to the following questions: What is it, How it works, How to use it, Things to notice, Things to try, Extending the model, NetLogo features, Related models, Credit and references. A. Interface This information can be edited and modified clicking the button Edit, (Fig. 2) C. Procedures Fig 1. NetLog’s user Interface Fig. 1 shows NetLogo’s user interface after opening and running a model. In this screen, the following options are placed: Controls: they allow running and controlling the software execution. (Buttons and the Command Center). Fig 3. NetLog’s user Procedures The process of programming the model is made in the screen of procedures (Fig. 3), through several instructions directed to the diverse components of the system. This is the work area where the source code of the model, commands and reporters are written. 4. Characteristics of our ABM model This model shows the random movement of clouds and pollution (in general, turtles) in a geographic region represented by patches. Depending on the amount of clouds and the existing pollution, the evolution of the received solar intensity in the studied zone is shown. One of the advantages of using these models based on multi-agents is the possibility to relate physical interaction to each particle or agent. Fig 5. Sliders and simulation of the model For the analyzed case we have considered that clouds and pollution follow a Brownian motion. The Brownian motion is the random movement observed in some nanoscopics particles found in a liquid environment (for example, pollen in a drop of water or the specks of dust suspended in the air). The random movement of these particles is originated because its surface is bombed incessantly by the fluid molecules submissive to thermal agitation. This atomic scale bombing is not always completely uniform and undergoes important statistical variations 5. Interface Tab The Interface Tab is a screen where the user can watch how the model runs. It also has tools to inspect and alter what's going on inside the model. (Fig. 4) Fig 6. Graph and monitor of the model 6. Information Tab Fig 4. Interface Screen of the model In figure 5 and 6 the increased-of-size Interface screen of the model can be seen. Fig 7. Information Screen of the model The Information tab, fig.7, provides an introduction to the model and an explanation of how to use it, things to explore, possible extensions and NetLogo features. It is very helpful when on user is first exploring a model. Following, sections in which is divided the Information that explains the developed model are shown: A. WHAT IS IT? This model simulates the estimation of solar radiation in any geographic region, which is based mainly on the behaviour of clouds, weather and the amount of existing pollution. Imax: Level of intensity as a function of time. VelVientX: Average wind speed in the X axis VelVientY: Average wind speed in the Y axis SigmaX: Variance of turbulences in the X axis. SigmaY: Variance of turbulences in the Y axis. VelContaminacion: Pollution generation speed. FlujoNubes: Clouds generation speed. NCentrosContaminantes: Number of polluting centers. EnergíaInicial: Initial energy. It is possible to modificate the variables before beginning the execution of the model, (starting off then from values different from the programmed ones for these variables), or once the execution has begun. This behaviour depends on: the wind direction, the variance of turbulences, the speed of pollution generation, the number of polluting centers and the speed of cloud generation due to weather conditions. A graphic representation is given to the turtles such as, the clouds are represented as of white colour and pollution of black colour. From the screen Interface, it is possible to vary all these parameters, and analyse their influence on the model this influence will be reflected in the solar amount of received solar radiation in that region. In order to execute the model a turtle cloud will be created and another turtle pollution. These turtles will be represented of greater size than default size for a better graphic vision. B. HOW IT WORKS Button GO, unlike the button SETUP that single is pressed to initialize the model, is a button to forever, that actives the execution until it is pressed again. During this time the model is being executed. The model generates clouds depending on weather conditions however, if weather is nice the model will not generate clouds until weather is worse. And then, more or less clouds will be generated. For the weather variation, the model will take into account whether the previous weather is good or bad. The same weather will be repeated with a percentage of eighty percent and will change of time with twenty percent. For the pollution generation the number of contaminants centers and the pollution generation speed will be taken into account. These centers only work during the week, from Monday to Friday, not contaminating during the weekend. Clouds and pollution present a two-dimensional Brownian movement. This is a movement in which particles move on randomly. This movement also depends on the speed and the wind direction that are available in that moment. Therefore the solar radiation that gets to a surface will depend mainly on these two variables. In order to see the results, three graphics are scheduled, represent the amount of clouds and pollution present, the losses of solar radiation due to clouds and pollution and the solar percentage of radiation that reaches at the earth surface. In order to support that graphical representation, three types of monitor elements are able: Four monitors show the values, at every moment, of clouds, polluting clouds, losses and the percentage of the solar radiation. Two monitors offer the maximum and minimum values of solar radiation that exist during the execution of the model. A last monitor shows the average percentage of radiation during the execution time. D. THINGS TO NOTICE It is necessary to highlight that the size and the form of the turtles are only for a better visualization and understanding of the model. C. HOW TO USE IT The program has two buttons, SETUP and GO, which control the model. As in most models of NetLogo, the button SETUP initializes the model and prepares it for its execution. It puts all variables to zero and gives initial values to the variables that later will be varied with the nine sliders created. These sliders are: The result shown of the amount of black clouds resembles a sine wave, formed by only the positive halfcycles, because the centers of single contamination work five days a week and the remaining two rests. The graphic that shows the losses depends, logically, on the present amount of clouds and pollution. As is the greater amount of existing clouds or contamination, greater is the amount of losses of solar radiation. During a sunny day, clouds do not exist, therefore losses will only depend on contamination. Besides, if this happens during the weekend losses will be near to zero, because pollution also disappears as the weekend progress. Observe the Command Center, in it, the observer reports the existing weather in the region. If weather is bad or if it is stable or if it changes to good weather… E. THINGS TO TRY Initially allow to execute the model with the default values of the variables and subsequently it see the effects that produce the variation of different sliders, increasing the number of clouds, adding more polluting centers or varying the speed of contamination. outgoing sun rays, influencing the heating up or cooling down of the planet. Circular Particles[5]: This model is one in a series of GasLab models. They use the same basic rules for simulating the behaviour of gases. Each model integrates different features in order to highlight different aspects of gas behaviour. This model is different from other GasLab models in which the collision calculations take the circular shape and size of the particles into account, instead of modeling the particles as dimensionless points. NetLogoGreenHouse[6]: A simple model of how sunlight, albedo, CO2 and clouds all work together to change the global earth temperature. 7. Conclusion It is interesting to see how influence in the results the variation of the speed and wind direction. F. EXTENDING THE MODEL In order to extend the model more variables that influence on the received solar radiation can be added as: different types of clouds, rain, different seasons, the cycle of a nocturnal period, etc… Besides, instead of seeing the scene from above, it can be interesting to create a version in which the scene is observed from another point of view. Also three dimensions can be considered and even simulate this model with NetLogo 3D. G. NETLOGO FEATURES For the programming has been preferred to use only a more extensive procedure so that the development of the program can be seen clearer. There are only two small procedures programmed outside this main procedure: one to calculate the average value of the percentage of radiation and other to calculate the maximum and minimum value of radiation that are accessory to the development of the model. H. RELATED MODELS Gaslab_Brownian_Motion[6]: Brownian motion simulation. See the spores execute the "drunkards walk." Normally the gas molecules are invisible, but the user can make them visible to show how the drunkards walk originates. Climate Change[5]: This is a model of energy flow in the earth, particularly heat energy. It shows the earth as rose colored, and the surface of the planet is represented by a black strip. Above the strip there is a blue atmosphere and black space at the top. Clouds and carbon dioxide (CO2) molecules can be added to the atmosphere. The CO2 molecules represent greenhouse gases that block infrared light emitted by the earth. Clouds block incoming or This paper presents an introduction to NetLogo environment, in order to develop models of NetLogo that analyse photovoltaic energy. For it a basic model of the solar intensity estimation in any geographical region has been made. The model enables the user to give instructions to independent “agents” that are all operating concurrently, creating the target behaviour of the whole system. NetLogo environment is under rapid development. Its use is expected for both research and educational contexts since it significantly reduces complexity of the software development process. It is a very simple and clear way to see how behave the two variables that have been introduced in the model, allowing the variation of their performance at any time. Acknowledgement Vice chancellorship of Investigation of the UPV-EHU. Department of Education, Universities and Investigation of the Basque Government References [1] C.M. Macal, M.J. North, “Tutorial on agent-based modeling and simulation”, Proceedings of the 2005 Winter Simulation Conference, (2005), pp. 2-15. [2] U. Wilensky 1999. NetLogo. Center for Connected Learning and Computer-Based Modeling. Northwestern University, Evanston, IL. http://ccl.northwestern.edu/netlogo [3] A.E. Cáceres, “Sistemas complejos basados en multiagentes”. http://herdez.org/bioinflcursos/abdieljjndex.html [4] CM. Macal, M.J. North, “Validation of Agent-based Model of Deregulated Electric Power Markets”. North American Association for Computational and Social Organization (NAACSOS) Conference, Notre Dame, Indiana, June 26-28, 2005 [5] NetLogo Models Library http://ccl.northwestern.edu/netlogo/models/ [6] NetLogo User Community Models http://ccl.northwestern.edu/netlogo/models/commun ity/ [7] NetLogo User Manual. http://ccl.northwestern.edu/netlogo/docs/