1
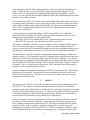
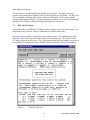
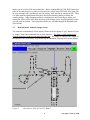
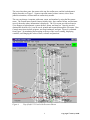
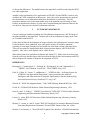
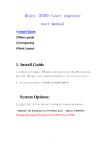
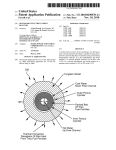
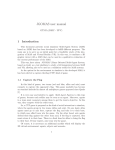
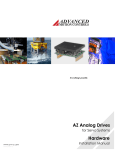
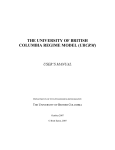
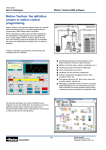
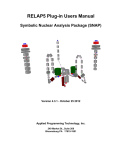
7th International Conference on Nuclear Engineering
Tokyo, Japan, April 19-23, 1999
ICONE-7433
RGUI 1.0, NEW GRAPHICAL USER INTERFACE FOR RELAP5-3D
George Mesina* & Jim Galbraith
Idaho National Engineering and Environmental Laboratory
P.O. Box 1625
Idaho Falls, ID 83415-3880, USA
Phone: 208-526-8612, Fax: 208-526-6971
Email: [email protected]
With the advent of three-dimensional modeling in nuclear safety analysis codes, the need has
arisen for a new display methodology. Currently, analysts either sort through voluminous
numerical displays of data at points in a region, or view color coded interpretations of the
data on a two-dimensional rendition of the plant. RGUI 1.0 provides 3D capability for
displaying data. The 3D isometric hydrodynamic image is built automatically from the input
deck without additional input from the user. Standard view change features allow the user to
focus on only the important data. Familiar features that are standard to the nuclear industry,
such as run, interact, and monitor, are included. RGUI 1.0 reduces the difficulty of analyzing
complex three dimensional plants.
Keywords
Graphical User Interface, GUI, 3D Graphics, RELAP5, Thermal-Hydraulic
1
INTRODUCTION
Numerous methods have been developed over the years to employ RELAP5 (RELAP5, 1995)
(Mesina, 1998) for nuclear power plant safety analysis. Many tools have been developed to
aid users in preparing input and displaying the transient information and output data. Input
file aids include PYGMALION (Grush, 1982), which creates an input deck from a steadystated output file, and Graphical User Interfaces (GUI) that help prepare input decks, such as
TROPIC (Bastenaire, 1992), ATHENA-Aide (Fink, 1987), and SNAP (Gitnick, 1998). Display aids include the NPA (Snider, 1995) and XMGR5 (Jones, 1997).
The tools listed above, except PYGMALION, are graphical interfaces. The input deck
builders allow the user to create a functional diagram of the plant, pictorially on the screen.
The functional diagram, when annotated with control volume and junction numbers, is a
nodalization diagram. Data required for an input deck is entered for volumes and junctions
through a mouse-driven menu and dialog system; after the information is complete, an input
deck is generated.
Display GUIs show data from RELAP5 calculations, either during or after the transient. The
NPA requires the user to first generate a set of "masks," two-dimensional pictures of the plant
on which some of the data is displayed either numerically or with a color map. Both the NPA
and XMGR5 can generate xy-plots of the data. Time histories of plant conditions can be seen
1
Copyright © 1999 by JSME
via the plots or through the NPA’s replay mode.
One common feature of all previous GUIs for RELAP5 was a two-dimensional display. Most
plant models require some artistry to display the inherently 3D nodalization diagram in 2D.
With the development of RELAP5-3D, it became necessary to display the 3D data in 3D.
This 3D display can also be employed to visualize existing input model nodalizations in 3D.
Rather than patch an older 2D GUI to develop 3D displays, a plan was formed to build a new
RELAP5-3D Graphical User Interface (RGUI) with 3D display as an integral part. Because
code users have had many ideas and concerns about the previous GUIs, their input was sought
for the form and capabilities of the new RGUI through various means including: the RELAP5
Newsletter questionnaire (Larson, 1995); electronic mail; and direct feedback from numerous
hands-on demos, such as at the 1998 RELAP5 International Users Seminar (Mesina, 1998).
Most of these were compiled in a functional requirements document (Mesina, 1996a) and a
summary can be found in (Mesina, 1996b).
The user input was combined with design input from RELAP5-3D developers and experts
from both the GUI and ergonomics fields. A partial list of capabilities follows.
• 3D display for thermal hydraulics, neutronics, and heat conduction.
• Easier method (less user time and effort) to generate "masks" for the 3D displays.
• Exploration of 3D display (move viewpoint via zoom/pan, rotate and translate).
• Detailed view of data at volume or junction with just a mouse click on the screen.
• Interactive RELAP5 run control (start, pause, restart, replay, stop).
• On-line documentation including Help buttons and balloons, RELAP5-3D manuals, etc.
• Easy access to RELAP5 peripherals (where available) such as: Pygmalion and XMGR5.
• Easy access to helpful applications such as text editor and spreadsheet.
• Portability across workstations (UNIX) and PCs (Windows- NT, 95 or 98).
• Both command line interface and window/menu/mouse interface.
• Standard features such as save, print, font, number format, color, etc.
• Native look and feel on each supported operating system.
These ideas were used as the basis for the design of RGUI. The result is a fundamentally new
kind of GUI in the nuclear power plant analysis field. RELAP5 is no longer the central focus,
but rather, the focus becomes doing nuclear safety analyses from a central workspace with an
arsenal of tools at the analyst's disposal. The workspace is the same on any workstation or
PC, but with the native look and feel of the platform. RELAP5-3D is the principal
application; but others are accessible through the workspace and can be used simultaneously
and in conjunction with one another to enhance the user's ability to do complicated analyses.
2
INFRASTRUCTURE OF RGUI
After the high level design of RGUI was constructed, it was necessary to select
implementation languages, a graphics package, and toolkits before the detailed design could
be developed. Selection criteria were compiled and candidate software was reviewed. Some
of the criteria were:
• Maintainability: A single RGUI source must run on both Unix and Windows based platforms.
• Use of a widely accepted and available 3D graphics standard.
• Compatible with Fortran 90 and C (the languages of RELAP5-3D).
• No third party licenses (no extra cost or encumbrance to users).
2
Copyright © 1999 by JSME
From among the software choices that passed these criteria, the following selections were
made. Fortran 90 and C were selected as the primary programming languages. Tcl/Tk
(Welch, 1997) were selected as the scripting language and windowing toolkit. OpenGL
(Woo, 1997) was selected as the graphics standard, with the Mesa implementation used where
OpenGL is not readily available.
In its original design, RELAP5 was the central focus and ran all peripheral operations, such
as printing output, generating xy-plots, and driving the NPA. In the new design, the focus is
on the analysis with the analyst, rather than RELAP5-3D, directing the operations through
RGUI. This is facilitated by building RGUI with Tcl/Tk, which provides keyboard and
input-device event control.
To accommodate the fundamental change to RGUI running RELAP5, considerable
modification had to be made to the main program and some subroutines. However, these
changes had to accommodate two other requirements:
• RELAP5-3D can be run without RGUI from a command line prompt as before.
• RELAP5-3D run speed is not impacted when RGUI is not in use.
The changes to RELAP5-3D allow it can to be compiled with or without the RGUI coding.
There is no measurable impact on run speed. Further, even when compiled with RGUI
coding, it can be run from a command line prompt and either present graphical images or not
depending on command line run options. It can also be run as an application from RGUI.
The infrastructure of RGUI is divided by functionality among the languages, toolkits and
graphics package. Tcl/Tk procedures provide all windowing and keyboard/mouse interaction
functions, as well as many of the operating system and file system interfaces. New Fortran
90 subroutines are responsible for processing data received from RGUI and for moving it into
and out of RELAP5-3D storage locations. The 3D images of RELAP5-3D data are rendered
by OpenGL. New C routines provide the interface "glue" that hold all the different pieces
together as well as operating system interfaces.
Finally, permanent user-modifiable information for RGUI is kept in disk files. This includes
such data as default settings, fonts and other format information, preferences, the default
RELAP5-3D run options, etc. Disk files are also used to store large collections of textual
information, such as help files.
3
DESIGN
The main purpose of RGUI is to provide a workspace for nuclear power plant analysis with
RELAP5-3D. The workspace must have the same structure on both PCs with Windows
operating systems and UNIX platforms, so that code users with either background can quickly
become accustomed to using the workspace. It is therefore designed to look like a typical PC
or Macintosh application with windows, menus and dialogs. Having also a command line
interface makes it look much like many internet access applications.
From the workspace, the basic capabilities are easily accessed through either the command
line interface or the menu-dialog interface. These capabilities are broken into three areas.
First is running and interacting with RELAP5-3D. Second is performing RELAP5-related
analysis activities, such as creating or modifying an input file, viewing an output file,
graphing data, preparing a steady-stated deck, etc. Third is managing the workspace which
involves formats, preferences, accessing the operating system, accessing the network, and
3
Copyright © 1999 by JSME
other high level functions.
The workspace is provided graphically through several screens. The main screen that
provides access to the three capability areas is called the RELAP5-3D Station. The RELAP53D run capability is broken into two parts, selection of RELAP5-3D run options and the
isometric hydrodynamic display. The second and third capability areas are accessed through
the RELAP5-3D Station, which may bring up dialog boxes in the process
3.1
RELAP5-3D Station
As described above, the RELAP5-3D Station is the workspace from which work starts. It is
comprised of three sections, a menu, a command bar, and the station body.
The menu system is built to be similar to many standard menus. The menu names are File,
Edit, and Tools. The File and Edit menu items are the standard ones. The "Run RELAP53D" item is found in the File menu. The Tools menu has items for font changes and access to
certain RELAP5 applications, such as XMGR5 and PYGMALION, subject to availability.
Figure 1
RELAP5-3D Station
4
Copyright © 1999 by JSME
The command line interface sits in the command bar just below the main menu and uses a
basic command entry box. Typing a command and hitting "enter" causes the command to be
executed by the operating system. The result of the command is then displayed in the station
body, which sits just below the command entry bar. For example, RELAP5-3D can be run by
typing its normal command line into the entry box and the RELAP5-3D one-line reports
appear in the station body every 10-seconds; see Figure 1 for an example. A history feature
allows the user to recall and reuse commands in either UNIX or DOS-prompt style.
Results of any commands that produce output are shown in the station body, whether the
command was generated via the menu-dialog interface or the command line. The station
body can be scrolled to see previous work. The "clear" item of the Edit menu can be used to
wipe the station body clean when it is too full, but selections can be deleted individually also.
3.2
Run RELAP5-3D Options
Whenever "Run RELAP5-3D" is selected, the Run RELAP5-3D Options dialog box appears.
It is necessary because of the various run options available on RELAP5. The screen is
comprised of three parts: a menu; a toolbar; and a list of run option entries. The menus are
Runmode and Select. The toolbar buttons are run, exit, and more options. The list of entries
shows some of the RELAP5-3D run options and default values are provided. The entries are
editable. After the selections are made, RELAP5-3D can be run by clicking the RUN button
or by selecting a custom run process from the Runmode menu.
Figure 2
Example of RELAP5-3D Run Options Settings
In order to familiarize the new user with the functionality of RGUI, the problem shown in
Figure 2, 3D typical PWR, is set as the default. It can be run immediately by clicking the
"RUN" button, or by selecting “Run” from the Runmode menu.
Several conveniences are provided by the Run RELAP5-3D menu items. The run option
5
Copyright © 1999 by JSME
entries can be saved to a file and reused later. Before running RELAP5-3D, RGUI intercepts
reuse of the same name for a print or restart-plot file (which causes RELAP5-3D to stop with
an error message) and it prompts the user for actions, such as delete or rename the file. There
is a delete-and-run option that deletes these files before running, thereby avoiding the
warning dialogs. When changing problems, sometimes the user wants input, output, and
restart-plot files to all be in the same directory; path changes can be accomplished all at once
with the push of a button. These and other choices are available through the Runmode and
Select menus.
3.3
Hydrodynamic Isometric Image Screen
The isometric hydrodynamic screen appears whenever the run option is "gui" instead of "npa"
or "nonpa" from either command line or menu interface. The image is built automatically
from the input deck with no extra input from the user. The image is isometric; the lengths in
the input deck are used exactly as given having no adjustment for perspective on the display.
Figure 3
An Isometric View of Loft L2-5 Model
6
Copyright © 1999 by JSME
The screen has three parts: the menus at the top; the toolbar next; and the hydrodynamic
display beneath; see Figure 3. Squares represent control volume centers, arrows show
junction orientation, red lines indicate connectivity trouble.
The user can change viewpoints with zoom, rotate, and translate by using the Movement
menu. The Format menu control features include color, font, number format, and decimate
(specify the nodes where information is displayed). The View menu provides such major
view changes as hydrodynamic system advance, home, and time bar. Once the user has
obtained the desired view, it can be saved, printed and reopened through the File menu. Run
Control menu items include go/pause, one-step/continuous, and quit. Figure 4 is obtained
from Figure 3 by translating and zooming to the top of the vessel, rotating, displaying
variables, and changing the colors of lines, volumes and junctions.
Figure 4
Top of Loft L2-5 Vessel with Pressures Shown
7
Copyright © 1999 by JSME
The toolbar provides button access to dialog boxes of useful features. Recenter changes the
view to the volume or junction typed into the dialog box entry. Display_Var causes the value
of any database array (such as pressure or mass flow) to be displayed next to volume or
junction nodes in accordance with the decimate specification. Watch displays the values of
key variables at specific nodes in a separate window. Trip Logic allows the user to create
temporary trip logic cards during the transient to control the RELAP5-3D run.
4
USES OF RGUI 1.0
There are numerous ways to use the capabilities of RGUI in its current level of
implementation to enhance RELAP5-3D analyses.
The isometric image is automatically generated for any valid RELAP5-3D or
RELAP5/MOD3 input deck. With no modification to the deck or additional information, a
nodalization diagram can be generated immediately. This is very helpful when an analyst
receives an input deck with no corresponding nodalization diagram. Further, the image will
be isometric, the lengths shown on the screen are scaled to those in the input model. The
hydrodynamic information from the input data can be displayed next to the volume and
junction nodes without searching through the input deck itself. Also, if the angle data was
included in the input, the nodalization diagram will be three dimensional. This is true of all
such existing valid input decks.
Another application of the isometric, hydrodynamic image is in constructing a 3D input
model. As portions of the plant model are developed, the automatically generated 3D
nodalization diagram can be viewed. Errors in position, connection, orientation, and
geometry data will be obvious (connection errors are shown in red). All the minor edit
variables can be displayed adjacent to the nodes of the nodalization diagram.
Note that during the transient, as well as at input, any volume- or junction- based quantity in
the RELAP5-3D database can be displayed at the nodes on the nodalization. The quantities
displayed are chosen during the transient and can be changed as often as desired.
During the transient, additional trips can be constructed to stop the calculation to correspond
to conditions that occur to the analyst while viewing the transient and performing the
analysis. With these temporary trips, there is no need to start the transient over from the
beginning or even from the latest restart with new trip cards to create the same conditional
stops. Further, the new trips can access the input decks trip cards and other temporary trips in
their logic.
Fast means to move about the 3D nodalization diagram are provided for situations where the
view has been zoomed to the point where much of the plant model is off the screen. The
recenter feature allows the user to center the view on a node in another region of the plant by
simply typing its volume or junction number. The view save and open features, which allow
the user to save and return to the same view at any future time, can also be used to recenter.
Another useful feature is the ability to combine applications through RGUI. For example,
RELAP5-3D is an application and can therefore be run simultaneously with another
RELAP5-3D run. By simultaneously running two instances of the same input model, where
one differs somewhat from the other; the effect of the difference can be studied. The two
RELAP5-3D jobs can be run until a trip occurs or on an advancement by advancement basis
8
Copyright © 1999 by JSME
to discern the differences. The modification to the input deck could be made using the RGUI
text editor application.
Another useful combination of two applications is RELAP5-3D and XMGR5, which is only
available on UNIX workstations at the present. An xy-plot can be generated at any point in
the calculation to reveal information about how the transient is proceeding. This can
sometimes indicate errors in the input model early in the transient at great savings of time.
Further, such partial time-history xy-plots can be repeated during the transient whenever the
user desires, using successively more information each time.
5
FUTURE DEVELOPMENTS
Current workscope includes expanding the 3D nodalization diagram into a full 3D image of
the plant modeled by the input deck. Another task is the development of replay mode, such
as is available with the NPA.
Future plans include the development of images similar to the hydrodynamic isometric image
for the neutronics, heat conduction, trips, and control system; all would be automatic,
requiring no extra input from the user and would also work with existing valid input decks.
There are also plans for detailed individual volume/junction displays, and 3D flow field
graphics. One, some, or all displays can be visible at once.
Other future plans were spelled out in Mesina and Austin [21]. Many of the best ideas come
from the code users and developers who have taken the time to demo and comment on RGUI,
and such input will continue to shape the development of RGUI.
REFERENCES
Bastenaire F, Crommelynick, Y., DeJongh, K., DeVlaminck, M., and Vanhoenacker, L.,
"TROPIC: User’s Manual, Version 4.0," TRACTEBEL, May, 1992.
Fink, R., Callow, R., Larson, T., andRansom, V., "ATHENA-Aide - An Expert System for
ATHENA Code Input Model Preparation," paper presented at the Artificial
Intelligence and Other Innovative Computer Applications in Nuclear Industry Mtg.,
American Nuclear Society, Snowbird, UT, Aug. 1987.
Gitnick, B., "SNAP Development Status," 13th CAMP Meeting, Bethesda MD, Oct, 1998.
Grush, W., PYGMALION Software, Idaho National Engineering Laboratory, 1982.
Jones, K. and J. E. Fisher, J., "XMGR5 Users Manual," INEL/EXT-97-00346, Idaho National
Engineering and Environmental Laboratory, March, 1997.
Larson, N., editor, RELAP5 Newsletter, Idaho National Engineering Laboratory, January March, 1995.
Mesina, G., Austin, A., and W. Grush, "RELAP5 Graphical User Interface Business Plan and
Functional Requirements Document," Private INEEL Business Plan, Jan, 1996a.
Mesina, G. and Austin, A., "New RELAP5 Graphical User Interface," RELAP5 International
9
Copyright © 1999 by JSME
Users Seminar, Dallas, TX, March 17-21, 1996b.
Mesina, G., "The RELAP5-3D Station, a Graphical User Interface," RELAP5 International
Users Seminar, College Station, Texas, USA, May 17-21, 1998.
RELAP5 Code Development Team, "RELAP5/MOD3 Code Manual," NUREG/CR-5535,
INEL-95/0174, Aug., 1995.
Sloan, S., "Preliminary Research for a RELAP5 Pre-Processor," Private Correspondence,
Apr. 6, 1995.
Snider, D., Wagner, K., Grush, W., and Jones, K., "Nuclear Plant Analyzer: Computer Visual
System Reference Manual," NUREG/CR-6291, INEL-94/0123, Vol. 3, Idaho
National Engineering Laboratory, Idaho Falls, ID, Jan., 1995.
Welch, B., “Practical Programming in Tcl and Tk, 2nd Edition, ISBN 0-13-616830-2, Prentice
Hall PTR, Upper Saddle River, NJ, USA, 1997.
Woo, M., Neider, J., Davis, T., “OpenGL Programming Guide: The Official Guide to
Learning OpenGL, version 1.1, 2nd Edition, ISBN 0-201-46138-2, Addison-Wesley
Developers Press, July, 1997.
10
Copyright © 1999 by JSME