1
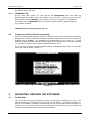
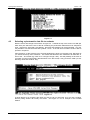
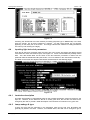
Spacing Graph Generator for Minor Roads COPYRIGHT NOTICE Trevor Caswell 1990-2002 All rights reserved Copyright exists on the contents of this manual and the software ‘PLESPACE.EXE’ supplied on the accompanying diskette. You agree by purchasing the software to use it on only one machine. However, it may be transferred and used on another machine, but shall under no circumstances be used on more than one machine at a time. One copy can be made of the software into any machine readable form for backup purposes only in support of your use of the software on a single machine. DISCLAIMER OF WARRANTY The software and manual are sold AS IS and without warranty as to performance. Because of the use to which this software may be put, and the variety of luminaires and hardware used in conjunction with it, no warranty of fitness for a particular purpose is offered. While the developer has invested considerable time and effort to create a high quality product, the user must assume the risk of using this software. Trevor Caswell Software P.O. Box 236 Salisbury, Q 4107 Australia Ph. & Fax.: (07) 3275 2406 Mobile: 0417 732 763 Email: [email protected] Home Page: www.perfectlite.com Spacing Graph Generator Version 1.65 TABLE OF CONTENTS 1. INTRODUCTION ..................................................................................................................... 2 2. INSTALLING THE SOFTWARE ................................................................................................ 2 2.1 Stand alone version..................................................................................................... 2 2.1.1 2.2 3. 4. Initialisation file................................................................................................ 3 Component of the Perfect Lite package......................................................................... 3 NAVIGATING THROUGH THE SOFTWARE .............................................................................. 3 3.1 On line Help ............................................................................................................... 3 3.2 Data Input Screen Operation........................................................................................ 4 RUNNING THE SOFTWARE.................................................................................................... 4 4.1 How to start the software............................................................................................. 4 4.2 Selecting a Printer ...................................................................................................... 4 4.3 Selecting a photometric data file to evaluate.................................................................. 5 4.4 Inputting light technical parameters .............................................................................. 6 4.4.1 Luminaire description....................................................................................... 6 4.4.2 Lamp wattage & type....................................................................................... 6 4.4.3 Luminous flux.................................................................................................. 7 4.4.4 Stores code .................................................................................................... 7 4.4.5 Lighting category ............................................................................................. 7 4.4.6 Mounting height............................................................................................... 7 4.4.7 Arrangement ................................................................................................... 7 4.4.8 Upcast angle................................................................................................... 7 4.4.9 Offset distance................................................................................................ 7 4.5 Calculating the maximum spacings .............................................................................. 7 4.6 Tabular display of spacings.......................................................................................... 8 4.7 Graphical display of spacings ...................................................................................... 8 4.7.1 Displaying additional vertical ordinate lines......................................................... 9 4.8 Transferring the graphical display to the printer .............................................................. 9 4.9 Terminating the Software ............................................................................................. 10 5. ERROR MESSAGES.............................................................................................................. 10 6. DATA INPUT SCREEN OPERATION........................................................................................ 11 7. DESIGN PARAMETER TABLE FILE ........................................................................................ 12 8. UPDATE HISTORY ................................................................................................................. 13 Copyright Trevor Caswell 1990-2002 Page 1 Spacing Graph Generator 1. Version 1.65 INTRODUCTION The software described in the following manual produces a spacing table and spacing graph for any minor road luminaire where the photometric data I-table is available in the CIE/SAASTAN standard format. The graph produced is generally in accordance with the SAA Public Lighting Code AS1158.1 - 1986, pages 21 and 29. The results from the software are initially displayed on the screen in tabular form then as the graph. Both of these displays can be sent to a printer for hard copy output, if required. Parameters such as lighting category, mounting height, arrangement, upcast angle etc. can all be varied to suit your particular application. The graph can then be used as an aid in the design of minor road lighting schemes. NOTE: In 1999 Standards Australia released a revison to the 1986 Minor Road code named AS1158.3.1:1999 – Pedestrian area (Category P) lighting – Performance and installation design requirements. Due to the many changes in this new Standard the program (and spacing graph/tables) described in this manual cannot, in most, cases be used. However, I have developed another program (this time a windows application) that is relevant to the new Standard. It is called the Perfect Lite – Pedestrian Area Lighting software (PLEPAL.EXE) and is described in a separate manual. The software (being a DOS application) can quite satisfactorily run under Windows 95/98/NT/2000/XP in a ‘window’ or ‘full screen’. If the software is run in a window it will be automatically enlarged to full screen once the graph is drawn and remain that way for the remainder of the session. Before reading any further, briefly look through this manual and you will notice that screen snapshots have been used quite regularly. This has been done to make it easier for you to equate the manual with the operation of the software. The example used in the snapshots utilises the sample photometric data supplied in the file named MINOR.CIE. 2. INSTALLING THE SOFTWARE The software is provided in either of two forms depending on how it was purchased (ie. either as a stand alone version or as part of the main Perfect Lite software package). 2.1 Stand alone version The stand alone version is supplied when you purchase the Spacing Graph Generator by itself in which case the diskette provided will contain some or all of the following files:INSTALL.BAT...................... Installation batch file PLEPRMAN.EXE ................. PLE Print manger software PLERRORS.DAT................. Miscellaneous errors file PLESPACE.EXE ................. Spacing Graph Generator software PLESPACE.HLP ................. On line help file PLESPACE.INI.................... Initialisation file (user to edit, refer Section 2.1.1) PLESPACE.LIN................... User defined vertical ordinate file (refer Section 4.7.1) PLESPACE.PDF................. User manual PLESPACE.TBL.................. Default design parameter table file (refer Section 8) PPD32.EXE ....................... Graphics printer output software PRINTGLN.DLL .................. Graphics printer output software companion README.DOC.................... Latest information on the software not included in this manual MINOR.CIE ......................... Sample CIE/SAASTAN minor road photometric I-table file SERIAL.NUM ...................... Program serial number file The software can be installed on your hard disk by carrying out the following instructions. Load the diskette provided in the floppy drive and at your DOS prompt type A:\INSTALL and press <Enter>. The install batch file will create a new sub-directory on your hard disk called C:\PLESPACE and copy the contents of the diskette to this directory. When you want to run the PLESPACE software you will have to make this sub-directory the default one first, see Section 4 for further details. If running Copyright Trevor Caswell 1990-2002 Page 2 Spacing Graph Generator Version 1.65 through Windows then it is suggested you create a ‘shortcut’ on the desktop to enable you to access the software quickly each time. 2.1.1 Initialisation file For the stand alone version you must edit the file PLESPACE.INI with a text editor (eg. NOTEPAD.EXE etc.) before running the software for the first time. Insert at the end of the line starting with the words 'COMPANY=' your company name (up to a maximum of 44 characters). An example of the PLESPACE.INI file for a company named ”U-Beaut Lighting Designs Pty. Ltd.” would be as follows:- COMPANY=U-Beaut Lighting Designs Pty. Ltd. 2.2 Component of the Perfect Lite package Where the Spacing Graph Generator software is supplied as part of the main Perfect Lite software package then it will be automatically installed in the same sub-directory as all the other Perfect Lite programs (namely C:\PLE). The initialisation file (PLESPACE.INI), as in Section 2.1.1, will be automatically updated/created with the correct company name whenever PLE is normally customised (i.e. execution of "Program setup" option from Main Perfect Lite menu). To run the Spacing Graph Generator select the ‘Minor road lighting design’ option from the Main Perfect Lite menu as shown in Figure 2.1. Figure 2.1 3. NAVIGATING THROUGH THE SOFTWARE 3.1 On line Help You can get help at many points during the running of the software by pressing the <F1> key. As to what help will be given, will depend on where you are in the software. For example, pressing <F1> with the cursor located in a particular input field will give help on that particular field, see Figure 3.1. Pressing <F1> a second time will give more general help. Pressing <Esc> one or more times will remove the displayed help screens and return to the software. Copyright Trevor Caswell 1990-2002 Page 3 Spacing Graph Generator Version 1.65 Figure 3.1 3.2 Data Input Screen Operation Refer to Section 6 for details on the keys available on the screen to input and edit data during the running of the software. 4. RUNNING THE SOFTWARE 4.1 How to start the software To start the stand alone version of the Spacing Graph Generator, after it has been installed on your computer, type the following in response to your MS-DOS prompt (remember first to change to the correct sub-directory eg. C:\PLESPACE) PLESPACE followed by pressing the <Enter> key. As mentioned previously it may be advantageous to create a shortcut on your Windows desktop to gain quicker access to the program. Alternatively, when supplied with the Perfect Lite software just select the 'Minor road lighting design' option from the main Perfect Lite menu, see Figure 2.1. In both cases, the screen will then clear and display a colourful flashing logo. To clear this logo and continue running the software press any key on the keyboard. 4.2 Selecting a Printer After the program logo has been cleared a menu will appear, similar to Figure 4.1, showing all the printers (& output devices) that you have available on your system. Make a selection of the Windows printer where you want any hard copy output to go. Copyright Trevor Caswell 1990-2002 Page 4 Spacing Graph Generator Version 1.65 Figure 4.1 4.3 Selecting a photometric data file to evaluate Next the screen will change to that shown in Figure 4.2. Towards the top of the screen is a field (the white area) into which the name of the file containing the photometric I-table data to be analysed is input. Note that a drive letter, sub-directory, file name and extension can all be specified. It is now not possible to use the DOS wild card symbols '?' and '*' in the file name to select a series of files to process in sequence. Also remember, as this program is an ‘old’ DOS application is does not recognise ‘long’ filenames as you would commonly use in Windows. This means that filenames are restricted to 8 characters in front of the ‘.’ and 3 after (eg. minor.cie or c:\longfo~1\longfi~1.dat). This will probably not be much of a problem as normal photometric data filenames are in this format, it may just be the folder (or subdirectory) name that could be ‘long’. Figure 4.2 A handy feature if you forget the file name you want to use is to press the <F4> key and a scrolling directory listing window will overlay the screen. See Figure 4.3 for an example of this overlaid window. Copyright Trevor Caswell 1990-2002 Page 5 Spacing Graph Generator Version 1.65 Figure 4.3 Assuming the desired file has been inserted (for testing purposes type in MINOR.CIE) in the field, press the <Enter> key to tell the software to continue. You will notice several pop up windows appearing on the lower part of the screen. This simply indicates the software is reading the data file into memory and checking its integrity. 4.4 Inputting light technical parameters Once the file has been completely read, the lower part of the screen will change and display several more fields into which data must be input, refer Figure 4.4. Some of these fields may already contain data. This data would either be the same as the last luminaire processed or values from the parameter table file PLESPACE.TBL (see Section 7 for more details on the use/contents of this file). The fields on the screen and required data entries are described on the following pages. Figure 4.4 4.4.1 Luminaire description This field will generally be automatically filled by the luminaire description (first line) read from the input file. However, as the data from the file is usually quite brief, this and the next field can be changed by the user to provide a better description of the luminaire for inclusion on any print outs. 4.4.2 Lamp wattage & type If there are more than 20 characters in the description read from the file, then the balance will generally be placed in this field. However, as indicated above, this field can be changed to give a Copyright Trevor Caswell 1990-2002 Page 6 Spacing Graph Generator Version 1.65 more concise description of the luminaire under investigation. This will save confusion at a later time when looking at the table/graph produced. 4.4.3 Luminous flux The total luminous flux, in lumens, of the lamp/s contained in the luminaire is input into this field. It is up to you whether a 100 hour or de-rated value is used to account for any maintenance factors. The 1986 code specifies the 100 hour value with maintenance to be carried out on the installation so that output does not fall below 70% of this initial value. 4.4.4 Stores code This field can be left blank, if desired, as it is only used to identify the luminaire/lamp combination within your organisation's stores/stock control system. 4.4.5 Lighting category Enter here the AS1158 lighting category for which the software is to produce a table/graph. If necessary refer to AS1158.1 - 1986, pages 7 and 12, for more information. The PLESPACE software is only used for evaluating Category B1, B2, C1, C2 and C3 type roads. For Category V roads (ie. traffic routes) different principles apply and you need to use the SAASTAN User Interface and/or other exterior lighting software, such as the main Perfect Lite package, for lighting designs. 4.4.6 Mounting height Insert into this field the mounting height of the luminaire above the roadway. The value is in metres and can be between 0.5 and 20 metres. 4.4.7 Arrangement In the code the spacing graph is generally prepared using a single sided arrangement of luminaires. However, for particular applications (ie. to possibly optimise spacings) a staggered or even opposite arrangement can be nominated by inputting a value of 1 or 2 in this field. 4.4.8 Upcast angle Once again to optimise the results from a luminaire an upcast angle can be specified. This angle must be between 0° and 60° above the horizontal, 5° being the default. The code only seems to use an upcast of 0° but the value you use will depend on whether the luminaire is on an outreach or directly mounted on top of a pole. 4.4.9 Offset distance The code describes the position of the luminaire as being over the notional kerb, which is 1/4 of the road reserve width from the property line (enter '*' in the field for this situation). However, for other situations this can be varied by inputting a distance between -12 and 30 metres representing the distance of the luminaire (NOT the pole) from the property line. A negative value implies the light is behind the property line (ie. not on the road reserve at all) which may be relevant in some applications. 4.5 Calculating the maximum spacings After inputting the above data press the <Enter> key and the screen will clear and commence initially to calculate the maximum illuminance on the ground from the luminaire in the nominated mounting orientation. The result will be displayed on the screen when finished, refer top part of Figure 4.5. The software then proceeds to perform calculations for road widths varying from 2 through to 40 metres. As each width is processed it will be displayed on the screen, middle part of Figure 4.5. If you want to abort the calculation process at any time, simply press the <Esc> key, at which time a confirmation question will be asked. Copyright Trevor Caswell 1990-2002 Page 7 Spacing Graph Generator Version 1.65 Figure 4.5 The type of computer in use will determine the length of time taken to complete the calculations, eg. on a Pentium III (500MHz) it’s about 6 seconds. Category C calculations takes marginally longer as a more dense grid of calculation points is used. 4.6 Tabular display of spacings When all calculations are complete the resulting maximum spacings, average and minimum illuminances and uniformity ratios will be shown in tabular form on the screen, see Figure 4.6 (only part of the results shown). Use the cursor keys to scroll this display and view the full results that may be initially off the bottom of the screen. To obtain a hard copy of these results on your printer press the <P> key. Otherwise, press the <Esc> key to remove the display and continue with drawing the graph. 4.7 Graphical display of spacings The screen will now clear and display along the top four lines the calculation parameters as previously input. Below this will be the spacing graph with the road reserve widths annotated along the horizontal ordinate and the spacing along the vertical. The area under the sloping graph line will indicate the combinations of spacing and road reserve width that comply with the Code. The bottom line on the screen shows the keys that can be pressed to perform several further operations. Figure 4.7 gives an example of the screen display at this point. Figure 4.6 Copyright Trevor Caswell 1990-2002 Page 8 Spacing Graph Generator Version 1.65 Figure 4.7 4.7.1 Displaying additional vertical ordinate lines As seen on Figure 4.7, vertical dashed lines can be shown on the graph for specific road reserve widths. This could be useful if roads, always under investigation, are of certain fixed widths. Reading from the graph the complying maximum spacing could be made much simpler. The value of the road reserve widths to be included in this manner are simply contained in a text file named PLESPACE.LIN. Each line of the file contains the particular road reserve width value. For example, to draw dashed lines at 15.5 and 18.5 (as in Figure 4.7) metres the file would contain the following two lines:15.5 18.5 It’s as simple as that. 4.8 Transferring the graphical display to the printer After the spacing graph has been displayed on the screen, pressing the <G> key will send a copy of it to the previously selected printer, see Section 4.3. If you are running PLESPACE in a window on the screen, in Windows 95/98, you will notice another small window appear at the bottom of the screen, similar to Figure 4.8, indicating the process of the printing. This later window will disappear once spooling of the print job has been completed. Figure 4.8 Copyright Trevor Caswell 1990-2002 Page 9 Spacing Graph Generator Version 1.65 If you were running PLESPACE in a window on the screen, in Windows 2000/NT/XP, the screen will not return to the smaller window size after the graph is displayed. The software that prints the actual graph displays something similar to Figure 4.8, indicating the process of the printing. When printing has been spooled you may think the PLESPACE software has also finished (not visible on the screen) but instead it has just been minimised. So click on the logo on the Start bar to restore to full size and continue on with the software. A sample of the output generated is shown in Figure 4.9. When printing is finished press the <Space> key to return to the graph. Press the <Esc> key to then return to the initial input screen to possibly evaluate a different mounting arrangement. If you want to evaluate another luminaire then press the <Esc> key a second time to return to the screen where you can input another luminaire file name. 4.9 Terminating the Software On the screen where you nominate the luminaire file name press the <Esc> key to end the software and return to the DOS operating system (or the main Perfect Lite menu). 5. ERROR MESSAGES At times during the use of the software incorrect data may be accidentally entered, when this occurs the computer's speaker will sound a low tone beep and display an error message on the screen. Read and note this message then press the <Space Bar> to remove the message. If the error is related to a particular input field then the cursor will be positioned in that field for the data to be corrected. REMEMBER When typing data into the input fields on the screen DO NOT press the <Enter> key after each field is filled or changed. Only press the <Enter> key when you have finished filling or changing ALL the necessary fields. Copyright Trevor Caswell 1990-2002 Page 10 Spacing Graph Generator Version 1.65 Figure 4.9 6. DATA INPUT SCREEN OPERATION The input of data into the software (ie. response to questions etc.) is done via what I call 'fixed screen' or 'fielded' input. The software will display on the screen one or more question fields each followed by an answer field (usually black in colour but shown white on the sample screens in this manual) that indicates the maximum width of data that can be input. Figure 4.4 is an example of one of these screens with several input fields. Inputting data and moving about the fields is done by pressing the keys as described below. Some fields may already contain data (the default value or value input last time the screen was used) which can be left as is or changed to suit your requirements. Copyright Trevor Caswell 1990-2002 Page 11 Spacing Graph Generator Version 1.65 KEY PRESSED ACTION Any Alphanumeric In 'Insert' Mode, shifts the contents of field from cursor position to the end of the field one position to the right and drops off the last character. The key pressed is inserted at the cursor position. In 'Over type' Mode, replaces the character at the cursor position with the key just pressed. NOTE: Numeric fields will only accept keys 0-9, '+', -' ', '.' and ',' any other key will have no effect other than to sound the warning buzzer. Shifts cursor to start of the next logical field. Shifts cursor to start of the preceding logical field. Same as <Shift>+<Space> but only valid for numeric fields after at least one number has been input. Erases the character before the cursor and shifts remainder of the field one character to the left. Transmits contents of screen back to software for processing. Same as <Enter> key. Aborts input to the current screen and returns to a previous menu/screen to make a selection again. Shifts cursor to beginning of current field. Shifts cursor to just past last character in current field. Shifts cursor to start of the first logical field on the screen. Shifts cursor to start of the last logical field on the screen. Shifts the cursor up and to the left to the next logical field. Shifts cursor down and to the right to the next logical field. Shifts cursor one position to left or to end of preceding logical field if already at the start of the field. Shifts cursor one position to right or to start of next logical field if already at the end of the field. Toggles between 'Insert' and 'Over type' modes, this is indicated by a change in the size of the cursor. Deletes the character at the cursor position and shifts the remainder of the field one position to the left adding a space on the end. In 'Insert' Mode, inserts a blank at the cursor position and shifts everything to the right one character. In 'Over type' Mode, places a blank character at the cursor position and moves the cursor one position to the right. Displays a help screen for the field where the cursor is located. In numeric fields - pressing this key will change the sign of the value in the field. This key can be pressed at anytime during the entering or changing of values in the field. Tab Forward Tab Back <,> (comma) <Backspace> <Enter> <Return> <Esc> <Home> <End> <Ctrl>+<Home> <Ctrl>+<End> <—> <˜> <•> <–> <Insert> <Delete> <Space Bar> <F1> <-> When data is shown or has been input into ALL appropriate fields the <Enter> key is pressed which passes the values back to the software for processing. Should a field contain invalid or incorrect data then an error message will be displayed. To clear this error message press the <Space Bar> (as indicated by the flashing <Space> symbol on the bottom line of the screen) and the cursor will be positioned at the start of the field in error. Change the data in this field as necessary and press the <Enter> key again to continue. Inputs in the fields can be either a string of one or more characters or numbers (the decimal point only being necessary when the number has a decimal fraction). 7. DESIGN PARAMETER TABLE FILE To simplify the process of re-creating the spacing tables/graphs for commonly used luminaire data can be set up in a ‘table’ file. This file (named PLESPACE.TBL) will quickly insert default values in the various fields, on the screen shown in Figure 4.4, based on the luminaire file name specified. To select one of the layouts in the table file simply press the <F5> key when the screen in Figure 4.2 is displayed. This will bring up a menu in the middle of the screen to select from (as shown in Figure 7.1). Move the highlight bar over the required choice and press <Enter>. The file name will now be placed in the appropriate field on the screen. Press <Enter> again to process this file, the resulting Figure 4.4 screen will be filled with the corresponding data from the table file. Copyright Trevor Caswell 1990-2002 Page 12 Spacing Graph Generator Version 1.65 Figure 7.1 The file PLESPACE.TBL is a simple ASCII text file containing as many lines as necessary with the contents of each line being as follows:file,luminaire description,wattage/type,flux,stores code,category,height,arrangement,upcast,offset This being the same order and number of fields on the screen in Figure 4.3. Each item must be separated by a comma (,) with no commas within the actual item data. If you do not wish to specify the default value for an item on the line then leave its position blank. This will leave the field blank on the screen and require input during the running of the software. The PLESPACE.TBL file supplied with the software contains the following lines:MINOR.CIE,MEGA-LITE,50w MV,1900,55438,B2,6.5,0,5,* SWMV80.CIE,MEGA-LITE (6.5m),80w MV,3650,55440,B1,6.5,0,5,* SWMV80.CIE,MEGA-LITE (7.5m),80w MV,3650,55440,B1,7.5,0,5,* FRHPS70.CIE,MEGA-LITE (7.5m),70w HPS,5600,55450,B1,7.5,0,5,* FRHPS70.CIE,MEGA-LITE (9.0m),70w HPS,5600,55450,B1,9.0,0,5,* (Note: For the sample photometric data supplied with this software the top line is the only valid selection.) Please feel free to add to this file with the luminaires you regularly use, or alternatively, you can remove any of the existing lines. 8. UPDATE HISTORY The following is a brief list of all the major changes that have taken place in the Spacing Graph Generator program. VERSION - 1.65 (Released October 2002) • • • Released with Perfect Lite - Version 4.86 Corrected for printing graphics on Windows NT/2000/XP machines (including Networked printers) Uses PPD32.EXE & PRINTGLN.DLL instead of PPD.EXE VERSION - 1.63 (Released May 2001) • • • • Released with Perfect Lite - Version 4.84 Modified to do all printing through the Windows Print Manager Menu added at start of program to select printer for output With the introduction of AS/NZS 1158.3.1 in 1999 this program has effectively been superseded by the Pedestrian Area Lighting software (PLEPAL) – refer separate manual detailing this software. VERSION – 1.60 (Released June 1998) • Released with Perfect Lite Version 4.82 • This particular version is a stand alone program, that is, it can be executed directly from DOS, if desired, rather than going through the Perfect Lite menu system. • Allows you to specify a full pathname (eg. Drive letter, subdirectory, file name and extension) of photometric data files to be used in the calculations. • Selection of files for import uses the standard DOS file dialogue box for easier operation. • For Mode 3 calculations a maintenance factor of up to 10 can now be input if R-Table 0 is also used. This will give the resultant values in Lux rather than Cd/m2. Copyright Trevor Caswell 1990-2002 Page 13 Spacing Graph Generator Version 1.65 VERSION - 1.59 (Released April 1997) • • • Released with Perfect Lite Version 4.81 Road Width changed to go from 2m through to 40m Now uses version 1.60 of PPD.EXE for printer output VERSION - 1.58 • • • • • • • • • • • • • • • • Special issue for SEQEB in Queensland Rounding off of displayed results corrected 'Count' column removed 'Plot' & 'Redraw' option removed from graphics screen Error message given if 'PPD.EXE' file not found prior to printing Printer port displayed after printer description on opening screen Spacing range increased to 120m on graph/plot Road reserve width increased to 38m on graph/plot Default Upcast angle set to 5 degrees Reading default set up values from file ‘PLESPACE.TBL’ added Reading from file PLESPACE.LIN now fully supported Maximum spacing displayed to 1 decimal place 'Emax/Eav' displayed to 1 decimal place 'NO COMPLIANCE' added if Maximum spacing less than 0.005m <F5> key added to select from Parameter table file If PLE.HLP not found then PLESPACE.HLP used VERSION - 1.57 • • • • Released with Perfect Lite Version 4.80 Message window displayed if 0 cd/m2 found at V=0 in I-table - "/ADJ" command line option added to adjust values to 1 cd/m2 "DESCRIPTION=" line added to 'PLESPACE.INI' file Disables MOUSE if file 'MOUSE.NO' found VERSION - 1.56 • • • Text 'AS1158.1 -1986' added Display/Print out fixed so when NO complying spacing 'Eav','Emin','Emax/Eav' shows last actual calculated values NOT last "complying" values Version no. added to text results screen/print out VERSION - 1.55 • • • • Now uses version 1.42 of PPD.EXE <Esc> used to abort processing of PrintGL print out Colour argument of 'PSET' & 'LINE' made Long Integer Configuration file now "PLE48.INI" VERSION - 1.54 • • Draws vertical ordinate at nominated values as in file "PLESPACE.LIN" Rounding off corrected to be same as print out VERSION - 1.53 • ‘Opposite’ arrangement re-instated as maximum now determined using both lights VERSION - 1.52 • • • • • '/FULL' command line option added for detailed calculation output to file Now support large asymmetrical I-table files Problem fixed in calculating Eh behind light ‘Opposite’ arrangement removed till Finding maximum is done properly Undocumented '/GRID' command line option added VERSION - 1.51 • • • Uses PLE.HLP as the Help file Will use Hercules Graphics card Stand alone version displays colours in Help correctly Copyright Trevor Caswell 1990-2002 Page 14 Spacing Graph Generator Version 1.65 VERSION - 1.5 • • • • • Use PPD.EXE instead of PRINTGL Can be called from PLE.EXE (PLESPACE.INI automatically set up) Released with version 4.77 of Perfect Lite PPD.EXE outputs to DOS LPT? not BIOS LPT? (fixes bug with network printers) Uses PLE47.INI for configuration options VERSION - 1.4 • NON Intel co-processor problem fixed VERSION - 1.3 • • Program corrected for when no solution found for a particular road width Thickness added to printer output VERSION - 1.2 • PRINTGL used for graphics printer output VERSION - 1.1 • Minor changes only VERSION - 1.0 • Original issue (1990) Copyright Trevor Caswell 1990-2002 Page 15 Spacing Graph Generator Copyright Trevor Caswell 1990-2002 Version 1.65 Page 16