1
StratSimManagement
The Strategic Management Simulation
Michael Deighan, Interpretive Simulations
Stuart W. James, Interpretive Simulations
Charlottesville, Virginia, USA
COPYRIGHT NOTICE
This manual and the simulation described in it are copyrighted with all rights reserved by Interpretive
Software, Inc. Under the copyright laws, neither this manual nor the software may be copied, in whole
or in part, without written consent of the authors, except in the normal use of the simulation for
educational purposes, and then only by those with a valid license for use. The same proprietary and
copyright notices must be affixed to any permitted copies as were affixed to the original. This exception
does not allow copies to be made for others, whether or not sold. Under the law, copying includes
translating into another language or format.
Purchasing the simulation experience gives the owner the right to participate in a unique learning event.
Each student or participant must purchase the simulation to take part in the event or the institution
sponsoring the event must purchase for the entire group participating in the event.
Limited Warranty on Media and Manuals
In no event, will Interpretive Software, Inc. be liable for direct, indirect, special, incidental, or
consequential damages resulting from any defect in the software or its documentation, even if advised of
the possibility of such damages. In particular, the authors shall have no liability for any programs or data
stored in or used with the computer products, including the cost of recovering such programs or data.
This simulation experience is sold, "as is," and you, the purchaser, are assuming the entire risk as to its
quality and performance. The warranty and remedies set forth above are exclusive and in lieu of all
other, oral or written, express or implied.
For more information about other products from Interpretive Software, please contact:
Interpretive Simulations
1421 Sachem Place, Suite 2
Charlottesville, VA 22901
Phone:
(434) 979-0245
Fax:
(434) 979-2454
Website: http://www.interpretive.com
Discover a Better Way to Learn. Active Learning through Business Simulations.
Copyright © 1995 – 2011 Interpretive Software, Inc.
All rights reserved. Printed in the United States of America. No part of this book may be used or reproduced in any manner
whatsoever without written permission of Interpretive Software, Inc.
Table of Contents
Introduction ............................................................................................................................................... 1
Getting Started with StratSim ................................................................................................................. 2
The StratSimManagement Manual ......................................................................................................... 4
Section 1: The StratSim Case................................................................................................................... 5
Industry Overview ................................................................................................................................... 5
Vehicle Attributes and Prices.................................................................................................................. 6
Product Development.............................................................................................................................. 8
Distribution ........................................................................................................................................... 11
Capacity and Production ....................................................................................................................... 13
Financial Situation ................................................................................................................................ 13
Product Class Examples........................................................................................................................ 15
Segment Descriptions ........................................................................................................................... 21
Section 2: StratSim Operations Guide .................................................................................................. 25
Getting Started ...................................................................................................................................... 25
Simulation Navigation .......................................................................................................................... 28
Detail of Menu Options ........................................................................................................................ 32
Internal .............................................................................................................................................. 33
Market ................................................................................................................................................ 42
Competition........................................................................................................................................ 51
Tools .................................................................................................................................................. 59
Decisions............................................................................................................................................ 66
Section 3: Managing for Success in StratSim ....................................................................................... 81
Fundamentals of Strategy...................................................................................................................... 82
The Profit Equation ............................................................................................................................... 85
Monitor Results..................................................................................................................................... 91
Long-Term Planning in StratSim .......................................................................................................... 92
Appendices ............................................................................................................................................... 99
Appendix A: Optional International Module ........................................................................................ 99
Appendix B: Exporting Data to a Spreadsheet ................................................................................... 115
Appendix C: Glossary of Terms ......................................................................................................... 117
Index ....................................................................................................................................................... 119
Print Date 4/12/2011
Acknowledgments
We have always considered our customers to be the most important part of our product development
team, and we are fortunate that they put their time and effort into improving our products through their
feedback and experiences. We will continue to incorporate suggested improvements into up-coming
releases of this product, and welcome your comments and suggestions.
There are many people to thank for their assistance on this project and we would like to single out a few
who significantly contributed to the content of this product over the years. In particular, Interpretive
would like to thank Tom Kinnear from the University of Michigan, James Thorne of Market Focus, and
Doug Dean of Volkswagen, all of whom provided a great deal of guidance and feedback with regard to
original content of the project. We have been very fortunate for the past few years to be working with
Mason Carpenter of the University of Wisconsin and Gerry Saunders of Rice University while they have
crafted their strategic management textbook for Pearson. They’ve provided invaluable feedback on the
simulation and how to integrate the experience with their textbook.
Over the past 10 years, we have been fortunate to have many people provide feedback and advice to help
StratSim get to where it is today. At Interpretive, Clayton Shumate, Erin Pringle, Tony Naidu, Payton
James-Amberg, Susan Christmas, Marjorie Adams, Gabriel Buddenbrock, Mary Deighan, Bill Luers,
and Laura Simroth all contributed their talents and experience. Bill Womack and Tony Naidu designed
this latest cover. Faculty users have been the source of countless suggested improvements and StratSim
is a significantly stronger product because of their thoughtful insights. In particular, we’d like to thank
Paul Arsenault, Torsten Ringberg, Glenn Christensen, Christine Moorman, Marian Moore, Ron Wilcox,
Jeff Lefebvre, Larry Feick, Marty Roth, Robert Dooley, Marc Filion, Ujwal Kayande, Rick Leininger,
Sam Certo, Sunil Gupta, Gerald Fryxell, and Juan Antonio Fernandez.
Finally, we would be remiss if we failed to thank all the students and executives who have experienced
StratSim in one form or another over the past 10 years. In particular, we appreciate the executives in
programs at Volkswagen, Michigan EP, and McKinsey & Company. We’ve also been fortunate to have
some extremely competitive and insightful students put StratSim through the wringer. The students in
the Duke WEMBA, Michigan EMBA, and Darden MBA programs are always extremely thorough in
their analysis and some of their questions have led to improvements introduced in this version.
We look forward to hearing your comments and suggestions on our latest release and best wishes for a
great experience with StratSimManagement.
Stu James
Mike Deighan
July 2009
Introduction
Simulations are one of many different methods for learning business skills. Reading textbooks teaches
the foundations of business theory, and real-world experience often shows the difficulty of putting those
theories into practice. The lessons of experience usually have the greatest impact because we tend to
learn best by doing, not solely by reading or hearing about other people’s experiences. However,
experience has its drawbacks as well. The well-known story about the employee who makes a mistake
costing a company millions of dollars is a classic example of the possible high expense of on-the-job
training. The employee enters the manager's office expecting to be fired and instead hears, "why would
we fire you now, we've just invested $10 million dollars in your training." Simulations represent a
sensible balance between the two. Though clearly not as rich as reality, simulations can capture the
essence of reality and help us practice implementing business theory without the potentially large costs
of errors.
StratSimManagement is an integrated strategy simulation game based on the automobile industry.
Needless to say, much of the complexity of the industry has been simplified to allow participants to
focus their time and energy on strategic issues. However, we've retained as much realism as possible to
make it easier to quickly understand the overall environment.
StratSimManagement addresses the following issues:
-
Developing a business definition and implementing a profitable long-term business strategy
Identifying market opportunities and creating product/service offerings to satisfy them
Analyzing competitors and understanding their strategic intent
Developing the corporate infrastructure necessary to sustain growth
Allocating scarce resources among products, functions, and other investment alternatives
Exploring international market and sourcing opportunities (optional module)
In the simulation, you or your group will be competing directly against other teams, either in your class
or possibly at other universities. Decisions are made once each simulated year. Once all competitors
have made these annual decisions, the simulation will be advanced, and the results will be updated.
These results will be dependent upon your decisions, those of your competitors, and the evolution of the
general industry environment. Each industry will develop uniquely based on how the competitors
interact, what new products are introduced, and how these products are supported. As you will soon see,
StratSim provides a very dynamic learning experience. Customers and competitors will change, new
products will be introduced, and the economy will have its ups and downs. The simulation is designed
to be a fun, but challenging, experience.
Competing in the StratSim environment will require complex analysis and decision-making. Therefore,
take some time to familiarize yourself with the program and manual before beginning the exercise.
While working through the simulation, you will find it helpful to refer to the manual for information and
strategy tips. Section 3 of the manual contains helpful reference material.
Introduction—Page 1
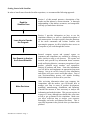
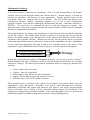
Getting Started with StratSim
In order to benefit most from the StratSim experience, we recommend the following approach:
Read the
StratSim Case
Learn How to Operate
the Program
Use Reports to Analyze
the Current Situation
Make Decisions
StratSim User's Manual—Page 2
Section 1 of this manual presents a description of the
market and the industry’s current situation. A thorough
understanding of the market, customers, and competitors
will help you make better decisions.
Section 2 provides information on how to use the
simulation software, as well as a detailed description of
each menu option. In order to quickly learn the functions
of the menu commands and become familiar with
operating the program, it will be helpful to have access to
a computer as you work through this section.
Internal company reports and external reports on
consumers and competitors are available by clicking on
links, similar to using a web browser. The reports and
research tools provide key information about customer
needs and buying behavior, consumer perceptions of your
product, potential target markets, and competitive
analysis of products and firms. From this information,
you will devise and implement an appropriate long-term
strategy. Just as in real life, however, some information
and reports will prove more useful than others. Part of
your decision-making process will include deciding
which information is most useful to your firm.
After reviewing information about your company, the
competition, and the market, you will decide how to
manage your firm in terms of product development,
marketing, manufacturing, distribution, and financing.
Consider the amount of time necessary to analyze the
information and make decisions. This process requires an
average of 2 hours, although one should allow extra time
at first to get acclimated to the simulation. Make sure
you allow sufficient time to analyze your resources
thoroughly and make well-planned decisions. This is
especially important in the periods when you launch new
products.
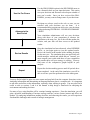
Use the Pro-Forma
Advance to the
Next Period
Review Results
Repeat
Use the PRO-FORMA option in the DECISIONS menu to
run a financial check on your input decisions. This option
uses your decisions and forecasts to develop an estimate of
next year’s results. Once you have reviewed the PROFORMA, you may want to change some of your decisions.
Decisions are always saved to the web, so once you are
satisfied with your decisions you are done.
It is
recommended that you print out and review your decisions
each period using DECISIONS – DECISION SUMMARY
- PRINT.
Your simulation administrator will use your decisions
along with those of your competitors to advance the
simulation to the next year. He or she will then update the
website, and your firm will have access to the updated
results.
Once the simulation has been advanced, select REFRESH
DATA, or just login again to view the updated results.
Review the results in the market before making decisions
for the next year. The simulation does not specifically tell
which strategies worked and which did not. Instead, you
must compare your results with those of your competition
and consider how well your strategy is working. You may
find some of the comparative graphs helpful in your
analysis.
Repeat the decision-making process until all periods have
been completed. At the end of the simulation, you will be
able to see how your firm performed over the entire game.
You may find it helpful to print out some reports and step back from the computer from time to time.
Analyzing information and determining an integrated business plan is a complex task. It is important
to take time and reflect on the information, especially when working in groups. You may also find it
useful to refer to sections 3 and 4 of the manual to help design a framework for analyzing the
environment and making decisions.
For many of you, using StratSim will be a unique learning experience. From the simulation, you will
gain a practical understanding of business strategy and how various factors interact and affect one
another. By analyzing information, making decisions, and observing the results, you will experience
first-hand the challenges and rewards of strategic management.
Introduction—Page 3
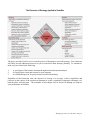
The StratSimManagement Manual
The remainder of this manual is divided into five sections:
1.
The StratSim Case
This section presents the StratSim industry in a form similar to a business school case. It also
serves as an introduction to the situation when starting the simulation. Note: The exhibits in
the case may or may not exactly match reports you will view in the simulation software,
depending on the scenario your simulation administrator chooses.
2.
StratSim Operations Guide
This section provides guidance on how to use the StratSim software, including hardware
requirements, installation of the software, interaction with the program, and a detailed
description of each menu option.
3.
Managing for Success in StratSim
Tackling the simulation is quite an undertaking. This section provides a basic framework for
how to create a strategy and introduces several frameworks to help keep your company on track
during the simulation. The section also provides a number of helpful hints on how to improve
your performance.
4.
Appendix
The last section of the manual contains several appendices that provide details on the optional
international module, exporting to a spreadsheet, a glossary, and an index.
StratSim User's Manual—Page 4
Section 1: The StratSim Case
Congratulations on your recent appointment to manage one of the five firms in the StratSim industry.
Though your primary objective will of course be to learn, you will also be setting other goals and
objectives for your firm. Those may be to become the market leader, or perhaps to maximize
shareholder return, or possibly to generate the most net income over the course of the game. Selecting
objectives is up to your group and your instructor. However, you will find that the firms who do best in
StratSim are able to leverage their core competencies, successfully enter new markets while defending
their own position, and prudently manage their financial resources. This is far easier to say than to
achieve. That is the challenge faced by all managers and executives.
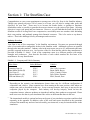
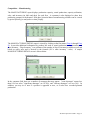
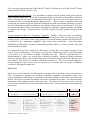
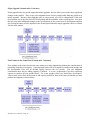
Industry Overview
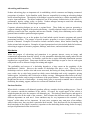
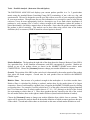
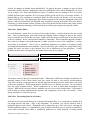
Your firm is one of five competitors1 in the StratSim environment. Revenues are generated through
sales of cars and trucks to automobile dealers in the StratSim world. Additional revenues are possible
through sales into other markets2. Industry sales in the most recent year were 4.3 million units and some
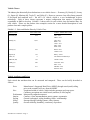
growth is expected in the next year. An overview of the five firms and the vehicles they manufacture is
provided in Exhibit 1.1 below. Each of the competitors starts in a different position with unique
strengths and weaknesses. Note that the first letter of each vehicle matches the first letter of its
manufacturer for easy identification.
Exhibit 1.1: Company and Vehicle Summary
Firm Name
Amazing Cars (A)
Best Motor Works (B)
Cool Cars (C)
Driven Motor Co. (D)
Efficient Motors (E)
Sales (Billions)
$ 20.5
$ 12.9
$ 13.7
$ 19.3
$ 20.1
Vehicles
Alec, Alfa, Awesome
Beaut, Boffo, Buzzy
Cafav, Camini, Climax
Defy, Delite, Detonka
Efizz, Estruck, Euro
1
Depending on the scenario your administrator chooses there may be a different configuration of
competitors and vehicles. Some scenarios have firms starting in the same position, while others are
unique-start, such as described in this case. In an even-start scenario, there may or may not be one
competitor played by the computer. Each industry will develop uniquely, based on how the
competitors interact, what new products are introduced, and how these products are supported. Please
make sure to use the data in your simulation if the values are different than those in the case.
2
The international module is optional and may not be part of your simulation experience and described
separately in the appendix. In addition, some of the tools and reports described in the operations
section of the manual may not have been selected by your instructor, or may be introduced later in the
simulation.
The StratSim Case—Page 5
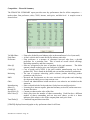
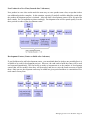
Vehicle Classes
The industry has historically been broken into seven vehicle classes — Economy (E), Family (F), Luxury
(L), Sports (S), Minivan (M), Truck (T), and Utility (U). However, one new class offers future potential
if developed and marketed well – the AEV (A) vehicle, which is a new breakthrough in drive
technology. Each of these classes represents a unique configuration that requires a significant
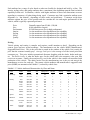
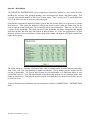
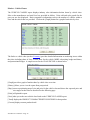
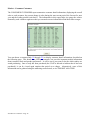
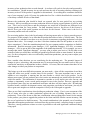
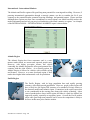
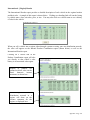
expenditure in R&D to develop. Exhibit 1.2 shows sales for each vehicle class and market share for
each vehicle. Please see the product class examples section for a more detailed description of each
product class and a sample picture.
Exhibit 1.2: Sales and Market Share by Vehicle Class
Vehicle Class
Economy (E)
Sales (000s Units)
Vehicle / Market Share (units)
914
Alec / 63%
Delite / 37%
Family (F)
1,439
Alfa / 22%
Boffo / 7%
Cafav / 13%
Defy / 29%
Efizz / 29%
Luxury (L)
291
Beaut / 59%
Climax / 41%
Sports (S)
141
Buzzy / 100%
AEV (A)
0
No vehicles introduced yet
Minivan (M)
181
Camini / 100%
Utility (U)
640
Awesome / 49%
Euro / 51%
Truck (T)
677
Detonka / 56%
Estruck / 44%
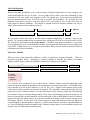
Vehicle Attributes and Prices
Each vehicle has attributes that can be measured and compared. These can be briefly described as
follows:
Price
Manufacturer’s Suggested Retail Price (MSRP), though actual (retail) selling
price to the customer will vary from the MSRP.
Size
Length and width of vehicle, which includes passenger and cargo space.
Consumer perceptions are scaled from 0 (smallest) to 100 (largest).
Performance Measured by engine horsepower.
Interior
Comfort, vision, instrumentation, music systems, ergonomics.
Styling
General curb appeal, styling, handling, finish / workmanship.
Safety
Structural design, braking systems, safety features.
Quality
Overall reliability, durability, consistency of products.
StratSim User's Manual—Page 6
Each attribute has a range of value based on what can feasibly be designed and built by a firm. The
interior, styling, safety, and quality attributes have a maximum value dependent upon the firm's technical
capability in that area. In StratSim, vehicles with higher attributes in these four dimensions are more
appealing to customers, all other things being equal. Customers may find a particular attribute more
important (i.e. “hot button”), depending on their needs and preferences. Customers weigh these
attributes against the price of the product and also consider the size and engine performance of the
vehicle, which is typically a personal preference.
Price
Size
Performance
Interior
Styling
Safety
Quality
Generally ranges from $5,000 - $50,000
0-100 (smallest to largest)
50-300 Horsepower (low to high performance)
1 to the maximum value dependent on firm capability
1 to the maximum value dependent on firm capability
1 to the maximum value dependent on firm capability
1 to the maximum value dependent on firm capability
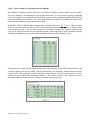
Pricing
Vehicle pricing and costing is complex and requires careful attention to detail. Depending on the
context, price can have several meanings. The manufacturer sets the vehicle MSRP (Manufacturer's
Suggested Retail Price). This is the price that is posted in the window of the vehicle, but is rarely the
price that the customer actually pays. Average retail price is the average of all the actual prices that
customers pay. This price includes promotional discounts, haggling with the dealer, dealer mark-ups,
etc. The dealer invoice is what the dealer pays for the vehicle and is the monetary value your firm
receives as revenues. Finally, the manufacturing cost for the vehicle is the variable cost associated with
production of the vehicle. The dealer invoice less the manufacturing cost is the per unit margin the
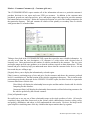
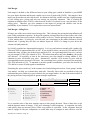
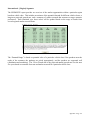
manufacturer receives for each sale. The current vehicle attributes and manufacturer's suggested retail
price (MSRP) are summarized in Exhibit 1.3, ordered by vehicle class.
Exhibit 1.3: Vehicle Attributes/Characteristics by Class and Name
Class
Name
MSRP
Size
Horsepower
Interior
Styling
Safety
Quality
Economy
Alec
Delite
$15,351
$11,293
14
5
135
85
2
1
1
1
3
1
2
1
Family
Alfa
Boffo
Cafav
Defy
Efizz
$24,084
$35,003
$31,361
$25,921
$18,869
28
49
49
43
35
165
200
165
165
140
2
4
4
2
1
1
3
2
1
1
3
2
2
3
2
2
2
2
2
1
Luxury
Beaut
Climax
$38,385
$45,997
62
74
240
240
2
4
4
2
2
2
2
2
Sports
Buzzy
$34,652
54
190
3
3
2
3
Minivan
Camini
$24,144
82
200
2
1
2
1
Utility
Awesome
Euro
$21,149
$26,528
40
59
220
200
1
1
1
3
1
1
1
1
Truck
Detonka
Estruck
$19,572
$21,843
66
75
185
280
1
1
1
1
1
1
1
2
The StratSim Case—Page 7
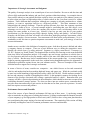
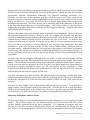
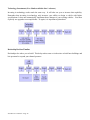
Product Development
As is the case with the automobile industry, product development in StratSim is expensive, time
consuming, and risky. However, the reward of having the leading vehicle within a product class is often
well worth the investment. Additionally, the risk of falling behind the times in terms of styling,
performance, and appeal is dangerous.
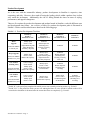
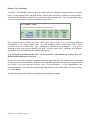
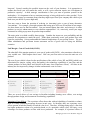
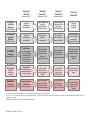
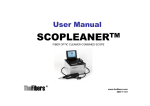
There are five options for product development and product launch in StratSim, each with different costs
and development time frames. An overview of these five product development paths is illustrated in
Exhibit 1.4 below and described in more detail on the following page.
Exhibit 1.4: Product Development Timelines
Minor
Upgrade
$100-$300 Million
in current year
Major Upgrade
$250-$750 Million
Spread over 2 years
New Product
(Existing class)
$250-$1,500 Mill.
Spread over 2 years
New Product
(New class)
$500-$2,500 Mill.
Spread over 3 years
1
2
Results for
Period N1
Decisions for N+12
Results for
Period N+1
Decisions for N+2
Results for
Period N+2
Decisions for N+3
Results for
Period N+3
Modify Specs
In Dev. Center
Adjust Marketing Mix
Adjust Production
(Inventory disposed)
In Market
Results impacted.
(Including sales,
retooling, inventory
write-off)
In Market
In Market
Modify Specs
In Dev. Center
Build Add’l Capacity
Modify Specs
In Dev. Center
Adjust Marketing Mix
Adjust Production
(Inventory disposed)
In Market
Results impacted.
(Including sales,
retooling, inventory
write-off)
In Market
Create Concept
Name Product
Modify Specs
In Dev. Center
Build Add’l Capacity
Modify Specs
In Dev. Center
Set Marketing Mix
Set Production
In Market
Results impacted.
(Including sales,
retooling)
In Market
Create Concept
Name Product
Modify Specs
In Dev. Center
Modify Specs
In Dev. Center
Build Add’l Capacity
Modify Specs
In Dev. Center
Set Marketing Mix
Set Production
In Market
Results impacted.
(Including sales,
retooling)
Period "N" is the period just completed for which you are now currently reviewing results; e.g.: Period 1
Period "N+1" is the period for which you are now making decisions. It is the period for which results will be
created as the simulation is advanced after the current decisions are completed; e.g.: Period 2.
StratSim User's Manual—Page 8
1. “Minor Upgrade” – Based on Existing Product – Immediate - Uses Dev. Center for 1 Advance
The first option is a minor upgrade to an existing vehicle. A minor upgrade is completed and launched
in the current decision period and normally costs in the range of $100 to $300 million, depending on the
significance of the upgrade. A minor upgrade will have lower unit cost and/or enhanced product
attributes. For example, firm A markets a family car (Alfa) with characteristics 2, 1, 3, and 2. Upgraded
characteristics might be 3, 1, 3, 3, with changes to the horsepower and size as well. The maximum
change for a minor upgrade is 1 on each of the four vehicle specifications, 5 on HP, and 2 on size.
2. “Major Upgrade” – Based on Existing Product – 1 Year – Uses Dev. Center for 2 Advances
The second option is a major upgrade to an existing vehicle. A major upgrade is completed and
launched in the year following when it is begun and normally costs in the range of $250 to $750 million
depending on the significance of the upgrade. For example, firm A currently markets a family car (Alfa)
with characteristics 2, 1, 3, and 2. Upgraded characteristics might be 4, 1, 3, 4, with changes to the
horsepower and size as well. The maximum change for a major upgrade in the first year is 2 on each of
the four vehicle specifications, 20 on HP, and 10 on size. These may be adjusted in the second year.
3. “New Product (Existing Class)” – Based on a New Vehicle Concept – 2 Advances
The third development option is for a firm to develop a new vehicle in a class where it has experience,
but to start from a new concept rather than upgrading an existing vehicle. This option is completed and
launched in the year following when it is begun and normally costs between $250 million and $1.5
billion to complete, again depending on the particular characteristics. For example, Firm A currently
markets a family car (Alfa) with characteristics 2, 1, 3, 2. Firm A decides to come out with a totally
new, higher-end, family class vehicle named Aphid. There will be no brand awareness for the product,
since it will have a new nameplate.
4. “New Product (New Class)” – Based on a New Vehicle Concept – 3 Advances
The fourth development option is for a firm to develop a new vehicle in a class in which it has no
experience, making it necessary to start from a totally new concept. This option is completed and
launched in the second year following when it is begun and normally costs in excess of $1 billion. As an
example, Firm A currently markets products in the economy, family, and sports product classes. They
decide to develop a product in the truck category. There will be no brand awareness for the product,
since it will have a new nameplate.
Product Development Centers
Each firm has a limited number of product development centers that affects its ability to work on
multiple development projects (upgrades, new products) concurrently. Building and funding new
centers can increase a firm’s ability to develop more products at the same time. This investment
corresponds to hiring more product development engineers and expanding the R&D facilities. This will
allow a firm to work on more new vehicles or upgrades at the same time.
Product Development Centers = Maximum number of product development projects a firm can work on
concurrently in a given year.
The StratSim Case—Page 9
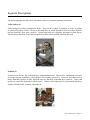
Product Concepts
The initial stage in the product development process is to create a concept. A concept is created by your
development engineers and costs nothing until you decide to develop it by moving the concept into one
of the development centers. Each concept and product development project is defined by its attributes –
class, size, performance (engine HP), interior, styling, safety, and quality. There is also an overall cost
for the development process, an estimated unit cost, and a time to complete. A sample concept is shown
below.
The estimated unit cost is based on 100,000 units of production (“base cost”). If actual production is
less than 100,000 units, actual unit costs will be higher than the estimate. If actual production is greater
than projected, actual unit costs will be lower than estimated. In general, unit costs decrease with greater
production volumes due to the experience effect (see Section 3 for a more in-depth discussion of
experience effects and economies of scale).
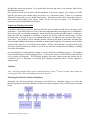
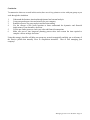
Technology Capabilities
Each firm in the StratSim world has technological capabilities that parallel the vehicle attributes of
interior, styling, safety, and quality. To keep measurement relatively straightforward, these are rated
from 1 to the current maximum (where 1 equals a poor rating on that attribute). Firms also have the
ability to expand their capabilities up to current technology limits through investments in technology
capabilities. These investments provide two advantages — first, the ability to develop cars with
enhanced features (e.g. higher ratings); and second, the lowering of costs to develop a similar set of
characteristics. For example, a firm with technology capabilities of 8, 8, 8, 8 (interior, styling, safety,
quality) would be able to produce a 4, 4, 4, 4 car at a lower unit cost than a firm with a technology
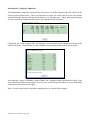
profile of 6, 6, 6, 6. The current technology profiles with the maximum limitations are displayed below.
Exhibit 1.5: Technology Capabilities of Firms
Maximum
Interior
9
Styling
11
Safety
9
Quality
11
5
7
6
4
3
5
8
7
5
5
4
5
5
5
3
6
7
7
6
5
Amazing Cars (A)
Best Motor Works (B)
Cool Cars (C)
Driven Motor Co. (D)
Efficient Motors (E)
StratSim User's Manual—Page 10
Advertising and Promotion
Product advertising plays an important role in establishing vehicle awareness and shaping consumers'
perceptions of products. In the StratSim world, firms are responsible for setting an advertising budget
and an advertising theme. The majority of the budget is spent on media buys, with the remainder on the
creative input and theme. The theme emphasizes one of the primary characteristics of the vehicle —
performance, interior, styling, safety, or quality. Product managers attempt to match the advertising
theme with the "hot buttons" of their target consumer.
Corporate advertising budgets are set on a regional basis. These funds are spent on generating a
corporate identity in support of the product advertising. A public relations budget is also set to support
publicity events for the firm, corporate, and investor relations. Finally, direct marketing can be used to
generate interest within a particular target segment.
Promotional budgets are set at the product level and include special incentive programs and general
promotional activities. The purpose of special incentive programs is to move product during slower
periods of demand. Examples of incentives include consumer rebates, below market financing, and
dealer-oriented sales incentives. Examples of general promotional activities include funds for brochures,
advertising in support of incentive programs, mailings, trade shows, and motivational contests.
Distribution
While the purpose of advertising and promotion is to generate interest, create an image, and
communicate information about the vehicle, it is the automobile dealership that actually makes the sale
and provides follow-up services. In StratSim, each firm has a captive dealership distribution structure
organized on a regional basis. Firms must decide how many dealerships to open or close in each region
each period as well as allocate a budget for training and support.
The profitability and success of a dealership depends to a large extent on the popularity of the
manufacturer's vehicles. However, the number of dealerships also plays a role. Having too few
dealerships can leave smaller cities and towns uncovered, but having too many dealerships can lead to
poor results, due to sales being spread too thinly across dealerships and overly competitive pricing
within regions. In StratSim, this is referred to as dealer coverage. Management often looks to the sales,
gross profit per dealer, and coverage as indicators of the proper balance. Dealer ratings can also provide
insight into the success of dealerships. A strong dealer gross is expected to translate into a successful
dealership, but training, support, and service revenues all contribute as well.
Purchase Decision
What vehicle a customer will ultimately purchase reflects a complex decision making process. First of
all, customers consider the attributes of the vehicle. Of course, the overall appeal of the vehicle is
weighed against the price the customer will ultimately pay. This trade-off between price and appeal is
what creates value in the mind of the customer. Each customer has different needs and also places a
different importance on each need. Some attributes may be very important to the customer (“hot
buttons”) while others are less important. In some cases, customers may want more of an attribute,
while in other cases, they may have a particular ideal in mind. Their decision will also be impacted by
their knowledge of the vehicle (awareness), experience at the dealership (dealer rating, dealer coverage),
and special promotional offers and activities.
The StratSim Case—Page 11
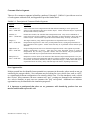
Consumer Market Segments
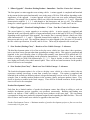
There are five consumer segments in StratSim, numbered 1 through 5. Exhibit 1.6 provides an overview
of each segment with units sold, and Appendix B provides further detail.
Exhibit 1.6: Description of Consumer Market Segments
Segment
Description
Value Seekers (1)
Sales = 792K units
Value seekers have basic transportation needs that include commuting to work. Quality and
safety are most important to these price sensitive buyers. Vehicle classes that may be of particular
interest include economy and truck.
Families (2)
Sales = 1,663K units
Families have flexible, but somewhat basic transportation needs. They need a combination of
people and cargo-carrying capabilities. Safety and quality are most important to these fairly price
sensitive buyers. Vehicle classes of particular interest include family, economy, and minivan.
Singles (3)
Sales = 851K units
The singles market is young, and this segment has more disposable income to spend on
transportation. Singles have a wide variety of transportation needs. Styling and performance are
most important to this segment. Vehicle classes that may be of particular interest include sports
and truck.
High Income (4)
Sales = 363K units
People with high incomes have more elaborate transportation needs. This segment may include
families, professionals, or retirees. Since they have more disposable income to spend on
transportation, they are likely to purchase vehicles with extra features and good performance.
Vehicle classes that may be of particular interest include family and luxury.
Enterprisers (5)
Sales = 614K units
Enterprisers see their vehicle as an extension of their business and personal aspirations. They use
their vehicles for business transportation and also to impress potential clients. People with careers
in real estate, investments, and sales are likely to fall in this category. Vehicle classes that may be
of particular interest are luxury, utility, and other high-end vehicles, depending on their uses.
New Opportunities
Market research has also identified some potential new customers in the market, whose needs are not yet
satisfied by the current vehicles. New customers may be looking for a new vehicle class, such as a AEV,
or a significantly different configuration of an existing vehicle class. If a firm introduces such a vehicle
that “excites” these customers, the new customer may “pop”, creating new demand in the marketplace.
As a rule in StratSim, at most, one new customer can “pop” each period. Additional new customer
opportunities may be identified as the simulation progresses.
It is important to understand that there are no guarantees with introducing products into new
markets and StratSim reflects this risk.
StratSim User's Manual—Page 12
Capacity and Production
Capacity for each firm is fixed for a given year. However, changes of up to 50% of your current capacity
may be initiated at any time. The increase or decrease takes one year to take effect. Thus, if you build
additional capacity this year, next year you will be able to set production levels based on the new plant
capacity. (See Exhibit 1.4 for how increasing capacity fits into the new product launch timetable). The
original costs for the capacity are shown on the balance sheet under plant and equipment, while the
appropriate depreciation is expensed each year on the income statement.
Firms may choose to set production levels above capacity in the short-run by running extra shifts and
paying overtime. An over-capacity charge will be incurred as an extraordinary item on the income
statement if capacity utilization is over 100%.
Production within the constraint of capacity is fairly flexible. Firms must decide on production volume
for each product on the market. When the production level on a line is increased from the previous
period, the capacity now associated with that product is upgraded and retooled. Retooling also occurs
when current or new productive capacity is dedicated to a new product line. The retooling investment is
reflected in an increase in the plant and equipment on the balance sheet. Lower plant maintenance costs
are also likely when the factory is updated.
Firms may choose to use a flexible production option that increases or decreases production by up to
10% from the firm’s target production value, depending on demand. If production volume is insufficient
for demand, consumers who are unable to purchase a vehicle at the end of the period postpone their
purchase decision until the beginning of the next year, purchase an alternative brand, or buy a used
vehicle.
Inventory levels should be considered when deciding on production volume for the current year. If a
product is being redesigned or discontinued, the current inventory will be sold in markets outside the
StratSim simulation at a price dependent on the level of inventory compared to last year's sales.
Financial Situation
Financial management in StratSim is essential. In addition to choosing among investments in
technology, manufacturing capacity, retooling, and platform development, a firm must also manage cash
flow and investor expectations.
The income statement in StratSim summarizes revenues and expenses for the company. Revenues
consist of vehicle sales to the dealer and other sources of revenues. Cost of goods sold is then subtracted
to generate a gross margin. Non-direct costs such as advertising, research and development,
administration and overhead, plant maintenance, and depreciation are then subtracted to create income
from operations. Net corporate income is calculated once extraordinary items and interest are applied.
Finally, taxes are applied at the appropriate rate for your environment, leaving income after taxes. There
is no provision for tax loss carry-forward in StratSim.
The balance sheet shows assets of cash, receivables, inventory, and plant and equipment, less
depreciation. Liabilities consist of short- and long-term debt and accounts payable. Equity consists of
original value of stock at par, any additional paid in capital, and retained earnings.
A firm running low on cash has three options. First, it may sell or issue shares of stock. This has the
benefit of not creating an interest expense or additional obligations. However, the drawback is dilution
The StratSim Case—Page 13
of the shares of stock that may lower the share price at the time of issuance. The second option for
raising capital is to issue 10-year bonds, callable after 3 years. The interest rate will reflect the current
credit rating for the company. AAA rated bonds offer the lowest investment risk and therefore the
lowest interest rate. The third option is to take on a revolving line of credit, which, if neither of the first
two options is exercised, will be the default case. Short-term credit typically demands a higher interest
rate than long-term bonds.
The Objective
The task of the management team is to maintain long-term profitability in the context of an increasingly
competitive and changing environment. Customer needs and tastes will evolve. Competitors will be
battling for market share and entering new product classes. Technologies and cost structures for the
firms will change over time.
Every simulated year, each firm will perform a situation analysis, identify problems and opportunities,
and generate alternative options for decisions. Finally, based on careful consideration, persuasive
presentation of competing ideas, and probably some arm-twisting, your team will come to a consensus as
to which set of decision is best and implement them.
Once your firm has a thorough understanding of the StratSim world, one of the first tasks should be to
define a strategy. A successful firm will likely have a strategy that is well thought out and executed.
Creating a sound strategy is the most important process your firm will undertake because your strategy is
the framework for all decision-making and firm organization. The strategy should be a long-term vision
for your firm that every member of your team can reference when making decisions and analyzing data.
Strategy is defining segments served and creating a sustainable competitive advantage. It is your road
map. It is where and how your firm chooses to compete. It is essential.
Enjoy your tenure as a management team in the StratSim world. It should be an exciting and challenging
learning experience. Good luck and have fun!
StratSim User's Manual—Page 14
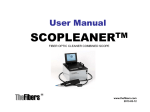
Product Class Examples
The following pages provide a sample picture of a vehicle in each product class in StratSim as well as a
brief description of some of the features one can expect to find in each class. Please note that the
specifications are approximate and meant as a general guide to distinguishing product classes.
Economy
Economy vehicles typically are small, low priced cars with less powerful engines. Price in the early
periods is under $18,000. Engine horsepower is likely to be under 150. Most economy vehicles will
have a hatchback and sedan model option, and some may also offer a small wagon. An economy car can
usually seat 4 adults, though probably not comfortably. A child may be able squeeze in the middle of the
back seat in a pinch. Legroom and storage space are minimal. In StratSim, this corresponds to a size of
approximately 0-30.
Features on an economy car are also likely to be basic in order to keep the costs down. Some consumers
are willing to pay more for these features, but one should be careful not to provide too many, driving up
costs and eroding profitability. It is difficult to make significant money in the economy segment, though
production volumes are significant. Also, for many consumers, an economy vehicle is their first car
purchase, and therefore is an important part of your vehicle line-up.
Examples of economy vehicles are the Toyota Yaris, Ford Focus, Saturn Ion, Volkswagen Beetle, Honda
Civic, and Chevy Cobalt.
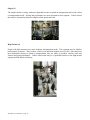
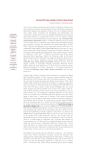
Family
Family vehicles are mid-sized, medium priced cars with mid-range engines. Price in the early periods is
between $15,000-$25,000. Engine horsepower is likely to be 120-180. Most family vehicles will have
several different model offerings, and most will have four doors. A family car can usually seat 5 adults,
though those in the back seat may be a bit cramped. Legroom and storage space are reasonable. In
StratSim, this corresponds to a size of approximately 30-60.
The StratSim Case—Page 15
Features on a family car are likely to focus on safety and flexible storage. Customers who are in search
of a family vehicle want a reliable, safe means of transportation for their families at a reasonable cost.
This vehicle is likely to be their primary mode of transportation and should hold up well under the
normal wear and tear of everyday family life. Volumes for this class are significant, so it is important to
create a vehicle with wide appeal. Price and promotional deals have a significant impact on buyers of
these vehicles.
Examples of family vehicles are the Honda Accord, and Toyota Camry.
Luxury
Luxury vehicles are high priced cars with top of the line features and performance. Price is typically in
excess of $35,000. Engine horsepower is likely to be over 150. Luxury vehicles come in a wide array of
models including sedans, coupes, and even wagons. A luxury car can usually seat 5 adults comfortably.
Legroom and storage space are ample. In StratSim, this corresponds to a size of approximately 45-70.
Features on a luxury car are normally numerous. Interior, styling, safety, and quality are all likely to be
quite high. Customers who are in search of a luxury vehicle want the best and are willing to pay for it.
StratSim User's Manual—Page 16
Though volumes in this class are less, per vehicle profit margins are high. These vehicles are also often
the “flagship” brand for the company and help create showroom traffic.
Examples of luxury vehicles are Mercedes, Cadillacs, Lexus, and some BMWs.
Sports
Sports vehicles emphasize performance and come in a range of prices and sizes. Typically they appeal
to the young and the young at heart. An economy sports car might be priced as low as $14,000, whereas
a high-end sports car may well be in excess of $35,000. Engine horsepower is likely to be over 150.
Sports cars normally are coupes or hatchbacks. Some sports cars have only two front seats while others
may have small back seats for additional cramped seating. Legroom in the front is reasonable, but there
is typically little storage space. In StratSim, this corresponds to a size of approximately 15-60.
Features on sports cars usually are related to styling and performance. Customers who are in search of a
sports car want to be noticed and are willing to spend a good chunk of their disposable income to that
end. Though volumes in this class are less, per vehicle profit margins are pretty good. These vehicles are
also often high awareness brands for the company and help create showroom traffic.
Examples of sports cars are Ford Mustang, Mazda Miata, and Nissan 350Z.
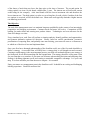
Alternative Energy Vehicle (AEV)
Alternative Energy Vehicles (AEVs) have more to do with the technology used to power the vehicle than
the style and size of the vehicle. AEVs encompass a wide range of technologies that might be used to
power the vehicle including electricity only (rechargeable batteries), fuel cell, hydrogen, solar, or some
combination of these. Though the technology is more expensive and somewhat untested, it does lead to
significantly improved energy efficiency and lower pollution. Power and/or range still remain a
challenge. Expected prices are from $20,000 and up. Engine horsepower is likely to be 70-150, and size
in StratSim ranges from 0-50 depending upon the application.
The StratSim Case—Page 17
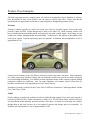
Minivan
Minivans are family oriented vehicles that have lots of passenger and storage room, but drive more like a
car than a truck. These are perfect for families who need more space than a family vehicle can offer.
Price is typically between $18,000-$35,000. Engine horsepower is likely to be 120-240. Most minivans
will have several different model offerings, which mainly vary seating capacity and cargo area. A
minivan can usually seat 7 adults, possibly more depending on the seating configuration. Legroom and
storage space are excellent. In StratSim, this corresponds to a size of approximately 50-100.
Like family vehicles, features on a minivan are likely to focus on safety and flexible storage. Customers
who are in search of a family vehicle want a reliable, safe means of transportation for their families at a
reasonable cost. This vehicle is likely to be their primary mode of transportation and should hold up
well under the normal wear and tear of everyday family life. Price and promotional deals have a
significant impact on buyers of these vehicles.
Examples of minivans include the Dodge Caravan, Toyota Sienna, and Honda Odyssey.
StratSim User's Manual—Page 18
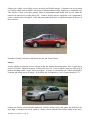
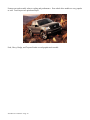
Utility
Combine the attributes of a truck, minivan, and sports car, and you get a utility vehicle. Utility vehicles
offer a little bit of fun and utility for those who need more passenger room than a truck, but don’t want
to have the minivan “family” image. Price starts at around $17,000 for small utility vehicles, but fully
loaded large ones will sell for over $40,000. Engine horsepower is likely to exceed 150. Legroom and
storage space are excellent on larger models, which can also seat 5 adults. In StratSim, sizes of utility
vehicles range from 30-90.
Features on utility vehicles usually are related to styling and performance. Many of the high-end models
come with leather seats and other amenities normally found in luxury cars. Most customers prefer the 4wheel drive models.
Examples of utility vehicles include the Ford Explorer, Chevy Blazer, and Isuzu Trooper.
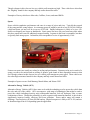
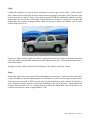
Truck
At one time, trucks were reserved for farmers and handymen, but no more. Truck sales have taken off in
recent years thanks to their broadening appeal as an alternative to sports cars and a great second vehicle.
Truck prices start at around $12,000 for small ones, but fully loaded larger trucks will sell for $25,000 or
more. Engine horsepower also has a wide range depending on the size of the truck. Leg and headroom
is ample, and most trucks seat 2 or 3, though some new models are adding back seats. In StratSim, sizes
of trucks correspond to a range of approximately 30-90.
The StratSim Case—Page 19
Features on trucks usually relate to styling and performance. Four-wheel drive models are very popular
as well. Truck buyers are quite brand-loyal.
Ford, Chevy, Dodge, and Toyota all make several popular truck models.
StratSim User's Manual—Page 20
Segment Descriptions
The following pages provide a brief description of the five consumer segments in StratSim.
Value Seekers (1)
Value Seekers have basic transportation needs. They use their vehicle to commute to work, or perhaps
as a basic all-purpose vehicle. However, they don't have as much disposable income as other segments
and are, therefore, more price sensitive. Quality and safety are especially important to these buyers.
Vehicle classes that may be of particular interest to value seekers include economy and truck.
Families (2)
Families have flexible, but somewhat basic transportation needs. They need a combination of people
and cargo-carrying capabilities with perhaps a bit of family fun built in. However, they don't have as
much disposable income as other segments and are, therefore, somewhat price sensitive. Safety and
quality are especially important to these buyers. Vehicle classes that may be of particular interest to
families include family, economy, and minivan.
The StratSim Case—Page 21
Singles (3)
The singles market is young, with more disposable income to spend on transportation and a wide variety
of transportation needs. Styling and performance are most important to this segment. Vehicle classes
that may be of particular interest to singles include sports and truck.
High Income (4)
People with high incomes have more elaborate transportation needs. This segment may be families,
professionals, or retirees. They see their vehicle as an indication of their success in life. Since they have
more disposable income to spend on transportation, they are likely to purchase vehicles with extra
features and good performance. Vehicle classes that may be of particular interest to the high-income
segment include family and luxury.
StratSim User's Manual—Page 22
Enterprisers (5)
Enterprisers see their vehicle as an extension of their business and personal aspirations. Enterprisers use
their vehicles for business transportation and also to impress potential clients. Their vehicles may be
company or privately-owned. Careers such as real estate, investments, and sales are likely to fall in this
category. Vehicle classes that may be of particular interest to enterprisers are luxury/sports utility, and
other high-end vehicles, depending on their business needs.
The StratSim Case—Page 23
StratSim User's Manual—Page 24
Section 2: StratSim Operations Guide
StratSimManagement is designed to be easy to use and is compatible with all the recent Microsoft
Windows operating systems. This operations guide helps you start the simulation and also provides
more detailed descriptions of each of the reports and decision screens.
The StratSim simulation contains all the marketing, competitive, and financial reports for your industry.
After reviewing these reports, you will make decisions that are automatically saved on the Interpretive
website. Once your decisions (and those of your competitors) are completed, Interpretive will advance
the simulation, update the results, and you will be able to view the outcomes.
Getting Started
StratSim is compatible with all the recent Microsoft Windows operating systems and requires a hard
drive and Internet connection. The minimum requirements are:
•
•
•
•
Windows Vista or XP
MAC compatible
Internet access (Broadband recommended, dial-up acceptable) and a web-browser
4 MB of hard disk space (or zip drive / memory stick)
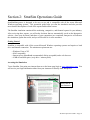
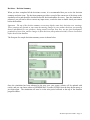
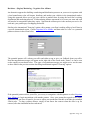
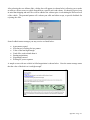
Accessing the Simulation
To use StratSim, first point your internet browser to the home page login at www.interpretive.com. You
will receive your login information either from your instructor or directly from Interpretive.
Enter User ID
and Password
StratSim Operations Guide—Page 25
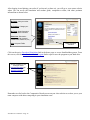
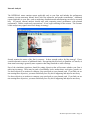
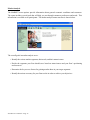
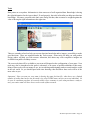
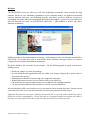
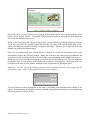
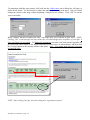
After logging in and placing your order (if you haven't yet done so), you will go to your course website
where you can access the simulation and student guide, comparative results, and other pertinent
information as shown below.
My Order: View your order
information
My Settings: Change your
password
My Team: View information
about your team members
Resources: Simulationrelated materials (manual,
PowerPoints, flash tours, etc.)
Help: Help and FAQs
Class simulation
schedule
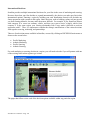
Click on the active Download Simulation link in the home page to access StratSimManagement. From
this screen, click the StratSim Installation Program link to open or save the program to your hard drive.
Access simulation by first
clicking the active
Download Simulation link,
and then clicking the
StratSim Installation link.
Remember to refer back to the Comparative Results screen on your class website to see how you or your
team compares with others competing in your simulation event.
StratSim User's Manual—Page 26
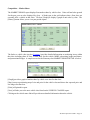
Installation
You may open and run the installation file directly from the Internet or download the archive (.exe file)
to a folder. The StratSim software is in a self-extracting installation file. If you choose to open the file,
follow the installation instructions to extract the programs. If you choose to save the file to a folder on
your hard drive, save the file, then go to the folder, double click on the .exe file, and follow the
installation instructions.
StratSim may be installed on multiple computers (work and school, for example), but you should refresh
the data or login again anytime you change locations.
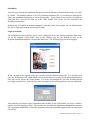
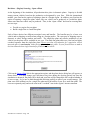
Login to StratSim
The installation process will allow you to create a StratSim icon on your desktop and on the Start menu.
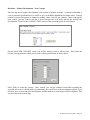
To run the program, either double click on the StratSim icon on your desktop or click on the
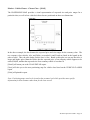
Programs/Simulations/StratSim icon from the Start menu. The following login screen will appear:
When you login to the program, make sure you have an active Internet connection. You will also need
your user ID and password, which should have been sent directly to you by the simulation administrator.
From this screen, choose the [Login] button. You’ll now be prompted for your user ID and password
(see Login screen below). You must have these two unique pieces of information to start the simulation.
After entering your unique sign-in information and clicking on the [OK] button, you may be asked to
register (first time logging in only). Please make sure you enter the registration information accurately.
The registration information is especially important so that the simulation support staff can contact you
if necessary.
StratSim Operations Guide—Page 27
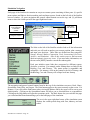
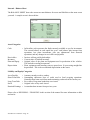
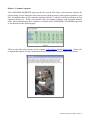
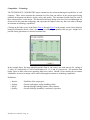
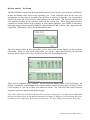
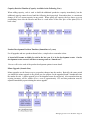
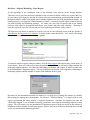
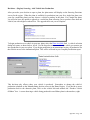
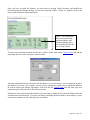
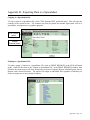
Simulation Navigation
Each page of the StatSim site contains an easy-to-use menu system consisting of three parts: (1) specific
menu options and links to decision-making tools and input screens, found on the left side of the StatSim
browser window; (2) green navigation and general control buttons across the top; and (3) pull-down
menu to show the current period in the upper right-hand corner.
Menu system:
main categories
& sub-menu
choices
Firm name
and user info
Help for
current report
Navigation buttons
StratSim screen
display
The links on the left of the StratSim window lead to all the information
and tools you will need to analyze your current position, plan a strategy,
and input your decisions. These links are divided into nine categories:
Startup, Internal, Market, Competition, Tools, International, Decisions,
Analysis, and Simulation. One of the easiest ways to find out more
about an option is just to try it out. If you need more information, use
the on-screen [HELP] button to consult the student guide.
Each part includes menu links that correspond to different reports,
decisions, or actions. For example, under Startup there are links for the
Briefing, Case, and Glossary. The menu system is expandable and
collapsible. For instance, click on the button to the left of Startup, and
the Briefing, Case and Glossary will collapse back into Startup.
The navigation and general control buttons found at the top of the simulation screen are: Back, Home,
Spreadsheet, Print, Help, and Logout. The Print button applies to the report currently on the screen. For
instance, if you click on the Print button when viewing the Balance Sheet, the report will be sent to your
default printer. Clicking on the Spreadsheet button will allow you to download data to a spreadsheet.
Clicking on the Help button will open the operations guide. The Back button lets you reach the last page
you visited and the Home button brings you to the homepage of the simulation.
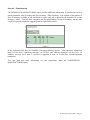
The area in the upper right-hand corner of the simulation screen
displays the current period along with firm, industry, and user
names.
StratSim User's Manual—Page 28
Pull-down Menu
The main pull-down menu bar across the top of the screen consists of menus more focused on logistics
than content. For instance, FILE – PRINTER SETUP allows you to select a default printer. The FILE –
PRINT REPORTS option allows you to select an assortment of reports to print simultaneously. You
also have the option to output reports to a spreadsheet. Enter the report period in the "Report Period"
box. Click on a report link to display a brief description of the report. EDIT – COPY will copy the
currently displayed report to the clipboard that may then be pasted into a spreadsheet or word processing
program. SIMULATION – allows you quickly logout. OPTIONS – REFRESH DATA allows you to
refresh your screen; LOCK DECISIONS allows the team leader to lock all decisions from this location.
HELP – HELP GUIDE displays the operations guide from the student manual. (You will probably find
the context sensitive Help on the right-hand side of the screen easiest to use.)
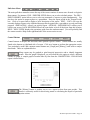
Control Buttons
Control buttons on Report and Decisions forms perform specific actions. Control buttons are usually
found at the bottom or right-hand side of screens. Click on a button to perform the appropriate action.
Two particularly useful and common control buttons are [Graph] and [History], both used to analyze
data trends. These are explained below.
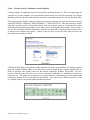
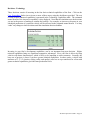
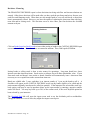
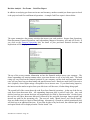
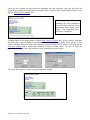
Many reports may be graphed to gain historical perspective and to identify important
trends. After the graph is displayed, you will often have the option to select a different
variable to graph. A sample graph of market share by firm from the COMPETITION - FINANCIALS
report is shown below.
The [History] button is another way to see a report on data from past periods. This
feature is extremely useful for discovering trends or calculating the impact of particular
decisions or competitor actions.
StratSim Operations Guide—Page 29
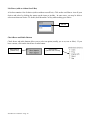
List Boxes (with or without Scroll Bar)
A list box contains a list of choices (with or without a scroll bar). Click on the scroll bar to view all your
choices and select by clicking the mouse on the items to include. In some cases, you may be able to
select more than one choice. To do this, hold down the Ctrl key while making your choice.
List box
Check Boxes and Radio Buttons
Check boxes and radio buttons allow you to select an option (usually yes or no, true or false). If you
have a mouse, click on the check box or radio button.
Radio buttons
(choose one)
StratSim User's Manual—Page 30
Check boxes
(Choose one or more)
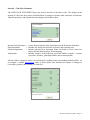
Navigation System
The SIMULATION MENU is a user-friendly menu structure for navigating key areas of StratSim. The
simulation menu contains main headings and when clicked into, a sub-menu appears listing options from
which you may select. To select one of the options in the sub-menu, place the mouse arrow on the
option and click.
The on-screen menu system is organized much like a situation analysis to provide some structure to your
review and planning. Review the reports first, and then begin making decisions. To collapse the options
back into the main menu, just click on the main heading name at the top of the sub-menu list.
Startup
• STARTUP provides access to the on-line documentation and help
files. The industry briefing and case are a good place to start if you
haven’t yet read the manual. A handy Glossary is available here as
well.
Internal
• INTERNAL contains reports applicable to your firm and includes
financial statements, cash flow, and product contribution data.
Market
• MARKET provides information about general economic
conditions and customers. This information is available to all
participants and most information is free of charge
Competition
• COMPETITION reports contain detailed information about your
competitors — products, market share, technology, marketing
communications, distribution, production, and financials. These
reports are available to all participants and are free of charge.
Tools
• TOOLS contains several market research studies that will help you
sort through customer preferences and needs. All of these studies
cost money, however, so you will have to decide how much to
spend to get this information.
International (Optional) • INTERNATIONAL provides information about options for
sourcing and selling in the international regions. This information
is available to all participants and is free of charge.
Decisions
• DECISIONS is where your firm will enter choices for investments
in technology, concept creation, product development, consumer
and B2B marketing, production, distribution, and financial
resources. Once all decisions are made, use the Pro-Forma to
project your firm’s performance. Then modify your decisions as
necessary. The decision summary displays all of your current
decisions that can be used to confirm your choices.
Decision Analysis
• ANALYSIS contains Decision Alerts that displays timely
messages to your firm and the Pro-Forma analysis tool you can use
to help you project your inventory, contribution, income and
balance sheet items for the coming year.
StratSim Operations Guide—Page 31
Selecting any of the main menu choices opens up a more detailed sub-menu for access to the
individual reports. Examples of these detailed menus are provided on the following pages along
with sample reports.
Please note that the values in the reports do not always correspond to the starting situation in the
software. They are for demonstration purposes only.
Detail of Menu Options
Each menu option from STARTUP through ANALYSIS is described on the following pages along with
a sample screen display for most. The order of the descriptions corresponds to the order of the main
menu and secondary menu options within each main menu heading.
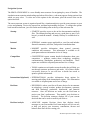
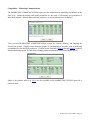
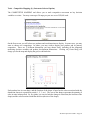
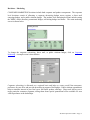
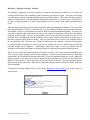
Startup Menu
The STARTUP menu contains helpful overview and navigational information (Briefing, StratSim Case,
and Glossary) to review at the beginning of the simulation. Click on one of the menu options on the
right to activate that option. For example, click on Briefing to pull up the StratSim briefing, which
offers a quick introduction to your company’s situation. Analyzing the industry and the case will help
prepare your team for the internal and external environmental factors in the simulation.
StratSim User's Manual—Page 32
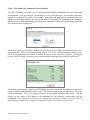
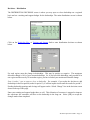
Internal Analysis
The INTERNAL menu contains reports applicable only to your firm and includes the performance
summary, income statement, balance sheet, cash flow statement, and product contribution. Additional
reports applicable to your firm, such as marketing, distribution and manufacturing can also be accessed
here. In general, internal analysis should start with comparing actual performance with planned
performance. Did the results meet expectations? If not, begin searching for the reasons. The outcome
of this analysis may signal a need for a change in strategy.
Second, monitor the status of the firm’s resources. Is there enough cash to fuel the strategy? If not,
consider alternative sources of additional funds. Recognizing this need early in StratSim is a benefit, as
short-term borrowing is generally more expensive than long-term debt or stock offerings.
Part of the simulation experience should be setting objectives that will measure whether your firm is
achieving its strategy. These may be goals of profitability levels, market share, stock price, growth, etc.
Use these objectives as markers to compare your actual path to your planned path. If you find you are
not meeting these objectives, you must realistically face why this is happening and adjust as necessary.
Use these objectives as markers to compare your actual path to your planned path. If you find you are
not meeting these objectives, you must realistically face why this is happening and adjust as necessary.
StratSim Operations Guide—Page 33
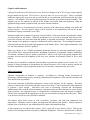
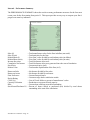
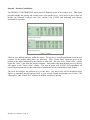
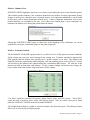
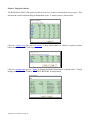
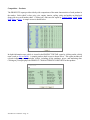
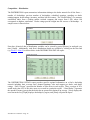
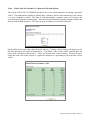
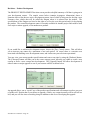
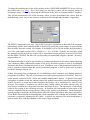
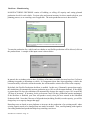
Internal – Performance Summary
The PERFORMANCE SUMMARY shows the results on many performance measures for the four most
recent years for the firm starting from period 1. This report provides an easy way to compare your firm’s
progress on some key indicators.
Sales ($)
Sales (Units)
Market Share ($)
Market Share (units)
Income after taxes
Cumulative Net Income
Stock Price
Market Value
•
•
•
•
•
•
•
•
Total manufacturer sales for the firm in dollars (not retail)
Total unit sales for the firm
Your firm’s sales divided by total industry sales (in dollars)
Your firm’s sales divided by total industry sales (in units)
Total Net Income after taxes
Total Net Income after taxes generated since the start of simulation
Current stock price (in $)
Total market capitalization of the firm (in $)
Return on Sales
Return on Assets
Firm Preference
Dealer Rating
COGS (%)
Capacity Utilization
Debt
Stock Issued/Purchased %
•
•
•
•
•
•
•
•
Net Income divided by firm sales
Net Income divided by total assets
Current firm preference
Current average dealer satisfaction results
Cost of Goods Sold as a percent of manufacturer’s sales
Production as a percent of total capacity
Current short- and long-term debt outstanding
Percent of shares issued or purchased (net) divided by total shares
outstanding at the start of the simulation.
StratSim User's Manual—Page 34
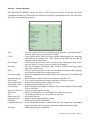
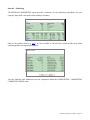
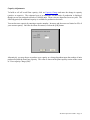
Internal – Income Statement
The INCOME STATEMENT shows the firm’s overall results for the most recent year with major
expenditures broken out. Each item is also displayed as a percent of manufacturer sales (not retail sales)
for year-to-year comparative purposes.
Sales
COGS
Gross Margin
Marketing
R&D
General & Admin
Manufacturing OH
Depreciation
Inc from Operations
Extraordinary Items
Licensing Fees
Interest Inc/Expense
Net Income
Tax
Income After Tax
(Region) Income
Dividends
Consolidated Income
Dividends
• Sales are recognized at the time of purchase by the customer. The dollar amount is
based on dealer invoice, not retail price or MSRP.
• Cost of goods sold (COGS) is the total variable manufacturing costs (materials
and labor) for the product sold. This is based on the R&D unit cost and the
cumulative production volume.
• The difference between sales and cost of goods sold. Shareholders often analyze
the gross margin % year to year as one measure of profitability.
• The sum of corporate advertising, public relations, product advertising, product
promotion, and sales force.
• Research and Development are the costs associated with product and technology
development including process improvement costs.
• General and Administration include non-direct costs otherwise not included on this
statement.
• Manufacturing overhead includes fixed production and plant costs.
• The cost associated with depreciating investments in factories over time.
• Results from deducting expenses from gross margin.
• Includes plant and inventory write-offs.
• If the licensing or B2B option is enabled, this line item displays total licensing
fees for your firm.
• Interest on long and short-term debt.
• Income from Operations less extraordinary items and interest expense.
• Taxes charged at the rate for your industry environment.
• Net Income less taxes.
• Detailed income statement for the region.
• The dividends paid to stockholders.
• If the International module is enabled, this line item displays the consolidated
total income after tax of your firm's operations, both domestic and foreign.
• The dividends paid to stockholders.
StratSim Operations Guide—Page 35
Internal – Balance Sheet
The BALANCE SHEET shows the current account balances for assets and liabilities at the most recent
year-end. A sample screen is shown below.
Asset Categories:
Cash
Receivables
Inventory
Plant and Equip.
Depreciation
• In StratSim, cash represents the funds currently available to you for investment.
The current balance in cash equals last year’s cash balance plus income from
operations, less plant investments, plus any adjustments from financial
operations, and any changes in receivables and payables.
• Invoices still not paid by dealerships.
• Current value of finished inventory.
• Original value of the plant and equipment used in production of the vehicles.
This includes retooling investments.
• Plant, equipment, and retooling costs are spread over 10 years using straight-line
depreciation. This is the accumulated depreciation on the assets.
Liability and Equity Categories:
Accts Payable
Short-Term Debt
• Amount currently owed to vendors.
• Outstanding short-term lines of credit used to fund on-going operations.
Normally these loans result from underestimating cash needs in the current year.
Long-Term Debt • Face value of long-term bonds that were issued.
Stock
• Original value of any stock issued.
Retained Earnings • Accumulated net income from previous years.
Please refer to DECISIONS – FINANCING in this section of the manual for more information on debt
and stocks.
StratSim User's Manual—Page 36
Internal – Cash Flow Statement
The CASH FLOW STATEMENT shows the sources and uses of the firm’s cash. The changes in the
amount of cash in the firm can be calculated based on changes in income from operations, investments,
financial operations, and adjustments from changes in the balance sheet.
Income from Operations • Comes from the Income from Operations item on the Income Statement.
Plant Investment
• Includes any outlays for increases in capacity and retooling costs.
Financial Operations
• Include proceeds from short-term loans and bonds or stock issues less
interest and dividends paid (see following page).
Adjustments
• Includes changes in the following asset and liability accounts: accounts
receivable, inventory, plant depreciation, and accounts payable.
All four of these categories can be viewed in detail by clicking on the corresponding underlined link. As
an example, a sample Adjustments report is shown below that illustrates the impact of changes in
receivables, payables, and inventory on cash flow.
StratSim Operations Guide—Page 37
Internal – Product Contribution
The PRODUCT CONTRIBUTION report provides financial results at the product level. This report
provides insights into pricing and costing issues at the product level. Note, however, that it does not
include any allocated overhead costs, only variable costs (COGS) and marketing costs directly
attributable to a product.
There are two different analyses within this report. The top box is overall contribution based on total
revenues for the product rather than a per unit basis. Thus, “Dealer Sales” equals the price of the
product to the dealer multiplied by the number of units sold. The sum of the “Dealer Sales” column
equals the “Sales” value from the income statement. Sales made other than through your own dealers
will appear in the "Direct Sales" column. The cost of goods sold (COGS) and expenditures on
advertising and promotion are then subtracted to calculate the overall contribution of each product.
The lower box analyzes the products on a per unit basis. Any direct sales will be included in these
figures, so remember that this analysis looks at your average revenue and margin over all sales. The
“Margin Pct.” and “Contrib. Pct.” columns are helpful measures for pricing.
StratSim User's Manual—Page 38
Internal – Marketing
The INTERNAL MARKETING report provides a summary of your marketing expenditures for your
company along with value market share and days inventory.
Links to the product detail (e.g. Alec) are also available as shown below which provide more detail
regarding product pricing and performance.
You may find this same information on your competitors under the COMPETITION – MARKETING
COMMUNICATIONS menu.
StratSim Operations Guide—Page 39
Internal – Distribution
The INTERNAL DISTRIBUTION report summarizes information relating to your dealer network,
including the coverage ratio, planned openings, sales and support per dealer, and dealer ratings. Full
coverage represents the number of sales areas in each region. Thus, coverage of 45% would imply that
45% of the sales areas are covered in a particular region.
Gross/Dealer represents the amount of money (gross) that the average dealer in a region has to operate
their business. This equals the difference between the dealer invoice (what the dealer pays for the
vehicle) and the actual retail price for all vehicles sold in their dealership. These are, in effect, the
revenues for the dealership. The more revenues for the dealership, the better salespeople and support
staff they can hire, the more they can reinvest in their facilities, etc. Thus, this gross/dealer is a good
indicator of their success as a business, which, along with training and support, will likely translate into
higher dealer ratings.
The dealer rating is a customer satisfaction index from a leading market research company and ranges
from 1-100, with 100 corresponding to highest satisfaction. Dealer ratings provide insight into the
success of dealerships. The success and coverage of your dealerships is an important aspect of your
overall firm’s success. Your firm should think of your dealership network as a key strategic partner who
shares in your success. Generally, the more successful your dealerships are, the more successful you will
be, and vice versa.
You may find this same information on your competitors under the COMPETITION – DISTRIBUTION
menu.
StratSim User's Manual—Page 40
Internal – Manufacturing
The INTERNAL MANUFACTURING report provides additional information by product line such as
actual production, sales, inventory and days inventory. “Days inventory” is an estimate of the number of
days of inventory available at year-end based on yearly sales and is derived by the formula (365 x units
inventory / sales). Generally auto companies aim for approximately 30 days of inventory, but this may
vary based upon development / upgrade plans for a particular vehicle.
In the comments field, there are a number of messages that may appear: "some shortages" means less
than 10% lost sales, "significant shortages" are 10-30%, and "extreme shortages" are over 30%. In
addition, you may see a note if a product is upgraded or new, or if sales have exceeded planned
production.
You may find this same information on your competitors under the COMPETITION –
MANUFACTURING menu.
StratSim Operations Guide—Page 41
Market Analysis
The MARKET menu options provide information about general economic conditions and customers.
The report includes several tools that will help you sort through consumer preferences and needs. This
information is available to all participants. The market analysis menu structure is shown below.
The overall goals in market analysis are to:
• Identify the various market segments, their needs, and their attractiveness.
• Decide the segments your firm should serve based on attractiveness and your firm’s positioning
and resources.
• Determine the key success factors for gaining market share in your target segments.
• Identify the actions necessary for your firm to take in order to achieve your objectives.
StratSim User's Manual—Page 42
Market – Industry News
INDUSTRY NEWS highlights significant events that occurred during the most recent simulated period.
This includes product launches, new customers identified in the market, licensing agreements, drastic
changes in stock prices, and other news of general interest. Less important information is not included
in the report, such as minor fluctuations in stock prices. Links to important information, such as new
product attributes, are embedded in the text. New vehicle class launch plans of your competitors are
announced in industry news during the period before the launch.
Though the INDUSTRY NEWS report is rather brief at the beginning of the simulation, you can be
assured this screen gets considerably longer as the game progresses!
Market – Economic Outlook
The ECONOMIC OUTLOOK report provides a very brief overview of the general economic conditions
for the current year, past year, and a forecast for the coming year. Economic strength (as measured by
GDP growth) and low interest rates typically have a positive impact on car sales. The inflation rate
should be taken into consideration when analyzing costs and adjusting prices as the COGS of a vehicle
will increase by the inflation rate without taking into consideration other factors. The cash rate is the
interest rate paid on short-term cash balances. As the economy changes and interest rates change, the
rates on short-term loans and new long-term loans will also change.
“Car Sales” equals the total sales of economy, family, luxury, sports, and AEV classes. “Truck Sales”
equals the sales of minivan, truck, utility, and delivery classes. Sales by vehicle class can be found
under the VEHICLE CLASSES menu choice under MARKET.
The [Graph] button displays a graph of selected economic data from this report. The [History] button
allows you to view the report for past periods.
StratSim Operations Guide—Page 43
Market – Vehicle Classes
The VEHICLE CLASSES report displays industry sales information broken down by vehicle class.
Sales at the manufacturer and retail level are provided in dollars. Units sold and sales growth for the
past year are also displayed. Basic competitive information such as the number of vehicles within a
class and the sales leader are provided. Click on the [Graph] button for a graph of unit sales by class.
The link to a vehicle class (such as Economy) provides detailed information on marketing issues within
that class including share of class, overall share for the vehicle, MSRP, advertising budget and theme,
and promotional budget. A sample screen for the CLASS DETAIL is shown below.
[Graph] provides a graph of market share by vehicle class over time.
[History] allows you to view the report from past periods.
[Map] creates a positioning map of size and price for the vehicle class and shows the expected price and
size ranges for that class as described on the following page.
[Print] will print this report.
[Next] takes you to the next vehicle class listed on the VEHICLE CLASSES report.
[Trend] displays the PRODUCT CHARACTERISTICS HISTORY for that product
[Current] displays current product detail.
StratSim User's Manual—Page 44
Market – Vehicle Classes – Choose Class – [MAP]
The POSITIONING MAP provides a visual representation of expected size and price ranges for a
particular class, as well as how vehicles in that class are positioned on these two dimensions.
In the above example, the box denotes the expected price and size ranges for the economy class. The
two economy class vehicles, Alec and Delite, are marked A and D and are listed in the legend in the
order of sales. Thus, the sales leader for this class is Alec. Based on this plot, one can say that Alec is
larger and higher priced than the Delite, that the expected price of an economy vehicle appears to be
under $20,000, and that the expected size of an economy vehicle is less than 30.
[Detail] will return you to the CLASS DETAIL report.
[Next] will take you to the next positioning map for vehicle class listed on the VEHICLE CLASSES
report.
[Print] will print this report.
Note: Positioning maps can also be viewed at the customer level which provides more specific
information for that customer rather than for the class overall.
StratSim Operations Guide—Page 45
Market – Regional Analysis
The REGIONAL ANALYSIS report provides an overview of sales in units broken out by region. This
information is useful when deciding on distribution issues. A sample screen is shown below.
Click on a vehicle class link, such as Economy to show market shares of vehicles by region as shown
below in the REGION DETAIL report.
Click on a product name link (i.e., Delite) to display the Product Detail report as shown below. [Trend]
displays the PRODUCT CHARACTERISTICS HISTORY for that product.
StratSim User's Manual—Page 46
Market – Consumer Segments
The CONSUMER SEGMENTS report provides the overall units sold to each consumer segment, the
percent change in sales during the most recent period, and the percent of each segment captured by each
firm. In StratSim, there are five consumer segments labeled 1-5, and three business-to-business or fleet
segments, labeled 6-8. Within each segment, there are multiple customers with somewhat different
needs. More information on these customers is available in the CONSUMER CUSTOMERS report that
is also described on the following page.
There are also links to descriptions of each segment (Value Seekers through Enterprisers). Please refer
to segment descriptions for more information on each segment, but a sample screen is shown below.
StratSim Operations Guide—Page 47
Market – Consumer Customers
The CONSUMER CUSTOMERS report summarizes customer detail information, displaying the overall
sales to each customer, the percent change in sales during the most recent period, the forecast for next
year and the leading product (unit basis). The information in this report helps you gauge the relative
demand by each customer segment so that you can make a more informed decision about who to target.
You can choose a customer link (1E through 5U) to display customer detail information, described on
the following page. This detail costs $25K per customer, but provides important market information
about customer needs and product preferences. It will be up to your team to decide which studies are
worth purchasing. Once a study has been purchased (the $ will be deleted to indicate that it has been
purchased), it can be viewed again anytime that period at no charge. Alternatively, some of this
information can be gathered using the marketing research tools, as in CONJOINT ANALYSIS.
StratSim User's Manual—Page 48
Market – Consumer Customers ($) – Customer (pick one)
The CUSTOMER DETAIL report contains all of the information relevant to a particular customer’s
purchase decisions in one report and costs $25K per customer. In addition to the customer units
purchased, growth rate, and expected size, price, and engine ranges, this report also provides customer
hot buttons and price sensitivity. Below the customer description is a grid of the leading competitors for
that particular customer. This grid contains all vehicles in the primary or secondary class or vehicles
with greater than 5% of market share.
Taking a closer look at the CUSTOMER DETAIL report above provides some valuable information. As
you may recall from the case description, a 1E customer is a value seeker with a desired class of
economy cars. Units purchased are the number of vehicles purchased by the customer. The size, price
and engine ranges provide some guidance as to what the customer expects on those dimensions. The hot
buttons and price sensitivity help you understand more about what the customer looks for in a car and
how much they are willing to pay.
[Region] allows you to display the information by selected region.
[Map] creates a positioning map of size and price for the customer and shows the customer preferred
area or “consideration set” and the location of the vehicles competing in that space. This is similar to the
positioning map already discussed for the VEHICLE CLASSES report, but now focused on a particular
customer rather than a vehicle class.
[Price/Sales] will display the relationship between price and the number of units sold for vehicles
competing for this customer.
[Awareness/Sales] will display the relationship between units sold and advertising awareness for
the vehicles preferred by the selected customer.
[Print] will print this report.
Be careful not to use any one of these relationship maps as the single predictor of sales. All must be
considered, along with other factors such as the various vehicle characteristics (interior, styling, safety,
and quality), distribution, and others, to fully understand the sales results. However, the maps can be
quite helpful in visualizing some of the key variables that impact market share by segment.
StratSim Operations Guide—Page 49
Market – New Customers
The NEW CUSTOMERS report provides some initial data on 3 potential emerging customers, as shown
below. In the example below, the High Income segment that would like to purchase a minivan (4M) is
estimated to be the largest potential new customer in terms of units sold. The expected price range,
vehicle size range, and most important attribute are also listed.
New customers may be looking for a new vehicle class, such as an AEV, or a significantly different
configuration of an existing vehicle class. If a firm introduces such a vehicle that “excites” these
customers, the new customer may “pop”, creating new demand in the marketplace. As a rule in
StratSim, at most, only one new customer can “pop” or emerge each period. Additional new customer
opportunities may be identified as the simulation progresses.
It is important to understand that there are no guarantees with introducing products into new
markets and StratSim reflects this risk.
In order for one of these emerging customers to generate significant sales, the vehicle must be designed
to meet the needs for that customer. If there’s not enough differentiation in the offering or support of the
new vehicle, it will not create the necessary “buzz” in the marketplace. It is the combination of the
unmet needs and the successful development and marketing of a vehicle that makes a customer emerge
as a viable market.
The links to segments and vehicle class will provide a detailed description.
StratSim User's Manual—Page 50
Competitive Analysis
COMPETITION reports contain detailed information about your competitors — products, market share,
technology, marketing communications, distribution, production, and financials. These reports are
available to all participants. The screen below shows the reports available under the COMPETITION
menu.
The overall goals of competitive analysis are:
• Identify the firms that are competing for your target markets/segments.
• Analyze their strengths and weaknesses.
• Attempt to determine the competitor’s strategy and what potential moves may be the result of that
strategy.
• Determine the best approach for your firm to use to defend against the competitor’s strategy while
remaining consistent with your own strategy.
StratSim Operations Guide—Page 51
Competition – Products
The PRODUCTS report provides side-by-side comparisons of the main characteristics of each product in
the market. Each vehicle’s class, price, size, engine, interior, styling, safety and quality are displayed
along with its overall market share. Clicking on a link sorts the report by Vehicle Name, Class, Units
Sold, Price, or Size. A sample screen is shown below.
In-depth information on a vehicle is viewed in the PRODUCT DETAIL report by clicking on the vehicle
name (such as Alec or Boffo). A sample product detail screen is shown below. This report includes all
relevant information on a particular vehicle, including all the attributes, prices, and marketing data.
Clicking on [Trend] displays the PRODUCT CHARACTERISTICS HISTORY for that product.
StratSim User's Manual—Page 52
Competition – Market Share
The MARKET SHARE report displays firm market share by vehicle class. Units sold and sales growth
for the past year are also displayed by class. A blank spot in the grid indicates that a firm does not
currently offer a vehicle in that class. Click on [Graph] to display a graph of unit sales by class. The
[History] button allows you to view past period reports.
The link to a vehicle class (such as Economy) provides detailed information on marketing issues within
that class including share of class, overall share for the vehicle, MSRP, advertising budget and theme,
and promotional budget. A sample screen for the Economy class MARKET SHARE DETAIL is below.
[Graph] provides a graph of market share by vehicle over time for that class.
[Map] creates a positioning map of size and price for the vehicle class and shows the expected price and
size ranges for that class.
[Print] will print this report.
[Next] will take you to the next vehicle class listed on the VEHICLE CLASSES report.
Clicking on the vehicle name link will provide more detailed information about the vehicle.
StratSim Operations Guide—Page 53
Competition – Technology
The TECHNOLOGY CAPABILITIES report summarizes the current technological capabilities of each
company. These values represent the maximum level the firm can achieve in the current period using
platform development on interior, styling, safety, and quality. The maximum feasible limit for each of
these characteristics is also shown. The maximum limit may change over time if new breakthroughs are
discovered in the particular technology and represents the highest value any firm can achieve through
investments in technology capabilities.
Clicking on the links to one of the firms (Firm A through Firm E in the sample screen below) displays
historical information about a firm’s investments in technology capability and may give insight as to
possible future generations of vehicles from that firm.
In the example above, the most appealing product Firm A can create is one with interior of 4, styling of
5, safety of 4, and quality of 5 out of a maximum of 9, 11, 8, and 10, respectively. All customers find
higher values in these areas more appealing than lower values. Should a firm consider the investment
worthwhile, increases in ratings can be achieved through investments in technology capabilities.
Definitions:
•
•
•
•
Interior:
Styling:
Safety:
Quality:
Flexibility of the cargo space
General curb appeal, styling, handling, finish
Structural design, braking systems, safety features
Overall reliability, durability, consistency of product
StratSim User's Manual—Page 54
Competition – Marketing Communications
The MARKETING COMMUNICATIONS report provides information on marketing expenditures at the
firm level. Brand advertising and brand promotion are the total of advertising and promotion of
individual products. Market shares and firm preference are also displayed to aid in analysis.
View previous MARKETING COMMUNICATION reports by clicking [History] and entering the
desired time period. [Graph] creates historical graphs of communications variables such as marketing
expenditures by firm and firm preference. Clicking on the firm links (Firm A through Firm E) produces
detailed marketing reports for each firm including product marketing mix decisions (shown below).
Links to the product detail (e.g. Alec) are also available in the MARKETING DETAIL report for a
particular firm.
StratSim Operations Guide—Page 55
Competition – Distribution
The DISTRIBUTION report summarizes information relating to the dealer network for all the firms —
number of dealerships, previous number of dealerships, scheduled openings, spending on dealer
training/support, dealer ratings, inventory, and days left in inventory. The “Dealer Rating” is a customer
satisfaction index from a leading market research company and ranges from 1-100, where 100
corresponds to highest satisfaction. Dealer ratings provide insight into the success of dealerships. A
sample screen is shown below.
From here, historical data of distribution variables can be viewed by period [History] or analyzed over
time [Graph]. Additionally, each firm’s distribution details are available by clicking on the firm link
(e.g. Firm A – Firm E) as shown below in the DISTRIBUTION DETAIL report.
The DISTRIBUTION DETAIL report provides specific regional information on a firm’s dealership
network including their coverage ratio, planned openings, sales and support per dealer, and dealer
ratings. “Full Coverage” represents the number of sales areas in each region. Thus, coverage of 45%
would imply that 45% of the sales areas are covered in a particular region. “Gross/Dealer” represents
the amount of money (gross) that the dealer has to operate their business on average. [Next] displays the
next firm in the list, [Graph] displays dealerships by region, and [Print] will print the report.
StratSim User's Manual—Page 56
Competition – Manufacturing
The MANUFACTURING report displays production capacity, actual production, capacity utilization,
sales, and inventory (in 000s and days) for each firm. A comment is also displayed to show how
production compares with demand. From here, historical data of manufacturing variables can be viewed
by period [History] or analyzed over time [Graph].
The MANUFACTURING DETAIL report is viewed by clicking on the firm name (Firm A through Firm
E). It provides additional information by product line such as actual production, sales, inventory and
days inventory. “Days Inventory” is an estimate of the number of days of inventory available at year-end
based on yearly sales and is derived by the formula (365 x units inventory / sales). A sample
MANUFACTURING DETAIL screen is shown below.
In the comment field, there are a number of messages that may appear: "some shortages" means less
than 10% lost sales, "significant shortages" are 10-30%, and "extreme shortages" are over 30%. In
addition, you may see a note if a product is upgraded or new, or if sales have exceeded planned
production.
StratSim Operations Guide—Page 57
Competition – Financial Summary
The FINANCIAL SUMMARY report provides some key performance data for all the competitors —
market share, firm preference, sales, COGS, income, stock price, and debt level. A sample screen is
shown below.
Val Mkt Share
Unit Share
Preference
Sales ($)
COGS ($)
Marketing
R&D
G&A
Manufacturing
Other ($)
Income ($)
Stock Price ($)
Mkt Value ($)
Total Debt ($)
• Firm sales divided by total industry sales at the manufacturer’s level (not retail).
• A firm's vehicle sales in units divided by industry unit sales.
• Firm preference is a measure of customers surveyed who show a decided
preference for a particular firm. This is based on overall vehicle offerings,
dealership reputation, and firm awareness.
• Sales are recognized at the time of purchase by the end customer. The dollar
amount is based on dealer price, not retail price or MSRP.
• Cost of goods sold (COGS) is the total variable manufacturing cost for the
product sold. This is based on the R&D unit cost and the cumulative production.
• The sum of corporate advertising, public relations, product advertising, product
promotion, and sales force.
• Research and Development are the costs associated with product and technology
development including process improvement costs.
• General and Administration include non-direct costs otherwise not included on this
statement.
• Plant overhead includes fixed production, fixed plant costs and depreciation.
• Licensing fees, interest expense, plant and inventory write-offs, and income taxes.
• Income after taxes.
• Current per share market value of the firm.
• Stock price times the number of shares outstanding. Each firm has a different
number of shares outstanding and can issue new shares, so this is a better
indicator of the relative value of the company than stock price alone.
• Combined long and short-term debt.
[GRAPH] displays historical graphs on key performance data for all firms.
StratSim User's Manual—Page 58
Tools
Data points are everywhere. Information is what comes out of well-organized data. Knowledge is having
the right information for the issue at hand. If used properly, the tools in StratSim can help turn data into
knowledge. Of course, powerful tools don't come cheap, but then, that cost must be weighed against the
value of having the right information at the right time.
There are a number of tools to help you convert data into knowledge and to improve your ability to make
good decisions. These are organized under the Tools reports. Some tools will help you with product
design, others will help you with resource allocation, and others may offer competitive insights not
available from public secondary sources.
The exact tools that will be available to your team will depend on the configuration of your game. New
tools may also be introduced as the game is advanced, so be aware of possible additions to this menu.
Many of these tools will cost money to use, just as ordering and designing market research studies would
in the real world. So you should spend some time knowing when and where these tools will be of the
most value to you.
Important! Since everyone on your team is sharing the same decision file, when there are a limited
number of studies that can be run, this total is for your ENTIRE team, not just you as an individual. So
be sure to coordinate purchase of research studies. Once someone on your team purchases a study or
tool, your entire team will have access to the results of that research.
StratSim Operations Guide—Page 59
Tools – Focus Groups ($) (Instructor Selected Option)
One method of finding out more about how a particular customer segment thinks about a product,
service or company is by arranging for a focus group discussion. A focus group is typically a gathering
of six to ten people in a moderated session with the purpose of discovering how participants feel about
particular product/service attributes, how they make purchase decisions, or anything else that may be
relevant to the company who has paid for the session.
In StratSim, FOCUS GROUP data is organized on a customer basis (e.g. 1E, 1T, etc.). When you first
choose to view the report, you will see a list of all current customers ordered by class. A sample of this
screen is shown below. To view a focus group for a particular customer, just click the customer link.
You will be charged $50,000 for each customer chosen, which represents a market research company
facilitating multiple focus group discussions throughout all regions of the StratSim world.
The detailed view of the FOCUS GROUP study shows the unit share, actual vehicle characteristics, and
customer opinions for the top selling vehicles purchased by the particular customer during the most
recent period. Their responses provide descriptive measurements about the attractiveness of various
vehicles to aid in R&D and competitive analysis. The columns marked “hot” indicate the most
important attributes for that customer. Below is a sample focus group study.
StratSim User's Manual—Page 60
Tools – Vehicle Sales by Customer ($) (Instructor Selected Option)
The Vehicle SALES BY CUSTOMER tool allows you to see which customers are buying a particular
vehicle. This information is helpful to identify those customers who are most interested in your vehicle
or in your competitor’s vehicle. This data is collected through a consumer survey of car buyers and
cross-referenced with the customer group. This report only has information on the consumer market and
does not include B2B customers. You may run up to 10 studies at a cost of $25,000 each.
On the initial screen, select the vehicle from the list box. Clicking on [Run Study] will charge you for
the data and display the report as shown below. "Unit Share" refers to that vehicle’s market share (in
units) of the consumer customer listed. "Units" are the unit sales to that customer. "Percent of Sales"
equals the sales sold of that vehicle to a particular customer as a percentage of the total sales of that
vehicle.
StratSim Operations Guide—Page 61
Tools – Concept Tests ($) (Instructor Selected Option)
Concept testing is an important step in the new product development process. This is an opportunity for
your firm to get early feedback on your potential product before the costly development cycle begins.
Spending some time up front with customers can save a tremendous amount of resources down the road.
Each study run costs $100K. However, before you may test a concept, you must first develop a concept
under DECISIONS – PRODUCT DEVELOPMENT – CONCEPT TESTS. Once the concept is created,
your firm can then test the concept [Run Study] with one customer group at a particular price point.
Each price point and customer group is a new study even if run using the same concept. After a study is
run, it will be available until the simulation is advanced as a link under “Previously Run Concept Tests”
as shown in the sample screen below. However, the first time you use the tool, there won’t be any
previously run concept tests listed.
Clicking on [Run Study] will generate a table similar to the focus group feedback on existing products.
However, instead of market share, it will show the percent of people in this customer segment who are
likely to purchase your product based on the current competitive products and pricing. Do note,
however, that this does not take into account competitive differences in distribution, advertising,
preference, etc. The study only measures your concept vehicle at a particular price point against other
competitive product choices in an unbiased environment. Thus, only use the “likely to purchase” result
as a starting point in your product launch production forecast.
StratSim User's Manual—Page 62
Tools – Competitive Mapping ($) (Instructor Selected Option)
The COMPETITIVE MAPPING tool allows you to track competitive movement on key decision
variables over time. You may create up to 20 maps per year at a cost of $25,000 each.
On the first screen, you will select two products and two dimensions to display. In some cases, you may
want to choose two competitors. In others, you may wish to display your product and its primary
competitor. There are 13 different dimensions you may choose from, including all the important
marketing decision variables and product development dimensions. Clicking on [Create Map] will
charge you for the map and display the grid, as shown below.
Each product has its own shape, and the location of the shape is based on the value associated with the
dimension chosen in a particular period (1, 2, 3, etc.). The area of the shapes represents the quantity of
sales in units in that period. So, at a glance you can see both the change in a decision (the location of the
shape) and the sales associated with that decision (the size of the shape).
StratSim Operations Guide—Page 63
Tools – Test Market ($) (Instructor Selected Option)
The TEST MARKET tool allows you to experiment with different combinations of price, advertising
and promotion. You may run up to 5 test markets at a cost of $100,000 each. A test market condition is
created in a particular city where levels of price, advertising and promotion are adjusted from your
national levels and the change in the sales in that market is measured. By extrapolating this change to
national levels, a marketing manager can make better judgments on how much to adjust the marketing
mix variables for the coming year.
On the first screen, you will select a product and enter the price, advertising, and promotion levels (as if
done nationally). There is a maximum change in price of +/- 10%. Advertising and promotion can be
run at levels representing $50 million or double the current levels, whichever is greater. Clicking on
[Create Test] will charge you for the test, run the test market, and display the results as shown below.
The baseline represents the current levels of spending on price, advertising, and promotion, and shows
results in the test market based on those levels. (The baseline results in the test market may vary from
national conditions). The “Test” column will show the test market conditions and results. You can
quickly see the impact of the change in the marketing mix on awareness, market share, and net
contribution. Note that these results are only estimates based on the test market and don’t factor in
other changes in the market or competitive landscape that may occur in the decision period.
StratSim User's Manual—Page 64
Tools – Portfolio Analysis (Instructor Selected Option)
The PORTFOLIO ANALYSIS tool displays your current product portfolio in a 2 x 2 growth-share
matrix using the standard Boston Consulting Group (BCG) terminology of star, cash cow, dog, and
question mark. This tool is designed to provide your firm with an overview of your competitive position
in your target markets. Though some may use this information in a prescriptive sense to help allocate
resources, it may be more appropriately used in a descriptive way to see both relative importance of
products to your company (size of circle), relative strength in the marketplace (where the product is
placed horizontally), and relative attractiveness of the market / class where the product competes (where
the product is placed vertically). This analysis can be done either using vehicle class as the market
definition (free) or customer ($100K if instructor selected option is chosen).
Market Definition: The legend on the right side of the chart shows the Strategic Business Units (SBUs)
for a particular firm. In the StratSim environment, each SBU corresponds to a product. Markets are
defined as one of the product classes as shown in the MARKET SHARE menu choice under
COMPETITION. Choose the [Customer] button to change your market definition to customer.
Growth: The position of the SBU on the vertical axis is determined by the market growth of the product
class where the brand competes. Growth rates for each product class are found in the MARKET
SHARE report.
Relative Share: One measure of a product's strength in the marketplace is its relative market share.
Relative Share is calculated by dividing a product's market share by the market share of its largest
competitor. Share of each brand for a product class is found in the MARKET SHARE report by clicking
on a product class. For example, if a utility vehicle has 47% of the utility class and its largest competitor
has 19% of that same class, its relative market share is 47 / 19 = 2.47, placing it to the left of the vertical
line representing a relative share of 1. Thus, those products that are centered to the left of the vertical
line are market leaders; those to the right are market followers (based on this definition of market).
Choose the [Customer] button to change your market definition from vehicle class to customer. This
option will re-generate the analysis based on the market definition of which customer purchases the most
of the vehicle. Growth and relative share are also based on this more refined market definition as well.
StratSim Operations Guide—Page 65
Decisions
The DECISIONS screens are where you will enter technology investments, create concepts, develop
products, decide on your marketing expenditures for the consumer market, set production and build
capacity, maintain and grow your dealership network, and ensure you have sufficient resources to
accomplish your goals (and enter international decisions if that module is selected by your instructor).
Once all decisions are made, use DECISIONS ANALYSIS – PRO-FORMA to project your firm’s
financial performance.
Making decisions is the implementation of strategy. If the strategy is clear, the decisions should follow
fairly easily. It may take some time to work out the details, but with a strategy in place it is easier to
recognize those areas that need attention and priority.
Decisions should be the end result of your analysis. Use the following points to guide your decisionmaking process.
• Decide on, change, or revisit your strategy.
• Use the problems and opportunities that are within your strategic framework to guide where to
focus time and resources.
• Understand your financial resources and your competitors’ strategies.
• Identify the actions necessary for your firm to achieve your objectives.
• Check the Decision Alerts report to make sure you did not miss anything important.
• Use the pro-forma under Decision Analysis as a check on your assumptions.
All your decisions will be saved to the server, so you must be on-line to make decisions. Anyone else on
your team will be able to see your decisions after you have left a particular decision screen.
Important! Everyone on your team is sharing one decision file, so you will need to decide how best to
divide the decision responsibilities. Please note that as a safeguard against overwriting each other’s
decisions, no two people will be able to enter the same decision screen at the same time.
StratSim User's Manual—Page 66
Decisions –Technology
These decisions consist of investing in the four basic technical capabilities of the firm. Click on the
Curr. Expenditure link to invest in one or more of these areas, using the checkboxes provided. The cost
of each of these enhanced capabilities is presented in the Technology Capabilities table. The estimated
annual benefit of the increase in capability is also displayed. Note that the simulation uses the decisions
you are in the process of making to estimate the benefits. For example, an increase or decrease in your
scheduled production of a particular vehicle will be reflected in the estimated annual benefit. You may
“undo” any changes to these decisions until the simulation decision deadline.
Investing in your firm’s development capabilities can be an important long-term decision. Higher
technical capabilities bring two significant competitive advantages. First, your firm is able to develop
vehicles with better characteristics, which is likely to be important to some customers. Secondly, the
base cost of projects is lower if you have greater technical capabilities. In other words, a vehicle with
attributes of 2, 2, 2, 2 (interior, styling, safety, and quality) costs less on a per unit basis for a firm with
greater technical capabilities given the same production levels.
StratSim Operations Guide—Page 67
Decisions – Product Development
The PRODUCT DEVELOPMENT decision screen provides a helpful summary of all that is going on in
your development centers. The sample screen below (contains in-progress information) shows a
situation where a firm has two active development centers, one of which is being used to develop a new
Economy class vehicle that will be called the Enigma when it is released into the market. The
specifications of the Enigma are listed to the right as well as the cost (this period only) for developing
the product. The second development center is currently available for another project and could be used
for a major or minor upgrade, or for another new product.
If you would like to add more development centers, choose the [Dev. Center] button. This will allow
you to increase your centers by a maximum of one each period. Of course, there is a one-time cost
associated with building a new development center, and it takes one year to become operational.
You may view your current product specifications and costs at any time by using the [Products] button.
The [Concepts] button will take you to the create concept screen, allowing you either to create a new
concept or move a new concept into development. The [Upgrade] button will allow development of
either a minor or major upgrade to one of your current vehicles as shown below.
An upgrade allows you to “tweak” any of the product specifications and will attempt to reduce your cost
of goods sold. Do note that if you choose to upgrade a vehicle, any current inventory will be sold off at a
loss, and you will also incur a retooling charge in addition to the cost of developing the upgrade.
StratSim User's Manual—Page 68
Decisions – Product Development – New Concept
The first step in new product development is the creation of product concepts. A concept in StratSim is
a set of potential specifications for a vehicle to give to the R&D department for further study. Concept
creation is not used to upgrade or change an existing vehicle, only for new vehicles. Once a concept has
been created, you may want to run one or more concept tests on it before moving the concept into
development. Please see the CONCEPT TEST section of the operations guide for more details.
On the initial NEW CONCEPT screen, you will be asked to select a vehicle class. Then select the
[Create Concept] button to allow you to set the vehicle specifications as shown below.
Select [OK] to create the concept. Once created, you will get feedback from R&D regarding the
expected unit cost (at 100,000 units of production), the overall cost of the development project if you
decide to move it from concept to development, and the number of years required for development. This
screen is shown on the next page.
StratSim Operations Guide—Page 69
From this screen, you may choose to see what the market thinks about your concept using the [Test]
button. Please see the TOOLS – CONCEPT TEST description earlier in this guide for more details on
how to run and interpret concept tests.
Based on the results from the concept testing process, you may decide you should change the concept.
To do this, just select the [Modify] button that will take you back to the specifications input screen.
There is no additional expense to modify a concept at this stage. Therefore, get it right before moving
ahead to the product development stage.
Once you are satisfied with your concept and have decided it is worth the investment to put it into
development, choose the [Develop] button. Doing this will move the concept into development and
occupy one of your development centers for two or three years (depending on the length of the project).
When you move a concept into development, you will be asked to name the project. This will ultimately
become the name of your product in the market and is limited to 12 characters. The product name has
no impact on the sales of your product, although civility is appreciated in playing the game.
Important: You must choose the [Develop] button to move a product from the concept stage into the
development center; otherwise the product will never come to market.
You may choose to cancel development at any time if you change your mind about the viability of the
project. Remember that development centers are limited, and product development is a time consuming
and costly process, so choose wisely.
StratSim User's Manual—Page 70
Decisions – Marketing
CONSUMER MARKETING decisions include both corporate and product components. The corporate
level decisions consist of allocating a corporate advertising budget across regions, a direct mail
campaign budget, and a public relations budget. The product level marketing decisions include setting
the MSRP, dealer discount, promotional budget, advertising budget and theme. The main marketing
screen is shown below.
To change the corporate advertising, direct mail, or public relations budget, click on Corporate
Marketing. A sample screen is shown below.
Corporate advertising is allocated on a regional basis and helps to create overall firm awareness,
preference for your firm, and provide advertising in support of dealerships. Public relations expenditures
help to stimulate interest in your firm’s new and future product offerings. Direct mail allows you to
target particular consumer segments, telling them about special promotional offers available for new
vehicle purchases at the dealerships.
StratSim Operations Guide—Page 71
To change the marketing mix of one of the products on the CONSUMER MARKETING screen, click on
the product name (e.g. Alec). This is also where you may take a vehicle off the consumer market or
discontinue (drop) a vehicle by removing the checkmark in the "Sell in Consumer Market" checkbox.
This will not automatically sell off the inventory, unless you have discontinued the vehicle from the
manufacturing screen, (as you may choose to continue to sell it through other channels, if applicable).
The MSRP is important in two ways. One is that it sets price expectations in the mind of the consumer
(positioning), and the other is that the MSRP is the basis for setting the actual revenues to your company
after the dealer discount is taken. For instance, if the MSRP is set at $20,000 and the dealer discount is
set at 10%, your actual revenues will be $20,000 x (1 - .10) = $18,000. Typically, the retail price (what
the customer actually pays) for the vehicle will be somewhere between the price to the dealer ($18,000)
and the MSRP ($20,000), but that will vary depending on promotional programs, demand / inventory,
target markets, etc.
The promotion budget is used for special dealer or consumer promotions such as below market financing
rates, consumer rebates (additional discounts off the price), and dealer incentives such as an additional
discount to the dealer if certain sales goals are met. In addition, some of the promotional budget will be
used to generate awareness about the special promotional programs as well as items such as product
brochures, mailings, contests, etc.
Product advertising plays an important role in establishing vehicle awareness and shaping customers'
perceptions of products. The role of advertising serves three primary purposes in StratSim. First is to
create general awareness for the vehicle and establish brand/product identity. In general, this aspect
corresponds to whether or not the consumer knows the product name and its general positioning in the
market. Second is to create top-of-mind awareness that loosely can be interpreted as a share of voice
measure. For example, if consumers are asked to name a utility vehicle, the utility vehicle(s) they are
most likely to mention have the greatest awareness and share of voice. The third aspect of advertising
relates to the content of the advertising message. In StratSim, this corresponds to what aspect of the
vehicle is emphasized in advertising (interior, styling, safety, quality or performance). Product managers
typically attempt to match the advertising theme with what is most important to their target customer(s).
So the theme chosen should be something that is both important to the customer and an attribute which
represents a competitive advantage for the vehicle. In general, the majority of the advertising budget is
spent on media buys, with the remainder on the creative input and theme.
StratSim User's Manual—Page 72
Decisions – Distribution
The DISTRIBUTION DECISIONS screen is where you may open or close dealerships on a regional
basis and set a training and support budget for the dealerships. The main distribution screen is shown
below.
Click on the Dealer Inc./Dec. or Training and Support link to enter distribution decisions as shown
below.
For each region, enter the change in dealerships. This may be positive or negative. The maximum
allowable change is 10% of your current dealerships. So, if you have 600 dealerships, and you add 30 in
one region and decrease by 30 in another region, you have reached your maximum allowable change.
Note: It takes 1 year to open or close a dealership. For example, if you make the decision to add
dealerships in the first period (results for period 1), it will not impact results until the results for period 3.
Pending dealership openings and closings will appear on the “Sched. Change” line in the decision screen
shown at the top of this page.
Enter your training and support budget here as well. This allocation of resources is targeted to improve
the experience the customers will have at the dealership in the long run. Select [OK] to accept the
changes made when completed.
StratSim Operations Guide—Page 73
Decisions – Manufacturing
MANUFACTURING DECISIONS consist of building or selling off capacity and setting planned
production levels for each vehicle. Previous sales and current inventory levels are noted to help in your
planning process, as are retooling costs if applicable. The main production screen is shown below.
To enter the production for a vehicle and set whether or not flexible production will be allowed, click on
the product name. A sample of this input screen is shown below.
In general, the car industry aims to have 30-60 days of inventory available, but may have less if a firm is
planning to upgrade or discontinue a vehicle. It is important to note that, when upgrading a vehicle, the
current inventory will not be sold in the market, but will instead be written off at a loss to the company.
By default, the Flexible Production checkbox is enabled. In this case, if demand is greater than supply,
the simulation will automatically increase production up to 10% to sell the unmet demand. If the supply
is greater than 120 days, the simulation will automatically decrease the supply by up to 10% to meet the
120 days of inventory. If inventory levels are between 0 and 120 days, production remains unchanged.
If the checkbox is disabled, your firm will produce exactly what you have entered in the Scheduled
Production field. Note that if the sum of all production (including flexible) exceeds capacity, you will be
charged any over-capacity charges that apply.
Retooling costs are based on new platforms or increases in the production of an existing model, where
existing capacity needs to be changed from one model to another. Thus, careful planning with regard to
forecasting demand and production helps keep retooling costs lower.
StratSim User's Manual—Page 74
Capacity Adjustments
To build or sell off overall firm capacity, click on Capacity Change and enter the change in capacity
(positive or negative). The estimated cost of an additional 100,000 units of production is displayed,
though you are not restricted to blocks of 100,000 units. These costs are depreciated over ten years. The
following period, the additional capacity is available for production decisions.
You can decrease capacity by entering a negative number. Increases and decreases are limited to 50% of
your current capacity. Once the decisions are entered, click on the [OK] button.
Alternatively, you may choose to produce over capacity at a charge dependent upon the number of units
produced beyond the firm's base capacity. This value is shown in the plant capacity section of the screen
as "Over-capacity Charge ($M)".
StratSim Operations Guide—Page 75
Decisions –Financing
The FINANCING DECISIONS report is where decisions involving cash flow and investor relations are
entered. Often, these decisions will be made after you have used the pro-forma analysis to forecast your
cash flow and financing needs. When there are not enough funds to cover all cash needs, a short-term
loan is automatically issued. However, you have the option of replacing the short-term loan with longterm debt and/or issuing stock. This decision screen is also where your firm declares the dividend
amount each year.
Click on Bonds Issued or Stock Issued to issue either stocks or bonds in the CAPITAL DECISION input
screen as shown below. Note that values are entered in millions. Thus, 2000 equals $2 Billion.
Issuing bonds or selling stock is done to raise money for operations. Long-term bonds have lower
interest rates than short-term loans. Stock carries no interest, but will dilute shareholder value. If your
firm needs cash and doesn’t issue stocks or bonds, StratSim will automatically issue a short-term loan
necessary to cover capital liens at the current short-term rate.
Bonds are callable after 3 years, and there is an interest penalty of 1 year on the bond to call it. A
checkbox will appear on the CAPITAL DECISION screen on any bonds eligible to be called and the
entire amount originally issued must be called (no partials). If the instructor has selected the stock buyback option, cash may be used to purchase shares on the open market by entering a negative number
under Sell Stock. You may buy back up to 20% of the current stock, if the stock buyback option has
been selected by your instructor.
The Dividend Paid link will open the input screen used to set the dividends paid to stockholders.
Though dividends are a use of cash, they might also improve stock price.
StratSim User's Manual—Page 76
Decisions – Decision Summary
When you have completed all the decisions screens, it is recommended that you review the decision
summary and print it out. The decision summary provides a record of the current set of decisions on the
simulation server and should be checked before the decision deadline for errors. Once the simulation is
advanced, you will not be able to correct any input errors, so take the time to double check your entries
before the deadline.
Important: The top of the decision summary screen may display some basic decision error warnings.
These warnings may pertain to your team not entering changes to your product decisions, not entering
launch information for new products, having unused concepts that were not put into development,
production of zero units, and no changes in firm decisions (non-product decisions). Please check these
before the decision deadline.
The first part of a sample decisions summary screen is shown below.
Once the simulation has been advanced to the next year, your course website will be updated with
results, and you can choose either to REFRESH DATA (under OPTION from the drop down menu) or
just login again. The simulation will now be in the next period reflected at the top of the StratSim
program window.
StratSim Operations Guide—Page 77
Decision Analysis – Decision Alerts!
This screen will display timely messages to your firm alerting you to decisions that have not yet been
entered. They may pertain to your team not entering changes to your product decisions, not entering
launch information for new products, having unused concepts that were not put into development,
production of zero units, and no changes in firm decisions (non-product decisions). Some of these may
be your intent, but it is always worth checking these messages and then entering any necessary
adjustments to your decisions before the simulation is advanced.
StratSim User's Manual—Page 78
Decision Analysis – Pro-Forma
The PRO-FORMA section of the decision analysis menu is used to project your inventory, contribution,
income and balance sheet items for the upcoming year. If the estimated values do not meet your
expectations, you may want to reconsider your decisions or forecasts (or possibly, your expectations).
On the first screen you will be asked to enter a forecast for each product. The forecasts represent your
sales estimate (in units) for the consumer market for the coming year. When setting these forecasts,
remember to consider factors such as changes in your product (upgrades), price (MSRP or discounts),
marketing support (advertising and promotion), expected demand, and, of course, don’t forget about the
competition. Additionally, review any qualifying direct sales.
The sales forecast links on this report allow you to enter sales forecast figures for the pro-forma
calculations. When you click on the [OK] button, you will see a report that calculates your projected
inventory and retooling costs (if any), based on your forecasts and production levels.
There are four additional reports available: Income Statement, Balance Sheet, Cash Flow Report, and
Product Contribution, corresponding to the internal company reports, but on a projected basis. Choose
[Select Report] to view one of these four additional reports. The Cash Flow and related Financial
Operations reports are shown on the following page.
Note: These values are derived directly from your decisions and forecasts. It is important to understand
that the pro-forma values do not attempt to measure the impact of changes in your marketing decisions,
nor those of your competitors. It only uses your forecasts. You may change your forecasts at any time.
StratSim Operations Guide—Page 79
Decision Analysis – Pro-Forma – Cash Flow Report
In addition to analyzing pro-forma net income and inventory, another essential pro-forma report to check
is the projected cash flow and financial operations. A sample Cash Flow report is shown below.
The report summarizes the primary activities that impact your cash position: Income from Operations,
Plant Investment, Financial Operations, and Adjustments (changes to inventory, A/R, and A/P levels). If
you click on the Financial Operations link, the detail of your pro-forma financial decisions and
implications will be displayed as shown below.
The top of the screen contains information on how the financial markets assess your company. The
shares outstanding will remain constant unless your team chooses to sell or buy back stock. The bond
rating will vary based on the financial position of your company, and the short and long-term interest
rates will vary based on your bond rating and general interest rates. Bonds are rated from D (lowest) to
AAA (highest), where higher ratings correspond to lower interest rates. If your bond rating improves,
the interest rate the market requires from your debt issues will decrease, all other things being equal.
The second half of the screen shows the cash flows from financial operations. At the top of the list are
cash flows from short-term debt. All outstanding short-term debt is paid off each year. Any cash
deficits based on your current decisions will automatically be filled by short-term debt. On this report,
the top line will show short-term debt paid, followed by the projected short-term loans required (and
interest rate paid) for the upcoming year. The next two items, “Bonds Issued” and “Stocks Issued”,
show any funds raised via a stock or bond offering. Alternatively, if bonds are called (repurchased), this
will show up as an additional line item. If your firm decides to buy back stock, the estimated price paid
and capital raised will be displayed on the “Stocks Issued” line.
StratSim User's Manual—Page 80
Section 3: Managing for Success in StratSim
Introduction
StratSim is designed to be a challenging and realistic learning experience. We hope that you will enjoy
the challenge. The idea behind a simulation is that by striving to improve your performance in an active
way, you will better understand how to operate a business. This section of the manual will provide you
with some insights that will help you prosper during your tenure as managers in StratSim.
The first goal of StratSim is to allow you to develop, implement, and potentially adjust a strategy in a
dynamic environment over multiple years. What exactly does “dynamic environment” mean in the
context of business? It means that we can expect customers, competition, and macro-economic
conditions to change as time progresses. A good strategy must reflect current realities while also
assessing future paths to success in an ever-changing world.
The second goal of the simulation is to give you experience in strategic planning and making decisions
in an ambiguous environment. You will be leaving behind the comfort of structured exercises and
entering a situation where the road to success is not so clearly defined. Although a company’s strategy is
planned and implemented based on knowledge of the current situation, a strategy is also based on certain
assessments and judgments about the future. Furthermore, decisions in StratSim are interrelated.
Decisions should not be based solely on how one decision in isolation will impact an outcome, but also
take into consideration the context of your other decisions as well as those of your competitors. How
these decisions will interact is difficult to predict. Remember as the simulation progresses that even if
you do not “win” in the simulation, gaining the experience of wrestling with these difficult decisions in
an ambiguous environment is an important part of the learning process. In fact, many participants of the
simulation will say that their greatest learning occurred when challenges were the greatest.
The third goal of StratSim is to give you experience in making decisions as a group where your
teammates will likely have different opinions about what your company should do. If this is your first
time experiencing a group decision-making process, it requires new skills in addition to knowledge and
judgment that focus on group and managerial processes. How will you organize your group? How will
you make decisions? Consensus? Delegation? Can you come to a shared vision and mission for your
company? Will you embrace your strategy or will you second guess others if faced with obstacles?
Managing people and organizations is indeed a challenge. Your team should develop a written “charter”
that describes the operating process that the team will use to do analysis, divide labor, and make
decisions. Use StratSim as an opportunity to gain experience in this group process.
Before we jump into analysis for success in StratSim, let’s begin with a quick review of the
fundamentals of strategy, because a team with a well reasoned strategy has a better chance of succeeding
than a team without one. Then we will discuss some points regarding execution of strategy in the
context of StratSim. These include measures that provide strategic insights and helpful tips that should
improve performance.
Managing for Success in StratSim—Page 81
Fundamentals of Strategy
A successful strategy is based on two foundations. First is a good understanding of the business
situation, achieved from thorough internal and external analyses. Internal analysis is focused on
knowing the capabilities and resources of your organization. External analysis focuses on the
environment where your company chooses to do business. This will include both industry level
considerations (markets, channels, competition, suppliers, etc.) as well as macro considerations
(political, economic, socio-cultural, technological, environmental, and legal – sometimes referred to as
PESTEL) . The goal here is to understand the forces at work that impact your company. One
framework that is often used to organize internal and external insights is SWOT analysis (Strengths,
Weaknesses, Opportunities and Threats).
The second foundation of a strategy is the formulation of a shared mission and vision that the leadership
sets for the company. This defines where and how it chooses to do business and also provides the
directive for setting corporate goals and objectives, and the measures that should be used to evaluate
performance and acceptable outcomes. Mission and vision are also the primary drivers of corporate
culture and organizational structure, and must be chosen with key stakeholders in mind. Stakeholders
are the people and organizations that stand to gain or lose something based on the success of the
organization. Typical stakeholders include owners, employees, customers, partners, and suppliers.
Internal and External Analysis
Shared Vision and Mission
Strategy
In their 2001 article from the Academy of Management Executive, “Are you sure you have a strategy?”
Donald Hambrick and James Fredrickson provide an excellent framework that defines five necessary
elements of a strategy. The authors propose that an organization defines its strategy by answering five
questions:
•
•
•
•
•
Arenas: Where will we be active?
Vehicles: How will we get there?
Differentiators: How will we win in the marketplace?
Staging: What will be our speed and sequence of moves?
Economic Logic: How will we obtain our returns?
These questions must be answered in the context of your internal and external analysis and your
organization’s vision and mission. Remember to be specific when addressing these questions.
Establishing well-defined and agreed upon directives will improve your group’s decision-making
process in StratSim, just as having a clearly articulated strategy improves the likelihood of an
organization’s strategy being executed successfully. In the following graphic, these five questions are
expanded and applied to StratSim to help guide your team’s strategic planning process.
StratSim User's Manual—Page 82
The Elements of Strategy Applied to StratSim
The above provides a brief overview into the process of designing a successful strategy. Your instructor
will likely provide additional resources for you to learn more about strategic planning. To summarize,
make sure your firm has the following:
1.
2.
3.
A good grasp of the business situation through internal and external analysis
An agreed upon vision and mission for your company
An established process for group analysis and decision-making
Regardless of the framework used, the objective of strategy is to leverage a firm’s capabilities and
resources in the context of the external environment to create a sustainable competitive advantage over
both the short- and long-term. The remainder of this chapter will be devoted to helping you improve
your performance in StratSim.
Managing for Success in StratSim—Page 83
Importance of Strategic Assessment and Judgment
The quality of strategic analysis is an essential part of success in StratSim. Be sure to take the time and
effort to fully understand the industry and your firm’s position within that industry. An example where a
firm could be taken in a non-optimal direction would be where your analysis of the industry causes you
to believe that your firm is a high-end provider of vehicles when, in fact, your firm is more of a volume
producer. That is different than saying that “although our company is currently positioned as a volume
producer, we want to reposition ourselves as a high-end provider”. This latter statement at least
acknowledges the strategic challenge. Then the question becomes, how does the company reposition
itself and is it viable to do so. A second example might be concluding that your firm enjoys a cost
advantage over its rivals, when, in fact, the company does not have a true cost advantage where it can
produce the same product at a lower cost. Instead, it has low per unit costs due to poor product
specifications (e.g. the design has poor ISSQ—Interior, Styling, Safety, and Quality) . In both of these
examples, the decisions your firm will make will reflect these underlying strategic assessments, which,
in the above examples, were not accurate. Poor assessment will often lead to poor performance. So, it is
worthwhile to take the time to question important assessments to make sure your strategy is based on
accurate information.
Another area to consider is the definition of competitive arena – both how the arena is defined and where
a company chooses to compete. There are several different ways to define the competitive arena.
Should it be vehicle class (e.g. utility, minivan)? Segment (e.g. singles, rental fleets)? Customer (e.g.
1E, 2F)? Region (e.g. North, South)? Each approach has its merits, but focusing on one arena definition
alone may lead to an incomplete analysis. For example, one can leverage experience in vehicle class as
it is less expensive and faster to develop another vehicle of the same class than invest in an entirely new
class of vehicle. But that may lead to cannibalization of the current product line. A second example
might be pursuing opportunities in the truck class, without having thought through how the alignment of
dealerships in particular regions factors into your ultimate success. These are examples of how arena
definition needs to support one’s strategic assessments.
In terms of choice of arena, consider two companies – one which focuses on low-end economical
vehicles, and another that has been making high-end luxury and sports cars. Which do you think would
be more successful launching a high-end sports utility vehicle for $50,000? Would customers wonder if
the low-end company is capable of designing this vehicle? Is this potential customer also looking for an
element of the prestige associated with owning a particular brand of vehicle? Remember that your
company will have a perceived positioning in the marketplace which should be taken into account when
considering alternative strategic options. So, when you move into new market spaces, remember that it
may take more time and money to gain success in areas that are far from your core experience. It can be
done but requires resources and patience.
Performance Success and Shortfalls
Most of the sources of poor financial performance fall into one of three areas: 1) not having enough
sales to sustain the on-going costs of running the business; 2) failing to understand the financial structure
of your company (e.g. too high product or fixed costs); and 3) failure to have a long-term plan that takes
into consideration the proper staging of actions and investments. The remainder of this section will help
you identify and diagnose sources of common performance successes and shortfalls.
StratSim User's Manual—Page 84
The Profit Equation
Because long-term profitability is one of the measures of financial performance for your company, you
should understand the drivers of profit. As the graphic below shows, unit sales multiplied by unit
margin less fixed costs equals your company’s profit. Put another way, if your unit sales multiplied by
your unit margin does not cover your fixed costs, your profit will be negative. So, generally you will
find that if your profit is negative, your unit sales are low, your margin is low, or your fixed costs are
high relative to industry standards. This should be straight forward to business students, but easy to
forget as the dynamics of your industry play out.
Unit Sales
x
Unit Margin
–
FC
= PROFIT
(Demand x Market Share)
x
(Selling Price – COGS)
–
FC
= PROFIT
We can further define unit sales as overall market demand multiplied by a company’s share of the
market. We can also further define unit margin as the selling price less the cost of goods sold (COGS).
We will refer to this formula as the profit equation. Therefore, poor profit performance is caused by
some combination of low overall demand, low share, poor margins (the difference between selling price
and COGS), or high fixed costs. Let’s look at each of these factors in more detail for potential causes of
performance successes or shortfalls.
Unit Sales: Demand
What are some of the factors that influence overall (or segment or customer) demand? Three are
presented in graphic below – underlying or intrinsic changes in demand, the impact of economic
changes, and the impact of how the competitors themselves compete in the industry.
Unit Sales
(Demand
x
Market Share)
x
x
Unit Margin
(Selling Price
–
COGS)
–
FC
–
FC
• Intrinsic
• Economic
• Industry
Dynamics
Let’s consider some examples of each of these factors. Intrinsic changes would be underlying trends
based on long-term changes in population, the environment, or customer preferences. In StratSim, these
can be tracked over time at the customer (e.g. 1E, 2F, etc.) level. Separate from intrinsic trends would
be the impact of the economic environment on demand. The automobile industry historically has been
extremely cyclical. During recessions, new auto sales almost always slump as people put off purchasing
new vehicles if they are not immediately needed. Also, rising (or declining) gas prices can negatively (or
positively) impact the overall demand for vehicles and cause a shift in the demand of specific customer
groups or for specific vehicle classes. So, one must consider how changes in the economy and gas prices
will impact demand. Finally, how all the firms compete in particular markets also has an impact on
overall demand (or demand within a segment). If all the firms innovate, advertise, expand distribution,
etc., this will generally stimulate demand overall. Industries where there is less investment in these areas
will grow less, all other things remaining equal.
Managing for Success in StratSim—Page 85
So how do changes in demand impact profitability? In general, the more a company’s costs are fixed
rather than variable, the more dramatic the impact on profitability will be when demand falls (or rises).
As an example, for a firm with $100M of revenues, if variable costs are running at 60% of revenues
($60M) and fixed costs constitute 30% of revenues ($30M), profit will be 10% of revenues ($10M). If
demand falls by 10% resulting in revenues of $90M, the firm’s profits will decline to 6% of revenues
($6M or $90-$54-$30). This represents a 40% decline in profit or four times the magnitude of the sales
decline. Had all costs had been fixed ($90M), there would have been no profit with a 10% sales decline.
Generally, if overall demand is down, all firms will see their profits fall, but weaker firms (firms without
a cost or differentiation advantage) will be hurt the most as their gross margins are typically smaller.
Unit Sales: Market Share
If overall demand is stable, but your share of the market declines, a similar drop may be seen in unit
sales. After recognizing that your market share has dropped, analyze changes in share at the vehicle
class or customer level to find the root cause. What caused the drop in market share in the family class
or the 2F customer? Was it a new product launch by a competitor? Did a competitor upgrade a product?
Was it due to a change in the marketing mix by either your firm or one of your competitors – pricing,
advertising, or promotion? Was it due to insufficient production or perhaps a competitor finally
increasing their production to meet demand? If you see that all of your vehicles are losing market share,
perhaps the cause was more at the corporate level, due to distribution or firm preference. Usually
problems in these areas will impact all your product lines more or less equally.
Unit Sales
(Demand
• Intrinsic
• Economic
• Industry
Dynamics
x
Market Share)
•
•
•
•
•
•
•
x
x
Unit Margin
(Selling Price
–
COGS)
–
FC
–
FC
Competition
Product Fit
Price
Relative Spend
Quality of Spend
Service / Distrib.
Preference
All of these issues are drivers of your market share. What makes it difficult to diagnose is that there are
normally changes in all of these factors each year, which can lead to very reactive decision-making.
Your firm’s strategy is what provides you with the long-term direction as to how best to alter your tactics
as the game progresses. Which target markets should receive our limited resources? Do our products
meet our target customer needs? Which competitors do we need to understand and monitor most
closely? What will be the most effective methods (levers) to use to drive market share? Utilization of
tools to help you better understand the customer and competition, such as the "test market", "focus
group" and others, is critical for success.
Unit Sales: Forecasting Sales for a Product
Now that we have discussed the drivers of demand and market share, it is a good time to consider how
one might forecast unit sales. Why is this important? In StratSim, you will be asked to enter a
production plan for each vehicle. Though this can be adjusted by up to 10% each year by selecting the
flexible production option, it is important for your production decision to be as accurate as possible to
avoid either stockouts where there is insufficient production to satisfy demand, or having unsold
StratSim User's Manual—Page 86
inventory where production that exceeds demand. A stockout will result in lost sales and presumably,
lost contribution. Unsold inventory ties up cash and runs the risk of becoming obsolete resulting in an
inventory write-off if the product is upgraded or discontinued. So avoiding these conditions should be
one of your company’s goals. Of course, the production level for a vehicle should take the current level
of inventory available for sales of that brand.
Because the production plan should be based on expected sales for next period less any existing
inventory, the key to making an accurate production decision is having a good estimate of sales for next
year. This is not a trivial process and the techniques one would use in StratSim are different for an
existing product than for a new product. For both situations, however, the drivers of the Demand x
Market Share part of the profit equation are the basis for the forecast. What varies is the level of
uncertainty and the tools one would use.
For an existing product, there is the big advantage of knowing current sales as a base to start the process.
For purposes of this example, let us state that the product had achieved sales of 100,000 units. The first
question to ask is whether or not there were any special circumstances regarding production levels that
impacted these sales. For example, was there a stockout situation either for this product or one of its
direct competitors? Check the manufacturing detail for your company and the competitors to find this
information. Read the message (some shortages: <10%, significant shortages: 10%-30%, or extreme
shortages: >30%) to get an idea of the magnitude of the production shortfall. If, for example, you saw a
message that stated “significant shortages”, you may want to adjust your base to 120,000 units as an
estimate of what you would have sold had you produced sufficient volume to meet demand. In the same
way, if a direct competitor’s sales were affected by insufficient production, you may want to adjust your
base downward.
Next, consider what decisions you are considering for the marketing mix. The potential impact of
changes in price, advertising, and promotion may be measured using the test market tool to help you
estimate the sensitivity to adjustments in these variables. Of course, this tool assumes that there are no
other changes to either your product or competition.
This brings us to the most difficult assessment you must make – what will the competition do and how
might this affect next period’s market share for the product? The most important issue to note is
whether a new competitor is entering into the same market or vehicle class as the product. In the
industry news report, all new products (new class) entries are announced one period before the vehicle is
sold in the market. This information is important to consider as it will impact your sales forecast, and
perhaps as importantly, create a much greater margin for error in the forecast. However, upgrades and
new products (same class) are not announced in advance and these will also impact sales. By analyzing
historical trends, available development centers, and competitor past behavior and intent, you may be
able to gain some insight as to what the competitor is likely to do with regard to upgrades.
There are two final considerations when deciding on production volume. First is your assessment of the
risk of losing sales (due to under production) against the cost of holding inventory (due to over
production). Some of the factors to take into consideration when weighing these factors are the margin
on the product, your plans to upgrade the product in the future and thus obsolete current inventory, and
the cost of capital used to build inventory. The second consideration is the potential cost of retooling.
Remember that anytime production is increased from the previous period, a retooling charge is assessed.
Therefore, a steady production volume over time is preferable to one with significant variation all things
being equal.
Managing for Success in StratSim—Page 87
Unit Margin
Unit margin is defined as the difference between your selling price (which in StratSim is your MSRP
less your dealer discount) and the unit variable cost or cost of goods sold (COGS). Unit margin is how
much your firm makes on each vehicle sold. In a business where the variable costs are a high percentage
of your selling price, pricing and unit cost savings are especially important. This is certainly the
situation in StratSim where COGS is often between 60-80% of revenues (or on a per unit basis, of the
selling price). Therefore, pay close attention to the impact of pricing and variable costs on the
profitability of your business. Let’s explore these two areas in more detail.
Unit Margin: Selling Price
Pricing is one of the most critical issues facing a firm. This is because the pricing decision influences all
parts of this performance equation. In the profit equation, pricing affects the revenue inflow side of the
margin (what the firm receives when it sells a product or service). But the pricing decision also impacts:
1) your market share, 2) pricing by your firm and your competitors in the market influences overall
demand, and 3) pricing may also have an indirect impact on COGS if a change in price drives the
volume sold (and produced).
Let’s briefly consider how important this margin is. Let’s say your business currently sells a product for
$100 and COGS is approximately 80% or $80. If you decide to reduce your price by $10 and the COGS
remains the same, you have also reduced your margin by $10. On a percentage basis, however, you have
cut your margin by 50% ($20 reduced to $10). This means that unless unit sales doubles, your profits
will decrease. So tactically, at least in the short-term, your firm should be asking whether a 10%
reduction in price will double your sales. Alternatively, consider a $10 increase in price with the
corresponding increase in margin of $10/unit. On a percentage basis, you have increased your margin by
50% ($20 increased to $30). To maintain or increase product contribution, your sales can decrease by
33% and be no worse off with regard to contribution.
Examining the “price sensitivity” at the customer level and utilizing tools such as “focus groups” and the
"test market" can help you evaluate these trade-offs. Basically, these tools are provided to help you
understand the price sensitivity or price elasticity for your target market. So, that is the tactical nature of
the pricing decision, but pricing has far greater strategic implications.
Unit Sales
(Demand
• Intrinsic
• Economic
• Industry
Dynamics
x
Market Share)
•
•
•
•
•
•
•
Competition
Product Fit
Price
Relative Spend
Quality of Spend
Service / Distrib.
Preference
x
Unit Margin
x
(Selling Price
•
•
•
•
•
–
COGS)
–
FC
–
FC
(MSRP – %)
Value
Price Sensitivity
Positioning
Cost position in
industry
Let us consider some of the more strategic aspects to this pricing decision. Most of these have to do
with the dynamic nature of strategy. First, price advantage is often temporary. A competitor can easily
(and quickly) drop (or increase) prices if their cost position is equivalent. Is this a dynamic that you
want to engage in with your competition, or would other ways to compete be more effective over the
StratSim User's Manual—Page 88
long-run? Second, consider the possible impact on the scale of your business. Is it appropriate to
assume that fixed costs will remain the same, or will a price reduction require new investments in
productive capacity? A third strategic consideration is how you want to position yourself in the
marketplace. Is it important to have a consistent message as being a high-end or value provider? Price
points send a message to consumers about what they might expect from your company and vehicles (just
make sure you deliver if you are high end!)
You may want to frame the question of reducing (or increasing) price as one of many alternative
“investments.” For example, you might estimate that cutting price will cost $50 million in lost margin.
Are there better uses for that investment? Can you instead capture that value, and reinvest it in either
product (or service) enhancements or cost reduction opportunities? Or, conversely, would your target
customers be willing to pay more for product improvements?
The main point is to think carefully about pricing. Consider the impact on your profitability and the
potential for competitors to match the price. Think about consistency across your product lines with
regard to positioning. Always understand the financial implications of your pricing choices. The proforma contribution and pro-forma income statement can be of great value in trying out different
scenarios.
Unit Margin: Cost of Goods Sold (COGS)
The other half of the margin equation is your cost of goods sold (COGS) , also sometimes referred to as
your variable cost. What impacts these costs? How can your firm strive to lower the unit cost of a
product?
The cost of your vehicle is based on the specifications of the vehicle of size, HP, and ISSQ (which is an
abbreviation for interior, styling, safety and quality), the technology capabilities of your firm, and the
volume produced of that vehicle and vehicles in the same class (experience effects). All firms in the
industry are also impacted by changes in labor and materials costs over time.
Unit Sales
(Demand
• Intrinsic
• Economic
• Industry
Dynamics
x
Market Share)
•
•
•
•
•
•
•
Competition
Product Fit
Price
Relative Spend
Quality of Spend
Service / Distrib.
Preference
x
Unit Margin
(Selling Price
x
•
•
•
•
•
(MSRP – %)
Value
Price Sensitivity
Positioning
Cost position in
industry
–
COGS)
–
FC
–
FC
• Size, HP,
ISSQ
• Upgrades
• Technology
• Production
Volume
There are several drivers of cost savings in StratSim including learning curve effects, cost savings
through product design, and investments in technology capabilities.
Experience Curve Effects. The experience effect shows that with each doubling of cumulative volume,
there is a fairly consistent percentage decrease in unit costs. In StratSim, there are experience curve
effects present at both the brand level and the class level. Therefore, all things being equal, a firm that
has higher production volume of a particular brand, or of a particular vehicle class, will enjoy a cost
advantage over those products or firms with lower production. For example, if experience effects of
Managing for Success in StratSim—Page 89
90% are present, and the unit cost of the 100,000th vehicle is $10,000, the cost of the 200,000th vehicle
produced will be $9,000 ($10,000 x .90).
Savings through Product Design. It is important to recognize that the product design process has an
impact on unit variable costs. Part of this is determined by the specifications of the product, with higher
values increasing the unit costs, all other things being equal. However, one of the major sources of
lowering unit costs is provided through the upgrade process. When a vehicle is upgraded, along with
creating the new product design, the engineers working on the product also attempt to find ways to lower
the cost of the product without sacrificing the value that the customer perceives in the brand. Your firm
can calculate the impact of the cost savings of an upgrade by choosing to upgrade a product and making
no changes to the design. Compare the base cost on the original (“previous”) product design with the
upgrade.
Savings through Investment in Technology Capabilities. Finally, a firm may invest in technology
capabilities allowing a firm to create vehicles with higher specifications, while also decreasing costs on
existing vehicles. An estimate of the savings based on your current product portfolio and projected sales
is provided on the "technology capabilities" input screen. More specifically, a firm with higher
capabilities in ISSQ is able to produce an identically specified vehicle at a lower cost than a firm with
lesser capabilities in ISSQ.
It is essential that your firm considers the effectiveness of using these cost savings techniques in the
context of your overall strategy. Cost savings are a net positive whether they improve your profit margin
or are passed on to the customer in hopes of gaining more sales. However, remember that it is
implementation of “smart” cost savings that is ultimately rewarded. Having the largest production
capacity is only an effective cost savings if that capacity is used in production (and sold). Having a lowcost vehicle is only effective if consumers still want to purchase it. Thus, the successful manager is
always looking for ways to lower cost, but keeps an eye on whether that cost savings is ultimately
rewarded by affecting the bottom line.
Fixed Costs
Fixed costs are costs which do not fluctuate based on units sold, even if those costs are discretionary.
Thus, investments in upgrades, new products, technology capabilities, development centers, new
capacity, distribution, advertising, etc., generally are the same regardless of the level of unit sales in the
market. This is not to say these investments will not have an impact on unit sales. The firm makes these
investments in the aggregate and then unit sales occur. The amount of fixed cost per unit is just the
division of the amount of fixed cost by the number of units sold. It is not an allocation of the amount per
unit a priori.
Unit Sales
(Demand
• Intrinsic
• Economic
• Industry
Dynamics
x
Market Share)
•
•
•
•
•
•
•
Competition
Product Fit
Price
Relative Spend
Quality of Spend
Service / Distrib.
Preference
StratSim User's Manual—Page 90
Unit Margin
x
(Selling Price
x
•
•
•
•
•
(MSRP – %)
Value
Price Sensitivity
Positioning
Cost position in
industry
COGS)
–
• Size, HP,
•
•
•
ISSQ
Upgrades
Technology
Volume
–
FC
–
FC
•
•
•
•
•
•
•
R&D
Capacity
Tech Invest
Distrib.
Adv.
Interest
Tooling etc.
Strategic and tactical questions your group should discuss pertain to which of the fixed cost investments
should be made to positively influence the rest of the profit equation. Should the focus be on product
improvement, corporate infrastructure, technology, cost reduction, marketing, distribution, etc?
Generally, over the course of the simulation, your firm will likely invest in all of these areas, but the
questions of priorities, direction, and financial benefit must be reviewed in the context of your overall
strategy and objectives. As a group, you will also have to find the proper balance between short-term
and long-term perspectives. Obviously, the best way to maximize profit in the short-run is to not invest
in any long-term projects that have no immediate impact. The related corollary is also true, that a
company that only makes short-term investments will face long-term challenges. StratSim reflects this
need for balance in time horizons.
The above discussion relates to the strategic nature of alternative fixed investments. However, there are
also important operational elements to manage as well. For example, your firm may find that fixed
expenses are consistently running high and putting pressure on profits. How does this occur? One fairly
common source of trouble is having too large an operation for your level of sales. To check for this,
compare your sales with your capacity. If your sales are less than 70% of your capacity, you have a large
fixed asset that is not productive and only adding to your on-going costs (depreciation and plant
maintenance). If this is an on-going concern, you may want to consider selling / writing-off some of
your plant capacity. Although resulting in a one-period loss, it may improve overall future performance.
You also may want to check your expenditures on R&D and marketing versus the industry averages. If
you are significantly out of line and it is not part of your strategy, you may want to rethink this level of
expenditures.
Typically, firms that are struggling with high fixed costs relative to their total gross margin will find
themselves going into debt. The associated debt interest payments then become another fixed cost to
manage. The cost structure of the firm not only impacts the profit equation but also the firm’s cash flow.
Certain fixed costs that are charged to the fixed cost part of the profit equation are amortizations of
investment in capacity, development centers, etc. The cash required for these investments is often
expended earlier than the full charges to the profits equation. Thus, the firm will need to be concerned
with both the profit and cash flow aspects of fixed costs.
Your firm will want to try to make sure that it has sufficient funds from operations available early in the
simulation to fund any long-term projects and weather any challenging periods. This may not be possible
and thus the appropriate use of the debt and equity markets to satisfy the firm’s cash needs may be
necessary.
Last, there are some “hidden” costs of doing business that you should try to control. These include ongoing inventory write-offs, high retooling costs and the like. Generally this is due to poor forecasting,
which, as was discussed earlier, is not a simple issue. However, as you gain experience and make better
use of the tools, you’ll find you can improve your ability to manage these operational issues.
Monitoring Performance and Pro-Forma
The best way to analyze the profit equation during the decision-making process is by using the pro-forma
analysis. The pro-forma reports use your forecasts and the cost of your decisions and allow you to
calculate financial statements based on these assumptions. It is important to recognize that your
forecasts are what drive unit sales in the pro-forma analysis; the simulation does not forecast sales for
you. However, the pro-forma analysis will allow you to test your assumptions about the profit equation
Managing for Success in StratSim—Page 91
and basically answer the question, “If we make these decisions and achieve our forecasts, what will be
the financial outcome?”
Once you have made your decisions and the simulation is advanced, compare your estimate of results
from the pro-forma (sales, market share, net income, etc.) with actual results. If there is a significant
difference between the two, you should find out why. Sometimes results will be better than expected.
Other times (and probably more often), results will be less than you hoped. Use downturns as
motivation to better understand your business.
Long-Term Planning in StratSim
In StratSim and strategy in general, decisions often take time to implement and to have an impact in the
marketplace. This section discusses some of the most important timing and staging issues in StratSim to
allow you to plan your timeline accordingly. Some decision impacts are immediate (that is, a decision is
made and after the simulation is advanced, it impacts the results) while the initial impact of other
decisions may be delayed for up to two additional advances. In addition, some decisions have longerterm effects. New products sell for multiple periods; advertising has both an immediate and long-term
effect through building brand equity; investment in technological capability, development centers, dealer
capacity, plant capacity, etc. have longer term impacts. Finally, remember that costs and cash flows do
not always match up with these effects, so one must also take into consideration availability of funding
for various investments.
It is essential that you understand the staging of various decisions for planning purposes. The graphics
below should help you with this staging process. You may also want to review the table in the case that
covers product development. The following graphics also show related issues that should also be
considered (such as disposing of inventory and adjusting production when a minor upgrade is
implemented).
Timelines
Note: All of the examples below are for a simulation that is in the 2nd round. In other words, teams are
reviewing period 2 results and making decisions for period 3.
Marketing Mix Decision Timeline (Immediate)
Marketing mix decisions (pricing, advertising, promotion) have immediate impact on results and
therefore production should be adjusted based on the expected impact of the revised decision as shown
below.
StratSim User's Manual—Page 92
Capacity Decision Timeline (Capacity Available in the Following Year)
When adding capacity, cash is used to build the additional productive capacity immediately, but the
additional capacity cannot be used until the following decision period. Remember there is a maximum
change of 50% of current capacity in any period. When selling off capacity, the loss shows up as an
extraordinary item after the advance and there is a cash inflow of the sales price of the plant (50% of
book value).
Product Development Decision Timelines (Immediate to 3 years)
For all upgrades and new products shown below, a simple rule to remember is that:
A brand will become available for sale in the last year it is in the development center. On the
development center screen it will show a message such as “launch now”.
Now we will review each of the product development options in more detail.
Minor Upgrade (Launch Now)
Minor upgrades are the fastest way to get product changes into the market. Basically, the same period
you initiate the minor upgrade is the period you also prepare for the upgraded brand’s introduction into
the market for sale. A minor upgrade is in a development center for one period. Also remember that any
existing inventory will be written off at a cost of approximately 15% and that production must be
adjusted immediately upon initiating the minor upgrade.
Managing for Success in StratSim—Page 93
Major Upgrade (Launch after 1 Advance)
Major upgrades take one period longer than minor upgrades, but also allow you to make more significant
changes to the product. They occupy a development center for two periods rather than one period as in
minor upgrades. Because major upgrades take an extra period, you will be charged half of the total
development cost in the first period of development and the remainder in the second period. Also note
that you may make additional changes to the specifications in the second year of development and that
any existing inventory will be disposed in the second period when the major upgraded vehicle is offered
for sale in the market.
New Product in the Same Class (Launch after 1 Advance)
New product in the same class has the same timing as a major upgrade but without the complication of
potentially disposing of inventory. A development center will be occupied for two decision periods and
the development costs will be divided equally between the two periods. The one additional
consideration here may be adding capacity (if needed – it is not a requirement if you have sufficient
capacity to produce all your product lines). For a new product where you already have developed a
vehicle in the same class, the decision to add capacity should be done in the same period that you start
product development as shown below.
StratSim User's Manual—Page 94
New Product in a New Class (Launch after 2 Advances)
New product in a new class works much the same way as a new product same class, except that it takes
one additional period to complete. In this situation, capacity (if needed) would be added the period after
the product development project is initiated. Also note that a development center will be occupied for
three rounds. So it is important to plan accordingly. Development costs will be spread equally over the
three periods it resides in the development center.
Development Centers (Center available after 1 advance)
If you find the need to add a development center, you must think ahead as it takes one period before it is
available to be used for development projects. However, the cash used to build the center will be used
and expensed immediately. The firm needs to make an assessment as to the number of development
centers that will be needed, when they will be needed, and how to raise the funds necessary to build
them. Only one new development center may be added in a given period and there is a maximum of five
total centers for any firm.
Managing for Success in StratSim—Page 95
Technology Investments (New Limits available after 1 advance)
Investing in technology works much the same way. It will take one year to increase that capability.
Remember that investing in technology only increases your ability to design a vehicle with higher
specifications. It does not automatically implement those changes to your existing vehicles. You must
explicitly use upgrades to accomplish this. So again, it is important to plan ahead.
Dealership Decision Timeline
Dealerships also take a year to build. This delay makes sense as it takes time to build new buildings and
hire personnel to expand your channel presence.
StratSim User's Manual—Page 96
Conclusion
To summarize what was covered in this section, here are six key points to review with your group as you
work through the simulation.
1.
2.
3.
4.
5.
6.
Understand the business situation through internal and external analysis
Create an agreed upon vision and mission for your company
Establish a process for group analysis and decision-making
Use the concept of the profit equation to better understand the dynamics and financial
implications of your alternative decisions
Use the pro-forma reports to check your sales and financial assumptions
Make sure part of your long-term planning process takes into account the time required to
complete various strategic decisions
Using this strategic checklist will help your group stay on track strategically and help you avoid many of
the reactive pitfalls that naturally occur as competition intensifies. Best of luck managing your
company!
Managing for Success in StratSim—Page 97
StratSim User's Manual—Page 98
Appendix A: Optional International Module
In most courses, StratSim is only concerned with the domestic market. However, your instructor may
have chosen to include the international component of StratSim that adds several new management and
marketing issues to consider. In some cases, the international module will be introduced later in the
simulation; in others, it will be available from the beginning. Your instructor will provide specific
information regarding the timing of the international module.
Though there are a myriad of ways to take advantage of international opportunities, StratSim provides
four general types of international decisions:
•
Marketing:
International Market Entry (Distribution and Marketing Controlled by Firm)
International Alliance (Distribution and Marketing Controlled by Partner)
•
Sourcing:
Direct Foreign Investment (Production Facilities Owned by Firm)
International Alliance (Production Facilities Owned by Partner)
Market and competitive reports are not as detailed as in the domestic market, but do provide you with
enough information to make informed strategic decisions. The goal with the international module of
StratSim is to allow students to experience some of the most relevant aspects of international business
without too many options which might be somewhat overwhelming. The screen for the international
menus is displayed below.
Appendix—Page 99
International – International Markets
The Atlantic and Pacific regions offer good long-term potential for sourcing and/or selling. However, if
pursuing international opportunities through a strategic partner, one has to consider the fit of your
company to the potential market, potential sourcing advantage, and potential partner. Please note that
although these regions may bear some resemblance to actual regions, one should carefully analyze the
market information and not rely on perceived similarities with actual countries or regions. An example
of the INTERNATIONAL – INTERNATIONAL MARKETS report is shown below.
Atlantic Region
The Atlantic Region has fewer consumers and is a more
mature market based on current and expected growth rates.
However, with higher per-capita income and vehicle
ownership, the Atlantic Region also offers good potential for a
company with the right vehicles. As a sourcing option, the
Atlantic Region is known for vehicles with excellent styling
and features. However, as a more developed region, it does
tend to have higher labor and materials costs for production.
Pacific Region
The Pacific Region, with its large population base and rapidly growing
economy, offers high growth possibilities. However, people in this region still
have a fairly low per-capita GDP (measure of a standard of living) relative to
the domestic market and Atlantic region. Economists in the region expect this
to rise considerably in the coming years along with vehicle ownership. Labor
costs of production are lower in this region, and labor is a little less skilled, but
improving rapidly, especially as experience grows. Overall, the Pacific market
offers some great long-term potential, but be aware the competition is likely to
be fierce in this more price sensitive market.
StratSim User's Manual—Page 100
International – [Region] Segments
The SEGMENTS report provides an overview of the market opportunities within a particular region
based on vehicle class. This includes an estimate of the potential demand for different vehicle classes, a
long-term projected growth rate, and a summary of market research that measures average customer
preferences. Each simulated year, these values will be updated based on the range of results from
several regional market research firms.
The “Demand Range” is based on potential sales of a particular vehicle class if the products meet the
needs of the customer, the products are priced appropriately, and the products are supported well
(distribution and marketing). The 5-Year Growth rate is the projected annual growth rate over the next
five years based on economic forecasts and market research for a particular vehicle class.
Appendix—Page 101
International – [Region] Competitors
The International Competitors report provides an overview of all the companies that sell vehicles in the
chosen region as shown below. Once your firm enters a region, you will be able to review your income
statement for that region by clicking into the link for your company name. These same regional figures
are also accessed by clicking the region link in your Internal Income Statement.
Clicking on one of the company links will bring up a more detailed income statement as shown in the
detail screen below. Note that this is a much simpler income statement than in the domestic region.
After entering a region or building a plant offshore, the Company Income Statement will show a line
item with the net income for the region. You may click on the link provided there to access the detailed
statement of your activity in the region.
Note: Several screens in this section have smudged areas to conceal decision inputs.
StratSim User's Manual—Page 102
International – [Region] Results
The International Results report provides a detailed description of each vehicle in the regional market
and their sales. A sample of this report is shown below. Clicking on a heading link will sort the listing
by vehicle name, class, unit sales, price, or size. You may also click on a vehicle name to see a history
of sales for the vehicle.
When you sell a vehicle into a region, either through a partner or using your own distribution network,
the sales will appear on the Internal Product Contribution report (shown below) as well as the
International Results report.
Clicking on a vehicle link in the
Product Contribution report will take
you directly to that vehicle’s sales
history in its associated sales region.
Exports to partners are
counted as direct sales on the
firm's
domestic
income
statement, as shown here . . .
Sales through the firm's own
distribution network in a
region will show on the
income statement for the
region, as displayed here . . .
Appendix—Page 103
International Decisions
StratSim provides multiple international decisions for your firm in the areas of marketing and sourcing.
Be aware that when your firm decides to expand internationally, the choices you make may limit other
international options. Entering a region by building your own distribution network will preclude any
future agreements with a partner in the region. Other decisions, such as building a plant, may not prevent
you from forming alliances, but may make them more difficult. For example, if you formed an alliance
with company X to source an economy vehicle, and then you want to source a family vehicle from
company Y in the same region, your existing relationship with X may make it difficult to reach an
agreement with Y. Thus, it is important to consider the strategic ramifications of the various decisions
with regard to sourcing, marketing, and partnerships.
There are four decision menus available in StratSim, accessed by clicking on DECISIONS main menu as
shown on the screen below.
•
•
•
•
Pacific Marketing
Atlantic Marketing
Pacific Sourcing
Atlantic Sourcing
For each marketing or sourcing decision in a region, you will need to decide if you will partner with one
of the existing firms in that region or go it alone.
The pages that follow review each of the decision options available within any particular region.
StratSim User's Manual—Page 104
Decisions – (Region) Marketing – Enter Region
At the beginning of the simulation, none of the domestic firms operate in the foreign markets.
Therefore, one of your first decisions is whether or not you want to market vehicles in a region, and if so,
do you want to go it alone by entering the region with your own marketing and distribution network, or
through an alliance with a local partner who is already established in one of the international regions. As
noted previously, your firm has a limited number of “deals” it can make in each region (a total of 4 deals
for both Sourcing and Marketing options). So, make sure your firm recognizes that it has limited
resources with regard to negotiations and choose your partner and offer terms carefully. Choosing to
enter the region on your own will prevent you from negotiating an alliance with a partner.
The first time you choose to market in a region, you will see the following screen with the options of
Enter Region and Negotiate New Alliance, as shown in the screen shot below. Let’s start by discussing
how to enter a region on your own, without a partner.
To enter the market (region) without a partner, click the Enter Region link and an entry screen opens, as
shown below. Here you will need to enter the number of distributors to add and a budget amount for
marketing support expenses. For ideas on establishing your budget and number of dealers to add, refer
to the International Competitors report. This report displays the amount each competitor is allocating to
marketing expenses and the number of dealers each maintains in the region.
Decisions for the international module are made at a very high level, limiting the number of variables
thus making the options more manageable. For instance, “Add Distributors” is a single value in each
region, representing the entire number of regional distributors. Similarly, the amount you enter for
“Marketing Support” is for all brand advertising, promotion, and corporate advertising expenses in that
region. You will want to view the International Competitors report to help you decide on the number of
distributors and the amount of marketing support. It takes one year to build your dealership network and
set up your international marketing presence.
Appendix—Page 105
After you have entered the region and the simulation has been advanced, your firm will have the
opportunity to launch your own products into this market, as shown in the screen displayed below. Note
the new Add Vehicle to Market link.
NOTE: Entering a region by
building your own distribution
network will preclude any future
agreements with a partner in the
region. The negotiation link is
no longer is displayed.
To add a vehicle to sell in this market, click the Add Vehicle to Market link. Select a vehicle, then enter
the selling price, and the number of production units in the window (as shown at left, below). If you
want to add more dealers or adjust your marketing expenses budget for the region, click back into the
Marketing Support link to adjust these numbers as shown at right, below. Be sure to adjust the
production schedule for the vehicle based on your estimated sales in the region.
The screen below shows a vehicle being distributed in a region.
StratSim User's Manual—Page 106
Decisions – (Region) Marketing – Negotiate New Alliance
An alternative approach to building a marketing and distribution presence on your own is to partner with
a local manufacturer who will import, distribute, and market your vehicles in the international market.
Using this approach allows you to get your vehicles to market faster by using the local firm’s existing
distribution and marketing network. Each marketing alliance agreement is for a one-year term and each
will need to be renegotiated when they expire. Note that the contract price is the amount you receive for
each unit; your partner pays for shipping and tariffs.
Similar to the international "Sourcing" option with a partner, your firm is making offers to local firms in
a specific international region. Choose Negotiate New Alliance and then make an “offer” to a potential
partner as shown in the screen below.
The potential partner will evaluate your offer and either accept or give you feedback about your offer.
Note that negotiation messages will appear on the right side of the screen under “Status” as can be seen
on the sample screen shown below. The types of negotiation messages you might receive are the same
as those listed in the previous section describing international regional "Sourcing" options.
If the potential partner refuses your offer, you can try to renegotiate with this partner or select Negotiate
New Alliance to begin negotiations with another partner. Once your partner has agreed to the export
agreement and you have accepted it, be sure to adjust your production schedule to include the estimated
vehicle sales. To drop a partner alliance, simply do not renew the contract when the offer is up for
renewal, after the simulation has been advanced.
Appendix—Page 107
Decisions – (Region) Sourcing – Open a Plant
At the beginning of the simulation, all production takes place in domestic plants. Capacity is divided
among current vehicles based on the production as designated by your firm. With the international
module, your firm has the option of opening a plant in a foreign region. In addition, your firm has the
option of opening a single-line plant, where only one vehicle can be produced, or a multi-line plant,
where more than one vehicle may be produced. Thus, in the “Open a Plant” decision for sourcing there
are two steps:
•
•
Decide on a region for your plant
Build a single-line or a multi-line plant
Each of these choices has different associated costs and benefits. The benefits may be a lower cost
vehicle and no shipping or tariffs when selling in a foreign market. The costs may be shipping costs to
domestic or other foreign markets and tariffs. The single-line plant only allows production of one
vehicle, but the plant will be available in one year. The multi-line plant takes two years but has higher
overhead expenses than the single-line plant. Please note that all production for a particular vehicle
must take place in one location, either foreign plant or domestic plant. So your firm will have to make a
decision about the best single location for production of a vehicle.
Click on the Open a Plant link in the appropriate region, and the plant choice dialog box will appear, as
shown below. You may change your selection at any time during the decision period, but once the
simulation is advanced, the plant will be built and your firm will be charged the full overhead whether it
is in use or not. So, be sure to think through this decision carefully as part of your overall strategy. The
plant costs $200 million/year for a single line plant and $300 million a year for a multi line plant. The
costs are expensed yearly and can be seen in the “overhead” item in the region’s income statement.
StratSim User's Manual—Page 108
Decisions – (Region) Sourcing – Add Vehicle into Production:
After you make your decision to open a plant, the plant status will display on the Sourcing Decisions
screen for the region. When the plant is available for production (one year for a single-line plant; two
years for a multi-line plant) you may choose a vehicle to produce in the plant. For a single-line plant,
you will also have the option to upgrade to a multi-line plant, allowing you to produce more than one
vehicle, but with a higher overhead cost. The upgrade takes one year to complete.
To begin production on a vehicle in your new plant, select the Plant Available link. A vehicle selection
dialog box opens, as shown below, at left. Use the drop-down menu to select the vehicle you want to put
into production in your new plant. If you begin production in an international region, all production for
that vehicle moves to the international plant. This will be reflected in your Company Production report.
This decision only affects where your vehicle is produced. Remember to change the vehicle’s
production schedule on the Manufacturing decision screen in the Home Region. If you decide to move
production back to the domestic plant, click on the vehicle link and uncheck the “Produce Vehicle
Offshore” box. A screen showing a vehicle being produced in an offshore plant is shown above, right.
Appendix—Page 109
Decisions – (Region) Sourcing – Alliance
An alternative approach to internal product development and domestic production is to source an
existing vehicle from a firm in another region for import to the domestic region. There are several firms
in each region to choose from and each firm produces multiple vehicles. Thus, there are many potential
vehicles to choose from, each with different characteristics and costs. Your firm’s job, if you choose to
use this sourcing approach, is to find a good partner (firm level) and a good vehicle (product/market
level).
There are three important rules to consider in StratSim when negotiating these alliances. First, your firm
has a limited number of “deals” it can make (the “4 of 4 remaining” message) per period in each region.
The number of deals is a total number of deals for both Sourcing and Marketing options. So, make sure
your firm recognizes that it has limited resources with regard to negotiations and choose your partner
and offer terms carefully. Second, any agreement, even if it has not been accepted, uses one of your
available "deal" slots during the period in which it was initiated. Third, each agreement is for one year at
the end of which you may choose to renew. Thus, accepted deals will use one of your available slots in
the next period as well. However, once a deal has been accepted by a partner, a renewal will be agreed
to without further negotiation as long as you do not change the price too dramatically (beyond the
expected change due to inflation). Additionally, should you forget to renew an alliance and the
simulation is advanced, that alliance is broken and must be completely renegotiated and begun anew.
There are two aspects the potential partner will want to consider. First is the potential match with your
firm. Are you a good strategic partner for this company? Are there other potential sourcing / marketing
options that you both might find mutually beneficial? Does your potential partner see you as a long-term
strategic partner, or do your actions make it appear that the partnership is more likely to be a short-term
alliance of convenience? The second aspect is the actual terms of the deal. Will your potential partner
make a profit on the agreement? Does it have significant enough volume to make the alliance with your
firm worthwhile?
To begin the sourcing alliance process, click on the Negotiate a New Alliance link in the screen, as
shown below.
StratSim User's Manual—Page 110
After selecting the new alliance link, a dialog box will appear (as shown below), allowing you to make
an offer to a firm to source a vehicle from them at a specific price and volume. In choosing a price, keep
in mind that shipping and tariff fees will be added to the contract price in calculating the delivered cost
of the vehicle. The potential partner will evaluate your offer and either accept, or provide feedback for
rejecting, the offer.
Some feedback status messages you may receive are listed below:
•
•
•
•
•
•
•
Agreement accepted
Not what we're looking for in a partner
Value of deal not high enough
Good offer, need to think about it
Starting negotiations
Negotiating renewal
Waiting for your acceptance
A sample screen with one vehicle in failed negotiation is shown below. Note the status message states
that the value of the deal was “not high enough”.
Appendix—Page 111
To renegotiate with this same partner, click back into the vehicle name and a dialog box will open, as
shown at left, below. Use this window to adjust the number of units and/or the price. Note you cannot
change the vehicle at this stage without beginning a completely new alliance. Click “OK” to activate
your revised offer.
When a partner firm has accepted your offer, a message alerts you as shown at right, above. NOTE:
Clicking “OK” in this message box only means that you acknowledge their acceptance of your offer; it
does not finalize the agreement. To finalize the agreement, you must click back into the hyperlink for
the associated vehicle listed on the Region Sourcing Decision screen (as shown below) and then click
the [Accept] button in the message window that opens. Note: You cannot undo this once you have
accepted the offer.
NOTE: After clicking [Accept], the status changed to “agreement accepted.”
StratSim User's Manual—Page 112
Once you have accepted the alliance, you must then set pricing, dealer discount, and establish an
advertising and promotional strategy for your new imported vehicle. Below is a sample screen of the
home region Consumer Marketing Report.
NOTE: The selling price,
dealer discount percent,
advertising theme, and
advertising budget have
not been allocated for the
new A-Xing vehicle.
To enter your marketing decisions for this new vehicle, simply click on the vehicle name link and the
marketing decision screen will open, as shown below.
After the simulation has been advanced, and the alliance is open for renewal, you can adjust the terms of
the alliance if you want. For example, you may want to renegotiate a higher price to adjust for inflation.
In order to adjust your alliance agreement, click back into the vehicle name link and enter your new
negotiation price, and proceed as described previously.
Should you want to discontinue the alliance with your partner, simply do not renew the alliance after the
simulation has been advanced. If you have inventory remaining from this alliance, the inventory is yours
and you may continue to sell it through your own dealers.
Appendix—Page 113
Results for
Period N1
Decisions for N+3
Single-line
plant begins
development
Single-line plant now
available;
select vehicle to
produce offshore*
Results impacted;
vehicles sold this
period were
produced offshore
Offshore
production
continued
Multi-line
plant begins
development
Multi-line plant
remains in
development
Plant available;
select vehicles to
produce offshore*
Results impacted;
vehicles sold this
period were
produced offshore
Negotiate Alliance
with Partner
Accept agreement
and set marketing
mix decisions for
sourced vehicle
Results impacted;
review sales of
imported vehicles
and renew
agreement if desired
Results impacted if
agreement was
renewed. Renew
agreement if desired
Results impacted
if agreement was
renewed. Renew
agreement if
desired
Enter Market
Add distributors and
establish budget for
marketing support
Add vehicle to
market; modify
distributors and
marketing support if
desired
Results impacted;
review sales of
vehicles sold in
foreign region
(foreign results)
Continued sales of
vehicle in foreign
region
Negotiate Alliance
with Partner
Accept agreement
Results impacted;
review units sold to
partner and renew
agreement if desired
Results impacted if
agreement was
renewed. Renew
agreement if desired
Results impacted
if agreement was
renewed. Renew
agreement if
desired
SOURCING
Open Plant
Multi-line
($300 mill./year)
("Consumer Marketing"
decisions input)
MARKETING
Enter Market
Establish
distribution
network
MARKETING
Partnership
Negotiate Alliance
Result for
Period N+3
Decisions for N+2
Open Plant
Single-line
($200 mill./year)
Partnership
Negotiate Alliance
Result for
Period N+2
Decisions for N+1
SOURCING
SOURCING
2
Result for
Period N+1
1
Period "N" is the period just completed for which you are now currently reviewing results; e.g.: Period 1
Period "N+1" is the period for which you are now making decisions. It is the period for which results will be created as the simulation is advanced after the current decisions are
completed; e.g.: Period 2.
*Note that all production for vehicle(s) selected takes place offshore.
2
StratSim User's Manual—Page 114
Appendix B: Exporting Data to a Spreadsheet
Copying to a Spreadsheet File
To copy a report to a spreadsheet file, select COPY from the EDIT pull-down menu. This will copy the
contents of the current screen. The contents may then be pasted into another application, such as a
spreadsheet, word processor, or graphics program.
COPY menu
option
Internal
Financial report
Printing to a Spreadsheet File
To print a group of reports to a spreadsheet file, click on PRINT REPORTS in the FILE pull-down
menu. Check the box next to the “Output to Spreadsheet File” in the PRINT REPORTS window, then
check the box next to any or all of the four groups of reports (Company Reports, Market Reports, Survey
Reports, and Current Decisions). The reports will output to individual files regardless of whether you
choose to output one or more groups of reports.
Appendix—Page 115
StratSim User's Manual—Page 116
Appendix C: Glossary of Terms
Advertising: Any paid form of non-personal presentation and promotion of ideas, goods, or services by
an identified sponsor.
Advertising Message: The point that an advertisement is trying to make, whether to build a particular
image, stress the benefits of the product, compare with other brands, or maintain awareness.
Average Retail Price: The average price for a product charged by retailers, including both those
dealerships with higher prices due to increased personal service, exclusive merchandise lines, attractive
showroom atmosphere, special promotions, convenient location, or special services, and those who offer
a no-frills, low-price approach.
Awareness: The level of consumer familiarity with a product, brand name or advertisement.
Breakeven Analysis: An attempt to determine the volume of sales necessary (at various prices) for the
manufacturer or merchant to cover his or her costs or to break even between revenue and costs.
Breakeven analysis is useful to help set prices, estimate profit or loss potentials, and to help determine
the discretionary costs that should be incurred.
Cannibalization: Sales of a new product that take away sales of another product in the product line.
Capacity Utilization: The extent to which the physical production ability of a plant facility is being
used. Normally described as a percent of total capacity (i.e. 50% of capacity).
Channel of Distribution: Any firm or individual who participates in the flow of goods and services as
they move from producer to ultimate user (consumer or industrial).
Competitive Analysis: The process of studying other companies who are vying to satisfy similar
consumer needs. This includes analyzing competitors' strategy, product, pricing and channels of
distribution.
Dealership: The retail distribution outlet where consumers purchase the product (automobiles).
Demand: The desire of consumers for a certain product.
Fixed Costs: Financial obligations of a firm that remain at the same level no matter how many units of
a product are produced and marketed. Amortization charges for capital equipment and plant, plus such
charges as rent, executive salaries, property taxes, and insurance are examples.
Gross Margin: Total revenue less product manufacturing costs (materials, labor, plant and equipment).
Inflation: A general rise in the prices that people must pay for goods and services.
Inventory: Stock of a product that is already produced but not yet sold.
Appendix—Page 117
Margin: The difference between the price of a product and its per unit cost.
Market: People or businesses with the potential interest, purchasing power, and willingness to spend
the money to buy a product or service that satisfies a need.
Market Share: The percentage of sales of a certain product in a market in relation to other products in
that market (i.e. Brand X / Total sales in market).
Marketing: The process of planning and executing the conception, pricing, promotion, and distribution
of ideas, goods, and services to create exchanges that satisfy individual and organizational objectives.
Marketing Research: The systematic and objective approach to the development and provision of
information for marketing decision making.
Net Contribution: The contribution after marketing less fixed costs.
Net Income: The profit remaining after all costs are subtracted from revenues.
Price: The amount of money required for a product or brand in order for an exchange of ownership to
take place.
Product Mix: All of the individual products available from an organization.
Promotion: The communication mechanism of marketing designed to inform and to persuade
consumers to respond.
Quality: The totality of features and characteristics of a product or service that bear on its ability to
satisfy stated or implied needs. In the automobile industry, quality is sometimes more narrowly defined
and measured by defects per 1000 cars or reliability.
Research and Development: Portion of a firm designated to research, analyze, and design products to
meet consumer and market needs.
Segmentation: The process of dividing large heterogeneous markets into smaller homogeneous
segments of people of businesses with similar needs and / or responsiveness to marketing mix offerings.
Unit Sales: The total volume of units sold by a manufacturer in a market.
Variable Costs: Costs directly tied to production including direct labor and raw materials charges.
StratSim User's Manual—Page 118
Index
A
accounts payable · 13, 36, 37
accumulated depreciation · 36
adding a development center · 68
adjustments · 37
administration · 35, 58
advancing the simulation · 77
advertising · 11, 35, 38, 55, 58, 71, 72, 117
awareness · 49
budget · 11, 44, 53
corporate · 11, 71
message · 117
theme · 11, 44, 53, 71
AEV vehicle · 6, 17
Amazing Cars · 5, 10
appendix · 4
arenas · 82
average retail price · 7, 117
awareness · 11, 64, 72, 117
B
balance sheet · 13, 36, 37
base cost · 67
Best Motor Works · 5, 10
bond rating · 80
bonds · 14, 36, 37, 76, 80
breakeven analysis · 117
briefing · 32
C
calling bonds · 76
cannibalization · 117
capabilities and resources · 82
capacity · 13, 37, 57, 74, 75
change · 75
over-capacity charge · 75
utilization · 57, 117
cash · 13, 33, 36, 37, 76
cash flow · 13
statement · 37
cash rate · 43
channel · See distribution
class detail report · 44
competition menu · 31, 51
competitive
advantage · 67
analysis · 60
arena · 84
mapping · 63
competitive advantage · 14
competitive analysis · 51, 117
competitors · 63
concept · 9, 68
creation · 62
test · 62
consumer
customers · 48
segments · 47
consumer perceptions · 6, 11
consumer segments · 12
contribution · 38, 118
control buttons · 29
Cool Cars · 5, 10
cost of goods sold (COGS) · 13, 35, 38, 58
impacts on · 89
cost structure · 14
customer · 11, 31, 49, 54, 60, 72
demand, effects on · 85
detail report · 49
customer needs · 6, 10, 14
D
dealer
coverage · 11
discount · 71
invoice · 7, 35
markup · 7
rating · 11, 40, 56
sales · 38
training · 56, 73
dealership · 11, 36, 56, 73, 96, 117
debt · 58
long-term · 36, 76
decisions · 1, 2, 3, 14, 67, 79
concept creation · 69
consumer marketing · 71
decision alerts · 78
decisions summary · 77
distribution · 73
financing · 76
manufacturing · 74
product development · 68
production · 74
pro-forma · 79
pro-forma, cash flow · 81
technology · 67
decisions menu · 31, 66
Index—Page 119
demand · 13, 57, 74, 117
depreciation · 13, 35, 36, 37, 58
development capacity · 9
development center · 68, 95
differentiators · 82
direct mail · 71
distribution · 11, 40, 46, 56
dividend · 37, 76
Driven Motor Co · 5, 10
dynamic environment · 81
E
economic
conditions · 31, 43
outlook report · 43
economic conditions · 42
economic logic · 82
economies of scale · 10
economy · 43
economy vehicle · 6, 7, 15
Efficient Motors · 5, 10
engine · 6, 7
range · 49
enterprisers segment · 12, 23
equity · 13
experience curve · 10
experience curve effect · 89
external analysis · 82
F
families segment · 12, 21
family vehicle · 6, 7, 15
financial
implications · 13
summary report · 58
financial statements · 31, 33, 35, 36, 37, 58
firm preference · 55, 58
fixed costs · 90, 117
flexible production · 13, 74
focus groups · 60
forecast · 3, 43, 50, 79
G
getting started · 25
graph button · 29
gross margin · 13, 35, 117
group decision making · 81
growth · 33, 44, 49, 53, 65
growth-share matrix · 65
H
hidden costs · 91
high income segment · 12, 22
StratSim User's Manual—Page 120
history button · 29
horsepower (HP) · 6, 7, 9
hot buttons · 11, 49
I
ID and password · 27
ideals · 11
income · 58
from operations · 13, 35, 36, 37
income statement · 13, 35
income taxes · 58
industry news · 43
inflation · 43, 117
input screens · 28
installation · 27
interest
expense · 13, 35, 37, 58
penalty (calling bond) · 76
rates · 14, 76, 80
interior · 6, 7, 10, 11, 49, 54, 67
internal analysis · 33, 82
internal menu · 31, 33
Introduction · 1
inventory · 13, 36, 37, 56, 74, 87, 117
days · 56, 74
write-offs · 35, 58
investment · 8, 36
alternatives · 13
risk · 14
investments · 10, 37
plant · 37
technology · 54
ISSQ · 84
K
key success factors · 42
L
legends on graphs · 45, 65
likely to purchase · 62
list boxes · 30
login · 27
luxury vehicle · 6, 7, 16
M
major upgrade · 8, 9, 94
map · 49, 53
positioning · 45
margin · 7, 118, See also gross margin
market
analysis · 42
attractiveness · 42
definition · 65
growth rate · 5, 44, 53
segments · 12, 42, 47
share · 31, 55, 58, 65, 118
share by class · 6
share by customer · 49
share by region · 46
share by segment · 47
value · 58
market menu · 31
market share · 64, 86
effects on · 86
marketing
communications · 39, 55
decisions · 71
expenditures · 35, 58
mix · 72
research · 118
menus
brief descriptions of · 28
pull-down · 28
minivan vehicle · 6, 7, 18
minor upgrade · 8, 9, 93
mission and vision · 82
MSRP · 7, 44, 53, 71, 72
N
naming your product · 70
navigation index · 31
net contribution · 64
net income · 35, 36, 118
new class · 95
new concept · 69
new customers · 43, 50
new platform · 9, 74
new product · 8, 94
development · 62
O
objectives · 33, 42, 66
operations guide · 4, 25
opportunities · 14
P
password and ID · 27
performance
financial · 31, 33, 58
summary · 34
vehicle · 6, 7, 11
PESTEL · 82
plant maintenance · 13, 35, 58
platform · 8
development · 54
portfolio analysis · 65
positioning · 45
positioning map · 49
price · 38, 52, 118, See also MSRP
range · 49
pricing
impacts of · 88
strategy · 88
primary vehicle class · 49
product · 7
advertising · 11
class · 15
contribution · 38
detail report · 52
development · 8
launch · 43
portfolio · 65
price · 7, 52
production · 13
product development · 68, 69
product name · 70
production · 13, 57, 87
capacity · 13
costs · 10, 35, 58, 67
flexible · 74
volume · 10
products report · 52
profit equation · 85
pro-forma · 3, 66
analysis · 91
promotion · 11, 35, 38, 44, 53, 55, 58, 71, 72,
118
public relations · 11, 35, 58, 71
pull-down menu · 29
purchase decision · 7, 13, 49
Q
quality · 6, 7, 10, 11, 49, 52, 54, 67, 118
R
R&D · 8, 35, 58, 118
radio buttons · 30
ranges · 45
receivables · 36
regions · 11, 46, 71, 73
registering software · 27
relative market share · 65
retained earnings · 13, 36
retooling · 36, 37, 87
revenues · 5, 13, 38
Index—Page 121
S
safety · 6, 7, 10, 11, 49, 54, 67
sales · 6, 35, 43, 58
awareness relationship · 49
by customer · 48
by region · 46
units · 38, 46, 52
sales forecast · 86
secondary vehicle class · 49
segmentation · 118
segments · 12, 14, 21, 42
shortages · 41, 57
short-term debt · 33, 36, 37, 76, 80
simulation
manual · 26
singles segment · 12, 22
size · 6, 7, 50
range · 49
sports vehicle · 6, 7, 17
staging · 82
Startup menu · 31, 32
stock · 13, 33, 36, 37, 58, 76, 80
buy backs · 76
stockouts
avoiding · 86
strategic
analysis · 84
business unit (SBU) · 65
planning · 81
strategy · 14, 33, 66
StratSim case · 4
styling · 6, 7, 10, 11, 49, 54, 67
SWOT analysis · 82
T
taxes · 13, 35, 58
technology
StratSim User's Manual—Page 122
capabilities · 10, 54, 96
maximum feasible limit · 54
test market · 64
timeline
capacity increase · 93
dealerships · 96
development center · 95
major upgrade · 94
marketing mix · 92
minor upgrade · 93
new class · 95
new product · 94
technology · 96
tools
decision-making · 28
menu · 31
tools menu · 59
training and support · 11, 56, 73
truck vehicle · 6, 7, 19
U
unit cost · 9, 10, 35, 58
unit margin · 88
upgrade · 9, 68, 74
effects on cost · 90
utility vehicle · 6, 7, 19
V
value seekers segment · 12, 21
variable costs · 7, 35, 58, 118
vehicle
attributes · 7, 9, 52, 60, 67
classes · 6, 15, 44, 53
detail · 52
names · 5, 7, 52
sales by customer · 61
vehicles · 82