1
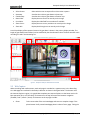
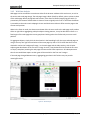
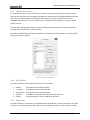
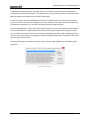
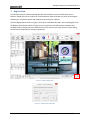
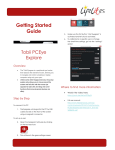
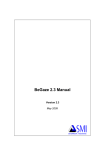
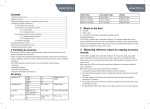
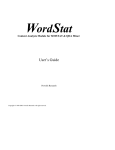
GAZEPOINT ANALYSIS USER MANUAL Gazepoint Analysis User Manual Rev 2.0 Contents 1 Introduction ........................................................................................................................................ 2 2 Operation ............................................................................................................................................ 2 2.1 Basic Operation ........................................................................................................................... 2 2.2 Data capture mode ..................................................................................................................... 3 2.3 Web Capture ............................................................................................................................... 4 2.4 Data analysis mode ..................................................................................................................... 5 2.4.1 User Data Settings ............................................................................................................... 6 2.4.2 Web Data Analysis............................................................................................................... 7 2.4.3 Dynamic AOI Creation ......................................................................................................... 8 2.4.4 AOI Statistics ....................................................................................................................... 8 2.4.5 Export Data ......................................................................................................................... 8 3 Registration ....................................................................................................................................... 10 4 Document Revisions.......................................................................................................................... 11 4.1 Version 2.0 ................................................................................................................................ 11 4.2 Version 1.2 ................................................................................................................................ 11 4.3 Version 1.1 ................................................................................................................................ 11 Revised February 3, 2014 Copyright (c) 2013 1|P age Gazepoint Analysis User Manual Rev 2.0 1 Introduction The Gazepoint Analysis system provides an easy-to-use yet powerful method for collecting and analyzing eye-gaze data. The software provides two levels of functionality, 1) standard operation which allows for basic screen capture with gaze overlay and is included with the purchase of a GP3 eye-tracker, and 2) the Professional version of Analysis which enables text, image and video media playback, dynamic web analysis, aggregation of test subjects and dynamic Areas-Of-Interest (AOI’s) with statistics. The Professional version is provided as a 30 day trial with any GP3 purchase, and may be purchased separately. 2 Operation There are two modes of operation in the software, data capture mode and data analysis mode. The following section describes both modes in reference to screenshots of the user interface. 2.1 Basic Operation The analysis software projects use multiple folders to save and load the recorded data, and to generate the resulting output files. When you create a new project the following files and folders are created: C:\”Path to Project”\NewProject.prj C:\”Path to Project”\user C:\”Path to Project”\src C:\”Path to Project”\result - The project file - The folder where recorded user data is saved - The folder for source media for playback - The folder where output result files are saved Figure 1 shows a screenshot of the analysis program main window with the project file manipulation buttons and the gaze tracker calibration button highlighted. New Project: Open Project: Save Project: Calibrate: Create a new project and project folders Load a previously created project and the data form the user folder Save project file Send calibration command to the eye-tracker Feedback on the system operation is provided by the bottom status bar: Client: Recording: Render: Project: Identifies if connected to the gaze server (RX) or disconnected (--) Indicates the current recording status Feedback on rendering times Current project path Revised February 3, 2014 Copyright (c) 2013 2|P age Gazepoint Analysis User Manual Rev 2.0 Figure 1 - Gazepoint Analysis Screenshot 2.2 Data capture mode Figure 2 shows a screenshot of the analysis program main window. The data capture mode is active when the Collect Data button is pressed. Once a project is created, add content to the media list on the left hand side, click the Add (plus symbol) button. Projects may either be: Screen Capture Text / Image / Video Web pages Text, image and video files will be copied to the \src\ folder and a display duration must be specified. For screen capture and webpages there is no duration specified, simply stop the recording when sufficient data has been captured. The control buttons are as follows Collect Data: Start/Stop Record: Revised February 3, 2014 Enter data collection mode Begin or stop the recording of gaze data (CTRL-ALT-R shortcut to start recording and CTRL-ALT-S shortcut to stop recording) Copyright (c) 2013 3|P age Gazepoint Analysis User Manual Rev 2.0 Select Screen: Heatmap: Fixationmap: Gaze Video: Cam Video: Show Cursor: Show AOI: Select which screen to capture for multi-monitor systems Visualize the real-time gaze data as a heat map Visualize the real-time gaze data as a fixation map Display the users face as an overlay on the image Display the video feed from a webcam if available Display the users cursor position as an overlay on the image Display the AOI regions as an overlay on the image A real-time display of the captured screen with gaze data is shown in the primary display window. The length of gaze data (historical data) can be modified by the Gaze Duration value. The data saved for each recording is listed in the Recording List. Figure 2 - Gazepoint Analysis Collect Data Screenshot 2.3 Web Capture When recording web media content, each web page is recorded as a separate entry in the Recording List. Web pages are rendered in the Analysis browser as shown in the figure below. The browser uses the Internet Explorer engine, it is a good idea to update your Internet Explorer to the latest version for best operation (IE 11 as of this date). The buttons on the top left control the browser navigation (forward / back / refresh / home). The buttons on the top right include: Photo Take a screenshot of the entire webpage and save as a complete image. If the photo button is left pressed a webpage photo is taken of every page. Taking the Revised February 3, 2014 Copyright (c) 2013 4|P age Gazepoint Analysis User Manual Rev 2.0 Next photo requires rendering the entire page at once which may be visible as a slight flicker to the user. Move to the next web page in the media list or end the recording if at end. Figure 3 – Web Analysis Browser 2.4 Data analysis mode Figure 4 shows a screenshot of the analysis program main window. The data analysis mode is active when the Analyze Data button is pressed. The control buttons are as follows Analyze Data: Heatmap: Fixationmap: Gaze Video: Cam Video: Show Cursor: Show AOI: Export: Display Window: Start/Play/Stop/End: Time Slider: Duration: Revised February 3, 2014 Enter data analysis mode Visualize the recorded gaze data as a heat map (click again for multiple heatmap styles) Visualize the recorded gaze data as a fixation map Display the users face as an overlay on the image Display the video feed from a webcam if it was recorded Display the users cursor position as an overlay on the image Display the AOI regions as an overlay on the image Save the display output as a video, raw data as a CSV file and AOI statistics in the \result\ folder Graphically shows the gaze information at a particular point in time Manipulates the time slider Controls the current time position Specifies the duration (historical data) to show on screen Copyright (c) 2013 5|P age Gazepoint Analysis User Manual Rev 2.0 AOI List: List of AOI regions for the media item. Click + button to add and then drag mouse on Display Window to create. Click Calculate button to compute statistics. Figure 4 - Gazepoint Analysis Analyze Data Screenshot 2.4.1 User Data Settings The user data recordings can be modified during analysis to compensate for any potential offsets in the gaze data. Double click the recording user name, or click the settings button to bring up the user data settings dialog box. Figure 5 – User Data Settings Revised February 3, 2014 Copyright (c) 2013 6|P age Gazepoint Analysis User Manual Rev 2.0 2.4.2 Web Data Analysis Web pages can be recorded as a continuous video of the browser window visible to the user, as well as the entire static web page image. The web page image is blank (black) by default, unless a photo is taken of the whole page. When playing back web content, if the Zoom In button (magnifying glass with +) is pressed only the browser window video is shown as it was originally to the user. If the Zoom Out button is pressed then the entire static webpage is shown and the browser video is offset onto the page at the correct scroll position. When in the Zoom in mode, the Down arrow button links the users scroll to the web page scroll position slider on right. When aggregating multiple subjects viewing patterns, it may be desirable to focus on a fixed region of the web page where many people are looking rather than follow only one users scroll position. To aggregate subjects, simply click the check marks in the Recording list for the users and web pages to merge. You may also right click and select all the same pages by URL or TITLE. NOTE that the first user checked is used as the ‘background’ image, i.e. the static page and the video overlay, with all other subjects gaze data drawn on the first user’s image. As such, it may be beneficial to record the first user as simply a template, browsing the web pages of interest with Photo capture on. All subsequent users then do not need Photo capture as their gaze will be overlaid on the first user’s images. If the web page changed between users, aggregating gaze data in this fashion may not provide meaningful results. Figure 6 – Web Analysis Revised February 3, 2014 Copyright (c) 2013 7|P age Gazepoint Analysis User Manual Rev 2.0 2.4.3 Dynamic AOI Creation To create dynamic AOI’s, simply move the time slider to a sequence of time points and draw an AOI frame at each time point. The rectangular AOI frame will be dynamically interpolated between the time points. If only 1 AOI time point is created, the AOI will start at the start time and last the entire remainder of media time. If 2 or more AOI frames are created, the last time point is used as the end time for the AOI. To assist with creating dynamic AOI’s, the Copy Prev and Copy Next buttons will copy the AOI frame rectangle from the previous or next time point. Remember to REFRESH the AOI statistic calculations by clicking the refresh button at the bottom of the AOI List box shown in Figure 4. Figure 7 - Dynamic AOI Window 2.4.4 AOI Statistics A number of statistics are calculated on the AOI’s. These include: Viewed: 1st Viewed: Viewed Time: Revisitors: Revisits: # of viewers who looked at the AOI Average time to first view of the AOI Average time spent viewing the AOI # of viewers who looked at the AOI more than one time Average number of revisits made by the revisitors 2.4.5 Export Data Once data collection is complete, the recorded data may be exported in a variety of formats. User data is export in the CSV format to two files, XXXX-user.csv and XXXX-user-fix.csv (where XXXX is a number Revised February 3, 2014 Copyright (c) 2013 8|P age Gazepoint Analysis User Manual Rev 2.0 indicating the recording number). The XXXX-user.csv file contains every data record recorded which provides for the most detailed analysis. The XXXX-user-fix.csv files contains a subset of the data in which ONLY the fixations are listed which can simplify data analysis. If AOI’s are present, the CurrentAOIStatisticsX.csv files is created which lists the statistics for the AOI’s on a per user basis, as well as the average over all users selected. The X index is incremented by 1 each time the export operation is run to avoid overwriting previously exported results. The CurrentImageX.png is a copy of the static image currently on screen in the Analysis display window. The CurrentVideoX.avi is a video of the media item currently being viewed with the AOI, gaze, cursor, etc. overlaid on the content. Note that if you export a web page video that is 1920 x 20000 pixels (fairly common if lots of comments on the page), this video will be generated at the same large resolution and may take some time to render. If the Skip video option is checked, the system simply skips the video output for all subsequent export operations. Figure 8 – Export dialog Revised February 3, 2014 Copyright (c) 2013 9|P age Gazepoint Analysis User Manual Rev 2.0 3 Registration The Gazepoint Analysis software package provides a free 30 day trial of the Professional version features. Should you wish to continue to use these features after the 30 day trial, after purchasing the software you will need to register the computer that will host the software. Click the Register button shown in Figure 9 and copy the Hardware ID listed in the next dialog box. Click the Register Online button which will take you to an online form that will send the Hardware ID to Gazepoint and we will generate your Software Key e-mail it back to you. Enter the key into the dialog box and select Validate Key to complete registration. Figure 9 – Software Registration Figure 10 – Software Registration Key Revised February 3, 2014 Copyright (c) 2013 10 | P a g e Gazepoint Analysis User Manual Rev 2.0 4 Document Revisions 4.1 Version 2.0 Updated to cover new features in Gazepoint Analysis 2.0 4.2 Version 1.2 Updated to cover improved AOI creation 4.3 Version 1.1 Updated to include Professional Edition content Revised February 3, 2014 Copyright (c) 2013 11 | P a g e