1
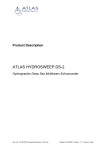
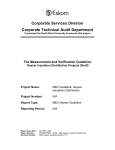
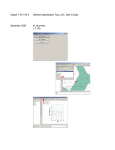
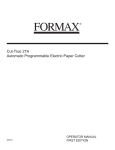
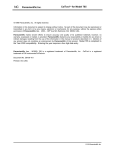
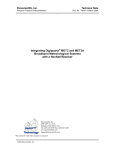
Centre for Space Research
Neutron Monitor User Manual
GJJ (Gert) Benadé
November 2011
Introduction
The Neutron Monitor (hereafter NM) is an instrument that records the arrival time of incident neutrons and
registers the counting rate per second and minute. These secondary neutrons form when cosmic rays enter the
earth's atmosphere. These neutrons penetrate down to ground level, where they are counted to determine the rate
as well as long term fluctuations.
Solar activity and other phenomena, such as the earth's magnetic field, can be studied by the cosmic-ray counts
(which are, in fact, particles and not rays). This is done to enhance our understanding of the heliospheric
processes that exist, and their influences on technologies such as satellites, GPS and communications systems
and the earth's climate.
Neutron monitors have existed for more than sixty years in various shapes and forms. This monitor is unique in
the sense that is portable and easily configured, since multiples of this single-tube version can be connected up
in a network to form a large, permanently installed NM. Once installed, the monitor can be configured by
software and remotely monitored via the internet.
Currently there exist four of these NMs. Two were built in 2002/2003, and the next two were built for the
German Polar Programme in 2011. Neutron Monitors 1 and 2 are used by the Centre for Space Research in
Potchefstroom at the North West University for their neutron monitor calibration project. Neutron Monitor 3 is
installed on the Neumayer base, and Neutron Monitor 4 on the Polarstern.
Lay-Out
The NM consists of the following sub-systems:
1.
Counter Tube Boron Tri-Fluoride (10BF-3) or Helium 3 (3HE). The Polarstern monitor uses a Helium
detector tube while the Neumayer NM uses a Boron Tri-Fluoride detector
2.
Moderator is the inside Poly-Ethylene tube that surrounds the detector tube of dimensions 100mm x 20mm
wall thickness. This is used to slow down the produced neutrons to the extent where they can react with the
gas inside the counter tube.
3.
Seven lead rings are housed around the moderator and inside the reflector. These rings of 195mm x 45mm
with a total weight of approximately 260kg act as a producer which increases the counting rate of the NM
by a factor of about three.
4.
Reflector is the outside “body” of dimensions 350mm dia. and 80mm wall thickness. This is used to block
low energy neutrons from terrestrial sources such as the natural radiation from the ground.
5.
A low-voltage power supply that supplies the system with 12, 5 and 3.3 V.
6.
High-voltage Power Supply Unit (powered from the 12V rail) that generates the high voltage for the
detector tube (1170 V for the 10BF-3 and 1470 V for the He-3 detector). This PSU is physically integrated
with the low-noise pre-amplifier.
7.
Control Board that houses the PIC32 microcontroller that controls the whole operation of the NM.
8.
Front panel LED display to give visual indication of system status and LCD screen for detailed
information.
9.
Paroscientific pressure transducer to accurately measure atmospheric pressure.
10. u-Blox GPS module to determine location of the counter.
11. Communication module to manage the RS-232 data lines from the Paroscientific, GPS and PC. This
module also interfaces the low noise pre-amplifier with the PIC32.
12. Data acquisition units; The NM contains a USB flash drive on top of the electronics head that functions as a
backup data storage. Two files get stored on this drive per day in a Year/Month directory structure. The first
file contains arrival time data of each count while the second file holds minute averages. The data is output
to the computer/laptop via a RS-232 port on the bottom of the unit at 19200 bps. This data stream contains
information about every second, the counts in that second and the position of counts taken.
2
Data Output
The NM outputs a data-string once every second via the RS-232 port on the bottom of the unit. The content is as
follows:
2011,332,19:29:27,00003,01470,22.340,868.013,2641.18971S,02705.63894E which translate into:
YEAR
DAY_NUMBER
GMT_TIME
COUNTS_FOR CURRENT_SECOND
HIGH_VOLTAGE
TEMPERATURE
ATMOSPHERIC_PRESSURE
LATITUDE
S/N
LONGDITUDE
E/W
- Year Number
- Day number of current year
- Greenwich Mean Time
- Number of counts for current GMT second
- Value of the high voltage generated by the HV PSU
- Temperature of the detector tube
- Atmospheric pressure measured in milli-Bar
- Latitude in decimal degrees
- South or North around the equator
- Longitude in decimal degrees
- East or West around the Greenwich Line
Assembly
Tools needed: 1x M10 Allen key; flat 4mm screw driver.
1. Carefully pull out the counter tube from the monitor body and remove protective material. Re-insert the tube
into the monitor body with the filling connection towards the bottom of the body.
2. The small cylindrical 'tube' (filler connection) must be vertically below the HN connector.
3. Remove two of the M10 cap screws at the top from the body of the monitor (as indicated on the body).
4. Lay the box flat on its back and loosen the six screws on the front and open the box carefully.
5. Insert the M10 cap screws into the top back of the box through the holes provided.
6. Bring the box up against the monitor body (back of box parallel to monitor end) and carefully connect the
HN connector on the pre-amplifier module to the counter tube. (Ensure that HN connector mates properly
with the thread on the tube.)
7. Insert the temperature sensor into the monitor body next to the tube into the slot provided.
8. Slide the tube and sensor into the body and bring up the box flush against monitor while guiding the M10
cap screws into the designated holes.
9. Use the M10 Allen key to screw the cap screws into the monitor body and tighten well.
10. Close the faceplate into position while ensuring the wiring inside does not catch in the process
11. Insert the six screws on the faceplate and tighten with 4mm flat screwdriver.
12. Connect the GPS antenna cable and the RS-232 cable from the computer.
13. Connect the GPS antenna to the other end of the cable (if not).
14. Connect the other end of the RS-232 cable to the computer.
15. Power up the computer.
16. Execute the monitor programme from the desktop icon in the Monitor directory.
17. Connect the NM power supply cord to the UPS (switched on and ready), connect the cord to the mains input
socket on the bottom of the NM head.
3
Front Panel
The coloured LED's on the front panel give the following indication (from left to right):
Red
CPU OK
Microcontroller software self-check is functional. This LED should light up every two seconds. If not,
cold boot the system by removing the power supply cord and wait 20 seconds before reconnect.
Green Press OK
Paroscientific pressure transducer is communicating with CPU. LED permanently lit if OK. If not, cold
boot complete system by removing power supply cord and wait 20 seconds before reconnection.
Blue
GPS OK
Global Positioning System device is communicating with CPU. LED permanently lit if OK. If not, reposition/check external antenna and connections and cold boot system to initialise low noise amplifier in
antenna.
Yellow Flash Drive Mounted
USB Flash drive is plugged in and mounted. LED permanently lit if OK. If LED does not light with
flash drive plugged in, switch NM off by removing power cord. Unplug the flash drive, and carefully
plug in the flash drive again. Re-power the unit. If not, reformat/replace flash drive with a FAT32
formatted flash drive.
White USB Busy
USB Flash drive is busy being accessed; do NOT remove while either yellow or white LEDs are lit.
PIC32 maintains a 100-count buffer between flash drive access operations. Once flash is removed by
pressing the “Eject” button, a 1000 count buffer is active to provide time for user to copy/format the
flash drive.
Opaque green Count registered
The detector tube has been struck by a neutron and the detector circuitry counted a single pulse.
Computer Interface
The computer interface receives data via the RS-232 port once every second and writes it to a file in the “data”
directory. The software then calculates one-minute averages of these per-second samples and writes that minute
average into a file, stored on the hard drive of the computer. The minute data is used to draw a graph of the past
24 hours.
At the right hand top of the screen, a text input box is provided to specify the serial device on the computer that
is to be used for data acquisition from the NM. After entering the correct device name, click the connect button
to start the acquisition.
After a few minutes of data acquisition, a graph should be visible of the past few minutes as well as previous
recorded data, with the current GMT (HH:mm:00 format) displayed at the right hand bottom of the graph axis.
As a routine check, ensure that the time displayed in the status menu is current with GMT. If the time is not
updating every second, restart the computer and the recording program and ensure that the input device name is
correct. The raw data received from the NM is displayed at the bottom of the screen in the information box
every second. This can be used to indicate a correct connection via the RS-232 port.
The selection buttons on the right hand side of the graph can be selected to display temperature, pressure and
high voltage graphs with the right axis on the graph automatically adjusting to each value.
4
Contact Details
Should you have any queries regarding the neutron monitors, the operation thereof or the research programme at
the North West University, please feel free to contact us via the following:
Professor Harm Moraal, Program Manager
[email protected]
Tel: +27182992402 (Office hours)
Gert Benadé, Technical Manager
[email protected]
Tel: +27182992407 (Office hours)
Cell: +27711972552 (Emergency after hours)
5