1
DEMO6 - dD6.6 Halfway
assessment of smart
solar district
This project has received funding from the European Union’s Seventh Framework Programme
for research, technological development and demonstration under grant agreement n°268206.
DEMO6 - dD6.6 Halfway assessment of the smart solar district
ID & Title :
dD6.6 Halfway assessment of the smart solar district
Version :
V1.0
Number of pages :
263
Short Description
This deliverable aims at presenting the halfway assessment of the demonstrator: installations on site,
experiment and first results. Storage assets, PV panels, measurement devices and OLTC transformer
are presented.
Revision history
Version
Date
V0.1
01/06/2014
V0.2
01/10/2014
V1.0
21/10/2014
Modifications’ nature
Document initialization
Integration of reviewers’ comments
Final version
Author
ERDF, EDF, SOCOMEC
ERDF, EDF, SOCOMEC
ERDF, EDF, SOCOMEC
Accessibility
Public
Consortium + EC
Restricted to a specific Group + EC
Confidential + EC
If restricted, please specify here the group
Owner / Main responsible
Name (s)
Christophe LEBOSSE
Thomas DRIZARD
Function
Company
Technical coordination
of DEMO 6
ERDF
Visa
Author (s) / Contributor (s) : Company name (s)
ERDF, EDF, SOCOMEC
Reviewer (s) : Company name (s)
Company
Visa
Review validated by Technical Committee on October 21
2014
CEZ Distribuce
Approver (s) : Company name (s)
Company
CEZ Distribuce, ENEL Distribuzione, ERDF,
IBERDROLA Distribucion, RWE, VATTENFALL
Eldistribution
Work Package ID: DEMO6
Tuesday, 21 October 2014
Visa
st
Approved by Steering Committee on October 21 2014
Task ID: DEMO6.4
2
st
DEMO6 - dD6.6 Halfway assessment of the smart solar district
Table of content
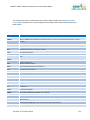
LIST OF FIGURES................................................................................................. 6
1 INTRODUCTION AND SCOPE OF THE DOCUMENT....................................... 9
1.1 Scope of the Document ............................................................................... 9
1.2 Structure of the Document ........................................................................... 9
1.3 Acronyms ................................................................................................... 10
2 ASSESSMENT OF HARMONICS INJECTION AND DECENTRALISED
VOLTAGE CONTROL FUNCTIONS ................................................................ 13
2.1 Halfway assessment of harmonics injections............................................. 13
2.1.1 Harmonics injection in a substation with a lot of connected PV
production ........................................................................................ 13
2.1.2 Observation on the harmonic voltages ............................................ 14
2.1.3 Analysis ........................................................................................... 15
2.1.4 Influence of 140 kWp PV generator connection ............................... 19
2.1.5 Results 23
2.2 Measuring devices installed and decentralized PV .................................... 24
2.2.1 Introduction ...................................................................................... 24
2.2.2 Potential impact of customer engagement on the voltage ............... 25
2.2.3 Usage of the LINKY smart meter ..................................................... 27
2.2.4 Usage of the PME-PMI meters ........................................................ 36
2.2.5 Usage of the ALPTEC measuring devices ....................................... 38
2.2.6 Usage of PowerFactory to extend the results .................................. 42
2.2.7 Conclusion ....................................................................................... 43
2.2.8 Appendices ...................................................................................... 44
3 ASSESSMENT OF THE BATTERIES AND INVERTERS EXPERIMENTS ..... 73
3.1 Halfway assessment of the grid storage assets ......................................... 73
3.1.1 Introduction to the storage assets .................................................... 74
3.1.2 Characteristics of the Primary Substation Battery (PSB) ................. 77
3.1.3 Installation ....................................................................................... 88
3.1.4 Risk analysis .................................................................................... 93
3.1.5 Control and operation principles ...................................................... 98
3.1.6 Communication and Human Machine Interface (HMI) ................... 101
3.1.7 First results of the PSB .................................................................. 106
Tuesday, 21 October 2014
3
DEMO6 - dD6.6 Halfway assessment of the smart solar district
3.1.8 Overview of the status of the other storage assets ........................ 107
3.1.9 Conclusion ..................................................................................... 110
3.1.10 Glossary ........................................................................................ 111
3.1.11 Appendices .................................................................................... 115
3.2 Halfway assessment of grid batteries and converters experiments ......... 121
3.2.1 Technical reminders ...................................................................... 124
3.2.2 Equipment description ................................................................... 125
3.2.3 Tests description & results ............................................................. 137
3.2.4 References ..................................................................................... 195
3.3 Results of electrical tests on individual batteries ...................................... 196
3.3.1 Context ............................................................................................196
3.3.2 Results........... ................................................................................. 197
3.3.3 Conclusion ...................................................................................... 210
3.3.4 External documents ........................................................................ 211
3.4 Halfway assessment of the OLTC transformer ......................................... 212
3.4.1 Choice of the OLTC transformer in the NICE GRID project ............ 213
3.4.2 Integration of the OLTC transformer to the project.......................... 216
3.4.3 Development and installation of the OLTC transformer .................. 217
3.4.4 Conclusion ...................................................................................... 223
4. ASSESSMENT OF THE PV ONSITE INSTALLATION ................................. 224
4.1 Review of the PV implementation process and of PV installations
performed.............. .................................................................................. 225
4.1.1 NICE GRID: an ambitious photovoltaic power project on a voluntary
basis.......... .................................................................................... 225
4.1.2 Recruitment process established by EDF ....................................... 225
4.1.3 Description of the “Smart solar equipment” offer ............................ 226
4.1.4 Definition and establishment of the specifications for PV installers 226
4.1.5 Identification of solar potential and site analysis ............................. 227
4.1.6 Definition and application of a set of technical requirements for
potential customers........................................................................ 227
4.1.7 Verification of the conformity of the technical proposals with the
project criteria ................................................................................ 228
4.1.8 Verification of conformity of the proposals with the work performed 228
4.1.9 Establishment of a panel of NICE GRID installers with specific
specifications for the NICE GRID requirements ............................. 228
Tuesday, 21 October 2014
4
DEMO6 - dD6.6 Halfway assessment of the smart solar district
4.1.10 Formalization of EDF's commitment to its customers taking part in
the NICE GRID experiment ........................................................... 229
4.1.11 PV installations performed and feedback ...................................... 229
4.1.12 Main documents used in the process............................................ 232
4.2 Offers proposed by EDF to customers to encourage the introduction of PV
................................................................................................................236
4.2.1 Description of the offers .................................................................. 237
4.2.2 Results obtained for the first summer 2014: ................................... 240
4.3 Individual battery management ................................................................ 240
4.3.1 Introduction: Scope of tests ............................................................ 240
4.3.2 Description of tested equipment ..................................................... 241
4.3.3 Description of the installations and the test instrumentation ........... 249
4.3.4 Test conditions ................................................................................ 251
4.3.5 Test procedure ................................................................................ 252
4.3.6 Test results and analysis/interpretation........................................... 253
4.4 Conclusion................................................................................................ 258
4.5 Appendices............................................................................................... 260
4.5.1 Appendix 1 ...................................................................................... 260
4.5.2 Appendix 2 ..................................................................................... 262
4.6 References ............................................................................................... 263
Tuesday, 21 October 2014
5
DEMO6 - dD6.6 Halfway assessment of the smart solar district
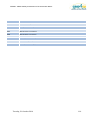
List of figures
Figure 1: Instrumentation diagram of the Dock Trachel substation .................................. 14
Figure 2: Thursday 2013/08/22 measurements ....................................................................... 16
Figure 3: Saturday 2013/08/24 measurements ........................................................................ 17
Figure 4: Saturday 2013/06/22 measurements ........................................................................ 17
Figure 5: Sunday 2013/06/09 measurements............................................................................ 18
Figure 6: Sunday 2013/04/14 measurements............................................................................ 19
Figure 7: H5 voltage harmonic (resolution: 10 min) - October and November ............. 19
Figure 8: H5 voltage harmonic average values - October and November ........................ 20
Figure 9: 5th rank voltage harmonics November 2013, 5, 6 and 7 ...................................... 20
Figure 10: Consumption at the Dock Trachel substation (W) November 2013 from 1st
to 13th .......................................................................................................................................................... 21
Figure 11: H7 voltage harmonic (resolution: 10min) - October and November............ 21
Figure 12: H7 voltage harmonic average values - October and November...................... 21
Figure 13: H7 voltage harmonic (V1) November 2013 from 6th to 17th ............................ 22
Figure 14: Consumption at the Dock Trachel substation (W) November 2013 from 1st
to 17th (highlighting 9-10-11 and 16-17) ...................................................................................... 22
Figure 15 - Voltage range..................................................................................................................... 24
Figure 16 - Consumption and production curve......................................................................... 25
Figure 17 - Consumption and production curve adjusted ...................................................... 26
Figure 18 - linky infrastructure ......................................................................................................... 27
Figure 19 - Voltage measurement at +/- 10% for a one phase meter ................................ 28
Figure 20 - Voltage measurement for a three phase meter.................................................... 29
Figure 21 - Voltage measurement .................................................................................................... 30
Figure 22 - Cailletiers substation...................................................................................................... 31
Figure 23 - Pesquier substation ........................................................................................................ 31
Figure 24 - Dock trachel substation................................................................................................. 32
Figure 26 - Plaine 1 substation .......................................................................................................... 33
Figure 25 - Colombie substation ....................................................................................................... 33
Figure 27 - Lou Souleou substation ................................................................................................. 34
Figure 28 - Rosemarines substation ................................................................................................ 34
Figure 29 - Resulting load curve at “Dock Trachel” secondary substation ...................... 75
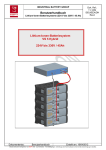
Figure 30 - Storage asset at the primary substation ................................................................. 77
Figure 31 - Battery container composition................................................................................... 78
Figure 32 - Battery container structure ......................................................................................... 79
Figure 33 - Single Line diagram of the battery container ....................................................... 79
Figure 34 - Single Line Diagram of the PCS Container ............................................................. 81
Figure 35 - Single line diagram of the storage transformer ................................................... 82
Figure 36 - Telecom architecture for the PSB storage asset .................................................. 83
Figure 37 - MV grid connection of the PSB storage asset ........................................................ 84
Figure 38 - Grid connection of the auxiliary supply .................................................................. 85
Tuesday, 21 October 2014
6
DEMO6 - dD6.6 Halfway assessment of the smart solar district
Figure 39 - Circuit breaker and meter for the auxiliary feeder ............................................ 85
Figure 40 - Single Line Diagram for the PCS AUXILIAIRIES ................................................... 86
Figure 41 - Single Line Diagram for the battery container auxiliaries ............................... 87
Figure 42 - Civil works for the PSB storage asset....................................................................... 91
Figure 43 - Installation phase for the PSB storage asset ......................................................... 91
Figure 44 - Fire Suppression System (FSS) .................................................................................. 94
Figure 45 - Exterior fence .................................................................................................................... 96
Figure 46 - Fenced area ........................................................................................................................ 96
Figure 47 - Device for Exchanging Operational Information (DEIE) .................................. 99
Figure 48 - Localisation of the emergency stop push button ................................................ 99
Figure 49 - Regional Control Centre ............................................................................................. 100
Figure 50 – Selection table ............................................................................................................... 101
Figure 51 - Architecture .................................................................................................................... 102
Figure 52 - Main screen of the storage HMI .............................................................................. 103
Figure 53 - Battery box within the storage asset HMI ........................................................... 104
Figure 54 – PCS box of the storage asset HMI........................................................................... 104
Figure 55 - Instruction box of the storage asset HMI ............................................................ 105
Figure 56 - Output power box of the storage asset HMI....................................................... 105
Figure 57 - Event Box of the Storage asset HMI ....................................................................... 106
Figure 58 - Parallel cabinet in the "Dock Trachel” secondary substation ..................... 108
Figure 59 - Built container at SOCOMEC factory in Benfeld................................................ 109
Figure 60 - Grid connection for the LVGB near Cailletiers secondary substation ...... 109
Figure 61: Residential energy storage system diagram ....................................................... 196
Figure 62: Indoor and outdoor versions of the battery ........................................................ 198
Figure 63: Single line electrical diagram .................................................................................... 200
Figure 64: Safety distance around the battery (in mm)........................................................ 201
Figure 65: Example of additional labels ...................................................................................... 203
Figure 66: Inverter conversion instantaneous efficiency .................................................... 209
Figure 67: Battery charge/discharge efficiency....................................................................... 209
Figure 68: 13-2400-mu outdoor intensium home -v2 - fr.pdf ........................................... 211
Figure 69: MPS-ZE-HK-VDE01261A1VFR13-fr-15 déclaration SMA conformité
DIN.pdf ..................................................................................................................................................... 211
Figure 70 - Classic transformer technical specifications ...................................................... 216
Figure 71 - regulation box of OLTC transformer ..................................................................... 217
Figure 72 - Built OLTC transformer .............................................................................................. 218
Figure 73 - Location of the main solar districts ....................................................................... 219
Figure 74 - Entrance of Cailletiers secondary substation .................................................... 220
Figure 75 - Photo of the actual transformer at Cailletiers secondary substation ....... 221
Figure 76 - Photo of Cailletiers secondary substation........................................................... 222
Figure 77 - Plan of the Cailletiers secondary substation ...................................................... 223
Figure 78. SAFT "indoor" battery .................................................................................................. 243
Figure 80. Sunny Island and Sunny Remote Control (SRC) ................................................. 244
Figure 81. EDELIA gateway ............................................................................................................. 245
Figure 82. TIC MC11 reader ............................................................................................................. 245
Tuesday, 21 October 2014
7
DEMO6 - dD6.6 Halfway assessment of the smart solar district
Figure 83. Final prototype architecture (doc [3]) ................................................................... 248
Figure 84. Single-line diagram of the installation in the MM-E laboratory – Indoor
battery ...................................................................................................................................................... 250
Figure 85. Single-line diagram of the installation in the ConceptGrid- Outdoor battery
..................................................................................................................................................................... 251
Figure 86. Single-line diagram of the complete installation in the laboratory ............ 252
Figure 87. Table of changes in the management algorithm ................................................ 252
Figure 88. Testing scheme with PLC plugs ................................................................................ 256
Figure 89. Outdoor battery at the Conceptgrid laboratory ................................................. 262
Figure 90. Indoor battery at the MM-E laboratory ................................................................. 263
Tuesday, 21 October 2014
8
DEMO6 - dD6.6 Halfway assessment of the smart solar district
1 Introduction and scope of the
document
1.1 Scope of the Document
This document aims at presenting the halfway assessment of demo 6, covering the measurement
devices, the storage assets, the OLTC transformer and the recruitment process. First results are
presented: power flow computations, harmonics measurements, battery efficiency. Results of
battery testing are also presented.
1.2 Structure of the Document
The document is organized in three main sections
The first section covers the measurements and first results related to measurement devices.
Section 2.1 covers the assessment of harmonics injection, relying on an advanced metering
infrastructure installed on the grid by EDF R&D. Section 2.2presents the different measuring
devices installed on site on the main findings related to them. Power flow computation and
principles on the low voltage grid are also presented.
The second section describes the laboratory tests and first installations of devices on the
grid: grid batteries, residential batteries and OLTC transformer. Section 3.1 gives a feed back
of the first large scale storage asset installed on site. Section 3.2 is a report of the laboratory
testing of the 33 kW battery container which will be installed on site near Cailletiers and Colombie
secondary substation. Section 3.3 is a report of the laboratory testing of the residential battery.
Section 3.4 presents the main principles and the actual status of the On Load Tap Cha nger
transformer to be installed at Cailletiers secondary substation
The third section is an assessment of the PV onsite installation, including the presentation of
the different offers by EDF
Tuesday, 21 October 2014
9
DEMO6 - dD6.6 Halfway assessment of the smart solar district
1.3 Acronyms
ACR
Agence Conduite Régionale = Regional Control Center
AGDP
Automatic Grid Disconnection Protection.
AID or AIP
Anti-Islanding Device or Protection
AMEPS
Agence de Maintenance et Exploitation des Postes Sources = Agency for
maintenance and operation of primary substation
AREX
Agence d’Exploitation Réseau = Agency for grid operation
BMM
Batteries Management Module (SAFT)
BPL
Broadband over Power Lines (Modem ALSTOM)
BPL
Broadband over Power Lines (Modem ALSTOM)
CAN
Controlled Area Network
CB
Circuit Breaker
DEIE
Dispositif d’Echange d’Information d’Exploitation = device used to opean remotely
the main circuit breaker of the storage asset
DREAL
Direction Régionale de l'Environnement, de l'Aménagement et du Logement =
Regional Directorate for Environment, Planning and Housing
DSO
Distribution System Operator
ECSE
Energy Converter & Storage Equipment (SOCOMEC Converter + SAFT Batteries)
EMS
Energy Manager System (~NEM & NBA in the Nice Grid Project)
ESSU
Energy Storage System Unit (SAFT String Batteries)
FCU
Field Control Unit (ALSTOM)
FSS
Fire Safety System.
GDP
General Distribution Panel.
Tuesday, 21 October 2014
10
DEMO6 - dD6.6 Halfway assessment of the smart solar district
HMI
Human Machine Interface.
HVAC
Heating Ventilation Air Conditioning.
ICPE
Classified Installations for the Protection of Environment
IMD
Maximum Discharge Current.
IMR
Maximum Charge Current (max 5 seconds).
IMR_C
Maximum Continuous Charge Current.
LBS
Load Break Switch.
LV
Low Voltage
LVGB
Low Voltage Grid Battery
MBMM
Master Batteries Management Module (SAFT)
MCU
Master Control Unit (ALSTOM)
MV
Medium Voltage
NBA
Network Batteries Aggregator (which controls the operation of grid batteries)
NEM
Network Energy Manager
PCB
Parallel Circuit Breaker
PCS
Power Converter System
PCS²
Power Converter & Storage System (SOCOMEC)
PDO
Process Data Object (CANOpen)
PLC
Power Line Communication Carrier
PSB
Primary Substation Battery
PV
PhotoVoltaic
Tuesday, 21 October 2014
11
DEMO6 - dD6.6 Halfway assessment of the smart solar district
RPDO
Received Process Data Object (CANOpen)
SC
Short-Circuit
SDO
Service Data Object (CANOpen)
SMU
Safety and Monitoring Unit (electronic board inside each battery module)
SOC
State Of Charge of the batteries.
SOH
State Of Health of the batteries
SOH
State Of Health of the batteries.
SPD
Surge Protection Device.
SSB
Secondary Substation Battery
TSDO
Transmitted Service Data Object (CANOpen)
TSO
Transmission System Operator.
UPS
Uninterruptible Power Supply.
VFRT
Voltage Fault Ride Through
VMD
Maximum Charge Voltage
VMR
Minimum Discharge Voltage
Tuesday, 21 October 2014
12
DEMO6 - dD6.6 Halfway assessment of the smart solar district
2 Assessment of harmonics injection and
decentralised voltage control functions
2.1 Halfway assessment of harmonics injections
2.1.1 Harmonics injection in a substation with a lot of
connected PV production
Context
The realization of Smart Grids, able to accept many low power producers and to implement
flexibility both in network operation and load management, is facing news challenges in terms of
power quality. Indeed, such networks are based on numerous innovations in various fields,
including in particular the power electronics. Consequences in terms of wave quality are strong
because power electronics-based systems cause harmonics and distributed generation in general
increases the stress on LV voltage control within +/- 10%.
Quality can also be degraded when the short circuit power available is low – especially during
islanding – or when there is a risk of voltage harmonic resonances. Nice Grid demonstrator allows
an overall assessment of the true quality of the supplied electric wave and impacts of new uses on
the electric wave.
To assess the quality of the electric wave, it is necessary to measure voltage, current and
harmonics at different points of the network.
The purpose of this chapter is to evaluate the temporal correlation between the harmonic overvoltages observed and the photovoltaic generation at the Dock Trachel HV/LV substation,
especially after the connection of a 140 kWp PV generator. Harmonics on the network are
measured before and after the connection of this new PV generator to analyze its effects.
Instrumentation
Measurement equipment (Alptec 2444i) has been installed at the Dock Trachel substation for over
a year to measure variations of power demand (3s aggregation points) to determine the
performances of the future battery inverters or other islanding systems and to measure harmonic
voltages and currents at the station.
Currently, the data reported are:
th
10 minute interval harmonics up to the 50 rank,
3 second interval following data:
o Single voltage V1Mean
o Single voltage V2Mean
o Single voltage V3Mean
o Phase-phase voltage U12Mean
o Phase-phase voltage U23Mean
o Phase-phase voltage U31Mean
o Frequency f1Mean
o Frequency f2Mean
Tuesday, 21 October 2014
13
DEMO6 - dD6.6 Halfway assessment of the smart solar district
o
o
o
o
o
o
o
o
o
Frequency f3Mean
Active power P1Mean
Active power P2Mean
Active power P3Mean
Active power PTriMean
Reactive power Q1Mean
Reactive power Q2Mean
Reactive power Q3Mean
Reactive power QTriMean
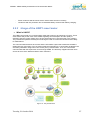
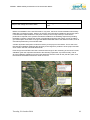
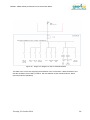
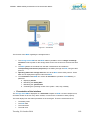
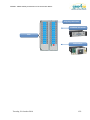
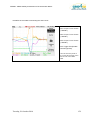
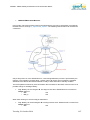
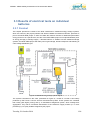
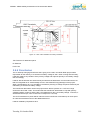
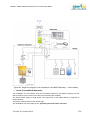
Figure 1: Instrumentation diagram of the Dock Trachel substation
On Figure 1, each PV generator corresponds to the sum of small three-phased PV production units
with a power from 10 to 15 kWp. So, the global tested network is composed of around 40 PV
inverters from different manufacturers.
2.1.2 Observation on the harmonic voltages
th
th
The rank 5 and 7 of the harmonic voltages are indicative of the power electronics quality. That is
why threshold overrun for these two ranks has been examined particularly. The rms values of
harmonic voltages averaged over 10 minutes must not exceed 6% for rank 5 and 5% for rank 7
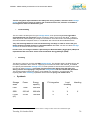
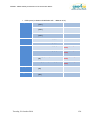
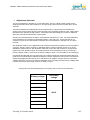
(EN 50160 standard). The table below reflects the overruns for these harmonics from September
2012 to September 2013.
N°
5
6
8
14
15
Event type
Harmonic [7]
Harmonic [7]
Harmonic [5]
Harmonic [5]
Harmonic [5]
Tuesday, 21 October 2014
Date
2013/04/14
2013/04/14
2013/06/09
2013/06/09
2013/06/09
Hour
15:50:00:16
15:20:00:14
18:10:00:18
07:40:00:15
06:40:00:10
Phase
3
3
2
2
2
Peak (V)
12.01
11.66
14.17
14.17
14.09
Duration
10min
10min
50min
40min
40min
14
DEMO6 - dD6.6 Halfway assessment of the smart solar district
16
6
7
4
5
23
21
22
18
19
20
16
17
14
15
9
10
11
12
13
Harmonic [5]
Harmonic [5]
Harmonic [5]
Harmonic [5]
Harmonic [5]
Harmonic [5]
Harmonic [5]
Harmonic [5]
Harmonic [5]
Harmonic [5]
Harmonic [5]
Harmonic [5]
Harmonic [5]
Harmonic [5]
Harmonic [5]
Harmonic [5]
Harmonic [5]
Harmonic [5]
Harmonic [5]
Harmonic [5]
2013/06/09
2013/06/10
2013/06/10
2013/06/22
2013/06/22
2013/08/19
2013/08/20
2013/08/20
2013/08/21
2013/08/21
2013/08/21
2013/08/22
2013/08/22
2013/08/23
2013/08/23
2013/08/24
2013/08/24
2013/08/24
2013/08/24
2013/08/24
06:20:00:19
05:50:00:03
05:30:00:13
07:50:00:17
06:00:00:07
07:20:00:00
06:50:00:18
06:30:00:16
07:40:00:18
06:50:00:00
06:50:00:00
06:40:00:15
06:40:00:15
06:50:00:00
06:40:00:10
06:30:00:18
06:30:00:18
05:20:00:02
04:00:00:00
04:00:00:00
2
1
2
2
1
1
2
1
1
2
1
1
2
2
1
1
2
2
2
1
14.25
14.93
14.84
14
14.95
13.86
13.97
14.19
13.96
14.45
14.35
14.82
14.73
14.16
14.02
15.15
15.08
14.36
14.87
15.1
10min
30min
50min
30min
2h30min
10min
30min
50min
10min
30min
30min
40min
40min
30min
40min
1h50min
2h40min
40min
1h10min
2h
We can see that over a year, 10 days have slightly exceeded the voltage harmonic level for the 5
th
and 7 ranks.
th
2.1.3 Analysis
th
5 rank harmonic
The purpose of this analysis is to test whether such harmonic peaks are synchronous with high
photovoltaic production.
Tuesday, 21 October 2014
15
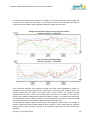
DEMO6 - dD6.6 Halfway assessment of the smart solar district
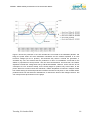
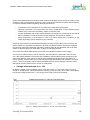
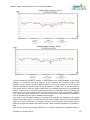
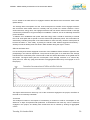
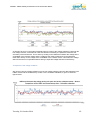
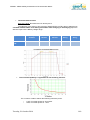
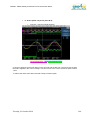
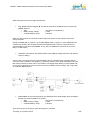
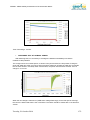
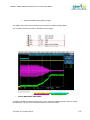
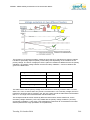
Figure 2: Thursday 2013/08/22 measurements
Figure 2 shows the production of one PV infrastructure connected to the substation (DORO: 190
th
kWp), the power drawn off at the distribution substation and the relative amplitude of 5 rank
harmonic voltages (for the 3 phases). This business day shows a smooth PV generation, a
cloudless day. We can assume that the production of other PV installations connected to this
station is proportional to that producer. We can notice that between 7am and 8am, the relative
amplitude exceeds the voltage limits set by EN 50160 standard. However, these overruns do not
correspond to a PV inverters startup, as the facility begins to produce only around 8am, at low
power. When PV inverters reach their maximum, relative amplitudes of harmonic voltages remain
low. Indeed having an electrical production increases the short-circuit power. In the condition where
production does not emit harmonic disturbances, it reduces the levels of H5 voltage harmonic. We
can clearly see this phenomenon on the graph.
Tuesday, 21 October 2014
16
DEMO6 - dD6.6 Halfway assessment of the smart solar district
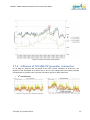
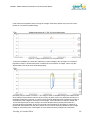
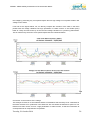
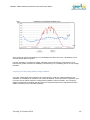
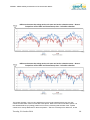
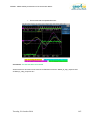
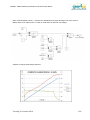
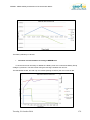
Figure 3: Saturday 2013/08/24 measurements
Figure 3 shows measurements for August 24, 2013, with a turbulent production. But as August 22,
relative amplitude overruns of harmonic voltages are over the 6% limit well before the start of the
PV production. Moreover, as before, the PV production increases the short-circuit power and limits
H5 voltage harmonics.
To ensure that the measurement equipment clock has not offset from the production meters clocks,
we have also analyzed measurement from the SMB / SMI (Small and Medium Businesses / Small
and Medium Industries) meter installed at the Dock Trachel substation. As seen on Figure 4, the
measurements from the SMB / SMI meter and the ones from the Alptec (P TriMean) are completely
synchronous.
Figure 4: Saturday 2013/06/22 measurements
For all overruns of 5
th
rank harmonic voltages noted, this happened before the start of PV
Tuesday, 21 October 2014
17
DEMO6 - dD6.6 Halfway assessment of the smart solar district
production, except Sunday, June 9, with a very slight overrun negligible at 18:10, on a day when
the production is very turbulent (see Figure 5).
Figure 5: Sunday 2013/06/09 measurements
Moreover, these early morning overruns appear to be independent of the day of the week. Indeed,
they have been observed on a Sunday, as well as a Monday or even a Thursday…
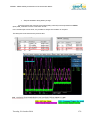
th
7 rank harmonic
th
Figure 6 shows an overrun of the relative amplitude of the 7 rank voltage harmonic (slight overrun
of 5%). However this overrun between 3pm and 4pm is of very low significance. The reactive
power presents a slight drop and at the same time H7 voltage harmonics levels drop as well
(around 4pm). This could possibly be due to a harmonic resonance related to capacitor banks of
reactive compensation. This assumption remains to be confirmed.
Tuesday, 21 October 2014
18
DEMO6 - dD6.6 Halfway assessment of the smart solar district
Figure 6: Sunday 2013/04/14 measurements
2.1.4 Influence of 140 kWp PV generator connection
A 140 kWp PV producer was connected to the Dock Trachel substation at 2013/11/07. The
th
th
objective of this subchapter is to observe the 5 and 7 rank voltage harmonics between October
and November to analyze if this connection has had an impact on these harmonics.
th
5 rank harmonic
Figure 7: H5 voltage harmonic (resolution: 10 min) - October and November
Tuesday, 21 October 2014
19
DEMO6 - dD6.6 Halfway assessment of the smart solar district
Figure 8: H5 voltage harmonic average values - October and November
We can see that the average values of H5 voltage harmonics for November are lower than the
ones for October. We can just notice a slight increase of these values on November 6, 7 and 8, but
then to drop back to same values than October.
th
Figure 9: 5 rank voltage harmonics November 2013, 5, 6 and 7
In Figure 10, we can notice that the commissioning of the 140 kWp producer did not result in
significant changes in the consumption of the substation. The production of November 7 seems
higher than the one of November 5 and 6 (in view of consumption values), but remains below the
production of a few days at the beginning and middle of the month.
Tuesday, 21 October 2014
20
DEMO6 - dD6.6 Halfway assessment of the smart solar district
st
Figure 10: Consumption at the Dock Trachel substation (W) November 2013 from 1 to 13
th
th
So 5 rank voltage harmonics decrease during the month without matching, a priori, a strong PV
production, we cannot conclusively determine the cause of this increase in these voltage
harmonics of November 7 and 8.
th
7 rank harmonic
th
As for 5 rank, the average values of voltage harmonics are lower in November than in October.
We do not see a sudden rise on November 7.
Figure 11: H7 voltage harmonic (resolution: 10min) - October and November
Figure 12: H7 voltage harmonic average values - October and November
Tuesday, 21 October 2014
21
DEMO6 - dD6.6 Halfway assessment of the smart solar district
However, we can notice that on November 9-10-11 and 16-17, the values of 7
harmonic seem a bit higher (Figure 13).
th
Figure 13: H7 voltage harmonic (V1) November 2013 from 6 to 17
th
rank voltage
th
When we have a look at the load curve at the substation (
Figure 14), we can see that these days correspond to lower consumptions (and a priori larger
productions).
st
th
Figure 14: Consumption at the Dock Trachel substation (W) November 2013 from 1 to 17 (highlighting 9-1011 and 16-17)
Tuesday, 21 October 2014
22
DEMO6 - dD6.6 Halfway assessment of the smart solar district
2.1.5 Results
th
All overruns of 5 rank voltage harmonics level appear before the start of PV production (between
4am and 7:50am at the latest). Increases of the voltage harmonics level do not appear to be
temporally correlated with PV generation contrarily to the drops of voltage harmonics levels.
Indeed, the PV production increases the short-circuit power without emitting harmonic
disturbances, it allows reducing the H5 voltage harmonics.
Currently, it is not possible to know the cause of threshold overruns. Future instrumentation of all
feeders will allow knowing if the overruns come from a single feeder, and therefore a specific
consumer.
After the connection of a new 140 kWp generator on the Dock Trachel substation, average values
th
th
of 5 and 7 ranks voltage harmonics are lower on November than on October. There is a slight
th
th
th
increase in 5 rank voltage harmonics between November 6 and 7 , but since these levels
decrease for the rest of the month and do not correspond to an increase in production, we cannot
conclude on the origin of this low increase. On the other hand, we can see a very slight increase of
th
7 rank voltage harmonics on days where consumption is more negative (a fortiori higher
production).
These data do not support the hypothesis that connecting a 140 kWp PV producer impacts the
harmonic levels but encourages us to monitor these phenomena, with more data (including
production data and data for each feeder) and on sunny summer days.
Tuesday, 21 October 2014
23
DEMO6 - dD6.6 Halfway assessment of the smart solar district
2.2 Measuring devices installed and decentralized
PV
2.2.1 Introduction
ERDF is responsible for the quality and the continuity of the electricity supply in France. Thanks to
its management of the low and medium voltage networks, the quality of supply in France is one of
the best in Europe. Still, the company has to keep investing and innovating namely in order to
adapt the network to the ever increasing penetration rate of renewable production on the
distribution level.
Several indicators have been implemented to assess and improve the quality of the electricity
supply. The ‘Critère B’ is one of the best examples, it was created to curb the average outage time.
But outage time is not the only indicator of a good quality of supply, voltage is also very important
as recurring and large increases or decreases in voltage can damage appliances. That is why the
voltage delivered to the end consumer has to be kept within an acceptable range. This range was
set to 230 +/- 10% via a European and French decree.
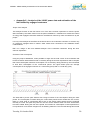
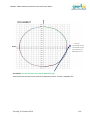
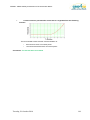
Figure 15 - Voltage range
It is important to keep in mind that this range refers to an average of the voltage over ten minutes.
This means that the voltage can actually increase to more than 230 +10% for a few seconds (even
minutes) as long as the 10-minute average remains lower.
The constraints regarding the quality of electricity supply have been set so that consumers have
access to a reliable source of electricity that will not damage their equipments, but these are not
the only constraints that ERDF has to deal with. Indeed, ERDF must also ensure that the network
is operated within the constraints of its different components. These constraints usually translate in
a maximum amount of electricity that can transit through each element, such as lines and
transformers, and breaching those constraints eventually results in damages to said equipments.
Tuesday, 21 October 2014
24
DEMO6 - dD6.6 Halfway assessment of the smart solar district
To manage the grid and ensure the respect of the different constraints, ERDF needs to carefully
monitor the grid. In this deliverable, we look at the different measuring devices used in NICE GRID
and then use them to assess the evolution of the voltage on the grid in the project and to analyse
the efficiency of the voltage control methods tested in the project.
2.2.2 Potential impact of customer engagement on the
voltage
Voltage and load curve
Historically, the French network was built to transport the electricity from a few large producers to a
great number of consumers. This led to the creation of a distribution network designed to supply
electricity to the consumers connected to the medium or low voltage networks. Thus, as every
consumption of electricity leads to a decrease in the voltage, one of the main issues when building
the distribution network was to ensure that the voltage did not drop under 230V -10%. Indeed the
only increases in voltage between phase and neutral were due to the network phases being
unbalanced, and they were rare.
This paradigm is now changing as the penetration rate of the production on the distribution network
is increasing, namely thanks to PV production. When the penetration rate is high enough,
production can at certain times overcome consumption on a low voltage feeder leading to an
increase in voltage rather than a decrease. As the network was not designed with this possibility in
mind, the 230V +10% threshold can sometimes be breached – this is even more likely in areas
where the balance of the phases has not been respected.
The fact that most of the production connected to the low voltage network is PV makes this even
more likely. Indeed, PV production tends to be installed in residential areas where the demand is
quite low when the PV production is maximal (midday).
Figure 16 - Consumption and production curve
The importance of the residential areas when it comes to the integration of PV production is
reflected in the NICE GRID project by the presence of six residential areas among the seven solar
Tuesday, 21 October 2014
25
DEMO6 - dD6.6 Halfway assessment of the smart solar district
1
districts of the project. In each of these solar districts, the project is experimenting innovative ways
of matching the solar production curve with the demand curve in order to mitigate the risk of
overvoltages. While new technologies are necessary to the integration of PV production, the
project lays the emphasis on the importance of engaging the customer in the process.
Engaging the customer
Engaging the customers and having them participate in the experiments is one of the main
objectives of the NICE GRID project. Indeed, while technologies such as batteries can be used to
move part of the production to the peak consumption period, engaged customers can move some
of their consumption to the production period without requiring complex devices such as batteries.
Moving consumption so that the load better matches the production on the low voltage network is
an efficient way of mitigating the risk of an increase in voltage. Indeed, it can prevent the
production from overcoming the demand. This highlights the tight links that exist between local load
curves and local voltage variations as well as the importance of the social dimension of the project
for its scientific results.
Figure 17 - Consumption and production curve adjusted
To engage the customers who live in areas where PV production could be a problem, the project
has put in place several experiments that all rely on the idea of ‘solar off-peak periods’. Every
summer, forty days are selected as ‘solar days’ and on these days, the customers taking part in the
project benefit from four additional off-peak hours between 12pm and 4pm. Depending on the
customer’s level of involvement in the project, these hours are used differently:
-
1
Some customers will only be urged to increase their consumption during that time (thanks
to the lower prices);
A solar district is a secondary substation and its corresponding customers.
Tuesday, 21 October 2014
26
DEMO6 - dD6.6 Halfway assessment of the smart solar district
-
Some customers will have their electric water heater turned on remotely;
Customers with PV production and a residential battery will have their battery charging.
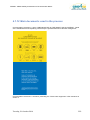
2.2.3 Usage of the LINKY smart meter
What is LINKY?
The LINKY smart meter is a communicating meter that is going to be rolled out in France. These
smart meters will provide much more details regarding the consumption and the quality of
electricity than the current meters (such as the consumption at a 10-minute step or the voltage).
They will also be operable remotely thus reducing the need for onsite interventions and the delay
for maintenance.
The communication between each meter and the information system that centralises the data is
divided into two main steps. First, the meter sends the information to a concentrator localised in the
secondary substation using Power Line Carrier (PLC) communication. Then, the concentrator
communicates with the supervision centre through GPRS. The electricity suppliers will then have
access to some of the data that relate to their customers.
Figure 18 - linky infrastructure
Tuesday, 21 October 2014
27
DEMO6 - dD6.6 Halfway assessment of the smart solar district
All the consumption data are encrypted at the meter level as ERDF has to ensure the privacy of the
customer’s data. The permanent connection of the meter to the information system and its capacity
to measure multiple variables regarding electricity will allow for:
-
A calculation of the bills based on real rather than estimated consumptions;
Next-day interventions for simple tasks such as the modification of the contracted power
instead of the current five days delay, thanks to remote access;
A better knowledge and control of their electricity consumption by customers as they will be
able to visualise it on their electronic devices (computer, smart phones, tablets...)
Easier diagnostics of the problems in case of a power outage thus a reduction of the
Critère B (average yearly outage time per customer).
These are some of the most advertised advantages of rolling out the LINKY meter, but there are
others. Indeed, it is important to highlight the fact that it is difficult to gather information regarding
the real time state of the distribution grid today. LINKY meters will provide ERDF with a constant
stream of data that will prove useful when it comes to managing the grid.
In the case of the NICE GRID project, one of the most valuable measures is the voltage.
The roll out of LINKY meters in Carros started in June 2012 and two years later, there are now
over 1800 meters installed. The meters were installed in selected districts that correspond to the
seven solar districts of the project as well as some neighbourhoods with a high penetration of
electric heating. These meters now provide the project with data streams that consist in 10-minute
points – which is consistent with the decree that deals with 10-minute averages. However, these
data points are only retrieved to the server on a daily basis.
Voltage measurements at +/- 10%
By default, voltage is only measured when it is out of the 230V +/- 10% range. This is a way of
saving on storage space. This means that the resulting curves are ‘holey’ as no data is recorded as
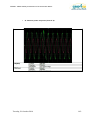
long as the voltage is within the +/- 10% range. Such a figure can be found below.
Figure 19 - Voltage measurement at +/- 10% for a one phase meter
Tuesday, 21 October 2014
28
DEMO6 - dD6.6 Halfway assessment of the smart solar district
If the meter is three-phased, then it will log the voltage of the three phases every time one of the
phases is out of the acceptable range.
Figure 20 - Voltage measurement for a three phase meter
To improve readability, the holes are replaced by a 230V voltage in the next figure. It is however
important to keep in mind that this does not reflect the true evolution of voltage. This is why this
approximation has never been used subsequently.
Recording only the values out of the +/- 10% range to save on the data storage costs makes sense
when rolling out the meters across the whole country as these are the only important values from a
regulation perspective. However, in a project such as NICE GRID that aims to assess the impact of
PV production and mitigation measures on the voltage, more information is required. Indeed, the
10% threshold prevents us from seeing most of the variations during the day and makes any
accurate analysis impossible. All we can conclude is that increases or decreases in voltage on a
phase tend to be balanced by the other phases; this can lead to surprising situations such as high
voltage in the evening when consumption is at a maximum and PV production at a minimum.
Tuesday, 21 October 2014
29
DEMO6 - dD6.6 Halfway assessment of the smart solar district
How to get a better assessment of the voltage variations with the LINKY
meter
So as to obtain more accurate measurements and a clearer picture of the evolution of voltage
during the day, a few key meters were modified to record all voltage values. Indeed, LINKY meters
can be used as real voltage meters and record the average voltage every 10 minutes on one
phase or on the three phases depending on type of meter. In order not to use too much storage
space, each low-voltage feeder that was monitored had up to three meters with a full voltage
measurement. As the project’s objective is to mitigate increases in voltage on the network, the
modified meters were selected so that they would provide us with an overview of the voltage over
the entire length of their feeder – meaning that measurements had to be taken close to the
substation, in the middle of the network and at the end of the line.
Figure 21 - Voltage measurement
Priority was given first to three-phased meters as they give simultaneously the phaseneutral voltage on the three phases, thus providing a better overview of the network.
However, when no three-phased meter was available at an interesting location, the project
settled for the modification of three one-phased meters connected to different phases and
located close from one another.
The localisations of these sample meters in the seven secondary substation that take part
in the ‘mitigating the increase in voltage due to PV production’ experiment are detailed
next.
Tuesday, 21 October 2014
30
DEMO6 - dD6.6 Halfway assessment of the smart solar district
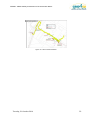
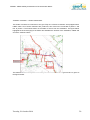
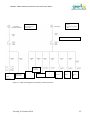
Figure 22 - Cailletiers substation
Figure 23 - Pesquier substation
Tuesday, 21 October 2014
31
DEMO6 - dD6.6 Halfway assessment of the smart solar district
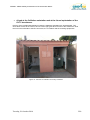
Figure 24 - Dock trachel substation
Tuesday, 21 October 2014
32
DEMO6 - dD6.6 Halfway assessment of the smart solar district
Figure 26 - Plaine 1 substation
Figure 25 - Colombie substation
Tuesday, 21 October 2014
33
DEMO6 - dD6.6 Halfway assessment of the smart solar district
Figure 27 - Lou Souleou substation
28 - Rosemarines
Tuesday,Figure
21 October
2014 substation
34
DEMO6 - dD6.6 Halfway assessment of the smart solar district
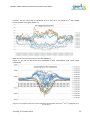
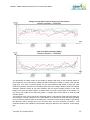
These selected meters give us a more accurate overview of the evolution of voltage over time and
make it possible for us to analyse the way the voltage varies throughout the network over time. For
example, the figure below displays the evolution of voltage on Phase 1 over a week day at the
three sample meters of one of Colombie substation’s feeder (0603301593).
This feeder has one of the highest penetrations of PV production in the project (10%), making it
one of the most likely to display increases in voltage. The meter situated the closest to the
substation provides us with data showing that the voltage at the substation is not constant during
the whole day; variations on the MV level affect it. It must be noted that the MV variations are
smaller than average in Carros as the MV feeders are short and strong.
The variations of the two meters situated further downstream appear much more difficult to analyse
with a very large gap between the mid- and end- network voltage. Deeper analysis is required to
unscramble these data, it is carried out in Appendix I. It must however already be highlighted that
the voltage variations on this feeder should not be regarded as standard. This feeder is very long
and its phases are unbalanced, the combination of these factors leads to voltage variations that are
much more important than those of typical feeders.
Assessing the involvement of engaged customers
The LINKY meters were also used to assess the involvement of the customers participating in the
project. Indeed, it is essential to know how much load can be shifted to the production period by
engaged customers as this will determine the number of engaged customers necessary to mitigate
the risks posed by PV production on low voltage networks.
Tuesday, 21 October 2014
35
DEMO6 - dD6.6 Halfway assessment of the smart solar district
The analysis of the power data during the beginning of the 2014 summer experiment is carried out
in Appendix II and provides us with some feedback on that subject. The general result is that
engaged customers with an electric water heater triggered remotely by the project will see a
massive change in their consumption pattern on a ‘solar day’ as their consumption will peak for
about one hour during the afternoon. The effect of this change in behaviour on the voltage of the
local grid remains to be confirmed but still, this first result tend to indicate that electric water
heaters could be used to compensate the PV production on the condition that several water
heaters are triggered successively.
2.2.4 Usage of the PME-PMI meters
Complementing the LINKY data
As seen in the previous section, the LINKY meters are the cornerstone of the Smart Grid
infrastructure in France as they provide the network operator with the information necessary to the
future day-to-day monitoring and management of the low voltage networks. This information
includes the demand, the production and the voltage. However, even though the LINKY meters are
to play a major role in the monitoring of the low voltage network, Smart Grid projects often
complete them with additional meters situated in critical positions – the NICE GRID project opted
for PME-PMI meters.
The PME-PMI meters are traditionally used as equivalent to LINKY meters for customers
contracting a power superior to 36 kVA. In NICE GRID, these meters are indeed used for large
customers but eight additional meters have also been included and are used to monitor each of the
seven substations corresponding to the ‘solar districts’, as well as one of the main PV producers.
Role of the PME-PMI meters located in the substations
The first function of these meters is to offer a quick and simple way of checking the LINKY data
regarding demand and production. Indeed, the aggregation of the loads recorded by the LINKY
meters downstream of each PME-PMI meter should be roughly similar to the load recorded by the
PME-PMI meter (however, it will not be identical as only about 90% of the customers are equipped
with LINKY meters).
The second function is to provide the network operator with a practical solution for the real time
monitoring and management of the network.
Having only a few meters makes it possible to retrieve the data as often as it is measured, while
the LINKY data suffers from a gap between the frequency of measuring (every ten minutes) and
the frequency of retrieval (every day) that is due to the large number of LINKY meters.
Retrieving some aggregated data every ten minutes is necessary to the real time management of
the network as a daily retrieval is only good enough for billings, post-event analysis and predictions
regarding the next day. Thus, fitting PME-PMI meters in the most interesting secondary substations
is a good way of gaining global information that can be collected more easily and used closer to
real time.
For instance, there are about 630 LINKY meters in the seven solar districts of NICE GRID. They
represent a quantity of data that is much more difficult to retrieve and process in real time than the
seven PME-PMI meters needed to fit the solar substations.
Tuesday, 21 October 2014
36
DEMO6 - dD6.6 Halfway assessment of the smart solar district
If we combine the two functions, we see that the project could in a future experiment re-evaluate
the consumption predictions on the day by comparing the PME-PMI data of the morning with what
was predicted.
Role of the PME-PMI meter equipping a solar producer
This meter is used to quickly assess the level of PV production of the seven solar districts.
Indeed, the project calculated in 2013 the ratio between the production of each district and
the production of this installation. For instance, all the PV producers downstream of the
Cailletiers substation represent about 12% of this main producer.
This approximation is made possible by the fact that Carros is a relatively small city and
that we measure the average production over 10 minute. Both these factors combined
lead to the conclusion that any change in weather can be considered as affecting
simultaneously all the different producers.
Eventually, this meter and its 10-minute step data will allow the project to recalibrate its
production predictions on the day by simply checking whether the sun is shining as much
as predicted.
General use of the PME-PMI meters and retrieval of the data
In addition to their value when it comes to predictions, PME-PMI meters can also be used to have
a more complete overview of each solar district. Indeed, despite the project’s best efforts, only
around 90% of the customers within the seven solar districts are equipped with LINKY meters. One
of the main reasons is that some of the customers were not in situations that allowed for the
installation of a smart meter, for instance some were on a tariff that was not compatible with the
version of LINKY rolled out in the project. Moreover, the change of the ancient meter to the LINKY
meter was encourage but no compulsory, as this is only a demonstration project.
On a general note, the data collected by the PME-PMI meters will be used within Alstom’s solar
console to provide the user with a quick visualisation of the load in each solar district and of the PV
production of the area. It may eventually enable the development of advanced micro grid functions.
On a more technical subject, the retrieval of the data makes use of several technologies. Data
points are transmitted every ten minutes to the project’s server by a WebdynTIC. A WebdynTIC is
a communicating platform that periodically retrieves the data from the meters and uploads it to a
server chosen by the user. The data streams are communicated by Broadband PowerLine (BPL), a
fast PLC technology compatible with MV networks, to the primary substation where a broadband
internet connection to the ERDF network retrieves them to the server. An additional retrieval takes
place on a daily basis through a GSM channel.
Tuesday, 21 October 2014
37
DEMO6 - dD6.6 Halfway assessment of the smart solar district
2.2.5 Usage of the ALPTEC measuring devices
Requirements for additional measures
The previous sections tackled the subject of the LINKY and PME-PMI meters that provide the
network operator with data regarding the power and the voltage variations.
These data are critical when it comes to maintaining the voltage within the 230 V +/-10% range,
especially if the penetration of PV production is high. However, the assessment of power quality is
not limited to them and parameters such as harmonics, rapid voltage spikes and flicker also need
to be monitored.
Indeed, even though it is true that the network will need to be better monitored and controlled to
mitigate the increases in voltage that can be created by decentralised production, these increases
are not the only type of problems that can affect low voltage networks in the future. New usages
such as electric vehicles, decentralised production or the management of flexible loads require the
use of power electronics that can have a massive impact on power quality. On top of the variations
of voltage monitored with LINKY, it is thus necessary to assess the level of harmonics, the flicker
and the rapid variations of voltage. To monitor and analyse these phenomena, 10-minute step
recordings are not enough and additional devices have to be installed to log data on a second-bysecond basis.
The project needed to install such devices in order to complete its assessment of the network
behaviour when the penetration of PV production is high. The next section will detail these
additional equipments, especially the one fitted on the feeders of the ‘Dock Trachel’ secondary
substation as this is the substation with the largest consumers and producers (including a 200 kWp
PV producer).
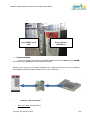
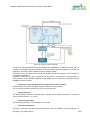
Measuring devices
Measuring devices such as the ones required by the project are used industrially in primary
substations as the monitoring at that level is already quite thorough. Installing such devices in
secondary substations is thus quite similar to the matter of the solar transformer (an OLTC
transformer installed in a secondary substation) as it corresponds to moving some advanced
functions further downstream to gain in accuracy and in flexibility.
ALPES TECHNOLOGY has developed a range of measuring devices that respond to the project’s
requirements. These products are called ALPTEC and each one of them is capable of monitoring
all the transformers and feeders (over the three phases) of a substation thanks to a set of modular
sensors (SmartCAN).
After two years with a simpler ALPTEC that will be presented later on, the ‘Dock Trachel’
substation has been fitted with an ALPTEC-3000 since mid-July 2014. This monitoring system can
provide measures allowing the assessment of power quality (CEI 61000-4-30 standard) as well as
the remote operation of the network (IEC 60870-5-104 and IEC 61850). The ALPTEC-3000
monitors all the electrical parameters (including power quality) on every feeder of the ‘Dock
Trachel’ substation and takes a series of measurements every 3 seconds. The figures below
display how it is installed in the substation to monitor the different feeders.
Tuesday, 21 October 2014
38
DEMO6 - dD6.6 Halfway assessment of the smart solar district
The ALPTEC-3000’s data can be retrieved remotely either by modem RTC, GSM GPRS or HSPA
(3G) or by Ethernet wire. The latter is usually favoured as the communication costs involved are
Tuesday, 21 October 2014
39
DEMO6 - dD6.6 Halfway assessment of the smart solar district
lower and the data rate higher. Measures are retrieved on a daily basis by a remote reading server
operated by EDF R&D. They are saved (with a back up for redundancy) on a server dedicated to
the storage of measuring series data. An audit of the power quality (as defined in the CEI 61000-430) is carried out monthly as well as an additional, deeper, analysis of the voltage and current
harmonics that uses specific software (such as SAV or PQHM) to focus on the assessment of the
impacts of the new usages.
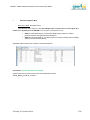
Table 1: Technical specifications of the ALTEC-3000
Parameters monitored:
Average effective values at the 200 ms (not
logged), 3s, 1à min, 1 h, 24 h.
Frequency:
45-57,5Hz (optional 60Hz).
Sensor resolution: 10 mHz.
Intrinsic error: 30 mHz.
Class A as per IEC-61000-4-30.
10240 Hz synchronised using the network
frequency (PLL).
Sampling frequency:
Accuracy: 10 cycles FFT (Fast Fourier Transform)
– Bandwidth 30-2200 Hz.
RMS Measure of 1 period, half-period sliding
window
Voltage drop and surge:
Reference voltage: U ref.
Intrinsic error: <1% de Unom.
Class A as per IEC-61000-4-30.
Flicker:
PST (10-minute average), PLT (2-hour average).
Measures respecting IEC-61000-4-15
Measuring range: 0-20.
Intrinsic error: <5% de Unom.
Class A as per IEC-61000-4-30.
Voltage harmonic:
Measuring range: H2 – H51.
Measurement steps: 200 ms, 10 min, 1 h, 24h.
Measures respecting IEC-61000-4-7 Class I.
Class A as per IEC-61000-4-30.
Measuring range: H2 – H51.
Current harmonic:
Measurement steps: 200 ms, 10 min, 1 h, 24h.
Measures respecting IEC-61000-4-7 Class I.
Class A as per IEC-61000-4-30.
Phases unbalance :
Class A as per IEC-61000-4-30.
Active power:
As per IEC-61036 class 2.
Reactive power:
As per IEC-61268 class 2.
Tuesday, 21 October 2014
40
DEMO6 - dD6.6 Halfway assessment of the smart solar district
Distortion power
As per IEC-61036 class 2.
Shape of the voltage and current wave
Shape logged in case of a voltage or current
event.
Before the installation of the ALPTEC-3000 in July 2014, the Dock Trachel substation was already
fitted with a monitoring system. Indeed, an ALPTEC-2444i had been installed for around two years.
It monitored the rapid variations of the power needs (3-second step values) to evaluate the
performance required of the systems that will be installed for the islanding experiment (including
the battery inverters). Despite the number of parameters logged by this system, it was not able to
give a description of the state of the grid that differentiated the state of the different feeders, thus its
eventual replacement by the ALPTEC-3000.
A feeder by feeder description is indeed necessary to the project in this district. This is due to the
fact that this substation distributes the electricity to the largest PV producers of the project and that
each of them has their own dedicated feeder.
Even though the ALPTEC-2444i was not advanced enough for the monitoring of the ‘Dock Trachel’
substation given the requirements linked to the islanding experiment, it proved its utility. That is
why the Cailletiers substation has also been fitted with ALPTEC-2444i for the past two years, and
the Colombie substation should soon have its own too.
Tuesday, 21 October 2014
41
DEMO6 - dD6.6 Halfway assessment of the smart solar district
2.2.6 Usage of PowerFactory to extend the results
What is PowerFactory?
Power Factory is a power system modelling software developed by DIgSILENT. It has been
extensively modified by experts at ERDF to tailor it to the needs of the distribution system operator
and namely to the field of opportunities opened by Smart Grid applications.
The distribution network and its characteristics (geographical as well as technical) are wholly
modelled in the software that can run calculations to assess the state of the network given a set of
consumption and production curves. It is even capable of running asymmetrical calculations on the
three phases of low voltage networks, using the phases given by the LINKY meters.
The outputs can be customised to provide the user with information regarding the load of the lines,
the voltage at different points of the network, the aggregated power by feeder, or any other
electrical data.
Application to the project
The objective was to use the power data recorded by LINKY and PME-PMI meters during the
different NICE GRID experimentations to try and scale their results up by running calculations on
districts with increased production and increased number of engaged consumers.
Indeed, the number of producers in the seven solar districts, while higher than average, is still too
low to really face issues of increased voltage despite the efforts that went into recruiting customers
to the project (see Appendix I). A good example is that none of the residential district is currently
facing the risk of having more production than consumption during the day. Similarly, even though
the engaged customers already have an impact on the aggregated load curves (see Appendix II),
the number of customers that accepted to move their consumption on ‘solar days’ would also be
insufficient if the production was to reach a more considerable level (according to Appendix II,
compensating one 3 kW PV producer would require one engaged customer).
All in all, analysing the results of the experiments provides us with important feedback on how the
grid copes with a small increase in PV production and with the current variations of the load over
the day.
The idea is to check that PowerFactory provides us with reliable models of the solar districts’ power
systems by comparing the voltage variations obtained by running calculations on the LINKY and
PME-PMI power data.
If the models proved to be reliable, the next step would be to multiply the penetration of PV
production by a coefficient to simulate the future growth of PV production and to assess when
constraints really start to appear on the network. Then, replicating the behaviour of engaged
customers that move their consumption to the afternoon when incentivised to would allow us to
evaluate the ratio of engaged consumers necessary to alleviate the constraints caused by PV
production and to check whether the conclusions of Appendix II are confirmed when PV is
introduced on a larger scale.
The comparison of the LINKY data on voltage with the results given by the PowerFactory model is
detailed in Appendix III. The scaling up of the experiment using PowerFactory is presented and
analysed in Appendix IV.
Tuesday, 21 October 2014
42
DEMO6 - dD6.6 Halfway assessment of the smart solar district
2.2.7 Conclusion
This report introduced the various devices installed in the field to monitor the daily behaviour of the
grid in the NICE GRID project. These devices are essential to the project and to Smart Grids in
general as getting a better knowledge of the distribution network constraints is necessary if we
want to manage them more efficiently.
A first round of analysis was then carried out on the data recorded by the project. It highlighted the
links that exist between parameters directly related to the customers connected to the low voltage
network, such as demand and production, and parameters more relevant to the power quality, such
as voltage. These links legitimise the angle of the project which is to make the distribution system
more efficient by incentivising the customers to have a smarter consumption in order to increase
the quality of the power without having to reinforce the network
These analyses also allowed us to estimate the impact of the load shifting from engaged
customers. This is an essential piece of information as it directly impacts the number of engaged
customers needed to balance a given number of PV producers.
The next step was to verify the accuracy of the power system model provided by PowerFactory.
Having a model of our networks made it possible for us to scale up both the penetration of the PV
production and the percentage of customers involved in the project. This gave us an estimation of
the level of penetration of PV production that can create voltage constraints on a low voltage
network (around 40% for the Colombie substation). It also allowed us to do a first evaluation of the
number of engaged customers needed to alleviate these constraints (about one engaged customer
per residential producer).
Tuesday, 21 October 2014
43
DEMO6 - dD6.6 Halfway assessment of the smart solar district
2.2.8 Appendices
Appendix I – Analysis of the LINKY voltage data
Scope of the analysis
Due to the volume of data recorded since the beginning of the project, some choices were made
regarding the focus of our analysis.
We studied the data of three summer days in three different solar districts: Cailletiers, Colombie
and Lou Souleou. These districts were chosen for several reasons:
They are residential districts that appear likely to be constrained by the penetration of PV
production in the future (long LV networks, low demand in the afternoon, many roofs available);
The penetration of LINKY meters was relatively high to provide us with accurate information on the
load of each phase;
3-phased meters were available to retrieve voltage data on all three phases at once.
As described in section 2, we selected three meters in each district (near the substation, in the
middle of a feeder and at the end of the feeder) to assess the evolution of the voltage over the
network during the day.
Evolution of the voltage
Colombie substation – Feeder 06033001593
This feeder connects 40 customers to the grid. Thirty-two of these customers are equipped with a
LINKY meter and four are producers. Three producers are connected on phase 2, while the phase
of the fourth one is unknown as it is not fitted with a LINKY meter. The furthest meter on the feeder
is 650 m from the substation. The figure below highlights the lines belonging to the feeder and
indicates the location of the substation, middle and end of the network meters.
Tuesday, 21 October 2014
44
DEMO6 - dD6.6 Halfway assessment of the smart solar district
The data we have at our disposal allows us to plot the evolution of the voltage over time. It gives us
the figures below.
Tuesday, 21 October 2014
45
DEMO6 - dD6.6 Halfway assessment of the smart solar district
These figures show how the voltage variations tend to grow proportionally the further we get from
the substation. As mentioned previously, the voltage variations at the substation are only due to the
MV variations. The subsequent variations are due to the different customers (producers and
consumers) connected to the low voltage network upstream of the meter which explains why the
end meter displays the most important variations.
It is also possible to observe the evolution of the three phases on each meter.
Tuesday, 21 October 2014
46
DEMO6 - dD6.6 Halfway assessment of the smart solar district
Tuesday, 21 October 2014
47
DEMO6 - dD6.6 Halfway assessment of the smart solar district
It appears quite clearly that the variations of voltage on the three phases are synchronised and
very likely to be created by each other. The next figures focus on the 23/06/2014 and allow a
comparison of the evolution of the aggregated load and voltage on each phase.
If we analyse the evolution of the voltage by looking at the load curves aggregated by phase, it is
possible to explain the global shape of the voltage curves. The minimum in voltage of phase 3 is
reached exactly when the load on this phase peaks. At this moment, the system is largely
unbalanced as the load on phase 3 is roughly equal to the sum of the loads on the other two
phases. This unbalance explains the fact that the voltage on phase 1 and 2 peak at the same time
to compensate the drop in voltage on phase 3. On a more general note, phase 1 is the less loaded
of the three phases and, quite logically, displays the highest voltage curve.
The fact that the voltage on phase 2 sticks closer to the voltage on phase 1 than to the voltage on
phase 3 despite a load that oscillates between those of phase 1 and 3 could maybe be explained
by the presence of PV production on phase 2. This production may be the source of local voltage
increases.
Tuesday, 21 October 2014
48
DEMO6 - dD6.6 Halfway assessment of the smart solar district
Other features of the voltage figure that cannot be properly explained by the load figure are the
variations of voltage on phase 2 from the evening to the late morning. Indeed, phase 2 voltage gets
closer to phase 3 but not lower, even though the load curves show clearly that, except during the
afternoon, the load on phase 2 is higher than on phase 3. These discrepancies could be linked to
the fact that only 80% of the customers connected to the feeder that is being studied are equipped
with LINKY meters. This means that about 20% of the load is missing. It is likely that this missing
load is not perfectly balanced between the three phases and it could explain discrepancies that are
spread over most of the day.
Tuesday, 21 October 2014
49
DEMO6 - dD6.6 Halfway assessment of the smart solar district
Cailletiers substation – Feeder 0603302475
This feeder connects 69 customers to the grid. Fifty-nine of these customers are equipped with a
LINKY meter. Six of these customers are producers, two of them are connected to phase 1 and
four to phase 3. The furthest meter on the feeder is 540 m from the substation. The figure below
highlights the lines belonging to the feeder and indicates the location of the substation, middle and
end of the network meters.
The data we have at our disposal allows us to plot the evolution of the voltage over time. It gives us
the figures below.
Tuesday, 21 October 2014
50
DEMO6 - dD6.6 Halfway assessment of the smart solar district
Tuesday, 21 October 2014
51
DEMO6 - dD6.6 Halfway assessment of the smart solar district
On these figures, it is worth noticing that the voltage curves corresponding to the meters at the
substation and in the middle of the network are extremely close, especially if you compare them
with the curve of the meter at the end of the network. This is due to the fact that despite our
commitment to the choice of a meter situated in the middle of the feeder, this choice was based on
geographical data. It appears that though this meter is roughly located in the middle of the line, the
load is unevenly distributed across the line whose end is much more loaded than its beginning.
Therefore, the voltage variations between the middle and the end meters are more significant than
the ones between the substation and middle meters.
Similarly to the feeder of the Colombie substation, the voltage variations on the three phases are
synchronised on the three days studied. We will thus proceed similarly and focus on the
23/06/2014 to try and analyse the cause of these changes by comparing the voltage variations with
the load curve of each phase.
Tuesday, 21 October 2014
52
DEMO6 - dD6.6 Halfway assessment of the smart solar district
The penetration of LINKY meters on this feeder is slightly better than for the Colombie feeder so
the comparison of the load with the voltage variations should prove easier. It is quite clear from the
graph that, once more, the three phases are not really balanced with phase 2 being the most
loaded and phase 3 the least. This translates quite well to the voltage variations where the voltage
variations replicate almost all the load variations with the lowest voltage present on the most
loaded curve. Even the peak of phase 1’s load around 17:00 has a clear impact on the voltage. It is
only during the middle of the night that phase 1’s voltage drops under phase 2’s while its load
remains inferior.
The presence of PV can be noticed by comparing phase 1 and phase 2 loads during the afternoon
and during the evening. Indeed, the two curves behave in the same way during the evening leading
us to think that a similar number of customers are connected to them but they display a gap during
the afternoon that is probably due to the fact that there are more producers on phase 1. This
production leads to the unbalance of the phases during the afternoon and, indirectly, to the voltage
gap.
Tuesday, 21 October 2014
53
DEMO6 - dD6.6 Halfway assessment of the smart solar district
In the end, on this feeder, it proves quite easy to explain the voltage variations via the unbalance
of the network. The link between high voltage and low load appears quite strongly and proves
resilient to variations of the load during a large part of the day. Still, this also means that the
penetration of the production on the feeder is too small to create issues of high voltage as the
unbalance of the three phases remains the main driver of the voltage variations.
Lou Souleou substation – Feeder 0603300742
This feeder connects 41 customers to the grid. Thirty-seven of these customers are equipped with
a LINKY meter. Two of these customers are producers, both connected to phase 1.
The data we have at our disposal allows us to plot the evolution of the voltage over time. It gives us
the figures below. The furthest meter on the feeder is 350 m from the substation. The figure below
highlights the lines belonging to the feeder and indicates the location of the substation, middle and
end of the network meters.
Similarly to the Cailletiers feeder, this feeder displays a load that is unevenly distributed along the
line. Even though the middle meter was selected to roughly correspond to the geographic middle of
the line, the figures make it quite obvious that most of the load is between the substation and
middle meters.
Tuesday, 21 October 2014
54
DEMO6 - dD6.6 Halfway assessment of the smart solar district
A second feature that should be noticed on these figures is the small amplitude of the voltage
variations in comparison with what happens on the Cailletiers and Colombie feeders. This
amplitude can be affected by three different factors: the load, the length of the line and the
unbalance between the phases (which is directly linked to the load). The Lou Souleou feeder is
much shorter than the other two (350 m against 540 m for Cailletiers and 650 m for Colombie) but
displays a load superior to the load of Colombie (and inferior to Cailletiers), which is relatively well
balanced during the 10:00-18:00 period, ie the period during which most of the voltage variations
occur. Thus, the voltage variations in Lou Souleou cannot be due to the unbalance of the phases
as we suspected it was the case for Cailletiers and Colombie.
If we focus on the comparison between Lou Souleou and Colombie, the amplitude of the voltage
variations is divided by three in Lou Souleou while the load is slightly superior and the line half the
length of the one in Colombie. Lou Souleou’s higher load should partly compensate the much
shorter line length and should at least mean that the voltage variations amplitude is not divided by
three.
Thus, the fact that the load is better balanced in Lou Souleou probably has a stabilising effect on
Tuesday, 21 October 2014
55
DEMO6 - dD6.6 Halfway assessment of the smart solar district
the voltage by preventing any cross-phase impact where a high voltage on one phase entails a low
voltage on the others.
If we look at the figures below, we can directly compare the evolution of the load on the three
phases with the voltage variations.The high penetration of LINKY meters on this feeder (90%)
leads to a fairly accurate match up of the load and voltage variations on a phase-by-phase basis.
This is reinforced by the lack of cross-phase impact that was mentioned before.
Conclusion on the evolution of the voltage
This analysis focused on a few selected feeders of substations that are likely to be constrained in
the future because of PV production in the afternoon at a time where the demand is quite low. The
feeders were also chosen to have a high penetration of LINKY meters, so that the information at
our disposal was as comprehensive as possible.
Tuesday, 21 October 2014
56
DEMO6 - dD6.6 Halfway assessment of the smart solar district
Given the currently low penetration of PV producers (less than 10%), it proved difficult to assess
their impact on voltage beyond the fact that they reduce the load on their phase during the
afternoon thus indirectly increasing the voltage (as showed by the fact that the phases where PV
producers are connected are often the least loaded during the afternoon).
In the end, most of the voltage variations are linked directly to the evolution of the load on the three
phases. When one phase is clearly the most (resp. the least) loaded, it tends to have the lowest
(resp. the highest) voltage and to increase (resp. decrease) the voltage on the other phases. Thus,
the unbalance of the phases was one of the main reasons behind the largest voltage variations as
it often amplified the variation due to the load by adding cross-phases effects.
Tuesday, 21 October 2014
57
DEMO6 - dD6.6 Halfway assessment of the smart solar district
Appendix II – Analysis of the LINKY power data and estimation of the
load shifted by engaged customers
Scope of the analysis
This analysis focuses on the first month or so of the 2014 summer experiment. It uses the power
data recorded by the LINKY meters over the period 30/05/2014 - 09/07/2014 to assess the volume
of energy that engaged customers shifted to the afternoon when they were incentivised to by the
project.
It is only a first analysis of the effect the incentive has on the customers’ behaviour. It focuses only
on customers equipped with an electric water heater and connected to the Cailletiers feeder
n°0603302475.
EDF is in charge of the more detailed analysis of the customers’ behaviour during the 2014
summer experiment.
Evolution of the consumption
Using the project’s databases, it was possible to single out the load curves of the customers that
have their electric water heater turned on remotely during the summer experiments and to compare
their usual consumption with their consumption over a ‘solar day’ during which they are incentivised
to shift their consumption to the 12:00-16:00 period. The figure below plots the average
consumption of an engaged customer on a ‘normal day’ (blue) and on a ‘solar day’ (red).
The load shift is proven quite efficient with a large increase of the consumption during the solar
period. The consumption increase during the 12:00-16:00 period can be divided into two. At first,
there is a clear peak in consumption that is due to the electric water heaters that are triggered
remotely at 14:00. This peak only lasts for one hour as the heaters switch off when all the water
has been heated. During the rest of the period, the increase in consumption is less important as it
is only based on more classic usages such as washing machines. The load shift during this second
Tuesday, 21 October 2014
58
DEMO6 - dD6.6 Halfway assessment of the smart solar district
hour is similar to the load shift of an engaged customer that doesn’t have an electric water heater
(about 500 W).
The average total consumption over the 12:00-16:00 period is 8.5 kWh for an engaged customer
with an electric water heater turned on remotely and only 3 kWh for a classic customer. Thus it
would seem that, energy wise, one engaged customer and one classic customer would on average
consume the production of a typical 3 kWp PV installation. However, this is not reflecting the actual
power variations.
To balance a PV installation both power wise and energy wise, it would be necessary to smooth
the 14:00-15:00 peak and to spread it over the whole solar production period. This could either be
achieved by controlling the power of the water heaters to make sure they need the whole period to
heat all the water or, more easily, by having the electric water heaters triggered successively –
similarly to what is already done with electric water heaters during the night in France.
Effect at the feeder level
Five of the fifty-three LINKY-equipped consumers of the Cailletiers feeder studied in Appendix I are
participating in the summer experiment. The previous section gave us an estimate of the average
load shift that is achieved by each of them and we will now assess their effect on the global load of
the feeder. The figure below plots the consumption of an average customer on a ‘normal day’
(blue) and on a ‘solar day’ (red) (all customers are aggregated whether they are engaged or not in
the project).
This figure shows that even with only 10% of the consumers engaged in the project, the effect on
the load curve is already noticeable.
Conclusion
This analysis focused on the impacts of incentivising a customer to shift its consumption to the
afternoon on days of important solar production. It showed that even with only 10% of customers
engaged in the project, we already have results that can be noticed by looking at aggregated
curves.
Tuesday, 21 October 2014
59
DEMO6 - dD6.6 Halfway assessment of the smart solar district
Looking at the volume of load shifted by an engaged consumer also allowed us to give a first
estimate of the number of engaged customers needed to compensate – power wise – the presence
of residential PV producers (one engaged customer and one classic customer per producer should
be enough). Moreover, this study highlighted the need to refine the solar period process in order to
spread the current 1-hour peak over the whole solar production period; this could be achieved by
triggering the electric water heaters successively rather than all together at the start of the period.
While this is currently done at a national level with electric water heaters during the night in France,
it would be much more difficult to implement in our context because of the small number of
customers per feeder (around 50 customers, only 10 to 20% of those take part in the load shifting)
which make the aggregation more complex. It may be more efficient to target larger groups of
customers, perhaps by looking at MV feeders rather than LV feeders.
Finally, while we gave an estimate of the number of engaged customers needed to compensate the
presence of PV producers. This estimate was only based on considerations regarding the
production and the demand. While this should translate into reduced voltage variations, it is still
necessary to check that this is true – especially if the volume of production and the number of
engaged customers are increased. This will be addressed in Appendix IV.
Tuesday, 21 October 2014
60
DEMO6 - dD6.6 Halfway assessment of the smart solar district
Appendix III – Comparison of the voltage variations measured by the
LINKY meters with the calculations run on PowerFactory
Scope of the comparison
This comparison is based on the LINKY data that was analysed in Appendix I.
The load curves of all the consumers and producers fitted with LINKY meters are inputted into the
PowerFactory models of the three solar secondary substations named Colombie, Cailletiers and
Lou Souleou. The analysis is done on the three feeders that were detailed and displayed in
Appendix I. The table below summarises some information on them.
Colombie
06033001593
Length of the feeder
Cailletiers
Lou Souleou
0603302475
0603300742
650 m
540 m
350 m
36 (29)
63 (53)
39 (35)
4 (3)
6 (6)
2 (2)
3 on phase 2
2 on phase 1
1 unknown
4 on phase 3
Number of consumers
(number of LINKY
equipped consumers)
Number of producers
(number of LINKY
equipped producers)
Phase of the producers
2 on phase 1
The consumers (resp. producers) who have not been equipped with a LINKY meter are given a
template load curve which corresponds to the average consumption (resp. production) of all LINKY
equipped customers.
Tuesday, 21 October 2014
61
DEMO6 - dD6.6 Halfway assessment of the smart solar district
Once all the consumers and producers of a substation have their load curve, calculations are run
and the voltage data is exported.
It is then possible to compare the voltage variations of the PowerFactory model with the ones
measured by LINKY to assess the reliability of PowerFactory as a modelling tool of our low voltage
networks.
Focusing on the low voltage network voltage variations
As no MV voltage data was inputted into the PowerFactory model, the voltage baseline at the
substation is considered as constant in the model calculations. As we have seen in Appendix I, this
is not the case in real life where the voltage at the substation varies constantly. The next figure
displays the differences between the two sources of data (the PowerFactory calculations and the
LINKY measures) for the Colombie substation.
Tuesday, 21 October 2014
62
DEMO6 - dD6.6 Halfway assessment of the smart solar district
As we want to focus on the model’s reliability when it comes to the voltage variations caused by the
low voltage network, we decided to mask the variations caused by the upstream network at the
secondary of the transformer. This is done by working on the difference between the voltage at the
end/middle of the network meters and the voltage at the meter located close to the substation
rather than directly on the voltage at the end/middle of the network meters. This makes the voltage
data of both sources comparable without having to input MV voltage data into PowerFactory.
Comparison of the voltage variations
We can then plot the voltage variations over the low voltage network using the data supplied by the
LINKY meters and the PowerFactory model. For the Colombie substation, it gives us the three
figures below.
Tuesday, 21 October 2014
63
DEMO6 - dD6.6 Halfway assessment of the smart solar district
The results of phase 1 are not very satisfactory but it must be noted that there are very few
customers with LINKY meters connected to this phase. Most of the load connected to phase 1 is
thus obtained either by inputting profiled curves and by assuming that the load of the 3-phase
customers is evenly distributed on the three phases – which is not always true. Moreover, as the
Tuesday, 21 October 2014
64
DEMO6 - dD6.6 Halfway assessment of the smart solar district
voltage variations on the LV network are quite small for this phase, it is much more likely to display
residual impacts of the MV voltage variations that would not have been masked by our method.
Phase 2 and 3 are better equipped with LINKY meters and the comparison of the voltage
measures with the PowerFactory results is much more satisfactory. The variations of voltage
measured by LINKY meters are mirrored by the results of the model and the curves seem to be
well synchronised. When differences between the two sources of data occur, they represent a
difference in the amplitude of the variations not an opposition of sign. These differences regarding
the amplitude of the variations can be explained by the fact that only 80% of the customers on this
feeder are equipped with LINKY meters.
Tuesday, 21 October 2014
65
DEMO6 - dD6.6 Halfway assessment of the smart solar district
Conclusion on the comparison of the PowerFactory and LINKY voltage data
We have seen that despite the several approximations that are made in our study, including the
assumption that 3-phase customers have a perfectly balanced load, the usage of up to 20% of
profiled loads, the bypass of the MV voltage variations and the assumption that the 10-minute step
values are synchronous, the results of the model are fairly close to the measures of the LINKY
meters.
This leads us to conclude that the calculations are reliable as long as the description of the network
(especially the position and the phase of the customers) is accurate. Getting a high quality picture
of the networks and of their customers is thus the main challenge for network operators who plan
on modelling them.
Tuesday, 21 October 2014
66
DEMO6 - dD6.6 Halfway assessment of the smart solar district
Appendix IV – Scaling up the results of the experiments with
PowerFactory
Objectives
Appendix III concluded that when the description of a network is accurate (characteristics of the
equipments, connection to the phases, load curves), the results of the PowerFactory calculations
are close to the measures collected by the LINKY meters.
This makes it possible for us to use PowerFactory in order to estimate how the network would
respond to increased levels of production, when high voltage constraints would start to appear and
to what extent engaged customers could alleviate these constraints.
We focused on the Colombie feeder studied in Appendix I and on the 23/06/2014. When increasing
the number of engaged customers, we focused on the customers equipped with an electric water
heater.
Length of
the feeder
Colombie
06033001593
Number of consumers
Number of producers
(number of LINKY
equipped consumers)
(number of LINKY
equipped producers)
Phase of the
producers
3 on phase 2
650 m
36 (29)
4 (3)
1 unknown
Reaction to the increase of the PV production
The increase of the PV production was simulated by multiplying the power of the existing
installations rather than creating new ones. This approximation can have some local impacts but
the voltage variations calculated by PowerFactory should still be quite representative of the
situation on the feeder.
Tuesday, 21 October 2014
67
DEMO6 - dD6.6 Halfway assessment of the smart solar district
Tuesday, 21 October 2014
68
DEMO6 - dD6.6 Halfway assessment of the smart solar district
The impact of the increase in production is very clear on these figures. We saw in Appendix I that
all the production was connected to Phase 2 and there is a large increase in voltage on this phase
during the 8:00-20:00 period. This increase in voltage is compensated on the other phases by a
synchronised decrease, similarly to the cross-phases impacts that were highlighted in Appendix I.
According to French regulation, the voltage should remain within the 230 V +/-10% range (ie
between 207 V and 253 V). Our simulations allow us to see that when we reach a production
multiplied by four, we can have voltage variations going from – 10 V to + 20 V. Given that the +/10% range is also supposed to cater for the MV voltage variations, we can assume that such a
level of production could eventually lead to breaching the regulation. In the case of the feeder we
are studying, multiplying the production by four is equivalent to a penetration ratio of around 40%.
Tuesday, 21 October 2014
69
DEMO6 - dD6.6 Halfway assessment of the smart solar district
Impact of engaged customers
In this section, we will take the study case that challenges the grid the most (production multiplied
by six) and change the load of some consumers in order to replicate the presence of engaged
customers (using the impact of engaged customers estimated in Appendix II). This will allow us to
evaluate the number of engaged customers necessary to alleviate the constraints created by a
very high penetration of PV production.
As all of the known production was connected to phase 2, we will only modify the load of
consumers connected to this phase. There are eight one-phase customers equipped with a LINKY
meter and connected to phase 2 of the feeder 06033001593 of the Colombie substation, five of
these customers have an electric water heater and could in theory be incentivised to shift their load
to the afternoon.
We ran the model in three different situations: no customers engaged, three customers engaged
and five customers engaged.
Tuesday, 21 October 2014
70
DEMO6 - dD6.6 Halfway assessment of the smart solar district
The impact of the load shift is quite clear on the voltage curve with a fairly large drop in the voltage
of phase 2 during the 14:00-16:00 period. Of course, voltage on the other two phases goes up to
compensate.
These results were obtained on a feeder to which the equivalent of twenty-four (four times six)
producers are connected. The results of the simulations show that having three customers with an
electric water heater shifting their load is sufficient to reduce the voltage increase by 10V for
around one hour while having five of those customers can allow you to negate any increase in
voltage for the same duration. However, the voltage increase lasts for several hours in total so
more customers would be needed to compensate the production during the peak production period
(10:00-16:00).
In the end, this leads us to estimate that between 18 and 30 engaged customers with an electric
water heater would be needed to balance the twenty four producers. This is quite similar to the first
guess that was put forward in Appendix II.
Tuesday, 21 October 2014
71
DEMO6 - dD6.6 Halfway assessment of the smart solar district
Conclusion
In this appendix, we made the most of the available model of the low voltage network to try and
scale up the results of our experiments. We focused on a specific feeder and started by looking at
the impacts an increase in production would have on the different phases. This allowed us to
determine when the constraints created by PV production became too difficult to adapt to for a
classic network. This was estimated at around 40% of PV penetration for the selected feeder.
We then tried to mitigate the negative effects of the PV production by incentivising customers
equipped with an electric water heater to shift part of their load to the afternoon. This led us to
confirm two conclusions that were first put forward in Appendix II. The first is that the major part of
the customers’ impact is felt over an hour long period corresponding to the water heater
consumption. The second is that triggering the water heaters does have a large impact on the
voltage and could be used as an effective way of limiting the negative impact of PV production on
voltage even though it would be extremely difficult to implement at a local level.
In the end, this legitimises the approach of the project which is to engage customers into adopting
new consumption patterns in order to move consumption to the PV production period. However,
this also highlights the need to trigger customers successively in order to ensure that the whole
production period is addressed and not just a couple of hours. This is similar to what is done at a
national level where electric water heaters are triggered at different times during the night, but it
could prove more difficult to set up at a local level as fewer customers are available. Moreover, it
would be useful to complete the system with diversified offers that would engage customers who
do not have electric-water heaters. Residential storage with Li-Ion battery would represent an
additional solution to move the production to the consumption period rather than the opposite.
Such a complex system with such a wide range of offers and incentives may be too difficult to
implement at a local level, leading us to think that looking at larger groups of customers (such as
MV feeders rather than LV feeders) may be more efficient.
Tuesday, 21 October 2014
72
DEMO6 - dD6.6 Halfway assessment of the smart solar district
3 Assessment of the batteries and
inverters experiments
3.1 Halfway assessment of the grid storage assets
The NICE GRID project includes grid storage assets as levers to integrate massive PV
generation, to operate load shedding and to test islanding on a commercial district. There are four
2
3
grid storage assets , operated by the French Distribution System Operator (DSO) ERDF , and
installed at different location of the distribution grid: primary substation, secondary substation, low
4
voltage grid . According to its location, each storage asset is able to perform one, two or three of
the different NICE GRID use cases.
Over the past year, the storage asset located at the primary substation of Carros has been
installed. This 1 MW / 560 kWh Li-ion based asset is composed of a battery container, a converter
container and a transformer, and is supplied through a MV feeder for the main power circuit, and a
LV feeder for the auxiliary circuit. Furthermore, it communicates remotely with ERDF’s Regional
Control Center, in charge of monitoring the storage asset.
Installing such a storage asset required a lot of preparation: site selection, administrative
procedures, civil works and tests. It required also a deep risk analysis, in order to assess and
implement safety measures.
The storage asset created new constraints for ERDF grid management, which is divided between
control (remote management) and operation (on site management). In order to use the storage
asset efficiently and safely, ERDF had to train controllers and technicians; furthermore new
control and operation strategies had to be defined.
In particular, a storage asset Human Machine Interface (HMI) has been developed by ALSTOM
5
GRID , in order to monitor remotely the state of the storage asset, send charge and discharge
schedules, and retrieve potential alarms from the system. Alarms are ranked according to their
severity level, and specific treatment is available for each type of alarm.
The first results for charge/discharge tests enable the storage asset efficiency computation. The
6
auxiliaries, like HVAC , which are running 24/24, have to be taken into account in such a
computation.
This experience gained on the first storage asset is now used for the three other ones, which will
be installed during autumn 2014.
The storage asset that operates islanding requires adjustments at the secondary substation: some
islanding equipment has already been installed and civil works completed. The two storage
assets located on the LV grid are integrated in containers, which have already been built, and the
civil works on site have begun
2
This deliverable focuses only on grid storage
asset, different from residential storge assets, installed at customer
premises (4 kWh / 4.6 kW)
3
ERDF manages 95% of the French distribution grid, composed of MV (20 kV) and LV (400V) network.
4
Primary substation is 225 kV / 20 kV station (HV/MV) and secondary substation is 20 kV / 400 V.
5
Alstom Grid is in charge of three main components related to the storage asset: the supply of the 1 MW power converter,
the development of a Human Machine Interface (HMI) and the supply of a Master Control Unit to manage the storage asset
6
Heat Ventilation Air Conditioning
Tuesday, 21 October 2014
73
DEMO6 - dD6.6 Halfway assessment of the smart solar district
3.1.1 Introduction to the storage assets
One way to increase the integration of photovoltaic (PV) electricity in distribution grids is to install
storage assets at various points of the grid. For this purpose Li-ion batteries supplied by SAFT,
as well as battery converters supplied by ALSTOM GRID and SOCOMEC, partners in the project,
will be used.
Grid storage assets allow the local electricity management optimization, at different levels of the
distribution grid. The batteries will be used to control the massive injection of PV generated
7
power into the grid and to shed load at the request of the French TSO (RTE). In addition to this,
a 250 kW / 600kWh storage asset will be used to test islanding of a district at specific periods.
Storage assets
The NICE GRID project is testing grid storage assets at the following three levels:
1 storage asset at a primary substation (HV/MV): Primary Substation Battery (PSB)
1 storage asset at a secondary substation (MV/LV): Secondary Substation Battery (SSB)
2 storage assets connected to the Low Voltage (LV) grid: Low Voltage Grid Battery
(LVGB)
Primary Substation Battery (PSB)
This storage asset was the first to be installed, in December 2013. It is located at the “Broc
Carros” Primary Substation that supplies the area of Carros and represents around 20 MW of peak
consumption. The site belongs to ERDF, and the storage asset is composed of three containers
dedicated to the battery, the Power Converter System (PCS) and a transformer.
The storage asset has a power of 1 MW and an energy capacity of 560 kWh.
Secondary substation Battery (SSB)
This storage asset will be installed during autumn 2014 close to the secondary Substation of
“Dock Trachel”. This secondary substation supplies a professional area of 12 clients, with around
8
250 kW of peak consumption, and 430 kWp of PV installed capacity. The PCS of this storage
asset will be located in the secondary substation building, whereas the battery container will be
located on the car park of a commercial client.
The storage asset has a power of 250 kW and an energy capacity of 600 kWh
Low Voltage Grid Battery (LVGB)
7
ERDF can also shed load, using a similar interface
The battery has a power of 1 MW, the PCS a power of 264 kW : but the power is limited by French regulation on the low
voltage grid. Clients can contract up to 250 kW when they are connected to the distribution grid. Here, the storage asset is
connected to a dedicated feeder of the secondary substation.
8
Tuesday, 21 October 2014
74
DEMO6 - dD6.6 Halfway assessment of the smart solar district
There will be two storage assets connected to the low voltage grid at around 400 m of the
secondary substation, in order to maximize the effect of the storage asset on the feeder
voltage curve. These storage assets are integrated in a 10 feet container: the PCS and the
battery modules are in the same container. These containers are located on a client field and a site
owned by the municipality. They will be installed during autumn 2014.
These storage assets have a power of 33 kW and an energy capacity of 106 kWh.
Use cases associated with storage assets
PV integration
For grid storage, this use case consists in storing PV energy mostly between 12:00 and 16:00,
when the PV generation is high. This reduces grid constraints (current and voltage). This use
case is relevant for SSB and LVGB storage assets.
For the first one (SSB), the PV excess energy at secondary substation level will be stored. The
secondary substation often has an excess of PV energy: a threshold will be chosen. For example,
if the chosen threshold for backfeed energy is 100 kW, the storage asset will start to charge, as
shown in the next figure:
Figure 29 - Resulting load curve at “Dock Trachel” secondary substation
For the second ones (LVGB),storage will be installed where the constraints are more likely to be
present, 400 m away from the corresponding secondary substation. The storage assets will charge
energy between 12:00 and 16:00 on sunny days in order to avoid overvoltage occurrences.
9
In both cases, the charge schedule is planned by the Network Battery Aggregator (NBA )
and implemented after activation orders from the Network Energy Manager (NEM).
9
The NBA is developed by ARMINES and will be operated by ERDF. It is in charge of aggregating the grid batteries in order
to respond to the power need request of the NEM
Tuesday, 21 October 2014
75
DEMO6 - dD6.6 Halfway assessment of the smart solar district
This PV integration experimentation will take place during summer, and these three storage
assets will be used as levers to remove grid constraints due to PV, and thus contribute to
PV integration within the distribution grid.
Load shedding
This use case is involving the four grid storage assets, thus representing around 1300 kW of
10
aggregated power for discharge. During cold days in winter, the French TSO RTE is able to
send request for load shedding. It usually occurs between 18:00 and 20:00. Grid storage batteries
are used as demand response levers, in combination with commercial and residential levers.
They will discharge between 18:00 and 20:00 during cold days in order to relieve the grid,
mostly following an RTE request on a day-ahead basis. But ERDF can also use these storage
assets for its own use with the same interface.
In both cases, the charge schedule is planned by the Network Battery Aggregator (NBA) and
implemented after activation orders from the Network Energy Manager (NEM).
Islanding
This last use case only concerns the SSB storage asset. This storage asset is located close to the
secondary substation “Dock Trachel”, supplying 12 commercial clients. With 430 kW p of installed
PV capacity and a 600 kWh storage asset, it will be possible to disconnect this district for the main
grid: this is called islanding . It consists in disconnecting the district from the main grid
during 4 hours and supplying it only with the storage asset and the installed PV generators.
This experimentation will be first done in a scheduled way, and then in an unforeseen way,
requiring black start. Islanding capabilities will be tested in spring and autumn 2015.
Synthesis
Storage
asset
Power
Energy
capacity
PSB
1 MW
560 kWh
SSB
250 kW
600 kWh
X
X
LVGB
(x2)
33 kW
106 kWh
X
X
1010
PV integration
Load
shedding
Islanding
X
X
French : Réseau de Transport de l’Electricité. RTE is in charge of 100% of the French transmission grid.
Tuesday, 21 October 2014
76
DEMO6 - dD6.6 Halfway assessment of the smart solar district
3.1.2 Characteristics of the Primary Substation Battery
(PSB)
This 1 MW Primary Substation Battery (PSB) storage asset consists of the following elements:
a 1 MW / 560 kWh Li-ion battery container
a 20 kV feeder (fuse protection / switch) for connection to the 20 kV switchgear
a 20 kV / 500 V – 1 MVA power transformer
a 1 MW Power Converter System (PCS) including the PCS control system for Li-ion
battery charging, discharging and monitoring functions
Associated auxiliary and protection devices.
The 20 kV feeder and the 1 MVA power transformer are installed on the site of the primary
substation of Carros. The PCS and the associated control system are integrated on a 20 feet
11
container . The Li-ion battery is integrated as well in a 20 feet container.
Figure 30 - Storage asset at the primary substation
Composition
Battery container
a) Description
The battery and other equipments to manage the system are installed in a 20 feet container.
A battery module is composed of two parallel strings of 7 Li-Ion cells connected in series. An
electronic board integrated in the module allows for manage thing cells (balancing, sending data
such as end of charge, over temperature, overcharge, over discharge…).
The Battery Management Module (BMM) is required to manage and monitor several modules
series connected.
11
Dimensions: 6058 x 2896 x 2438 (mm)
Tuesday, 21 October 2014
77
DEMO6 - dD6.6 Halfway assessment of the smart solar district
The battery system is composed of ten parallel Energy Storage System Units (ESSUs) and one
Master Battery Management Module (MBMM). The ESSU stores and provides energy to the
application. Each ESSU is made up of 29 modules and one BMM. The MBMM (Master BMM) is
the top level processing component of the ESSUs. Its main roles are to drive the parallelization of
the units during connection/disconnection phases, to perform monitoring at battery level, to
communicate with the PCS, etc.
Figure 31 - Battery container composition
So as to optimize the yield of the system, the ambient temperature inside the container is
regulated. Therefore an HVAC system is used for temperature regulation.
A Fire Suppression System (FSS) with fire detection and fire suppression is installed inside the
container in order to prevent the system from a faulty situation (venting of a cell…).
The distribution cabinet is mainly composed of:
External Power Supply (EPS) distribution: External power supply and the protection of the
air conditioning system, lightening (overvoltage protection),
Safe External Power Supply (SEPS) distribution: External power supply and the
protections of the FSS, Fans, Lighting system, 230VAC/24VDC inverter, lightening
(overvoltage protection),
24VDC distribution: 230VAC/24VDC inverter to power supply ESSU BMM, MBMM and
accessories, emergency pushbuttons line, doors switches (sensors) line, I/O for Air
conditioning and Fire Suppression System,
MBMM,
Ground fault detector on battery DC bus,
CAN Open bus network: lightning (overvoltage protection),
DC Network: Lightening (overvoltage protection), manual switch disconnector to isolate
the system during the maintenance phases
Earth connection.
Tuesday, 21 October 2014
78
DEMO6 - dD6.6 Halfway assessment of the smart solar district
Figure 32 - Battery container structure
12
b) Single Line Diagram
Figure 33 - Single Line diagram of the battery container
12
Source : SAFT
Tuesday, 21 October 2014
79
DEMO6 - dD6.6 Halfway assessment of the smart solar district
c) Ancillaries with the main power consumption
The main consuming ancillary is the HVAC system, with a nominal power consumption of 3, 7 kW.
PCS container
a) Description
The Power Converter System (PCS) is part of the storage substation. The main functions of the
PCS are:
Ensure the correct energy adequation and transfer (charging or discharging mode)
between the 20 kV network on AC side and the battery system on DC side,
Manage any setting point for load leveling from a remote operator (automatic or manual
mode).
The 1 MW converter, the associated control system and the cooling, are located in 20 feet
13
container. Relying on an Insulated-Gate Bipolar Transistor (IGBT ) based 4-quadrant converter
system.
The converter control system communicates and manages the MBMM, to assume the proper and
secure operation of batteries. All required AC and DC protections are included in the 20 feet
container.
a) Single Line Diagram
13
The insulated-gate bipolar transistor (IGBT) is a three-terminal power semiconductor device
primarily used as an electronic switch and in newer devices is noted for combining high efficiency
and fast switching.
Tuesday, 21 October 2014
80
DEMO6 - dD6.6 Halfway assessment of the smart solar district
Figure 34 - Single Line Diagram of the PCS Container
b) Ancillary circuit
The PCS has three ancillary circuits:
A 400 VAC distribution, mainly for rotating equipments (pumps and fans)
A 230 VAC distribution for lightning and power socket distribution inside the container
A 230 VAC UPS (secured) for control distribution (HMI…)
c) Ancillaries with the main power consumption
The two main consuming ancillaries are:
The cooling unit: It is installed inside the container in front of the LV power and control
cubicle. The interface connects the PCS and the cooling unit by two pipes. The two pumps
represents approximately 1,1 kW power consumption
The shelter and heat exchanger: An external heat exchanger is required to cool down the
cooling water circuit of the PCS. It is installed on the roof of the PCS container. There are
three fans, representing 3x0,74 kW power consumption
Transformer container
The PCS is connected to the MV grid by three power wires through a MV cell including the 1 MVA
power transformer.
Tuesday, 21 October 2014
81
DEMO6 - dD6.6 Halfway assessment of the smart solar district
The 20 kV cell is composed of:
1 MV protection cell including :
o disconnector with double earthing switch
o fuses for power transformer protection
o current transformers (CT) with 2 secondary for PCS measurement and ERDF
counting
1 MV measurement cell including :
o disconnector with earthing switch
o fuses for Voltage Transformers (VTs)
o with 2 secondary : 1 for ERDF metering and 1 for PCS measurement and
protection relay
A power transformer (1 MVA)
1 protection relay for voltage (min and max), frequency and homopolar protection
14
DEIE device
15
A metering device for ERDF: ICE meter
Figure 35 - Single line diagram of the storage transformer
14
The DEIE is used to open remotely the power circuit
This meter is used to measure power consumption of the storage asset (auxiliaries are not taken
into account)
15
Tuesday, 21 October 2014
82
DEMO6 - dD6.6 Halfway assessment of the smart solar district
Telecom
The control system of the PCS is in charge of managing any remote set-point for load leveling
and interact with the SAFT battery MBMM, the 1 MVA power transformer and the associated
interrupter/fuse, the Master Control Unit (MCU, see section 5) and some of the equipment of ERDF
20 kV substation.
The following communication can be mentioned:
The PCS and the Battery MBMM communicates through MODBUS. This allows to
manage and control charge /discharge of the battery, and retrieving alarms.
The PCS and MCU communicate through an OPC link. The MCU hosts the Human
Machine Interface (HMI) described in section 6.
ERDF decided to add to this telecom architecture the possibility to order the opening of the power
supply circuit (battery and PCS) through its own reliable infrastructure. The DEIE is able to
open the main circuit breaker of the storage asset. It communicates though RTC with SIT-R,
ERDF own SCADA for MV feeders and primary substation monitoring, at the Regional Control
Center (ACR). The ACR can open the main circuit breakers remotely through the DEIE.
Figure 36 - Telecom architecture for the PSB storage asset
Tuesday, 21 October 2014
83
DEMO6 - dD6.6 Halfway assessment of the smart solar district
Grid connection
Main power supply
The 1 MVA transformer of the storage asset is connected to the MV distribution grid through an
underground 20kV cable connected to the dedicated 20 kV feeder "SAFT" directly from the 225/20
kV primary substation.
A dedicated meter “ICE” usually used for some MV clients is metering the consumption of the
power supply circuit.
Figure 37 - MV grid connection of the PSB storage asset
Auxiliary power supply
The storage asset also benefits from a LV power supply 36 kVA three-phase type II
supplying the PCS and battery auxiliaries.
16
16
for
i.e. meter and breaker at the boundary of property
Tuesday, 21 October 2014
84
DEMO6 - dD6.6 Halfway assessment of the smart solar district
Figure 38 - Grid connection of the auxiliary supply
A meter and a circuit breaker 60 A / 3 Phases are located at the edge of the perimeter fence
substation, as shown in the following picture:
Figure 39 - Circuit breaker and meter for the auxiliary feeder
After the circuit breaker, the cables are connected to the GDP of the PCS, as shown in the next
Single Line Diagram.
Tuesday, 21 October 2014
85
DEMO6 - dD6.6 Halfway assessment of the smart solar district
Figure 40 - Single Line Diagram for the PCS AUXILIAIRIES
The GDP of the PCS is thus supplying the auxiliaries of the PCS and the 1 MVA transformer, but
also the auxiliaries of the battery container, with two different circuits described above: SEPS
(secured) and EPS (standard)
Tuesday, 21 October 2014
86
DEMO6 - dD6.6 Halfway assessment of the smart solar district
230 VAC
400 VAC
Safe External Power
Supply (SEPS)
External Power Supply
(EPS)
BATTERY CONTAINER
Presence
of voltage
Socket
MBMM
BMM
Fire
suppression
system (FSS)
HVAC
Lightning
Fans
Fans
Fans
ESSUS
ESSUS
ESSUS710
1-2
3-6
PC Panel
Figure 41 - Single Line Diagram for the battery container auxiliaries
Tuesday, 21 October 2014
87
DEMO6 - dD6.6 Halfway assessment of the smart solar district
3.1.3 Installation
Installation and commissioning of the storage assets require several administrative and testing
steps which ERDF had to tackle. The risk analysis is described in section 4.
Site selection
In order to install such a storage asset and to respect the appropriate safety distance, a location
with a minimum size of 50 m² is necessary, even for the LVGB storage assets, which could be
difficult to find. Regarding the PSB storage asset, it has been installed on a field owned by ERDF:
the storage asset on the primary substation field. For the other storage assets, as described in the
last section, it is more difficult because ERDF does not own any sites on the low voltage area.
Another important step is to meet the architects of the municipality. Here, the architect of Nice
Côte d’Azur (NCA) had to be consulted. For these storage assets, they demanded a trees hedge in
front of the storage asset. This step is relevant for sub-urban area. In Carros, the site selection has
also to comply with the flood protection plan, fire protection and environmental requirements.
DREAL and ICPE Declaration
Two preliminary administrative steps regarding environment shall be conducted: a declaration to
the DREAL, an administrative body representing the Ministry of Ecology, Sustainable Development
and Energy at the regional level, and an ICPE declaration.
Declaration to the DREAL
17
The Regional Directorate for Environment, Planning and Housing (DREAL ) represents the only
driver at the regional level for the implementation of public policies of the Ministry of Ecology,
Sustainable Development and Energy. Under the authority of the regional prefect, DREALs are
responsible for developing and implementing government policies on climate change, biodiversity,
construction, urban planning, transport infrastructure, energy, security, industrial activities, and
pollution prevention.
A document describing the storage assets and its use cases has been sent to the DREAL
Provence Alpes Côte d’Azur in 2013.
ICPE Declaration
The regulation of Classified Installations for the Protection of Environment (ICPE), part of the
Environmental Code, aims to establish technical and procedural rules for facilities which could
have significant impacts on the site environment or human health of local residents.
It is therefore necessary to establish an inventory of some physical data describing the system
(amount of materials with certain characteristics of risks, installed electric power etc. ...)
17
French : Direction régionale de l'environnement, de l'aménagement et du logement
Tuesday, 21 October 2014
88
DEMO6 - dD6.6 Halfway assessment of the smart solar district
Below certain thresholds for these physical quantities, no ICPE prescription is applicable. There
are several regimes: declaration (D), authorization (A), special authorization (SA)…
To date, due to the recent appearance on the market of lithium ion batteries, the ICPE regulation is
not very clear. However, in the context of a precautionary principle, it was necessary to make a
broad interpretation of the headings of the sections in order to identify what are the technical
and regulatory rules that can apply to the asset.
The analysis revealed that only one section of the ICPE is applicable: it is the section 2925
“Workshops of batteries”. Upon reaching an electrical power of 50kW, a declaration (D) must
be done.
The following table gives an overview of the inventory done for the storage asset:
Item
Application to the storage asset
Nature and the maximum quantities of substances,
products or materials that will be (or are) used or
stored for the activities
Power and capacity of the used machines
No products are stored. They will be brought on site
for maintenance
Water usage
No water grid connection. Tight container. Retention
reservoir available
Water evacuation
Tight container. Rain water on the container will be
drained by the existing water evacuation system
Gas emissions
Not applicable
Noise, vibration and smell
Not applicable
Waste
In normal conditions, no waste. In case of problem,
waste will be contained in retention reservoir and
evacuated by a specialized company
Safety
Retention reservoir for each battery rack
1 MW and 560 kWh
Safety instruction displayed for operators
Automatic monitoring of equipments
(See section 4)
ICPE declarations have only been sent for the PSB and SSB storage asset, as they have an
electrical power above 50 kW. They have been submitted respectively in autumn 2013 and
spring 2014, and have been accepted without any restriction or comment.
Building permit
Several entities have been consulted. ERDF, as legal person, has to submit a building permit
request signed by an architect.
The building permit request is composed of eight documents:
PC1: Site plan
Tuesday, 21 October 2014
89
DEMO6 - dD6.6 Halfway assessment of the smart solar district
PC2: Ground plan
PC3: Sectional drawings
PC4: Notice describing the land and presenting the project
PC5: Facades and roofs drawings
PC6: Graphic material for assessing the integration of the construction project in its
environment
PC7 and 8: Photographs to locate the field in the near and distant environment
These documents have been sent in 10 copies to the Carros municipality. This large amount of
copies corresponds to the large number of public stakeholders which have to be consulted,
including the firefighting prevention department. Today, two building permits have been approved
and two are still under discussion. As lithium ion based batteries are a new technology (at this
scale), it brought a lot a questions and discussions about their implementation at this scale in
suburban areas like Carros. The two remaining building permit requests were approved in August
2014.
Civil works
Civil works for the PSB storage asset consisted in four main tasks:
- building the prefabricated hosting for the 1 MVA transformer
- installing a 2 m high fence around the site
- Installing concrete blocks to support the battery and PCS containers
- installing pipe sleeves and cables for grid connection
These civil works were completed in autumn 2014, and the following pictures show the different
phases of installation
Tuesday, 21 October 2014
90
DEMO6 - dD6.6 Halfway assessment of the smart solar district
Figure 42 - Civil works for the PSB storage asset
Installation
Installation of the battery and PCS containers was done by November 2013, as shown in the
following pictures:
Figure 43 - Installation phase for the PSB storage asset
Tuesday, 21 October 2014
91
DEMO6 - dD6.6 Halfway assessment of the smart solar district
Testing phase
After the installation of the three elements of the storage assets, tests have been conducted
between December 2013 and March 2014. During this test phase, the storage asset was
operated by SAFT (battery container) and ALSTOM GRID (converter and transformer)
The following list gives an overview of the different tests:
Check installation conditions
Check lightning chock between PCS and battery
Check communication MBMM – PCS
Check FSS of the battery
Check status fire
Check HVAC of the battery (and if it stops while the doors are open)
Check emergency stop
Check earth continuity
Check insulation resistance
Check EMC levels in the containers (battery + PCS) once on the site (near the primary substation)
Check earth continuity (Battery-PCS)
Check the adjustment of measures for insulation resistance (100 kΩ)
System response when measured insulation resistance is too low
Check voltage at the end of charging (<=818 V)
Check voltage at the end of discharging (>=609 V)
Fallback position if loss maximum current value from the MBMM
Check maximum current (<=505 A)
Complete charge with all ESSUs
Complete discharge with all ESSUs
Complete charge with only one ESSU
Complete discharge with only one ESSU
Justification for the choice of the strategy of connecting ESSU and test
Disconnecting an operating ESSU operating then reconnecting it after "creation" of a significant
imbalance (e.g. discharging highly an ESSU)
Stop the air conditioning and full charge / discharge (if possible, if the system allows)
Check of all the orders to the system
Order inconsistent instruction if possible
Check of all the retrieved variables during all the tests
Check of fallback position in case of communication loss between battery and PCS
Check temperature regulation in the container
Check fallback position in case of loss of battery auxiliary supply
Check fallback position in case of loss of PCS auxiliary supply
Check that MBMM alarms are taken into account in the PCS
The four most important tests for ERDF are the following:
(1)
(2)
(3)
(4)
Loss of the MV supply (alarm level 5)
Loss of the LV (auxiliaries) supply (alarm level 5)
Opening the DEIE in case of emergency (alarm level 3)
Communication loss between ACR and MCU (alarm level 5)
Tuesday, 21 October 2014
92
DEMO6 - dD6.6 Halfway assessment of the smart solar district
The final tests reports were submitted to ERDF on March 19th 2014.
3.1.4 Risk analysis
ERDF had to conduct a deep risk analysis of the PSB storage asset, based on internal SAFT
analysis and exchanges with its control and operation teams, as well as with the fire-fighters.
This section summarises the resulting analysis that described the main internal and external risks
associated with the storage asset, and the measures implemented to mitigate them.
Internal risks
Internal risks are risks proper to the battery and its components. According to SAFT, events
related to the use of lithium ion batteries are the following:
Fire
Evolution of toxic gases (carbon monoxide CO and hydrogen fluoride HF): A complete
3
combustion would lead to the release of 3 m of gas per kWh installed. This gas would be
3
released into the container, which would be able to contain a few m if combustion was
incomplete. Larger amount of gas would be discharged to the outside through a safety
valve. Other gaseous substances can also be released in small quantities from plastics
(polypropylene) and other cable insulation material (PVC), electronic cards, but these are
not specific to the use of a lithium ion battery.
Cut-through (presence of voltage on an accessible area normally not under tension)
Evolution of liquids: In terms of liquid effluent, in normal operation, the system of energy
storage itself generates no liquid discharge. Under fault conditions, leading to a
degradation of the storage system, there is no liquid waste.
External risks
These risks are associated with the external environment:
Cataclysms: Earthquakes, hurricanes, volcanoes, floods, dam failures, falling aircraft.
Storage is located in an area not subject to these risks. Even if one of these major events
was to cause the ruin of the storage system, the loss of the system would only represent a
small fraction of the total damage of the disaster.
Lightning
Soil quality
Malicious act
Bushfire
Road accident
Tuesday, 21 October 2014
93
DEMO6 - dD6.6 Halfway assessment of the smart solar district
Implemented measures
Fire
Each container is equipped with a system for detecting flames, heat and smoke as well as
sprinklers when needed. If for some reason the cells had to climb to a temperature above 150°C
for over 15 minutes, the fire protection system would operate by releasing nitrogen in the container.
Figure 44 - Fire Suppression System (FSS)
Evolution of liquids
In case of fire, firefighters centre has received the information to exclusively use non-conductive
fluid such as CO2 when they intervene. They will also set a “water curtain” to protect adjacent
objects.
Furthermore, retention is integrated to each rack with a capacity of up to 100% of the total volume
of electrolyte in all the elements of the cabinet.
Container access
ERDF surrounded each storage asset by a fence located at a sufficient distance to open the
side doors and allow longitudinal and unrestricted access to the inside of a container on foot. The
idea is to restrict the access to authorized staff by limiting the ground surface.
Battery is not releasing hydrogen; paragraph 2.1 of section 2925 of the ICPE on minimum
distances from the boundaries of ownership does not apply. (Voir section 3.2)
Site selection
Storage asset is located outside of any volcanic and highly windy area to limit the amount of
dust which may cause short circuits in all electrical installations.
To prevent the deformation of the container and keep it perfectly sealed, storage is located on
stable ground.
Prevention against electrical risks
The PSB storage asset has two separate electrical power supplies:
Medium Voltage (MV) supply (20 kV) from the primary substation
Low Voltage (LV) supply (400V) from the LV network passing through the adjacent street.
Tuesday, 21 October 2014
94
DEMO6 - dD6.6 Halfway assessment of the smart solar district
It was decided to connect the battery on a dedicated MV feeder to ensure the presence of a
reliable mean of disjunction and remote monitoring by the Regional Control Center (ACR) of
Toulon.
This dedicated circuit breaker is redundant with:
the MV switch upstream from the 20 kV transformer
ALSTOM's main circuit breaker installed at the transformer secondary circuit associated
with the inverter.
Main DC circuit breaker installed in conversion output AC / DC
DC circuit breakers 700 VDC input of each ESSU
The "normally open" contactors at the top of each battery module
The MV feeder is coupled to an anti-islanding protection in line with the French regulation
thresholds.
The key element relating to electrical safety is that the 700 VDC contactors are "normally open",
i.e. they must receive an external power supply to remain closed.
Consequently, any cut on the auxiliary table has the effect of instantly opening the contactors and
interrupting the power supply in all individual cells.
These multiple barriers on the main circuit, validated by the various project stakeholders,
seem sufficient to ensure the opening of the circuit if necessary. Moreover, according to
SAFT, the absence of current in cells guarantees ERDF against the risk of fire.
In addition, a LV supply (400V - 36 kVA) is provided for supplying the auxiliaries and HMI tool for
local control of the inverter. This device is coupled to a UPS inverter type to ensure the continued
operation of the supervision of the same set in case of power outage on the LV grid.
An additional emergency stop button of the battery is placed outside the container: the use of
this emergency stop is restricted to agents working on the local battery in the event they are faced
with an accidental situation uncontrolled by the remote monitoring station.
Malicious act
An exterior fence with access restricted to authorized staff is installed. Furthermore, the container
is locked.
Tuesday, 21 October 2014
95
DEMO6 - dD6.6 Halfway assessment of the smart solar district
Figure 45 - Exterior fence
Bushfire
The fenced area has no shrub or plant likely to spread a brush fire.
Figure 46 - Fenced area
Tuesday, 21 October 2014
96
DEMO6 - dD6.6 Halfway assessment of the smart solar district
Road accident
The closeness to the road could cause an external risk as a vehicle could hit the container and
cause a perforation (the container would not be airtight anymore). The fire suppression system
(FSS) would then lose its effectiveness as the perforation of the container would allow the
presence of oxygen.
The container is installed on a plot:
elevated relatively to the adjacent roadway
separated from the road by a concrete gutter (80cm deep and 60cm wide)
4m away from the boundary of ownership
Enclosed by a wire fence 2.3m high.
Given the fact that this location of Carros has never experienced this type of accident and
the street is not busy, the risk is considered very unlikely to occur.
Lightning
This risk is prevented by the implemented anti-lightning system:
Direct protection (primary protection): device capturing lightning current, low impedance
grounding…
protection against indirect effects (secondary protection), which prevents the risk of
malfunctions due to surges, through the implementation of various measures (lightning
arrestors, earth connections)
The entire storage area is connected with neutral earth ground 1 Ω and interconnected earths: no
identified risk.
Fire of a building or facility nearby
To remove the risk of a domino effect following a fire close to the container, SAFT recommends
that it should be at a distance of 9 m such that the radiation will be less than 8 kW / m².
This recommendation is not feasible on the site but it is considered that the 3 m that separate the
battery from the next building (primary substation building) and the PCS container are sufficient,
given the very low fire risk linked to an intrinsic defect in the battery, and the risk from bushfire or
motor vehicle collision.
Firefighters
In case of fire, firefighters receive the information to use only CO2 in case of intervention.
Specific training has been provided on site by the manufacturer SAFT. They will set a “water
curtain” to protect the adjacent building.
In case of a firefighter intervention, ERDF would have previously:
Opened the MV feeder supplying the storage asset at the primary substation
Pushed the emergency stop button located on the property line (redundant with the
FSS system which opens the 10 contactors)
Cut the LV auxiliary circuit breaker 36 kVA (manually on site)
Tuesday, 21 October 2014
97
DEMO6 - dD6.6 Halfway assessment of the smart solar district
Periodic inspection
Periodic visits are planned; they include the verification of the following: security system, fire
extinguishers, electrical, earthing, ventilation, and air conditioning.
3.1.5 Control and operation principles
Within ERDF, the primary substation equipments are managed through two entities:
The control team, based at the Regional Control Center (ACR), is in charge of
controlling remotely the MV grid, this includes namely the primary substations and
renewable generators connected to the MV grid.
The operation team, called AMEPS (Agency for Maintenance and Operation of
Primary Substation), is in charge of operation and maintenance for primary substations.
The technicians intervene on site, 24/24 and 7/7.
For the distinction between control and operation within ERDF, see the glossary.
These two teams had to be trained to the new equipments, and ERDF implemented some
adjustments to comply with its established control and operation rules, and to ensure more safety
and reliability.
Adjustments proposed by ERDF
As a client of the storage asset, ERDF demanded several adjustments in order to ensure a safe
operation. These adjustments are listed below:
Possibility to open remotely the main circuit breaker of the PCS through a
proprietary ERDF technology.
The Device for Exchanging Operational Information (DEIE) is the mean to automate the exchange
of information and control renewable energy generators connected to the Medium Voltage grid. It
communicates with the Regional Control Center (ACR) through an ERDF protocol called SIT-R.
The DEIE makes it possible to remotely open the main circuit breaker of the PCS
Tuesday, 21 October 2014
98
DEMO6 - dD6.6 Halfway assessment of the smart solar district
Figure 47 - Device for Exchanging Operational Information (DEIE)
3.1.5.1.1
Installation of an emergency stop push button reachable from outside
Figure 48 - Localisation of the emergency stop push button
An emergency stop push button is located outside the fenced area in a cabinet (which can be
opened with a triangular key). It opens the DC circuit breakers of the battery.
Installation of terminal covers inside the PCS container
ERDF installed covers on terminal under voltage within the PCS to prevent electrical risks
Tuesday, 21 October 2014
99
DEMO6 - dD6.6 Halfway assessment of the smart solar district
Update of the grounding system to comply with the rules of access to the network
established by the French standard NF C18-510
Control principles
The Regional Control Centre (ACR) based in Toulon is responsible for controlling the MV
voltage grid. It is operational 24/24 and 7/7.
It has a dedicated storage asset HMI (see next section) in order to monitor and control the storage
asset. This was installed during the test phase in order to collect feedback from the grid controllers
and optimise it.
The ACR is able to
Send charge and discharge schedules to the battery
Remotely open the main circuit breaker of the storage asset
Retrieve the alarms of the PCS (The PCS deals with all alarms from the battery or the
PCS)
Gather the operational data of the storage asset (state of charge…)
Furthermore, the connection between the ACR and the storage asset is tested every minute
(adjustable parameter). In case of no response from the storage system, a level 3 alarm is
triggered, the battery stops and the grid controller uses the DEIE to ensure the opening of the main
power circuit.
The following control strategy was decided: being able to ensure safety 24/24 and doing
troubleshooting only during workable hours.
ACR can call on the operation teams which can then intervene on site.
Figure 49 - Regional Control Centre
Operation principles
The following operation strategy was decided: being able to ensure safety 24/24 and doing
troubleshooting only during workable hours.
Tuesday, 21 October 2014
100
DEMO6 - dD6.6 Halfway assessment of the smart solar district
ERDF wrote and displayed instructions on site for operation teams (see appendix 3)
The training strategy was to form the whole team to ensure the safety, and to select a few people
that were trained more deeply if possible with the technicians from SAFT or ALSTOM.
ERDF operation teams can access the inside of the fenced area and the containers, so they
have been trained to the existing risks and to the related emergency measures.
The slow kinetic of a fire enables evacuation of the hazardous area by ERDF staff
To prevent the risks associated with maintenance and troubleshooting, the following measures are
implemented:
Only trained and certified operators intervene on the containers and cabinets
All metal parts are grounded with annual audit as for other ERDF facilities
No smoking within the fenced area
3.1.6 Communication and Human Machine Interface
(HMI)
The design of an appropriate Human Machine Interface (HMI) for the storage asset has been an
iterative work involving Alstom Grid, SAFT and ERDF. This storage asset HMI is available at the
ACR, in order to display the state of the storage asset, including the possible alarms.
There are two versions of the HMI:
A “black” one, which is simplified and allows the technicians of the ACR to monitor the
asset with the charge and discharge schedules for active power and the display of the
alarms
A “blue” one, which is more specific to the PCS. It is possible to connect with the PCS, to
have more information regarding the PCS alarms. It is possible to achieve a better
diagnostic and to send charge and discharge schedule with reactive and active power
The “black” HMI is described in this section. This storage asset HMI will be extended for the other
grid batteries. Buttons are already present, as shown in the following figure:
Figure 50 – Selection table
Master Control Unit (MCU)
The Master Control Unit (MCU) is a computer responsible for monitoring the storage asset. The
selected architecture is presented on the next figure. The storage asset is monitored though a
remote HMI on the NBA server. There is no connection between the NEM and the MCU for the
moment. The storage asset is still controlled manually through the ACR.
Tuesday, 21 October 2014
101
DEMO6 - dD6.6 Halfway assessment of the smart solar district
Figure 51 - Architecture
The function of the MCU regarding the storage asset is:
1. The storage asset HMI from the MCU makes it possible to send a charge / discharge
schedule of active power for the storage asset for the next 24 hours at a 30 minutes time
step
2. The MCU gathers the schedule from the HMI e-terrabrowser and sends the
corresponding instructions (set points) to the battery through the PCS, using the OPC
protocol
3. Operating data of the storage asset are sent to the MCU via the OPC protocol. These
data can be displayed though the HMI of the MCU
4. The controllers in the ACR can monitor in real time the operation of PCS/Battery, in
particular:
a. Displaying alarms
b. Monitoring the battery SOC
c. Monitoring the system state
d. Controlling the operating modes of the system : start, stop, standby
Presentation of the interface
The storage asset HMI is displayed on a dedicated computer at ACR. It must be simple to use,
and there should not be too many alarm sounds, in order for the controllers to work properly.
The main display from the HMI is presented on the next figure. There are several boxes for:
The battery state
The PCS state
The instructions
The load curve
Tuesday, 21 October 2014
102
DEMO6 - dD6.6 Halfway assessment of the smart solar district
The alarm list
Figure 52 - Main screen of the storage HMI
Battery box
The following information associated with the battery state is displayed in the battery box:
Total capacity (560 kWh)
Stored energy (in kWh)
Remaining capacity (in kWh)
Charging/discharging power (in kW). Positive values are associated with discharge
Battery State of charge (SOC) (in %) with a visual display
Battery status: Nominal / Standby / Stopped…
Number of closed contactors
Tuesday, 21 October 2014
103
DEMO6 - dD6.6 Halfway assessment of the smart solar district
Figure 53 - Battery box within the storage asset HMI
PCS box
The following information associated with the PCS state is displayed in the PCS box:
State of the PCS (fault/standby/stopped…)
Monitoring mode (local/remote)
Alarms and alarms acknowledgment
Measured outputs:
o Current (A)
o Voltage (kV)
o Frequency (Hz)
o Active power (kW)
o Reactive power (kW)
Figure 54 – PCS box of the storage asset HMI
Instruction box
Tuesday, 21 October 2014
104
DEMO6 - dD6.6 Halfway assessment of the smart solar district
The instruction box allows for sending battery schedules. It is represented in the figure below:
Figure 55 - Instruction box of the storage asset HMI
Output power box
Figure 56 - Output power box of the storage asset HMI
The output power box provides the load curve of the storage asset, as shown in the figure above
Event box
Tuesday, 21 October 2014
105
DEMO6 - dD6.6 Halfway assessment of the smart solar district
Figure 57 - Event Box of the Storage asset HMI
The event box of the storage asset HMI provides the list of all the occurred events. Some of them
are linked with alarms. Alarms have five levels of severity (level 5 is the highest level)
Battery and PCS alarms are managed automatically by the PCS. In case of an alarm, the PCS and
the battery will be set in safety mode (power circuit opened). The only role of the ACR controller
outside workable hours in case of an alarm is to check that the PCS is stopped. If it is not the case,
the controller opens the power circuit though the DEIE system (reliable and in operation for
renewable energy generators).
3.1.7 First results of the PSB
The storage asset at the primary substation is now under operation and ERDF gathered some first
results. This section describes the first results with some charge and discharge schedules, and
computes the efficiency of the system.
This efficiency will be computed in the final deliverable.
Tuesday, 21 October 2014
106
DEMO6 - dD6.6 Halfway assessment of the smart solar district
3.1.8 Overview of the status of the other storage assets
The PSB storage asset is operational, and the three additional grid batteries will be installed during
autumn 2014. The process is quite similar, as ERDF used the experience gained on the PSB
installation. This section aims at describing the differences with the PSB as well as the actual
status of the three other grid storage asset: the secondary substation battery (SSB) and the two
low voltage grid batteries (LVGB)
Comparison between the PSB and the other batteries
The three other grid storage assets, are low voltage storage assets, i.e. they are
connected to the LV distribution grid (400 V). This has the following
consequences:
There is no need for a dedicated ancillary supply. The two LVGB have an ancillary circuit
derived from the power circuit, and the SSB has an ancillary circuit derived from the
General Distribution Panel (GDP) of the secondary substation
Instead of a DEIE, which is normally used for MV generators, Remote Switch Interfaces
(ITI) are used. They are normally used on the MV voltage to remotely reconfigure the grid:
the use of ITI on the low voltage grid to remotely open the circuit breaker of the storage
assets in case of an emergency is an innovation for ERDF.
The operators are not from AMEPS but from the Grid Operation Agency (AREX).
Although the grid storage assets are located on the LV grid, they will still be controlled by
the ACR (which normally only controls the MV grid)
Here are the further differences with the PSB:
PCS are supplied by SOCOMEC, using 33 kVA standard units.
The three grid storage assets are involved in PV integration, as they are located close to
PV generators
Here are the similarities with the PSB:
The same storage asset HMI will be used at ACR
ACR can open remotely the power supply through a proper ERDF system
The control and operation strategy will be the same. Regarding operation for example,
all the technicians will be able to set the storage asset in safety, but only two technicians
will be able to troubleshooting in workable hours.
Secondary Substation Battery (SSB)
Here are the main features of the SSB storage asset:
Tuesday, 21 October 2014
107
DEMO6 - dD6.6 Halfway assessment of the smart solar district
The battery container is similar to the PSB battery container, but it has more capacity: 600
18
kWh. It is located on the parking of “LA POSTE ”, separated by a road from the secondary
substation
The Power Conversion Systems are located within the secondary substation
19
building. 4 modules of 66 kVA are combined in order to reach 250 kW of nominal power,
i.e. the maximum power for a client en the LV grid.
The storage asset is connected to a direct LV feeder, with a SME meter
Auxiliary circuit is supplied by the GDP of the secondary substation
Here is the status of the SSB installation by September 2014:
The battery container is ready to be installed
The General Distribution Panel (GDP) of the PCS are under construction
Civil works are under process in the secondary substation, in order to install the PCS and
auxiliary cabinets
The penetration sleeves under the roadway between the PCS and the battery container
have been realised.
The parallel circuit breaker (PCB), which will disconnect the district from the main grid
during islanding operation has been installed, and integrated in a “parallel cabinet”. This
“coupling cabinet”, adjacent to the GDP of the primary substation, is shown on the picture
below:
Figure 58 - Parallel cabinet in the "Dock Trachel” secondary substation
Low Voltage Grid Battery (LVGB)
Here are the main features of the LVGB storage asset:
18
19
The battery and the PCS are integrated in the same 10 feet container
French Post company
250 kW is the maximum power to be connected to the LV grid.
Tuesday, 21 October 2014
108
DEMO6 - dD6.6 Halfway assessment of the smart solar district
There are two ESSUs per container, reaching 106 kWh of energy capacity
Each container has a 33 kW PCS
Each container is connected to the LV grid and metered with a SME meter
Ancillary circuit and power circuit are supplied by the same grid connection
Here is the status of the SSB installation by September 2014:
The first container which will be tested at the Renardières research centre is built, as
shown in the next pictures. The two other ones which will be installed in Carros will be
ready by the beginning and the end of October
Figure 59 - Built container at SOCOMEC factory in Benfeld
Civil works are ongoing. For one asset, the grid connection is already built, as shown in the
picture below:
Figure 60 - Grid connection for the LVGB near Cailletiers secondary substation
Tuesday, 21 October 2014
109
DEMO6 - dD6.6 Halfway assessment of the smart solar district
3.1.9 Conclusion
The installation and commissioning of the storage asset is a new process at ERDF, and requires a
lot of different steps, on the administrative, security and training side. The experience gained on
the PSB storage asset will be used to install the further three grid storage assets. These assets will
be used for the next winter experimentation (December 2014).
One of the main lessons learned is the importance of safety procedures. ERDF conducted a deep
safety analysis, and elaborated some adjustments during the installation to comply with safety
procedures. The work must implicate every stakeholder: manufacturers, ERDF control and
operation teams, fire-fighters, municipality, owner of the site…
For now, only one storage asset is under operation and the charge/discharge schedules are sent
from the ACR. Later on, once the Network Battery Aggregator (NBA) is implemented, it will be able
to send instructions to the four storage assets, as well as to aggregate them in order to deliver
services for the different use cases.
Tuesday, 21 October 2014
110
DEMO6 - dD6.6 Halfway assessment of the smart solar district
3.1.10 Glossary
Agency for Maintenance and Operation of Primary Substation (AMEPS)
This agency is in charge of the operation of primary substations, on a 24/24 basis. The technicians
maintain and operate the primary substations, and are involved in the operation of the PSB storage
asset. Outside workable hours, they are able to set the storage asset on safety mode. During
workable hours, they are able to troubleshoot the storage asset.
Contactor
A contactor is an electrically controlled switch used for switching a power circuit, similar to a relay
except it has higher current ratings. A contactor is controlled by a circuit which has a much lower
power level than the switched circuit. Within the NICE GRID storage asset, each ESSU has a
contactor.
Control and operation of the distribution grid
Within ERDF, grid management is separated between control (remotely) and operation (on site).
Control is done by the ACR, which monitors only the MV grid and primary substations, and BECS,
which is in charge of LV grid and secondary substation. ACR is working 24/24. Operation is done
by AMEPS for primary substations and AREX for the MV and LV grid. ACR can call on technicians
from AMEPS and AREX to intervene on site, and the technicians have to report to the ACR.
DEIE
DEIE = Dispositif d’Echange d’Information Exploitation = Device for exchanging operating
information.
The DEIE is a communicating device installed between a renewable energy generator connected
to the MV grid and the Regional Control Center (ACR).
Its functionalities are:
Displaying U (voltage), P (active power) and Q (reactive power)
Coupled/decoupled state
Its order abilities are:
Decoupling
Limitation of generation power to a set value (P and Q)
Modification of the automatic isolation during works under MV voltage
Load shedding request
Within the NICE GRID project, the DEIE allows the ACR to remotely switch off the power supply
circuit of the PSB storage asset.
Islanding
In the NICE GRID project, islanding consists in disconnecting a secondary substation feeding 12
commercial clients from the main grid and supplying it only with a Li-ion based storage asset and
installed PV generators
Linky meter
Linky is a communicating meter, which means that it can receive and send data without the need
for the physical presence of a technician. Installed in end-consumer’s properties and linked to a
Tuesday, 21 October 2014
111
DEMO6 - dD6.6 Halfway assessment of the smart solar district
supervision centre, it is in constant interaction with the network. The Linky meter is able to receive
orders and transmit information remotely. To do this, it communicates to a hub, a kind of minicomputer installed inside transformation substations managed by ERDF. The hub is linked to the
ERDF supervision centre.
Master Control Unit (MCU)
The Master Control Unit (MCU) is a computer responsible for monitoring the PSB storage asset; it
communicates with the Field Control Units (FCU) installed at each storage asset level (SSB and
LVGB). Through a small SCADA system, the Master Control Unit can act as data historian,
protocol driver, etc., minimising the dependency of the system reliability on the communication
availability. The Distributed Control Units support advanced power applications such as active
power control, voltage fluctuation smoothing and islanding monitoring.
The communication links are the following:
For the PSB storage assets: PCS <> MCU <> ACR and NBA
For the SSB and LVGB: PCS <> FCU <> MCU <> ACR and NBA
Power Converter System (PCS)
The PCS is a bidirectional system which makes it possible to charge the batteries from the grid and
20
to discharge the batteries on the grid. Relying on an Insulated-Gate Bipolar Transistor (IGBT )
based 4-quadrant converter system; it can convert direct current into alternate current and vice
versa. It serves as charger of the battery, can manage set points for the battery, and is retrieving
the battery alarms. PCS communicates with the MCU to exchange storage assets state values, set
points, alarms.
Regional Control Centre (ACR)
The 31 Agence Conduite Régionale (ACR)= Regional Control Center, ensure the proper
functioning of the MV grid 24 / 24. Each one ensures continuity of supply to one to two million of
end customers. ACRs are always looking to optimize the power scheme by allocating the most
favorable power flows in primary substations (PS), on the MV network and secondary substations.
They aim to restore quickly the customer supply in the event of a service interruption. They also
ensure secure access to the network for technician interventions (operating staff, subcontracting
companies).
Storage asset
A storage asset is a combination between a battery working with direct current (DC) and a Power
Converter System (PCS) working as a charger for the battery and a bidirectional converter from
direct current (DC) to alternative current (AC).
Storage asset HMI
20
The insulated-gate bipolar transistor (IGBT) is a three-terminal power semiconductor device
primarily used as an electronic switch. In newer devices, it is noted for combining high efficiency
and fast switching.
Tuesday, 21 October 2014
112
DEMO6 - dD6.6 Halfway assessment of the smart solar district
The storage asset HMI is a Human Machine Interface (HMI) located at the Regional Control
Centre (ACR) designed for the remote display of the storage assets state and the monitoring of
these assets.
Acronyms
Definition
ACR
Agence Conduite Régionale = Regional Control Center
AMEPS
Agence de Maintenance et Exploitation des Postes Sources = Agency for maintenance and operation of primary
substation
AREX
Agence d’Exploitation Réseau = Agency for grid operation
BMM
Batteries Management Module (SAFT)
BPL
Broadband over Power Lines (Modem ALSTOM)
CAN
Controlled Area Network
DEIE
Dispositif d’Echange d’Information d’Exploitation = device used to opean remotely the main circuit breaker of the storage
asset
DREAL
Direction Régionale de l'Environnement, de l'Aménagement et du Logement = Regional Directorate for Environment,
DSO
Planning and Housing
Distribution System Operator
ESSU
Energy Storage System Unit (SAFT Batteries)
FCU
Field Control Unit (ALSTOM)
FSS
Fire Safety System
GDP
General Distribution Panel
HMI
Human Machine Interface
HVAC
Heating Ventilation Air Conditioning
ICPE
Classified Installations for the Protection of Environment
LV
Low Voltage
LVGB
Low Voltage Grid Battery
MBMM
Master Batteries Management Module (SAFT Batteries)
MCU
Master Control Unit (ALSTOM)
MV
NBA
NEM
Medium Voltage
Network Batteries Aggregator (which controls the operation of grid batteries)
Network Energy Manager
Tuesday, 21 October 2014
113
DEMO6 - dD6.6 Halfway assessment of the smart solar district
PCB
Parallel Circuit Breaker
PCS
Power Converter System
PSB
Primary Substation Battery
PV
PhotoVoltaic
SOC
State Of Charge of the batteries
SOH
State Of Health of the batteries
SSB
Secondary Substation Battery
TSO
Transmission System Operator
UPS
Uninterruptible Power Supply
Tuesday, 21 October 2014
114
DEMO6 - dD6.6 Halfway assessment of the smart solar district
3.1.11 Appendices
Appendix 1 – Primary substation map
Tuesday, 21 October 2014
115
DEMO6 - dD6.6 Halfway assessment of the smart solar district
Appendix 2 – Technical date of the PSB storage asset
Tuesday, 21 October 2014
116
DEMO6 - dD6.6 Halfway assessment of the smart solar district
Appendix 3 – Safety procedure for the PSB
Tuesday, 21 October 2014
117
DEMO6 - dD6.6 Halfway assessment of the smart solar district
Tuesday, 21 October 2014
118
DEMO6 - dD6.6 Halfway assessment of the smart solar district
Tuesday, 21 October 2014
119
DEMO6 - dD6.6 Halfway assessment of the smart solar district
Tuesday, 21 October 2014
120
DEMO6 - dD6.6 Halfway assessment of the smart solar district
3.2 Halfway assessment of grid batteries and
converters experiments
The target of this section is to describe all the tests which have been performed on the
SUNSYS PCS² 33TR in order to demonstrate the compliance of its functionalities,
capabilities, performances & protections with the requirements of the Nice Grid project for the
On Grid application.
In this project, the SUNSYS PCS² 33TR is associated with the following equipment:
Lithium-Ion batteries + their management system
SAFT.
BPL Modem + Field Control Unit (FCU)
ALSTOM.
So, a part of the tests plan was dedicated to the compatibility between these equipment and theirs
interfaces.
In the real application of the Nice Grid project, all these equipment will be integrated in 3 10ft
containers of 33kW and 106kWh like illustrated by the following figure:
For the preliminary tests described hereafter, the devices were not integrated in the container and
were not associated with the additional auxiliaries like the HVAC (Air conditioning) and the FSS
(Fire Safety System).
The full tests of the container will be performed in September & October 2014 after its construction
in the SOCOMEC factory and in Concept Grid (EDF R&D laboratory). These tests are not critical,
in case of gap with the expectations, because the impact will affect only the logical sequences
(easy to solve).
Tuesday, 21 October 2014
121
DEMO6 - dD6.6 Halfway assessment of the smart solar district
Acronyms
Definition
AGDP
Automatic Grid Disconnection Protection.
AID or AIP
Anti-Islanding Device or Protection
BMM
Batteries Management Module (SAFT)
BPL
Broadband over Power Lines (Modem ALSTOM)
CAN
Controlled Area Network
CB
Circuit Breaker
DSO
Distribution System Operator
ECSE
Energy Converter & Storage Equipment (SOCOMEC Converter + SAFT Batteries)
EMS
Energy Manager System (~NEM & NBA in the Nice Grid Project)
ESSU
Energy Storage System Unit (SAFT String Batteries)
FCU
Field Control Unit (ALSTOM)
FSS
Fire Safety System.
GDP
General Distribution Panel.
HMI
Human Machine Interface.
HVAC
Heating Ventilation Air Conditioning.
IMD
Maximum Discharge Current.
IMR
Maximum Charge Current (max 5 seconds).
IMR_C
Maximum Continuous Charge Current.
LBS
Load Break Switch.
MBMM
Master Batteries Management Module (SAFT)
MCU
Master Control Unit (ALSTOM)
NBA
Network Batteries Aggregator (which controls the operation of grid batteries)
NEM
Network Energy Manager
PCS²
Power Converter & Storage System (SOCOMEC)
PDO
Process Data Object (CANOpen)
PLC
Power Line Communication Carrier
Tuesday, 21 October 2014
122
DEMO6 - dD6.6 Halfway assessment of the smart solar district
PV
PhotoVoltaic
RPDO
Received Process Data Object (CANOpen)
RSDO
Received Service Data Object (CANOpen)
SC
Short-Circuit
SDO
Service Data Object (CANOpen)
SMU
Safety and Monitoring Unit (electronic board inside each battery module)
SOC
State Of Charge of the batteries.
SOH
State Of Health of the batteries.
SPD
Surge Protection Device.
TPDO
Transmitted Process Data Object (CANOpen)
TSDO
Transmitted Service Data Object (CANOpen)
TSO
Transmission System Operator.
UPS
Uninterruptible Power Supply.
VFRT
Voltage Fault Ride Through
VMD
Maximum Charge Voltage
VMR
Minimum Discharge Voltage
Tuesday, 21 October 2014
123
DEMO6 - dD6.6 Halfway assessment of the smart solar district
3.2.1 Technical reminders
Objective of the full system
The 33kW containers will be localized on 2 different points of the LV grid in order to support it
in the stability of electrical values (mainly the voltage in our study case).
This type of system will ensure the management (shaving / shifting / …) of the local productions &
consumptions peaks by receiving, from central system, set points for active power & reactive
power (To be confirmed).
The target of the project is to make the demonstration that this kind of solution allows the massive
integration of PV plants without impact on the grid and to reduce the reverse currents flows on it.
General communication architecture
Simplified single line Diagram
Tuesday, 21 October 2014
124
DEMO6 - dD6.6 Halfway assessment of the smart solar district
3.2.2 Equipment description
SUNSYS PCS² 33TR (TR = with insulation transfomer)
Introduction
The SUNSYS PCS² Family is a bidirectional converter system acting as a current
generator:
The SUNSYS PCS² is a modular architecture solution (Modulo 33kW) which allows:
A maximised yield thank to Dynamic Power Control function (DPC).
An upgradeable solution.
A high level of availability.
Easy, secured & fast maintenances operations thanks to Hot-Swap solution.
Modular Architecture:
Tuesday, 21 October 2014
125
DEMO6 - dD6.6 Halfway assessment of the smart solar district
DPC Function:
Power Sharing Mode :
All the converter modules work permanently in parallel and balance each
other the requested power whatever the level of this power.
Dynamic Power Control :
This function allows a "wattmetric" management of the modules. According
to the power requested by the battery or the load, the PCS² will use only
the optimized number of converter modules.
Tuesday, 21 October 2014
126
DEMO6 - dD6.6 Halfway assessment of the smart solar district
The PCS SUNSYS is already ready to be interfaced with its environment:
Network Management System / Scada (NEM).
Batteries Management System (BMS).
Compatible with different type of batteries technologies.
Internal single line diagram
Technical features
Electrical features :
DC input
Voltage
Max Current (Charge & Discharge)
AC output
(Integrated
450 850
[VDC]
[A]
80
Nominal voltage
[VAC]
400 (3PH)
Voltage range
[VAC]
320 480 (3PH)
Tuesday, 21 October 2014
127
DEMO6 - dD6.6 Halfway assessment of the smart solar district
output
Frequency
[Hz]
50
transformer)
Frequency range
[Hz]
47,5 51,5
Rated power
[W]
33 300
Maximum power
[%]
110% for 30 min
Rated current
[A]
48
Max current
[A]
53
Power factor range
Total harmonic distortion
+/-1
[%]
<3
Efficiency (according to European standard)
[%]
96
Consumption
30
[W]
Mechanical features :
Dimensions
Height
(Control Unit)
1400
[mm]
Width
600
[mm]
Depth
795
[mm]
Surface
0,5
[m²]
Weight
330
[kg]
Noise
< 60
[dB]
Environmental conditions :
Thermal
Operating temperature range
-5 +40
[°C]
Environmental category
Dissipation
Requested cooling
3
[m /h]
Tuesday, 21 October 2014
Indoor space
[W]
1 750
1280
128
DEMO6 - dD6.6 Halfway assessment of the smart solar district
Humidity
Without condensation
[%]
5 95
Altitude
Without de-rating
[m]
1 000
Compliance with standards and directives
CERTIFICATION
REFERENCE STANDARDS
CE MARK
2004/108/CE EMC
2006/95/CE Safety Low Voltage
Marked for inverter safety
(TUV)
EN 62109-1 EN 62109-2
EN 60950-1-2007 (Information transmission system only)
EMC test
EN 61000-6-3 : 2007
EN 61000-6-2 : 2006
EN 61000-3-12 : 2006
EN 61000-3-11 : 2001
As the SUNSYS PCS² range is globally based on the SUNSYS PV inverter range most of the
standards & directives compliancy have been already qualified by a third party.
Tuesday, 21 October 2014
129
DEMO6 - dD6.6 Halfway assessment of the smart solar district
SAFT Lithium-Ion Batteries & their management system
Introduction
Within the frame of NICE GRID project SAFT will deliver a battery system solution based on Li-ion
technology. This technology is used for enhanced capabilities for both energy and power
discharges.
Using modular construction, SAFT has designed a standard and scalable energy storage solution
that meets a wide variety of application needs.
The system relies on three main modules:
The SYNERION
= Module of lithium-ion module
The BMM
= Batteries Management Modules for 1 string of SYNERION
modules.
The MBMM = Master Batteries Management Modules for several BMM management.
SYNERION LI-ION MODULES
In order to reach ESSU voltage levels, the battery is based on a modular architecture with a
28VDC maximum voltage module. The module consists of 14 cells willing in two branches in
parallel of seven cells each. This assembly is named 2P7S.
SYNERION 2P/7S module characteristics
SYNERION 24E 2P/7S model view
The Synerion Battery module is realised with following sub-parts:
one "SMU_I" electronic board.
one "BUSBAR" electronic board.
harness between electronics boards.
The main functions ensured by the SMU_I board are to:
monitore each cells voltage,
monitore module temperature at different points,
balance each cells,
calculate module SOH,
Tuesday, 21 October 2014
130
DEMO6 - dD6.6 Halfway assessment of the smart solar district
send cells voltage, module temperatures, alarms information, SOH,
receive self-test request, alarms reset request, balancing consign, current SOC,
manage self-test to verify the functionalities,
manage power-supply,
converte module voltage (to 5V) to supply High-Voltage electronic functions,
wake-up and deactivation when an external supply signal is present or not,
control self-power signal to be supplied even if the external signal is not present,
communicate with maintenance tool (diagnostic and reprogramming),
protecte and filter inputs and outputs.
Each module contains:
two power interfaces (one for the positive and the other one for negative),
two signal connectors (same connector / one for the input and the second one for the
output signal).
BMM:
The ESSU is a high power energy storage system compatible with high DC voltage and
performance which could reach up to 1KV & 160kW / ESSU.
Each ESSU (Energy Storage System Unit) is an electrical string of 24 series connected modules
and a BMM, altogether assembled into a double-side 19" rack.
The Battery Management Module (BMM) will perform all the functions necessary to manage and
protect the Li-ion cells.
An electronic module (called BMM) is required to manage and monitor several Synerion
modules serial connected.
The main functions of the BMM are :
Monitoring each module of the string (voltage, temperature, current, alarms),
Protecting the string with battery algorithms (IMD, IMR, etc),
Managing the electrical connection of the string on the DC Bus (opening / closing
contactor),
Communicating with the MBMM.
The modules and the BMM are mounted in 19” cabinets.
ESSU integration
Tuesday, 21 October 2014
131
DEMO6 - dD6.6 Halfway assessment of the smart solar district
Outgoing connections
SYNERION 24E Module
ESSU
BMM Module
Tuesday, 21 October 2014
132
DEMO6 - dD6.6 Halfway assessment of the smart solar district
Technical Features
Electrical features:
SYNERION Module 24E (at 25°C):
Voltage
Nominal
[VDC]
25,2
Max
28,2
[VDC]
Min
21
[VDC]
Current
Power
Maximum continuous discharge [A]
160
Maximum continuous recharge [A]
45
Maximum continuous discharge [W]
3800
Maximum continuous recharge [W]
1150
Peak discharge (in 5 sec)
[W]
8500
Peak recharge (in 5 sec)
[W]
5500
Capacity
(C/5 @ 25°C)
[Ah]
87
Energy
(C/5)
2200
[Wh]
Duration
Recharge time
BMM Module:
Voltage
Nominal (up to)
[h]
3
[VDC]
1000
Current
Maximum continuous
Power
Inrush 300ms
[W]
90
Stabilized
[W]
7
[A]
200
Consumption
Power supply
24 +/-5
[VDC]
Tuesday, 21 October 2014
133
DEMO6 - dD6.6 Halfway assessment of the smart solar district
ESSU panel (24 Modules SYNERION 24E + 1 BMM at 25°C):
Voltage
Nominal
605
[VDC]
Max
677
[VDC]
Min
504
[VDC]
Current
Power
Maximum continuous discharge [A]
160
Maximum continuous recharge [A]
45
Maximum continuous discharge [W]
91 200 (TBC by
SAFT)
Maximum continuous recharge [W]
27 600 (TBC by
SAFT)
Peak discharge (in 5 sec)
[W]
204 000 (TBC by
SAFT)
Peak recharge(in 5 sec)
Capacity
[W]
132 000 (TBC by
SAFT)
87
[Ah]
Energy
52 800
[Wh]
Tuesday, 21 October 2014
134
DEMO6 - dD6.6 Halfway assessment of the smart solar district
Mechanical features:
SYNERION Module24E:
Dimensions
Height
[mm]
131
Width
[mm]
448
Depth
[mm]
293
Weight
18,5
[kg]
BMM Module:
Dimensions
Height
[mm]
177
Width
[mm]
483
Depth
[mm]
385
Weight
14,2
[kg]
ESSU panel (24 Modules SYNERION 24E + 1 BMM):
Dimensions
Height
[mm]
2 000
Width
[mm]
1 200
Depth
[mm]
400
Weight
~600
[kg]
Environmental conditions:
Tuesday, 21 October 2014
135
DEMO6 - dD6.6 Halfway assessment of the smart solar district
SYNERION Module 24E:
Thermal
Operating temperature range
[°C]
+10 +40
Optimum at +30°C
Humidity
Dissipation
[W]
~10
Requested cooling
3
[M /h]
Natural convection
Without condensation
[%]
< 60
Optimum at 50%
Altitude
2 000
[M]
BMM Module:
Thermal
Operating temperature range
Humidity
[°C]
-20 +60
Dissipation
[W]
?
Requested cooling
3
[M /h]
Natural convection
Without condensation
[%]
95
Altitude
3 000
[M]
ESSU panel (24 Modules SYNERION 24E + 1 BMM):
Thermal
Operating temperature range
[°C]
+10 +40
Optimum at +30°C
Humidity
Dissipation
[W]
<300W
Requested cooling
3
[M /h]
Natural convection
Without condensation
[%]
< 60
Tuesday, 21 October 2014
Optimum at 50%
136
DEMO6 - dD6.6 Halfway assessment of the smart solar district
Altitude
2 000
[M]
3.2.3 Tests description & results
SUNSYS PCS² 33TR
Tools
In order to perform the tests described in the following paragraphs, SOCOMEC has built
equipment composed of the following main components:
A grid connection.
A DC source simulator.
An AC source simulator.
A SUNSYS PCS² 33TR.
Wattmeter (Yokogawa - WT3000).
An oscilloscope.
(Details about these components: Brands, models, last calibration or reference are described in the
tests reports).
Tuesday, 21 October 2014
137
DEMO6 - dD6.6 Halfway assessment of the smart solar district
Capabilities
P/Q circular characteristics
Date of the tests: November 2013 & January 2014.
The objective of this test is to verify that the SUNSYS PCS² is able to follow the rated
power in the four quadrants:
P>0 (Discharging)
P<0 (Charging)
P>0 (Discharging)
P<0 (Charging)
& Q>0 (Capacitive load).
& Q>0 (Capacitive load).
& Q<0 (Inductive load).
& Q>0 (Capacitive load).
The target, to pass the tests, is an error < 5%.
Tuesday, 21 October 2014
138
DEMO6 - dD6.6 Halfway assessment of the smart solar district
Conclusion: The test has been succeeded. (Maximum gap)
All the details are described in the internal confidential document: "Circular_Capability.xlsx"
Tuesday, 21 October 2014
139
DEMO6 - dD6.6 Halfway assessment of the smart solar district
Overload characteristics
Date of the tests: November 2013 & January 2014.
The objective of this test is to prove that the SUNSYS PSC² 33TR is able to withstand an
overload situation about 110% during 30 minutes either charging or discharging sequence
with the respect of the Battery voltage range :
Type
SYNERION
24E
Quantity of
modules
V min
Module
V max
Module
V min
String
V max
String
24
21 VDC
28,2 VDC
504 VDC
677 VDC
The overload capability is regulated from the following function:
The converter is able to deliver the following maximum power:
•
•
110% of nominal power for 30 minutes.
105% of nominal power for 1 hour.
Tuesday, 21 October 2014
140
DEMO6 - dD6.6 Halfway assessment of the smart solar district
A new overload is possible after a time that it is regulated from the following
function:
The time needed to allow another overload situation is:
•
•
60 minutes at 100% of nominal power.
10 minutes at less than 50% of nominal power.
Conclusion: The test has been succeeded.
Tuesday, 21 October 2014
141
DEMO6 - dD6.6 Halfway assessment of the smart solar district
Response time during P & Q set points variations
Date of the tests: Date of the tests: November 2013 & January 2014.
The objective of this test is to prove the capacity of the SUNSYS PCS² 33TR to act quickly
when a set point is modified.
The target is a response time lower than 100ms for the following sequences:
Q - Reactive power set points :
0% -50% of Qn (Inductive load)
0% -100% of Qn (Inductive load)
0% +50% of Qn (Capacitive load)
0% +100% of Qn (Capacitive load)
+100% of Qn -100% of Qn
-100% of Qn +100% of Qn
P - Active power set points :
0% +50% of Pn (Discharging)
0% +75% of Pn (Discharging)
+75% 0% of Pn (Discharging)
0% -50% of Pn (Charging)
0% -75% of Pn (Charging)
-75% 0% of Pn (Charging)
In order to avoid a heavy document, only 1 test of each part will be illustrated hereafter:
Tuesday, 21 October 2014
142
DEMO6 - dD6.6 Halfway assessment of the smart solar district
Q - Reactive power set points (Case N° 5):
Tuesday, 21 October 2014
143
DEMO6 - dD6.6 Halfway assessment of the smart solar district
P - Active power set points (Case N°2):
First test – with the original firmware :
A current overshoot can be seen either on the AC side and the DC side. The worst case is when
the load is applied in the crest of voltage. The time from 0 to the current overshoot peak is about
1,4ms.
To reduce this effect it has been inserted a ramp to limit this peak.
Tuesday, 21 October 2014
144
DEMO6 - dD6.6 Halfway assessment of the smart solar district
Second test with the updated firmware :
Conclusion: The test has been succeeded.
All the details are described in the internal confidential documents: "M208_Q_step_response.doc"
& "M208_P_step_response.doc"
Tuesday, 21 October 2014
145
DEMO6 - dD6.6 Halfway assessment of the smart solar district
SUNSYS PCS² HMI test
Date of the tests: February 2014.
The objective of this test is to verify the conformity of the navigation, the architecture of
menus and displays, the animation of the variable status and measures, the parameters, the data
logging and the maintenance information.
The main dashboard screen:
The SUNSYS PCS² power screen:
The Battery status screen:
Tuesday, 21 October 2014
146
DEMO6 - dD6.6 Halfway assessment of the smart solar district
Tests synthesis:
Test
Result
Note
Display Overview
Redo
In the user manual the figure 8.1.1 is different from synoptic
Verify the two graphics conditions:
charges and discharges
Passed
Main Menu statistics: Counter
Passed
Main Menu statistics: Graphs
Redo
Daily Trend: it isn't clear
Redo
Distribution: in the axe there is one 0 more
Redo
Discharge duration: the graph isn't in centre at hours reference
NOK
Battery temperature: without the sensor probe the measure is 0°C for long time
Passed
PCS Power
Passed
AC Measures
NOK
Battery Measures: time before charging/discharging not managed in
Main Menu Measurement
the SAFT battery
Main Menu Alarm & Warning
Passed
Sensor
Passed
Alarm
Passed
Warning
Main Menu History log
Passed
Main Menu Commands
-
Local command --> Disable
Passed
Alarm reset
Redo
Test Procedure: Led= KO; Ac contactor=loop; Fan Test=KO
Tuesday, 21 October 2014
147
DEMO6 - dD6.6 Halfway assessment of the smart solar district
Passed
Reset statistics
Redo
System Configuration: if start the procedure isn't possible go out without
complete the procedure
Main Menu set Preferences
Passed
Language
Passed
Data and Time
Passed
Buzzer
Passed
Display
Passed
Password
Main Menu set system configuration
Passed
Main Menu set PCS settings
Passed
Country /Network code
Redo
Connection parameters: only frequency threshold is possible modify
Passed
AC interface protection
Passed
Active Power
Passed
Reactive power
Passed
Battery type
Passed
Battery parameters
Passed
charge threshold
NOK
Maintenance parameters : not displayed
NOK
SOH calculation: not displayed
Main Menu set Option Device
NOK
Verify if the optional displayed are necessary
Main Menu set Connectivity
Passed
Peripherals
Passed
Services
Main Menu Service firmware version
Passed
System
Main Menu Service SN
Passed
Main Menu Communication Code
Passed
Main Menu Upgrade FW
Passed
Upgrade HMI firmware
Passed
Upgrade languages
Main Menu set Battery Setting
Conclusion: Most of the tests have been passed. However some of them have to be replayed
during the final tests with the last firmware version.
Tuesday, 21 October 2014
148
DEMO6 - dD6.6 Halfway assessment of the smart solar district
Abnormal functioning tests
Date of the tests: October 2013.
The objective of these tests is to demonstrate, either on the AC side or the DC side in case
of short circuits, that the SUNSYS PCS² is always safe and not the source of fire.
Short circuit on the IGBT electronic board:
A short circuit is created on the IGBT (Insulated Gate Bipolar Transistor) electronic board
(Phase 1 & 2) during discharging mode with a SOC equivalent to 50%.
Internal diagram on the IGBT board and localisation of the short circuits.
Phase 1
Phase 2
Short circuits are created thanks to relays mounted on the board:
Tuesday, 21 October 2014
149
DEMO6 - dD6.6 Halfway assessment of the smart solar district
Picture of the probes & sensors:
Tuesday, 21 October 2014
150
DEMO6 - dD6.6 Halfway assessment of the smart solar district
Hereafter the recorded curves during the short-circuit:
CH1= Output Current Phase
1 (100A/div)
CH2= Output Current Phase
2 (100A/div)
CH3= Output Current Phase
3 (100A/div)
CH4= Trigger TP8 (Enable
Converter) (5V/div)
It can be seen the peak of
the current at the time of the
short circuit of the IGBT
board.
Tuesday, 21 October 2014
151
DEMO6 - dD6.6 Halfway assessment of the smart solar district
When the short circuit appears, the SUNSYS PCS² asks immediately the opening of the DC
contactor.
After the test, we can assess the following situation:
The AC contactor is still operational.
The DC contactor is still operational.
The battery is still operational.
The DC fuses are OK.
The AC fuses of the phase 1 & 2 are blown but the AC fuses of the phase 3 are OK.
When we switch on the module, the alarm "AC voltage fault" appears".
IGBT power board after the test.
AC fuses of the phase 1 & 2
After replacement of the faulty components, all the functionalities of the power module are
recovered.
Conclusion: The test has been succeeded.
Tuesday, 21 October 2014
152
DEMO6 - dD6.6 Halfway assessment of the smart solar district
Short-circuit on the DC capacitors:
A short circuit is created on the DC capacitors board during charging mode under 18,6A &
580VDC.
In order to analyse possible fire propagation, a gas fibre is applied on the SUNSYS PCS²:
State of the DC capacitors board after the test:
Tuesday, 21 October 2014
153
DEMO6 - dD6.6 Halfway assessment of the smart solar district
Unlike the previous test, the contactors opening are not operated during the short circuit.
However the battery fuses are not blown and the battery is still operational.
The AC contactor and fuses are also in a good health.
There is no trace on the gas fibre.
The only damage component is the DC capacitors board.
After replacement of the faulty components, all the functionalities of the power module are
recovered.
Conclusion: The test has been succeeded.
Conformity with the standard
Because the SUNSYS PCS² range is, in terms of hardware & firmware, the equivalent of
the SUNSYS PV inverters range, its certification is inherited from it:
CE marking.
Safety TUV certification:
EN 62477,
EN 60950,
EN 62109-1,
EN 62109-2.
EMC:
Tuesday, 21 October 2014
Electromagnetic Compatibility Directive,
EN 61000-3-11,
EN 61000-3-12,
EN 61000-6-2,
EN 61000-6-3.
154
DEMO6 - dD6.6 Halfway assessment of the smart solar district
Grid codes:
CEI-021 (Italy LV)
CEI-016 (Italy MV)
VDE 0126-1-1.
VDE 0126-1-1/A1, VFR2013, VFR2014 (France LV)
The certificates are available.In order to be compliant with a regional grid code, the dedicated
parameters have to be properly set.
SUNSYS PCS² 33TR & SAFT Battery
Tools
In order to perform the tests described in the following paragraphs, SOCOMEC has built
equipment composed of the following main components:
A grid connection.
A SAFT battery set (2 ESSU 53kWh + 2 BMM + 1 MBMM).
An AC source simulator.
A SUNSYS PCS² 33TR.
Wattmeter (Yokogawa - WT3000).
A CAN bus analyser (via PCAN Explorer).
An Oscilloscope (DPO4054).
(Details about these components: Brands, models, last calibration or reference are described in the tests reports).
Tuesday, 21 October 2014
155
DEMO6 - dD6.6 Halfway assessment of the smart solar district
MODBUS RTU
CANOpen
Over RS485 serial
link
Over CAN Bus
(250kbit/s)
Communication
The communication link between SOCOMEC SUNSYS PCS² 33TR HMI and SAFT MBMM
is possible using a gateway to translate different protocols.
SUNSYS PCS² supports the standard MODBUS RTU Application-layer protocol (Over RS485)
while MBMM supports Standard CANOpen protocol (Over CAN bus).
CANOpen - Electrical Signal
Date of the tests: November 2013.
Tuesday, 21 October 2014
156
DEMO6 - dD6.6 Halfway assessment of the smart solar district
The objective of this test is to verify whether electrical signals (CAN bus) are clean by
observing with oscilloscope the timings, the edges status and the general levels.
Conclusion: The test has been succeeded.
All the details are described in the internal confidential document:
"M208_Battery_Protocol_Test.doc"
Tuesday, 21 October 2014
157
DEMO6 - dD6.6 Halfway assessment of the smart solar district
Monitor CANOpen Bus
Date of the tests: November 2013.
The objective of this test is to verify the timings & the completeness of exchanged data
between the gateway and the MBMM for the 2 types of CANOpen frames:
PDO (Process Data Object): The Process Data Object protocol is used to
process real time data (periodical transmission),
SDO (Service Data Object): The SDO protocol is used for setting and for reading
values (contextual transmission).
CANOpen frames have been monitored via PCAN Explorer:
Conclusion: The test has been succeeded.
All the details are described in the internal confidential document:
"M208_Battery_Protocol_Test.doc"
Tuesday, 21 October 2014
158
DEMO6 - dD6.6 Halfway assessment of the smart solar district
Gateway Configuration
The gateway manufacturer provides software to set-up its gateway: Firmware Compositor.
The most important points include the communication settings and the mapping between MODBUS
and CANOpen TPDO/RPDO and TSDO/RSDO.
Communication Settings:
MODBUS side: Modbus RTU - RS485 Serial Interface – Baud rate 38400 8N1 – Dev. ID 100
CANOpen side: Dev. ID 100 – Baud rate 250kbs
Mapping Transmit PDOs [HMI MBMM]:
Mapping Receive PDOs [HMI MBMM]:
Tuesday, 21 October 2014
159
DEMO6 - dD6.6 Halfway assessment of the smart solar district
Mapping SDOs [HMI MBMM]:
Tuesday, 21 October 2014
160
DEMO6 - dD6.6 Halfway assessment of the smart solar district
Monitor Modbus Protocol
Date of the tests: November 2013.
The objective of this test is to verify the completeness of exchanged data between the
SUNSYS PCS² 33TR HMI and the gateway for the 2 types of CANOpen frames:
HMI uses only 3 functionalities of Modbus Protocol:
-
03 (0x03) Read Holding Registers
06 (0x06) Write Single Register
16 (0x10) Write Multiple registers
Modbus protocol has been monitored via RS485.
The correct format of every command (received from or sent to Gateway) has been verified:
Example of MODBUS Protocol Monitor:
64 03 12 20 00 07 09 4F
HMI read Modbus Address 0x1220
64 03 0E 00 5D 00 00 00 00 00 00 00 00 00 15 00 10 17 4F
64 03 12 40 00 04 49 50
HMI read Modbus Address 0x1240
64 03 08 4E C0 69 C9 00 00 00 00 EA 83
64 03 12 60 00 08 48 9F
HMI read Modbus Address 0x1260
64 03 10 00 12 00 00 00 00 00 00 00 00 00 00 00 00 00 00 24 90
Conclusion: The test has been succeeded.
All the details are described in the internal confidential document:
"M208_Battery_Protocol_Test.doc"
Tuesday, 21 October 2014
161
DEMO6 - dD6.6 Halfway assessment of the smart solar district
Verify congruence of data
Date of the tests: November 2013.
The congruence of data is verified in two different steps:
1. First it was checked whether the data received from Gateway (in Modbus Protocol)
correspond with data monitored via the CANOpen Bus.
2. Second all received data (by HMI) were verified via Assist Software with particular attention
to values and measurements units.
The written data (from HMI to MBMM) and the received data (from MBMM to HMI) have been
validated with the same process.
These are the windows of Assist Software used to control all MBMM data during running:
Tuesday, 21 October 2014
162
DEMO6 - dD6.6 Halfway assessment of the smart solar district
It is important to note that this monitoring has been permanently used from November 2013 until
now in order to sniff a huge quantity of frames and to detect some possible transmission fault.
A couple of faulty cases have been detected on the MBMM side and solved.
Conclusion: The test has been succeeded.
All the details are described in the internal confidential document:
"M208_Battery_Protocol_Test.doc"
State Machine
Date of the tests: December 2013.
Tuesday, 21 October 2014
163
DEMO6 - dD6.6 Halfway assessment of the smart solar district
The objective of this test is to validate the logical sequences of the different state-machines.
Main State-Machine:
The union of the SUNSYS PCS² and SAFT Battery is named Energy Conversion & Storage
equipment (ECSE).
The ECSE is typically managed by an external Energy Manager System (EMS) controller (ERDF
NEM & NBA in the Nice Grid Project), which has the task to define the rules for the energy
exchanges between the storage system and the grid.
The ECSE implements the following main state-machine:
With the following state and transition conditions:
INIT:
During this state SUNSYS PCS² is not supplied. HMI and Converter Module are switched off.
(1) At system power-up, the PCS automatically enters the SWITCHED-OFF State, from the INIT
State.
SWITCHED OFF:
During this state, the DC and AC contactors are opened.
Tuesday, 21 October 2014
164
DEMO6 - dD6.6 Halfway assessment of the smart solar district
Only the HMI is supplied (by aux. AC).
It establishes the communication with the MBMM through the Gateway and verifies the State of the
MBMM.
(2) When EMS sends “Switch-On Command”, if MBMM is in the standby condition, HMI sends
first the “Connection Strategy Command” and then the “Authorization to Close”.
After DC contactor is closed (SUNSYS PCS² modules are supplied by DC voltage) and the MBMM is
in “Nominal” condition, the SUNSYS PCS² jumps to BATTERY READY State.
BATTERY READY:
During this state the DC contactor is closed and converter module switched on.
If all grid checks are successfully completed, SUNSYS PCS² informs the EMS that ECSE is ready to
start.
(3) In case of “Contactor Opening Required” on all BMMs or in case of “Switch-Off “command
from EMS, the SUNSYS PCS sends the “Opening Command ” and goes back to SWITCHED
OFF State.
(4) When EMS sends this "Operation-mode Enable" command, the ECSE jumps to
OPERATIONAL State.
(6) In case of inactivity of the PCS (no set-point sent by EMS) during 30 minutes and low Battery
SOC, the converter enters the SLEEP State.
OPERATIONAL:
During this state the DC contactor is closed, the AC contactor is closed and the SUNSYS PCS² is
connected to the grid and starts operating according with the set-point sent by EMS.
(3) In case of “Contactor Opening Required” on all BMM or in case of “Switch-Off “command from
EMS, the SUNSYS PCS² sends the “Opening command ” and goes back to SWITCHED OFF
State.
(5) When EMS send the "Operation-mode Disable" command, ECSE jump to BATTERY READY
State.
(6) In case of inactivity of the SUNSYS PCS² (any set-point sent by EMS) for 30 minutes and low
Battery SOC, the converter enters the SLEEP State.
SLEEP:
Tuesday, 21 October 2014
165
DEMO6 - dD6.6 Halfway assessment of the smart solar district
During this state DC and AC contactors are opened and the PCS is disconnected from the grid.
(7) SUNSYS PCS² returns in SWITCHED OFF State, after the EMS resets the SLEEP State.
ALARM:
During this state only HMI is supplied (by aux. AC), while Converter Module is switched off (the
Battery is always disconnected).
(8) If EMS sends "Alarm Reset", HMI tries to reset the alarms (using “MBMM Faults Reset” or
“BMM Faults Reset” procedures). If procedure of reset can be performed, then PCS jump to
SWITCHED_OFF State, otherwise remains in this state.
(*) Active Alarm:
In case of active alarm, the system enters the ALARM State from any other state.
Alarm can be generated by the SUNSYS PCS² or by the Battery:
SUNSYS PCS² Alarm can be activated from HMI or from the Convert Module.
Battery Alarm is activated only in case of MBMM in Safe Mode. This is considered as a critical
condition.
All other alerts reported by the SAFT batteries (without Safe Mode active) are in turn reported by
the SUNSYS PCS², but do not cause a system stop.
Tuesday, 21 October 2014
166
DEMO6 - dD6.6 Halfway assessment of the smart solar district
OPERATIONAL State-Machine:
In this mode, active and reactive power exchanged with the grid can be dynamically controlled by
the EMS via FCU, through P_setpoint & Q_setpoint. The following state-machine can be taken as
a reference:
Only at first power-on of the SUNSYS PCS², a self-tuning/calibration process is performed by the
machine. This operation can take about 1 minute. When all checks are successfully completed,
SUNSYS PCS² advises the EMS that ECSE is ready to start and waits in standby condition.
The PCS updates continuously some information about its state for the EMS, useful to know if it is
possible charge or discharge battery:
Flag “Battery can be charged” This flag is active when SUNSYS PCS² receives from
MBMM values of :
o IMR
> 0A
o IMR_C
> 0A
When both values go to zero this flag is deactivated.
Flag “Battery can be discharged” This flag is active when SUNSYS PCS² receives from
MBMM values of :
o IMD
> 0A
Tuesday, 21 October 2014
167
DEMO6 - dD6.6 Halfway assessment of the smart solar district
When value goes to zero this flag is deactivated.
Flag “Battery fully discharged” This flag is active when SUNSYS PCS² receives from
MBMM values of :
o SOC
= 0% (20% in real situation)
o Battery Group Voltage
VMD
o Vcell Min Battery Group
2070mV
When this flag is active the converter module stops and remains in this condition until a new
charge set point.
During CHARGE (with P_setpoint < 0) or DISCHARGE (with P_setpoint > 0) the SUNSYS PCS²
continuously verifies if the set point received from EMS requires a value of current above the
recommended current limit of the MBMM. In any case, the SUNSYS PCS² limits the current to
IMR_C or IMD values.
CHARGE: In this phase, the SUNSYS PCS² uses VMR as voltage reference and limits its
current to IMR_C.
There is also a control to limit the “Vcell Max Battery Group”: SUNSYS PCS² verifies it doesn’t
overcome value of 4080mV. If it happens P_setpoint is forced to zero (stops CHARGE) until Vcell
Max returns under this critical value. This situation can happen when battery is quite unbalanced:
in this case it’s possible to have low values of SOC and “Battery Group Voltage”, but a high value
of “Vcell Max Battery Group”.
DISCHARGE: at the end of discharge, the SUNSYS PCS² automatically stops operating if
at least one of these situations is verified:
o SOC
= 0% (20% in real situation)
o Battery Group Voltage
VMD
o Vcell Min Battery Group
2070mV
At the same moment, the flag of “Fully Discharged” is activated.
Tuesday, 21 October 2014
168
DEMO6 - dD6.6 Halfway assessment of the smart solar district
With “Vcell Min Battery Group” 2070mV the SUNSYS PCS² stops discharge even if the value of
Battery SOC is not equal to zero, in order to avoid alarm of minimum cell voltage.
Samples of charge & discharge sequence:
Tuesday, 21 October 2014
169
DEMO6 - dD6.6 Halfway assessment of the smart solar district
Conclusion: The test has been succeeded.
All the details are described in the internal confidential document:
"SOCOMEC_PCS_Saft_Battery_REV_01.pdf"
Tuesday, 21 October 2014
170
DEMO6 - dD6.6 Halfway assessment of the smart solar district
Capabilities
Date of the tests: January 2014.
The objective of this test is to verify the battery and converter Behaviour & Capabilities during the
phase of charge and discharge.
DISCHARGE TEST AT NOMINAL POWER
During discharge, the SMU sends data on the CAN bus to the BMM.
Note that the SMU sends data either on BMM request or periodically.
The BMM collects all the data of all the SMU boards composing the battery system and manage
alarms to the customer
Before discharging the battery cabinet, it was fully charged (SOC = 100%).
Tuesday, 21 October 2014
171
DEMO6 - dD6.6 Halfway assessment of the smart solar district
Time of discharge : 3 hours.
DISCHARGE TEST AT NOMINAL POWER
After discharge test, it is necessary to recharge the batteries immediately to avoid the
unbalance cells problems.
The charge is done at constant power; as shows in the picture below; the first period of charge is
done with 29kW and after one hours it was increase at maximum possible of 33kW (for 30 minutes
the converter works in overload). After overload time, the power was decrease at 31kW. Time of
charge is ~4.5 hours.
When the DC voltage is about 677V (VMR= Max Voltage Recharge), for the final part of recharge,
the current is limited and there is the on/off effect. This effect should be solved with a new firmware
version.
Tuesday, 21 October 2014
172
DEMO6 - dD6.6 Halfway assessment of the smart solar district
The picture hereafter shows the recharge test after firmware correction. Close to the charge end
the on/off effect has been corrected.
Battery efficiency:
The efficiency is measured after a test of charge (0 100kWh) and discharge (100kWh 0kWh)
at nominal power.
The discharge DC energy measured was: 99245Wh (after 3 hours)
The charge DC energy measured was: 103834Wh (after 4 hours)
Tuesday, 21 October 2014
173
DEMO6 - dD6.6 Halfway assessment of the smart solar district
The battery efficiency is: 95.58%
Converter current limitation according to MBMM limit:
To do the test it was necessary to disable the “Battery Vcell max “control and “Battery Group
Voltage” by firmware. The test is done during the recharge condition with 75% Pn.
The IMR default is 60A, but with only one module (setting at 75%Pn) the max current is 35A.
Tuesday, 21 October 2014
174
DEMO6 - dD6.6 Halfway assessment of the smart solar district
The test is passed because the battery current (IMR_continuous) is limited from the MBMM, if the
voltage control is faulty.
Measure the time from the MBMM limitation to the real current reduction :
Set point limitation during battery discharge:
In the picture below, it is possible to see the time from the moment when HMI recognizes
the change of current limit to the moment when the current is limited (80ms).
Every 400ms HMI received from Gateway updated current measures, so the maximum delay, to
recognize a setting modification, is 400ms so the maximum delay to have the real current
modification is 400 + 80ms.
Tuesday, 21 October 2014
175
DEMO6 - dD6.6 Halfway assessment of the smart solar district
Set point limitation during battery charge:
In the first picture the recharge current limit (IMR_continous) is that imposed from MBMM
(64A). IMR_continous is set to a new value of 20A.
In the oscilloscope screen shoot, it is possible to analyse this variation of set point.
The delay time is the same as the previous test.
Tuesday, 21 October 2014
176
DEMO6 - dD6.6 Halfway assessment of the smart solar district
Measure the time from the MBMM limitation to the real voltage reduction:
Set point limitation during battery discharge:
The VMD is set to higher value (670V) than the measure of battery voltage (663,3V).
The converter reduces the power in 80ms
Tuesday, 21 October 2014
177
DEMO6 - dD6.6 Halfway assessment of the smart solar district
Set point limitation during battery charge:
The VMR is set to lower value (550V) than the measure of battery voltage (665V).
The converter reduces the power in 2000ms from the trigger.
STATIC MEASURES PRECISION
On tables hereafter are reported the accuracy of the measures made during the cycles of charge
and discharge. The accuracy is respected at the full scale of measure:
Tuesday, 21 October 2014
178
DEMO6 - dD6.6 Halfway assessment of the smart solar district
Discharge test
Wattmeter Measure
Error %
Converter Measure
∆V | 1kV
∆I | 80A
∆P | 30kW
2290,84
0,13%
-0,18%
-0,31%
2,38
673,00
3,54
3,41
2299,56
0,12%
-0,17%
-0,30%
2,39
673,00
3,55
674,17
3,41
2301,01
0,12%
-0,16%
-0,27%
2,38
673,00
3,54
674,13
3,40
2294,45
0,11%
-0,03%
-0,05%
2,31
673,00
3,43
674,09
3,42
2304,02
0,11%
0,00%
0,01%
2,30
673,00
3,42
674,05
3,41
2300,97
0,10%
-0,02%
-0,02%
2,31
673,00
3,43
674,01
3,41
2301,17
0,10%
-0,02%
-0,02%
2,31
673,00
3,43
671,50
15,65
10509,40
0,05%
-0,27%
-0,46%
10,65
671,00
15,87
671,34
15,69
10533,80
0,03%
0,01%
0,04%
10,52
671,00
15,68
671,20
15,75
10569,60
0,12%
0,11%
0,26%
10,49
670,00
15,66
671,08
15,69
10530,50
0,11%
-0,03%
-0,01%
10,53
670,00
15,72
670,95
15,69
10529,00
0,10%
-0,01%
0,03%
10,52
670,00
15,70
670,83
15,69
10526,40
0,08%
-0,10%
-0,13%
10,57
670,00
15,77
667,42
30,63
20440,50
0,04%
-0,14%
-0,21%
20,50
667,00
30,74
663,78
45,95
30503,70
0,08%
-1,27%
-2,12%
31,14
663,00
46,97
663,46
45,89
30448,30
0,05%
-0,06%
-0,03%
30,46
663,00
45,94
663,14
46,01
30512,70
0,11%
0,12%
0,38%
30,40
662,00
45,92
662,85
46,00
30492,90
0,08%
0,05%
0,22%
30,43
662,00
45,96
662,56
46,01
30482,40
0,06%
0,00%
0,08%
30,46
662,00
46,01
662,27
46,16
30567,90
0,03%
0,15%
0,30%
30,48
662,00
46,04
659,47
55,56
36640,60
0,05%
-0,01%
0,07%
36,62
659,00
55,57
Vdc(V)
Idc(A)
674,26
3,40
674,22
P(W)
Tuesday, 21 October 2014
Active Power (kW) PCS² DC Voltage (V)
PCS² DC Current (A)
179
DEMO6 - dD6.6 Halfway assessment of the smart solar district
Charge test
Wattmeter Measure
Error %
Converter Measure
PCS²
Vdc(V)
Idc(A)
P(W)
∆V | 1kV
∆I | 80A
∆P | 30kW
Active Power
(kW)
PCS²
DC Current
DC Voltage (V)
(A)
663
-48,94
-32428,70
0,36%
0,42%
0,16%
-32,47552
659
-49,28
663
-48,97
-32484,70
0,24%
0,18%
-0,08%
-32,46171
661
-49,11
664
-48,80
-32405,00
0,21%
0,10%
-0,15%
-32,35856
662
-48,88
665
-48,88
-32490,30
0,27%
0,12%
-0,22%
-32,42476
662
-48,98
665
-48,92
-32539,00
0,22%
-0,10%
-0,53%
-32,38092
663
-48,84
666
-48,74
-32441,20
0,16%
0,12%
-0,04%
-32,42976
664
-48,84
666
-48,67
-32409,50
0,19%
0,18%
0,00%
-32,40984
664
-48,81
666
-40,91
-27232,50
0,16%
-0,26%
-0,67%
-27,03144
664
-40,71
666
-40,84
-27190,20
0,18%
0,04%
-0,18%
-27,13768
664
-40,87
666
-40,80
-27170,20
0,20%
-0,01%
-0,29%
-27,08456
664
-40,79
666
-40,93
-27267,30
0,12%
-0,21%
-0,54%
-27,1054
665
-40,76
666
-40,73
-27141,40
0,13%
0,03%
-0,12%
-27,1054
665
-40,76
667
-40,75
-27163,40
0,15%
-0,01%
-0,22%
-27,09875
665
-40,75
667
-40,79
-27193,80
0,17%
-0,04%
-0,29%
-27,1054
665
-40,76
667
-40,92
-27286,30
0,09%
-0,10%
-0,29%
-27,19944
666
-40,84
665
-27,42
-18235,60
0,20%
-0,51%
-1,09%
-17,90763
663
-27,01
665
-27,36
-18198,30
0,11%
-0,07%
-0,21%
-18,13384
664
-27,31
665
-27,35
-18187,70
0,21%
-0,07%
-0,31%
-18,09327
663
-27,29
665
-27,36
-18198,40
0,22%
-0,04%
-0,26%
-18,11979
663
-27,33
665
-27,34
-18189,40
0,22%
-0,04%
-0,28%
-18,10653
663
-27,31
665
-27,30
-18163,10
0,13%
0,00%
-0,12%
-18,1272
664
-27,3
665
-27,48
-18280,70
0,14%
-0,16%
-0,40%
-18,1604
664
-27,35
665
-27,34
-18192,20
0,14%
0,05%
-0,04%
-18,18032
664
-27,38
665
-27,46
-18275,50
0,15%
-0,16%
-0,43%
-18,14712
664
-27,33
666
-27,36
-18211,50
0,16%
-0,04%
-0,21%
-18,14712
664
-27,33
666
-27,31
-18181,00
0,16%
0,11%
0,04%
-18,1936
664
-27,4
666
-27,39
-18233,10
0,17%
-0,02%
-0,20%
-18,17368
664
-27,37
Tuesday, 21 October 2014
180
DEMO6 - dD6.6 Halfway assessment of the smart solar district
664
-13,76
-9130,44
0,16%
-0,24%
-0,49%
-8,98334
662
-13,57
664
-13,80
-9158,40
0,15%
-0,08%
-0,21%
-9,09588
662
-13,74
664
-13,81
-9162,99
0,15%
-0,10%
-0,25%
-9,08926
662
-13,73
664
-13,79
-9148,92
0,15%
-0,09%
-0,22%
-9,08264
662
-13,72
664
-13,84
-9184,32
0,15%
-0,08%
-0,21%
-9,12236
662
-13,78
664
-13,80
-9157,14
0,15%
-0,05%
-0,16%
-9,10912
662
-13,76
664
-13,82
-9167,77
0,15%
-0,08%
-0,22%
-9,1025
662
-13,75
664
-13,86
-9195,77
0,15%
-0,10%
-0,24%
-9,12236
662
-13,78
664
-13,86
-9193,95
0,16%
-0,09%
-0,24%
-9,12236
662
-13,78
664
-13,83
-9178,92
0,16%
-0,03%
-0,12%
-9,14222
662
-13,81
664
-13,85
-9188,81
0,16%
-0,07%
-0,20%
-9,12898
662
-13,79
664
-13,83
-9180,00
0,16%
0,01%
-0,06%
-9,16208
662
-13,84
662
-3,34
-2207,69
0,09%
-0,21%
-0,37%
-2,09537
661
-3,17
662
-3,34
-2213,60
0,08%
-0,13%
-0,24%
-2,14164
661
-3,24
662
-3,40
-2252,47
0,08%
-0,15%
-0,28%
-2,16808
661
-3,28
662
-3,41
-2258,94
0,17%
-0,15%
-0,29%
-2,1714
660
-3,29
662
-3,42
-2264,41
0,17%
-0,15%
-0,29%
-2,178
660
-3,3
662
-3,38
-2237,74
0,17%
-0,06%
-0,13%
-2,1978
660
-3,33
Conclusion: The test has been succeeded.
Response time < 20ms
Converter V/I error < 1%
SOC from MBMM is linear during charge/discharge at P=constant.
Converter = Off when receive SOC=0 or under Vcell_min or Vbatt_min
Major alarm Battery contactor open (Converter = stopped by Alarm)
Minor alarm Battery General Warning (converter = on)
MBMM = “opening contactor request” Pconverter = 0 + switch OFF
The converter respects the MBMM limits
Battery Efficiency ~ 95,5%
Current limitation is equivalent to P set-point variation.
Voltage limitation is managed with loop control:
o Reduction
=
1 * (P / Pn) / s
o Rising
=
0,2*(P / Pn) / s
MBMM Limitation Delay = MBMM updating + PCS Timing < 400ms + 80ms = 480ms
Tuesday, 21 October 2014
181
DEMO6 - dD6.6 Halfway assessment of the smart solar district
All the details are described in the internal confidential document:
"M208_SCARICA_BATTERIE.doc"
Tuesday, 21 October 2014
182
DEMO6 - dD6.6 Halfway assessment of the smart solar district
Abnormal functioning tests
Communication Fault:
Date of the tests: January 2014.
If during the battery charge or discharge, the communication between:
Converter and gateway is cut off, the module switches off in few seconds.
Battery Cabinet and gateway is cut off, the module switches off in few seconds.
Gateway is switched off, the module switches off in few seconds.
In all these cases, the alarm on display is “A23 Battery Communication Fail”
(memorised alarm).
Tuesday, 21 October 2014
183
DEMO6 - dD6.6 Halfway assessment of the smart solar district
Conclusion: The test has been succeeded.
All the details are described in the internal confidential document:
"M208_ABNORMAL_TEST.doc"
Major alarms and minor alarms:
Date of the tests: January 2014.
With the major alarms, the battery connections to the converter are not possible
(Contactor opening).
Tuesday, 21 October 2014
184
DEMO6 - dD6.6 Halfway assessment of the smart solar district
At the contrary, with minor alarms the connections are still possible.
Major alarm Request for the opening of the battery contactor.
Minor alarm No opening request.
Conclusion: The test has been succeeded.
All the details are described in the internal confidential document:
"M208_ABNORMAL_TEST.doc"
Battery disconnection in case of Overcurrent and Overvoltage:
Tuesday, 21 October 2014
185
DEMO6 - dD6.6 Halfway assessment of the smart solar district
Date of the tests: January 2014.
Overcurrent test:
During the recharge, even if the MBMM requires the ending of the charge because
it has sent the command at the converter to reduce at 0A the current (IMR =0), the
converter supplies more of 10A and after two seconds the MBMM cuts off the DC voltage;
the overcurrent protection is ok
Overvoltage test:
The test is to check the trip threshold if the voltage of the cells is more than 4,13V.
In this case the MBMM sends a command to the internal contactor to open the connection
between battery cabinet and converter.
In this case the modules of "converter system" switch off. The abnormal test is done
supplying current, even if the MBMM sends a command to reduce the current to 0
(IMR=0). In this way the voltage battery increase the charge until it reaches 4,13V by cell.
Tuesday, 21 October 2014
186
DEMO6 - dD6.6 Halfway assessment of the smart solar district
Conclusion: The test has been succeeded.
All the details are described in the internal confidential document:
"M208_ABNORMAL_TEST.doc"
Over-discharge condition:
Date of the tests: January 2014.
The test is made by disabling:
the “Vcell min Battery Group = < 2,7V”,
“SOC_connected=0%” controls,
“V Battery Group Min”,
"Opening Request" from BMM
Current Limit Used: IMD + 5A.
The first part of discharge is at nominal power. Near the end of discharge the power is
reduced to avoid any damage of the battery for over discharge.
The over-discharge test is a strong stress for the battery. The cell voltage arrives below
2,5V.
During the test, the first battery cabinet (BMM 2) with cell voltage <2,5V switches off and
the discharge continues with the other battery cabinet (BMM 1).
Tuesday, 21 October 2014
187
DEMO6 - dD6.6 Halfway assessment of the smart solar district
When one cabinet is disconnected, automatically the MBMM sends a command to the
converter to limit the max discharge current (IMD). By program, the value setting is =
IMD+5A.
When also the “cell voltage” of second battery cabinet reaches 2,5V, the discharge
finishes.
For over-discharge reasons, now the system remains in stand-by condition unless the cell
voltage will be > 2,7V. This slow charge is made by two BMM.
Conclusion: The test has been succeeded.
All the details are described in the internal confidential document:
"M208_ABNORMAL_TEST.doc"
Disconnection battery cabinet during charge & discharge:
Date of the tests: January 2014.
Tuesday, 21 October 2014
188
DEMO6 - dD6.6 Halfway assessment of the smart solar district
Disconnection during battery charging:
As showed below there are two batteries cabinet connected in parallel in charging condition: the
IMR_continous setting is 76A and the charging current is 45A
Now one battery cabinet is cut off and the new IMR_continous setting is 38A and the charging
current is 38A.
Tuesday, 21 October 2014
189
DEMO6 - dD6.6 Halfway assessment of the smart solar district
Any current overshoot during cut off of one battery cabinet
With two batteries cabinets the charge current is 45A, after cut off of one battery cabinet the
current is reduced to 38A.
Disconnection during battery discharging:
As showed below, there are two batteries cabinet connected in parallel in discharging condition:
the IMD setting is 400A:
Now, one battery cabinet is cut off and the new IMD setting is 300A:
Tuesday, 21 October 2014
190
DEMO6 - dD6.6 Halfway assessment of the smart solar district
CH1=100V/div DC Voltage CH2= 10A/div DC Current
No current overshoot can be observed during the cutting off of one battery cabinet.
Conclusion: The test has been succeeded.
All the details are described in the internal confidential document: "M208_ABNORMAL_TEST.doc"
Converter disconnection in case of opening request coming from MBMM :
Date of the tests: January 2014.
Tuesday, 21 October 2014
191
DEMO6 - dD6.6 Halfway assessment of the smart solar district
The test is made by disabling the security parameter (SOC=0%) so the voltage can reach the value
allowing the MBMM command.
During the discharge test, when one cell voltage of battery cabinet is lower than 2,7V, the BMM
sends a command to MBMM and immediately it sends to the converter the “opening contactor
request”. The converter reduces to 0 the power and sends the command to open the contactors. At
this moment all the cabinet contactors are opened.
Conclusion: The test has been succeeded.
All the details are described in the internal confidential document:
"M208_SCARICA_BATTERIE.doc"
Tuesday, 21 October 2014
192
DEMO6 - dD6.6 Halfway assessment of the smart solar district
Communication between SUNSYS PCS² 33 & ALSTOM FCU
Date of the tests: March 2014.
The objective of this test is to verify the completeness of exchanged data between the
ALSTOM FCU & the SOCOMEC SUNSYS PCS².
MODBUS TCP/IP
Over Ethernet
The tests have been based on the following specification built in collaboration with ALSTOM:
"NG_MCU&FCUs_Socomec_Modbus_Specification V1.2"
ITEMS UNDER TEST
RESULT
General protocol Modbus TCP
General verifications
Ok
Command Word 0x1100
Switch On-Off
Ok
Operation-Mode Enable On
TBC: Off state
Alarm Reset (simulated some different alarm conditions)
Ok
Operation-Mode 0x1101
Standby
Ok
Normal Mode
Ok
P Setpoint 0x1102
Active Power
Ok
Q Setpoint 0x1103
Reactive Power
Tuesday, 21 October 2014
TBC.
193
DEMO6 - dD6.6 Halfway assessment of the smart solar district
Watchdog Management 0x1108
verified the correct functionality removing cable or
Ok
blocking protocol
free-running counter is updated by master every 1 sec
Ok
Status Word 0x1150
Test of all bits
Ok
Alarm Word 0x1151
Test of all bits
Ok
Warning Word 0x1152 : all bits are correct
Test of all bits
Ok
Verified in particular status of Bit12 “Local Mode Enabled”
Ok
All measures of “Supervisor Variables” Area.
Cos PHI
TBC: Problem in value visualization
Time variables (0x1162 and 0x1163)
Don't care (not needed)
All other variables in the table
Ok
“Battery Parameters” Area
Test of all parameters
Ok
“Monitoring” System Area
System States
Ok
System Warnings
Ok
System Alarms
Ok
"Monitoring" Unit Area
System/Unit Measurements
Not verified. To be checked if needed.
System/Unit Statistics
Not verified. To be checked if needed.
System Settings
Not verified. To be checked if needed.
Date & Time
Not verified. To be checked if needed.
Battery Specific Area
Not verified. To be checked if needed.
Conclusion: The test was quite positive but there are some pending points
that we will solve during the final tests of the full equipment (W38).
Tuesday, 21 October 2014
194
DEMO6 - dD6.6 Halfway assessment of the smart solar district
Next Steps:
In order to complete or to confirm the previous described tests, a full week of tests is planned
in W38 of 2014 with all the contributors (SAFT / ALSTOM / SOCOMEC) on the first container. It will
be also the first opportunity to tests also all the auxiliaries (HVAC & FSS enslavement).
Then, during October & November, the first container will be fully tested on the "Concept Grid"
(Les Renardières – EDF R&D laboratory site) with the consideration of real grid disturbance.
These tests will be supported by the document "M190V_NiceGrid_OnGrid_rev04.docx" which is
still under construction.
3.2.4 References
REF
Topics
Files names
[REF01]
Communication & state machine
specifications between SUNYS
PCS² & SAFT battery.
SOCOMEC_PCS_Islanding_Modbus_Protocol_REV_07
[REF02]
Specific communication
specification for SAFT battery.
SOCOMEC_EnergyStorage_Modbus_Protocol_SAFT_REV_03
[REF03]
Specification of the energy
storage management of SAFT
battery.
SOCOMEC_PCS_Saft_Battery_REV_01
[REF04]
Communication specification
between SUNYS PCS² &
ALSTOM FCU.
NG MCU & FCUs SOCOMEC Modbus Specification V1.2
[REF05]
Main tests plan.
M190V_NiceGrid_OnGrid_rev04
Tuesday, 21 October 2014
195
DEMO6 - dD6.6 Halfway assessment of the smart solar district
3.3 Results of electrical tests on individual
batteries
3.3.1 Context
This chapter presents the results of the tests conducted on residential energy storage systems,
which are owned by the project partners and will be installed at individual customers’ premises as
part of the NICE GRID project. In order to handle the massive insertion of distributed photovoltaic
energy resources in a specific area, the aim of the NICE GRID project is to exploit flexibilities (such
as energy storage) to manage supply – demand balance. In addition to these residential storage
systems, the NICE GRID project will mainly test on grid storage, demand response and islanding of
a low-voltage distribution grid.
Figure 61: Residential energy storage system diagram
The systems considered in this case, presented on Figure 61, consist of a 4 kWh Li-Ion battery
produced by SAFT and a 4.6 kVA inverter manufactured by SMA. These systems are controlled
both locally (with higher priority) and by a centralized management system, which manage their
aggregation. They will be connected downstream of the customers’ supply location (i.e. in their
rd
premises) by a 3 party installer assigned by the project.
Tuesday, 21 October 2014
196
DEMO6 - dD6.6 Halfway assessment of the smart solar district
The objectives of the tests presented here are to check:
The correct integration of components from different manufacturing suppliers and the
proper functioning of the full system (especially regarding its security)
The compliance with the existing standards and regulations for the electrical connection
(the French standard called NF C 15-100, …)
The appropriateness of important parameters (for example response time) in regards with
the project needs
The results of the functional and components unitary tests (for example inverter electromagnetic
compatibility) are not given here and the management tests are presented in the part Assessment
of PV installation). The tests have been conducted by EDF R&D on ConceptGrid, a new connected
test facility (where a full installation has been completed: protection system, inverter and battery but
without the communication box). Furthermore, design and calculation of power connection have
been validated by an independent control office (SOCOTEC).
3.3.2 Results
Tests / studies results are focused on the following points:
System documentation
Regulatory compliance and electrical connection diagram
Specific tests and studies for the security of the full system
Important operational characteristics
Incidents recorded during the tests
System documentation
Summary table
Tests / Studies
System representativeness
General information
CE marking
Results
OK
OK
OK
Declaration of compliance of
the decoupling protection
OK
Installation instructions and
wiring diagram
Declaration of connection to
the Distribution System
Operator
Battery safety data sheet
Functional description
Emissions description
Layout diagram and
installation
recommendations
Restriction of use
Tuesday, 21 October 2014
OK
Comments
Compliant to VDE 0126-1-1
VFR 2013 with some
configuration
Procedure and training for the
full system installation
OK
-
OK
Non-applicable
OK
-
OK
Risk analysis at the project
level for the full system
OK
Risk analysis at the project
level for the full system
197
DEMO6 - dD6.6 Halfway assessment of the smart solar district
Action to be taken against
any failure in the system
Transport constraints
Constraints and information
for customer’s insurance
company
OK
OK
OK
Risk analysis at the project
level for the full system
Template of a letter that can
be sent by the customer to his
insurance company
System representativeness
The tested system is composed of the SAFT battery and the SMA inverter. The communication
gateway and the local management system were not available during the test, but their
performances have been measured and are reported in the part Assessment of PV installation.
However, the system can be controlled for the tests via a PC using a communication link and
protocols (data, variables...) identical to the ones that will be implemented on the field.
Furthermore, no safety feature is carried out by the communication gateway or the local control
system; they can be replaced by a simple PC or by the SMA inverter control software (Sunny Data
Control) for the tests. The communication channel used to control the inverter is the RS485
channel and all the safety features are present and operational. The battery tested here is the
indoor battery, very similar to the outdoor version that will be used in NICE GRID. The indoor and
outdoor versions, presented on Figure 62, have no functional differences. The two versions are
installed in ConceptGrid and their installation has been also validated by an independent control
office (SOCOTEC).
Figure 62: Indoor and outdoor versions of the battery
Tuesday, 21 October 2014
198
DEMO6 - dD6.6 Halfway assessment of the smart solar district
General information
Information about each component (battery and inverter) is given in manufacturers’ documentation.
Some data are presented here on an indicative basis:
Inverter nominal power: 4600 VA
Battery capacity: 4 kWh
Battery voltage (MIN – MAX): 42 V – 56 V
Constraints on battery use depending on the state of charge and temperature
Battery storage constraints
CE marking
Both the battery and inverter have CE marking (confer external document: “MPS-ZE-HKVDE01261A1VFR13-fr-15 déclaration SMA conformité DIN.pdf”).
Decoupling protection
The inverter must be equipped with a decoupling protection in conformity with the Distribution
System Operator (DSO) reference sources. Yet, by default this inverter is in conformity with VDE
ARN 4105, but its parameters are configurable, so with some configuration, it can be in conformity
with the mandatory standard for a power connection in France (VDE 0126-1-1 VFR 2013).
The decoupling thresholds for the standard VDE 0126-1-1 VFR 2013 are:
0.8 Vn (184 V) < V < 1.15 Vn (264,5 V)
47,5 Hz < f < 50,4 Hz
Detailed installation instructions and wiring diagram
Tuesday, 21 October 2014
199
DEMO6 - dD6.6 Halfway assessment of the smart solar district
Figure 63: Single line electrical diagram
A single line electrical diagram has been designed and validated by an electrical control office. It
consists of a derivation panel downstream of the tie breaker (general equipment for control and
protection), as well as a panel located next to the storage system.
No battery pole is connected to the ground; the earthling connection scheme on the AC side is a
VT (voltage transformer).
Installation instructions for each component are described in manufacturers’ documentation. A
training session for the installer is planned in September 2014 to present the procedures and the
installation of the full system.
Information to the Distribution System Operator for the connection
All the needed information is available: single line diagram, inverter power...
The connection principle is similar to the one for a classical load.
Safety data sheet
The battery safety data sheet is provided by the supplier (confer external document: “13-2400-mu
outdoor intensium home -v2 - fr.pdf”).
Functional description
The functional description is not mandatory for the tests.
Emissions description
The main component most likely to release emissions is the Li-Ion battery. In normal operation, no
Tuesday, 21 October 2014
200
DEMO6 - dD6.6 Halfway assessment of the smart solar district
emission is released. On accidental operations (fire), released emissions are described in the
battery safety data sheet. It consists mainly of carbon monoxide CO and others combustion
products in very small quantities. The installation recommendations take into account these
emissions, this is why outdoor version of the battery has been chosen by the project and will be
installed in the customer’s premises.
Layout diagram
Layout guidelines are given for each component (for example the battery must not be installed in a
living room). At the project level, a risk analysis has been achieved, containing layout
recommendation for the full system.
Figure 64: Safety distance around the battery (in mm)
Restriction of use
Restrictions of use are given for each component (for example an indoor battery must not be used
outdoor). At the project level, a risk analysis has been achieved, containing restrictions of use for
the full system.
Action to be taken against any failure in the system
Actions to be taken in case of a failure (and the identification of each failure) are given for each
component. A prevention data sheet has been written and will be given to the residential customers
so they know how to react in case of a system failure. Furthermore at the project level, a risk
analysis has been achieved, synthesizing all the actions for the full system.
Transport constraints
The strongest constraints concern the battery. These constraints are clearly identified in the
rd
manufacturer’s data sheet. The 3 party installer will be provided with a training session informing
him of the risks and procedures when dealing with the transport of Li-Ion battery.
Tuesday, 21 October 2014
201
DEMO6 - dD6.6 Halfway assessment of the smart solar district
Information for the insurance company
A template of a letter that has to be sent by the customer to his insurance company has been
prepared, explaining particularly the presence of the battery in the energy storage system provided
to the customer.
Regulatory compliance and electrical connection diagram
Summary table
Tests / Studies
Compliance with standard
NF C15-100
Protections and conduits
dimensions
Results
Comments
OK with reservations
Additional labels
OK
-
Compliance with standard NF C15-100
Even if the electrical installation standards do not deal with installation of storage systems via
battery connected to the grid, the NICE GRID systems compliance is estimated relative to NF C15100 standard and based on UTE C15-712-1 and C15-712-2 standard guides.
The installation principles considered in our project (reference to the document presenting the
installation recommendations) state that:
The customer’s existing installation will not be deeply modified, indeed the system will be
added as an additional derivation downstream of the tie breaker
Since it is not possible to check the customer’s existing installation, it must be protected by
adding a 30mA differential switch
Overvoltage protection is ensured on the AC side (alternatively – at the inverter output) by
a circuit breaker installed in the derivation panel (downstream the tie breaker) and by
another circuit breaker installed in the panel close to the inverter in accordance with C15712-1 guide (scheme for the surpluses injection installations)
The overcurrent protection on the DC side is ensured by a fuse in the battery in
accordance with the high short-circuit power. Similarly, the protection on the AC side of
the inverter ensures a protection on the DC side. Finally, it is important to note that the
conduit between the battery and the inverter has a maximum length of 2m. If this conduit
is longer than 2m, then an additional circuit breaker will be added
Protection against direct contacts is ensured on the AC side by the use of adapted
conduits, mechanically protected. On the DC side, the protection is ensured mechanically
(conduits between the battery and the inverter must be protected) and by the fact that the
DC bus voltage is less than 60V in all cases
Protection against indirect contacts is ensured on the AC side from the inverter to the grid
by a differential protection. From the grid to the inverter, the protection is ensured by the
use of class 2 conduits mechanically protected. On the DC side, protection against indirect
contacts is ensured by a voltage never exceeding 120V and by an internal isolation
transformer in the inverter
The battery is equipped with a visible and accessible disconnect switch
The battery is locked in a cabinet
Since the battery does not release hydrogen or any other type of gas in normal condition,
Tuesday, 21 October 2014
202
DEMO6 - dD6.6 Halfway assessment of the smart solar district
only the manufacturer’s recommendations regarding free space and ventilation must be
respected
Additional labels will be put on each component in concordance with the electrical
diagram, to be able to identify them easily and for safety reasons (confer Figure 65)
Figure 65: Example of additional labels
Protections and conduits dimensions
The resistance value of the customer’s local grounding connection must be measured,
and equal to no more than 100 ohms (NF C15-100)
The tie breaker calibre must be adapted to the storage system (nominal power 4.6 kW)
The differential switch between the tie breaker and the customer’s panel must have a
current rating adapted to the tie breaker calibre (63 A for AGCP 30-60 and 100 A
beyond)
This differential switch has been chosen with respect to type A, because of the inverter
in the installation
A surge protection device is installed in the inverter – storage system line in
accordance with UTE C15-712 guide recommendations
A 32 A circuit breaker protects the inverter line (manufacturer recommendation)
A 30 mA, 32 A, type A differential circuit breaker is installed at the inverter AC output
(manufacturer recommendation)
A surge protection device is mandatory if the conduit between the inverter and the
installation remaining equipments is longer than 10 m in accordance with UTE C15712-1 guide
The battery protection fuse calibre is 200 A
2
The grounding connector cross section for the inverter must be at least 16 mm copper
(manufacturer recommendation)
2
The alternative conductors cross section for the inverter must be at least 10 mm
copper (manufacturer recommendation)
2
The battery is delivered with two 50 mm aluminium wires with a length of 2 m. If
necessary, these wires could be extended but an additional DC circuit breaker must be
added.
Tuesday, 21 October 2014
203
DEMO6 - dD6.6 Halfway assessment of the smart solar district
Specific tests and studies for the security of the full system
Summary table
Test / Studies
Results
Risk analysis
OK
Safety features identified
OK
Decoupling protection
OK
Reconnection to the network
OK
AC and DC startup currents
OK with reservations
Over-circuit and short-circuit
behaviour
Differential protections
Grounding connection
diagram
Transient on the DC bus
Safety chain
Internal communication
Battery management
Comments
Risk analysis at the project
level for the full system
Compliant with some
configuration
Procedure to follow for a
noticeable disconnection
operation
OK
-
OK
-
OK
-
OK
OK
OK
No self tests management but
maintenance visit every 6
months
OK
Risk analysis
A risk analysis for the battery has been achieved by the manufacturer. It gives installation and
operation conditions for the battery.
At the project level, a risk analysis for the full system has also been achieved. This risk analysis will
be checked by an independent control office before the installation in the customer’s premises.
Safety features identified
Safety features of the battery are clearly identified and are sufficient to ensure its safe operation
independently of the rest of the system. It mainly concerns the supervision of each part of the
battery (voltage), some specific temperature values and the total current by the Battery
Management Module (BMM).
These supervision functions are software but hardware safeties are also present for redundancy.
In case of anomaly detection, an alarm is generated on the communication bus and when
appropriate (depending on the gravity of the anomaly), the main switch is open. The battery is then
completely isolated from the rest of the system.
The correct operation of this electrical switch is automatically tested every 6 months.
In case of severe anomaly on one of the cells, which may appears in spite of the safety features of
the BMM; they are equipped with a CID (Current Interruption Device). The CID is a valve which
opens in case of overpressure inside the cell and mechanically interrupts the flow of electrical
current. The internal features rely on opening the circuit, indeed the battery manufacturer assures
Tuesday, 21 October 2014
204
DEMO6 - dD6.6 Halfway assessment of the smart solar district
us that when there is no current, there is no risk of fire in the battery.
Decoupling protection
After some modification in the configuration parameters, the decoupling protection is compliant with
the standard VDE 0126-1-1 VFR 2013, which decoupling thresholds are:
0.8 Vn (184 V) < V < 1.15 Vn (264,5 V)
47,5 Hz < f < 50,4 Hz for VFR 2013
Reconnection to the network
The reconnection time to the network after a power cut due to the decoupling protection is 5 s, in
accordance with VDE 0126-1-1.
AC and DC startup currents
The startup current on the AC side (at the input breaker closing) of the inverter is very low (below 1
A peak). This does not require any specific adaptation for the protections.
On the DC side, the pre-charging sequence of the battery must be respected, which means:
The DC disconnect switch of the battery (customer noticeable disconnection) must be
closed
The starting sequence of the battery can then be carried out (ON/OFF button on the BMM)
This allows pre-charging the inverter while limiting the inrush current due to the capacitors.
Once the system is running, the disconnect switch can be maneuvered in a short period of time
(the capacitors remain loaded), but if this protection is open for too long (30 s), the starting
sequence must be carried out once again.
This procedure to be followed is described in the safety instructions installed close to the system,
but anyway if the battery is off for some reason, installer will have to come to check and restart the
system.
Over-circuit and short-circuit behavior
On the AC side, the system is protected by the network connection (“infinite” short-circuit power)
and over-current protections. The inverter short-circuit power is 12 kW, which is suitable with the
chosen protections.
On the DC side, the system is protected downstream by the battery fuse and upstream by a C32
circuit breaker.
Differential protections
The differential protections used are those recommended by the inverter manufacturer SMA. Tests
showed the proper functioning of these protections (resistive grounding leakage 30 mA).
Grounding connection diagram
On the AC side of the inverter, the grounded connection is Voltage Transformer. On the DC side,
no battery pole is grounded (floating DC voltage).
Transient on the DC bus
Tests for operating the DC disconnect switch to charge and discharge have not showed evidence
of important over-voltage on the DC bus (< 60 V).
Tuesday, 21 October 2014
205
DEMO6 - dD6.6 Halfway assessment of the smart solar district
Safety chain
Wherever possible, some safety chains of the battery were tested (example: hardware redundancy,
too important current…). All tests showed a proper operation.
Internal communication
The system has two communication links:
Between the inverter and the outside, link to set the operating point and send alarms for
example
Between the battery and the inverter, this link allows the battery to send over time its
voltage and current limits. Although this link is not a safety feature (as the loss of such a
link does not stop the monitoring of the battery by the BMM), it allows the inverter to meet
the charging and discharging constraints.
The loss of the communication link between the battery and the inverter causes a complete system
shut off (charging and discharging powers are then null). However, the system keeps using the
battery to power its “auxiliaries” (see chapter No-load losses). Such a situation, if not monitored or
detected, results in a significant battery discharge and can, if prolonged, cause irretrievable
damage to the battery.
Re-establishing communication leads to an automatic system restart.
The loss of the communication link between the inverter and the outside has no effect. The system
then applies the last instruction received (respecting the battery constraints).
If this instruction corresponds to a charging operation, this is not a problem since the inverter will
meet the operating constraints of the battery. But if this instruction is a discharging operation, the
battery will then be drained. It is therefore necessary to set a SOC (State Of Charge) minimum limit
for inverter operation as permitted by the different configuration settings of the inverter.
Battery management
The charging and discharging laboratory tests of the battery showed that voltage and current
parameters are respected in all configurations (Sunny Data Control software is used to give
instructions to the inverter via the RS485 link):
Installation: installation and setup must be done correctly
Power: start charging at battery Pmax
Operation: put into operation by setting the parameter FedInSpntCom to Enable. Then
sending instructions in real and reactive power by the parameters FedInPwrAtCom and
FedInPwrRtCom (positive in discharge and negative in charge). These parameters are met
in regards to the battery constraints.
A reservation can be made on the fact that every 6 months, a battery self test is performed
(opening and closing of the electrical switch), but not taken into account today by the SMA inverter.
That is why the installer will do a maintenance visit every 6 months to test the proper functioning of
the electrical switch.
Important operational characteristics
o
Basic operation of the system
It is possible to control the system operating point. The power is given in signed absolute value
(positive for discharge, negative for charge). The nominal discharging power is 4600 W (nominal
Tuesday, 21 October 2014
206
DEMO6 - dD6.6 Halfway assessment of the smart solar district
power of the inverter) and the nominal charging power is 2000 W (maximum charging power of the
battery).
o
Precision compared to the given command
The deviation of the measured power compared to the command given to the system is measured
for different charge and discharge operating points. The accuracy of measurements is 5%.
We also measure the gap between the power displayed by the system and the command.
These measurements are made in steady state.
Power instruction (W)
2000
2300
2530
2760
3680
4600
1000
1050
1100
1300
2000
Deviation (measured power
– command) / command (%)
Discharge
1.2
2.7
2.5
4
2.2
1.2
Charge
5.9
7.2
8.3
3.9
3.7
Deviation (displayed power –
command) / command (%)
1.2
0.7
0.3
0
0.2
0.8
0.5
2.9
2.2
0.5
0.7
It can be seen that:
In discharge, the system reaches perfectly its operating point (the deviation compared to
the real measurement is in the sensor tolerance range)
In charge, static error around 3% remains in some cases, which only represents a 30 W
error.
Measurements accuracy
The deviation between the real measurement and the information sent by the system is given in the
following table:
Power instruction (W)
2000
2300
2530
2760
3680
4600
Tuesday, 21 October 2014
Deviation (measured power – displayed
power) / displayed power (%)
Discharge
0
1.98
2,72
4.2
2.5
2
207
DEMO6 - dD6.6 Halfway assessment of the smart solar district
Charge
1000
1050
1100
1300
2000
5.4
4.2
5.2
3.45
4.5
The deviation between the measured and the displayed values is in the tolerance range of the
sensor. This shows that the power information displayed by the system is a good indicator (within
5%, which represents a 230 W error in the worse case).
Response time
The transition time from one operating point to another (in steady state) are measured with a 1
second tolerance.
The powers are positive in discharge and negative in charge.
Initial power (kW)
0
0
4.6
-2
4.6
-2
0
0
-1
2.3
Final power (kW)
Time (s)
Rate (kW/s)
4.6
-2
-2
4.6
0
0
2.3
-1
2.3
-1
7
5
12
14
7
6
7
5
9
10
0.66
0.4
0.55
0.47
0.66
0.33
0.33
0.2
0.37
0.33
The rate of change seems to be constant whatever the transition carried out (taking into account
measurement errors).
We can note a pessimistic value 0.2 kW/s.
The previous measurements have been realized at a 60% state of charge. But this parameter does
not seem to have a significant influence on the response times.
Efficiency
The efficiency of the energy storage system can be divided into three categories:
The inverter conversion instantaneous efficiency
The charge/discharge efficiency of the battery
The consumption/losses of the system in waiting mode (no-load, no charge/discharge
command)
a. The inverter conversion instantaneous efficiency
Tuesday, 21 October 2014
208
DEMO6 - dD6.6 Halfway assessment of the smart solar district
Figure 66: Inverter conversion instantaneous efficiency
The instantaneous conversion efficiency measurements between the AC and DC sides of the
inverter are given in the following table:
Power (kW)
Efficiency
Discharge
0.460
0.88
1.150
0.92
2.3
0.94
3.45
0.93
4.6
0.92
Charge
0.2
0.76
0.5
0.88
1
0.94
1.5
0.96
2
0.96
These measurements are coherent with the data given by the manufacturer.
b. The charge/discharge efficiency of the battery
Figure 67: Battery charge/discharge efficiency
Tuesday, 21 October 2014
209
DEMO6 - dD6.6 Halfway assessment of the smart solar district
Tests have also been conducted to measure the charge/discharge efficiency of the battery. The
result is that the battery efficiency is 0.96: if the battery is charged with 1 kW, it can then provide
960 W.
c. The consumption/losses of
charge/discharge command)
the
system
in
waiting
mode
(no-load,
no
The inverter consumption in waiting mode (no output power), with the remote control on, is around
40 W.
The battery BMM consumption is 7 W (manufacturer data). In the outdoor version, a small HVAC
(Heating, Ventilation and Air Conditioning) is added to the battery resulting in a yet undetermined
added consumption. The total battery consumption is estimated around 10 W but need to be
measured.
Therefore, the total consumption of the energy storage system without any load is estimated
around 50 W.
Incidents recorded during the tests
As of the date of this report, no incident has been recorded during the tests.
3.3.3 Conclusion
The results of the testing show a correct integration of the battery and the inverter. The operating
constraints of the battery are fully taken into consideration and the system is controllable.
These results also give some important technical characteristics relevant to the design of the
control system (response time, measurement precision, performances…).
Tuesday, 21 October 2014
210
DEMO6 - dD6.6 Halfway assessment of the smart solar district
3.3.4 External documents
Figure 68: 13-2400-mu outdoor intensium home -v2 - fr.pdf
Document Acrobat
Figure 69: MPS-ZE-HK-VDE01261A1VFR13-fr-15 déclaration SMA conformité DIN.pdf
Tuesday, 21 October 2014
211
DEMO6 - dD6.6 Halfway assessment of the smart solar district
3.4 Halfway assessment of the OLTC transformer
NICE GRID is a demonstration project which namely aims to facilitate the integration of massive
PV production on low-voltage networks.
Indeed, this decentralised PV production creates constraints on the low-voltage networks. These
constraints include increases in voltage in the production area. This happens mainly when the local
production becomes largely superior to the local demand.
NICE GRID’s purpose is to explore new ways of accommodating large amounts of PV production.
This means designing and testing smart systems capable of managing these increases in voltage
rather than systematically resorting to the crude solution that is the reinforcement of the network.
One of these systems is the on-load tap changing transformer (OLTC) also called ‘solar
transformer’. This kind of transformer is able to adapt its turns ratio (ie the ratio between the turns
of the primary and secondary windings) without interrupting the supply. The OLTC transformer
basically enables secondary substations to do something that all the French primary substations
could do before which is modifying the ratio between the primary and secondary voltage. Typical
secondary substation transformers also have several primary to secondary ratios, but they cannot
move from one ratio to another while on load.
The final objective is to dynamically adjust the voltage at the transformer level to ensure that the
voltage stays within the ranges defined by the 2007-1826 French decree (authorized limits of LV
voltage at home) across the whole downstream distribution network.
Tuesday, 21 October 2014
212
DEMO6 - dD6.6 Halfway assessment of the smart solar district
3.4.1 Choice of the OLTC transformer in the NICE GRID
project
Principle
In France, voltage on the distribution network has to stay within the 230V +/- 10% range. The lowvoltage network is radial and, historically, current goes from upstream to downstream as there are
more loads than power sources connected at this level.
The development of PV production is challenging this principle. Indeed, while the demand still
outweighs the production in the evening, the PV production can be higher than the demand during
the day. This means that some low-voltage network with a high penetration of PV production can
now regularly experience both increases and decreases in voltage on the same day.
The OLTC transformer’s objective is to maintain the voltage within the +/- 10% range at all time by
adapting its primary to secondary voltage ratio. The NICE GRID projects aims to replace a classic
20kV/400V transformer by a 20kV/400V OLTC transformer.
Adaptation to variations of the primary voltage
The OLTC transformer can be an asset to a distribution network with a high penetration of PV
production as it can provide a constant secondary voltage by adapting its turns ratio to the
variations of the primary voltage. On a distribution network fitted with a classic transformer, the +/10% range has to cater for both medium and low voltage variations. This can prove difficult as the
MV network voltage can vary up to +/- 5%, thus leaving only a small range of acceptable variations
for the LV network. The objective of the OLTC transformer is to compensate these medium voltage
variations in order to leave the complete +/- 10% range for the variations on the low voltage network.
Take a substation with two feeders that has to supply both consumers generating a 10% decrease
in voltage and producers generating an 8% increase in voltage. The transformer of this substation
should be set to provide 400V +1% as a secondary voltage at all time. As shown by the figure
below, this would ensure that the voltage is always maintained within the 400V +/-10% range.
However, this figure also shows how important it is to maintain the 400V +1% secondary voltage
constantly as any variation of that voltage could result in an irregular variation of the voltage at the
end of one of the feeders.
Tuesday, 21 October 2014
213
DEMO6 - dD6.6 Halfway assessment of the smart solar district
The provision of a constant secondary voltage is where the OLTC transformer is required. Indeed,
it is able to dynamically adjust its primary to secondary ratio depending on the variations of the
primary voltage. The French voltage plan of 2011 plans for variations at different levels: the primary
substation, the medium voltage network and the secondary substation – extreme variations are
given in the table below.
Voltage variations (extreme)
Summer
Winter
Primary substation
2%
2%
Medium voltage network
5%
-5%
Secondary substation
2%
-2%
Total primary voltage variation
9%
-5%
This table means that the primary voltage of the transformer could vary between 20kV - 5% and
20kV +9%. Thus, to ensure that it can provide a constant 400V +1% secondary voltage, the OLTC
transformer should be able to operate in the -8%/+6% range around the 20kV/400V transformation
ratio or +/-7% range around the 20kV/404V transformation ratio.
This example would have been extremely difficult to tackle with a classic transformer, as the
secondary voltage variations (-10%/+8%) added with the primary voltage variations (-5%/+9%)
exceed the acceptable +/-10% range. This highlights the potential of OLTC transformers for solar
districts (districts with a high penetration of PV production).
Tuesday, 21 October 2014
214
DEMO6 - dD6.6 Halfway assessment of the smart solar district
Adjustment intervals
The OLTC transformer operates on a 14%-wide range. There is a finite number of taps on the
winding that define which ratios within this -8%/+6% range (around the 20 kV/400V ratio) can be
selected.
The interval between the different taps is an important issue. A large interval could affect the
quality of the power and the devices connected due to the important variations of the voltage when
the transformer changes the tap position. A small interval would multiply the number of taps and
affect the cost and the maintenance of the system.
Usually, the interval between the taps in a transmission transformer is 1.5%. For other distribution
OLTC transformers, intervals are comprised between 1.5% and 2.5%. These intervals do not
create any issues for the downstream customers when the transformer changes from one tap to
the next.
We decided to settle for a 2% adjustment interval which would have resulted in the use of 8 taps to
cover the -8%/+6% range. However, it appeared that the common number of taps on an OLTC
distribution transformer is 9. We decided to make the most of this and to add a 2% margin at the
higher end of the operation range. This means that our OLTC transformer ends up converting a
primary voltage of 20kV +/-8% into a secondary voltage of 400V +1% (see table on the next page).
Comparing this table with the next page figure of a classic transformer technical specifications is a
good way of summarising the differences between a classic transformer and an OLTC transformer.
Indeed, it highlights the fact that an OLTC transformer can adapt to a larger spectrum of primary
voltage. Moreover, the OLTC transformer will adapt more accurately to these primary voltages than
a classic transformer and, finally, it will do so while ‘on-load’.
Primary taps and associated primary to secondary ratios of the OLTC transformer
Primary voltage
Secondary
voltage
21 600 V
21 200 V
20 800 V
20 400 V
404 V
20 000 V
19 600 V
19 200 V
18 800 V
Tuesday, 21 October 2014
215
DEMO6 - dD6.6 Halfway assessment of the smart solar district
18 400 V
Figure 70 - Classic transformer technical specifications
3.4.2 Integration of the OLTC transformer to the project
Integration to the intelligence of the project
The OLTC transformer has two different operating modes in the project:
1) Autonomous operation
On its own, the OLTC transformer uses sensors to measure the primary voltage and then select
the correct tap to deliver the fore-mentioned 400V +1% secondary voltage.
2) Integration to the Network Energy Manager
The OLTC transformer is able to receive commands from the project’s Network Energy Manager
(NEM). The NEM can thus feed the transformer a schedule of voltage set points. The OLTC
transformer will follow these set points and deliver a specific secondary voltage.
The link with the Network Energy Manager will be provided by a communicating box from ALSTOM
that will use a BPL (Broadband Power Line Carrier).
Tuesday, 21 October 2014
216
DEMO6 - dD6.6 Halfway assessment of the smart solar district
Integration of the OLTC transformer to the grid
To test the potential of this kind of transformer, it is important to select a secondary substation
where a classic transformer could have trouble maintaining the voltage in the +/- 10% range. These
substations are characterised by important variations of voltage on both the medium and low
voltage networks. Hence, the typical candidate would be a secondary substation connected far
from the primary substation with a long LV network, volatile consumers and some producers. This
type of substation will maximise the use of the tap changer to adapt the primary to secondary
voltage ratio of the transformer in real time.
Given the current repartition of the transformers power in the “Méditerranée” area, the OLTC
transformer is going to be a 400 kVA transformer. Due to the additional devices required for the
OLTC feature, the transformer will take more space than a classic 400 kVA transformer. Its size will
be somewhere between a 400 kVA and a 630 kVa transformer.
3.4.3 Development and installation of the OLTC
transformer
Current state of development
Given the specifications stated earlier in this report (400kVA, 20 000kV/404V +/- 8%, 9 taps), the
project selected the OLTC transformer Minera – a model developed by SCHNEIDER ELECTRIC.
The tap changer used is the iTAP by MR (Maschinenfabrik Reinhausen); it is capable of 700.000
operations before maintenance is required. Pictures of the transformer during its development are
available below.
Figure 71 - regulation box of OLTC transformer
Tuesday, 21 October 2014
217
DEMO6 - dD6.6 Halfway assessment of the smart solar district
Figure 72 - Built OLTC transformer
ERDF and SCHNEIDER ELECTRIC are currently running tests on the OLTC transformer in order
to make sure that it will be reliable both in its transforming role and in its voltage maintaining one.
Its installation and first operation are scheduled to take place in September 2014 in autonomous
mode. The remote operation of the OLTC transformer should be implemented before summer
2015. The finished product should look like the picture below.
Future location of the transformer
21
Seven solar districts have been identified in the Nice Grid project:
Cailletiers, Colombie, Docks Trachel, Lou Souleou, Pesquier, Plaine 1
and Rosemarines. They are the districts where the summer
experiments that deal with the integration of PV production take place.
They all correspond to districts where the high penetration of PV
production is likely to create constraints on the network and, thus, were
logical candidates to the installation of the OLTC transformer.
21
A solar district is a secondary substation and its corresponding customers
Tuesday, 21 October 2014
218
DEMO6 - dD6.6 Halfway assessment of the smart solar district
Figure 73 - Location of the main solar districts
In the end, the Cailletiers district was selected as the location of the OLTC transformer currently
under development. This district is a typical example of a residential area with multiple single-family
detached houses and a total of around 120 customers. The low voltage feeeders can be as long as
500 meters and consist in both underground and overhead lines of various cross-sections. These
features all increase the likelihood of the apparition of constraints on the low voltage network,
constraints that could be alleviated by the OLTC transformer.
Tuesday, 21 October 2014
219
DEMO6 - dD6.6 Halfway assessment of the smart solar district
A look at the Cailletiers substation and at the future implantation of the
OLTC transformer
Pictures of the prefabricated building housing the Cailletiers substation are located below. Two
doors allow access to the interior, the one on the right gives direct access to the transformer while
the one on the left leads to the MV connectors, the LV feeders and the metering equipments .
Figure 74 - Entrance of Cailletiers secondary substation
Tuesday, 21 October 2014
220
DEMO6 - dD6.6 Halfway assessment of the smart solar district
Figure 75 - Photo of the actual transformer at Cailletiers secondary substation
Tuesday, 21 October 2014
221
DEMO6 - dD6.6 Halfway assessment of the smart solar district
Figure 76 - Photo of Cailletiers secondary substation
The transformer of this substation is currently a 630 kVA transformer but it is oversized and a 400
kVA OLTC transformer will be enough. The fact that the building currently accommodates a 630
kVA transformer assures us that it will be large enough for a 400 kVA OLTC transformer even
though the OLTC modifications make it slightly bigger than a classic 400 kVA transformer.
The detailed technical specifications of the current transformer are included in Section 2.3 (last
figure of the section), it has a transformation ratio of 20 kV/410V with three taps that give it a +/2,5% operation range – however those taps cannot be changed on-load. Moving to a 20 kV/404V
+/-8% OLTC transformer will thus clearly improve the performances of the substation.
The figure below displays the schematics of the future installation, including the cables that will
pass underneath the technical raised flooring.
Tuesday, 21 October 2014
222
DEMO6 - dD6.6 Halfway assessment of the smart solar district
Figure 77 - Plan of the Cailletiers secondary substation
TIPI: General LV distribution panel
IS: Switches
FUS: Fuse
3.4.4 Conclusion
The on-load tap changing transformer that is going to be used in the NICE GRID project will be
responsible for the delivery of a constant secondary voltage of 404 V when running autonomously.
It will thus adapt to any variation of the primary voltage and adjust its primary to secondary voltage
ratio accordingly.
It will be able to fulfil this role autonomously but will also be fitted with a communication device so
that it is integrated as an extra flexibility source in the Network Energy Manager of the project.
When commanded to do so by the NEM, it will follow a planning of voltage set points instead of just
maintaining a constant secondary voltage.
The transformer that will be used in the project will be able to operate on a -10%/+6% range
around the 20 kV/400 V ratio. This means that the transformer will be able to cope with primary
voltages between 18 000 V and 21 600 V and still deliver a 404 V secondary voltage. To do this, it
will be fitted with 9 taps, each of them will correspond to a 2% step.
The OLTC transformer’s power will be 400 kVA but the transformer could take up as much space
as a 630 kVA transformer due to the additional devices.
It will be installed by September 2014.
Tuesday, 21 October 2014
223
DEMO6 - dD6.6 Halfway assessment of the smart solar district
4. Assessment of the PV onsite
installation
This section presents a review of PV installations to date, a progress report on the recruitment of
participants in PV management experiments, and, finally, a summary of the tests carried out to
validate the battery management solution proposed for storing the electricity produced by these
panels.
This section consists of three parts:
7.1: Description of the measures adopted to facilitate the acquisition of photovoltaic panels and
review of installations performed.
7.2: Description of EDF offers for PV management and initial recruitment results
7.3: Description of the tests carried out to validate the battery management solution deployed
within the framework of the NICE GRID project.
PA:
EDELIA gateway
PFD:
EDELIA Remote platform to control the inverter
TIC:
Customer remote information output of an ERDF electronic meter
SOC:
State Of Charge (as %) of the battery
SOH:
State Of Health of the battery
SRC:
Sunny Remote Control
EDELIA
EDF subsidiary
EDF
French utility
CSTB
Building Scientific and technical research center
Tuesday, 21 October 2014
224
DEMO6 - dD6.6 Halfway assessment of the smart solar district
4.1 Review of the PV implementation process and
of PV installations performed
4.1.1 NICE GRID: an ambitious photovoltaic power
project on a voluntary basis
The demonstrator has ambitious objectives for integration of photovoltaic power and demand
response capacity in Carros commune.
Since participation in the project is on a voluntary basis, EDF has worked out a recruitment process
to bring together the largest number of participants and to insure the quality of PV panels.
ERDF has defined six geographic areas, called "solar districts" (about 500 residential housing),
covered by the experiment, and EDF has endeavoured to identify potential participants in the
project according to this breakdown. The objective of a solar district was to have 30% of the district
consumption bring by solar electricity production (depending on the district this objective was
represented 8 to 20 new PV producers to recruit).
To perform this recruitment, EDF put in place a communication campaign targeted on the
inhabitants of these six districts and selected and designed a technical and financial support offer
for private individuals wanting to become equipped.
For EDF the aim was in particular to facilitate the acquisition of photovoltaic panels in the context of
the project by providing:
Technical aspects:
Technical quality of the photovoltaic installation set up on their houses;
Certification and commitment of the suppliers and installers of these installations.
Information aspects:
The forecast return on capital employed for these installations;
Neutrality with regard to a panel of installers and the choice of installer.
4.1.2 Recruitment process established by EDF
The recruitment process established by EDF for the customer assistance scheme with the support
of building scientific and technical research centre CSTB is described briefly below:
Identification of potential customers in the six "solar districts";
Establishment of a panel of photovoltaic panel installers who meet quality criteria defined in
cooperation with the CSTB;
Definition of communication strategy and the associated resources (workforce,
communication tools, events, incentives, etc.);
Launch of the recruitment campaign;
Analysis and processing of potential customers;
Tuesday, 21 October 2014
225
DEMO6 - dD6.6 Halfway assessment of the smart solar district
Promoting the EDF commercial offer with the assistance of the CSTB;
Customer agreement, signature of agreements, execution and commissioning of
photovoltaic installations and ecosystem.
4.1.3 Description of the “Smart solar equipment” offer
The aim was to facilitate customers' acquisition of a photovoltaic installation together with a battery
throughout the period of the NICE GRID experiment.
Under the NICE GRID experiment, therefore, EDF proposes:
Financial aid of up to €6,000. This amount, capped at €6,000, is designed to reduce the payback
period of PV panels by six years. It depends on the photovoltaic panel installation that will be
executed (amount, production potential, etc.). This aid is awarded to the first 50 signatories of the
quote by a PV installer supporting the project, and the experiment agreements. This offer was valid
until 31 July 2014. Results are presenting in 2.11 paragraph.
Assistance provided by an independent organization, Centre Scientifique et Technique du
Bâtiment (CSTB).
A choice of several commercial proposals by installers who are signatories of a cooperation
agreement with EDF within the framework of the NICE GRID project.
Free connection of your installation to the electricity grid.
The offer also proposes:
A new source of income: the electricity produced by the photovoltaic panels is bought by
EDF at the price applicable throughout the period of the buyback agreement.
A least-cost power reserve, stored at an attractive off-peak-hour price (during maximum
22
23
sunlight hours or during the night ) in a battery installed on the customer's premises. The
battery is free of charge for the period of the experiment (from December 2014 to
September 2015).
Electricity consumption at an attractive price between 12 pm and 4 pm during the 40
sunniest days of the summer of 2014 and then the summer of 2015.
Free, detailed monitoring of solar power consumption and production via an online service
offered throughout the period of the experiment.
24
A digital tablet offered to thank the customer for becoming a Consum-actor of the energy
system.
4.1.4 Definition and establishment of the specifications
for PV installers
22
For customers having the base-load option or the peak hour/off-peak hour option.
Only for customers having the peak hour/off-peak hour option.
24
Tablet delivered after installing the battery.
23
Tuesday, 21 October 2014
226
DEMO6 - dD6.6 Halfway assessment of the smart solar district
The identification and application of a multiple-criterion analysis makes it possible to build
specifications ensuring transparent selection of installers. Based on a normative and certification
approach, this analysis makes it possible, by quality indicators, to select the minimum prerequisites
that must be met by applicants for the project. The indicators or selection criteria were defined so
as to be transparent, objective and non-discriminatory for the installers.
The results of this action take the form of specifications, which were validated by a selected panel
of professionals in February 2013 in order to ensure a good match between objectives and
certification.
The establishment, implementation and method of dissemination of these specifications were
explained at the public meeting that EDF Commerce-Méditerranée organized in February 2013
with the support of building scientific and technical research centre CSTB. There was no technical
requirement for PV modules quality. But :
the French regulation gives some payback if the PV panels are incorporate to the building
the CSTB had to make a verification of the conformity of the PV electricity production
giving by the installer and regarding to PV modules installed
4.1.5 Identification of solar potential and site analysis
The solar potential of the six districts identified within the framework of the project was determined
in order to classify the expected levels of production potential. The aim was to validate the
estimates of the professionals who reply to the specifications (cf. §3). The results thus obtained can
therefore partially ensure evaluation of the proposed dossiers, complementing the checks
described in §2.4.
4.1.6 Definition and application of a set of technical
requirements for potential customers
A questionnaire was produced to identify all the technical and practical criteria of the sites receiving
a photovoltaic installation. This questionnaire should enable installers to make a "blind" estimate for
the installations they have to execute without favouring anyone. It can thus be used to place
installers in competition with one another. It is the quality of the dossiers presented that should be
used as the criterion for selection by the customer. Customers can then contact the installer of their
choice.
This questionnaire is built in three sections. The first section covers the structure/roof covering part,
the second section the electrical safety and sizing part, and the last section the electricity
generation, storage and energy part.
These three criteria make it possible to build the questionnaire but above all they allow collection of
all the information needed by the installers. The questionnaire was validated by the professionals to
ensure its consistency at a meeting held with the PV installers.
Tuesday, 21 October 2014
227
DEMO6 - dD6.6 Halfway assessment of the smart solar district
Collection of the data needed by the installers to produce quotes is performed by the CSTB.
4.1.7 Verification of the conformity of the technical
proposals with the project criteria
This verification aims to analyse and evaluate the conformity of all the installers' dossiers with the
requirements of the specification criteria (cf. §3) - objective and non-discriminatory criteria, and to
analyse and evaluate the conformity of all the proposals/quotes produced with the criteria of the
technical requirements questionnaire (cf. §5) - objective and technical criteria. An evaluation is also
made of the consistency of the proposal with the production potential expected when identifying the
solar potential (cf. § 4).
The technical proposals are compiled by the CSTB from the database built beforehand. The CSTB
ensures compliance with the commitments made by the installers within the framework of the
experiment (including response times, for example).
4.1.8 Verification of conformity of the proposals with the
work performed
This procedure concerns deployment of the technical solutions selected by customers on the
identified sites. Since the stated will of the CSTB is to ensure continuity in this project, worksite
checks and audits are performed randomly during the works to check the consistency between the
proposals and the installed items, as well as checks and audits upon delivery of said items.
This action ensures the effective quality of the installations executed with a view to efficiency and
exemplarity of the installations executed within the framework of the project.
4.1.9 Establishment of a panel of NICE GRID installers
with specific specifications for the NICE GRID
requirements
Work performance is still a major subject of concern for private customers who want to install
photovoltaic panels on their roof.
Tuesday, 21 October 2014
228
DEMO6 - dD6.6 Halfway assessment of the smart solar district
So as to reassure them, and in light of the context surrounding the photovoltaic power market, EDF
decided, with the support of the CSTB, to establish a panel of industrial installers capable of
meeting requests for the implementation of photovoltaic installations that EDF is going to promote.
These installers had to comply with the specific criteria and requirements worked out by the CSTB,
and sign a commitment charter.
To establish this panel of installers, the CSTB provided EDF with the list of all the companies
present in this market, the list of PV trade associations and non-profit organizations, certification
organizations and the French environment and energy management agency "ADEME", as well as
business magazines. EDF inserted in these publications an advertisement announcing a public
meeting to present the NICE GRID project, this meeting was open to all PV installers.
In addition to this announcement, and to mobilize the professionals, EDF sent each of them a letter
of invitation to this event.
Following this meeting, the interested installers complying with the criteria signed a commitment
charter, called a Collaboration Agreement, and became privileged interlocutors of those taking part
in the experiment.
4.1.10 Formalization of EDF's commitment to its
customers taking part in the NICE GRID
experiment
Following the communication and recruitment campaigns, inhabitants of Carros expressed interest
in joining the NICE GRID project.
These candidates for the experiment had personalized contacts with the EDF sales teams. They
then benefited from the assistance process described in section 2, with a view to having
photovoltaic panels installed on their roof. They received a visit by the CSTB and quotes from
photovoltaic installers approved by the CSTB, and when they took their decision to effectively
undertake the panel installation work, EDF proposed to them drawing up an Agreement on
participation in the NICE GRID experiment.
This agreement specifies the respective commitments and responsibilities of the two parties,
throughout the duration of the project, and in particular:
-
The reference of the quote indicating the equipment that will be installed;
The financial assistance granted by EDF and its method of payment;
Access to the electricity consumption and production data of the participant customers;
The confidentiality of customer data;
Measures to be taken if the customer no longer wanted to take part in the project;
Measures to be taken if the customer wanted to sell their house.
4.1.11 PV installations performed and feedback
The implementation process of the PV panels was satisfactory on the following points:
In its technical assistance measures, the support of the CSTB is a major asset for EDF.
Tuesday, 21 October 2014
229
DEMO6 - dD6.6 Halfway assessment of the smart solar district
This support is a real guarantee of trustworthiness and neutrality which encourages
customers to agree to take part in the project.
In the content of the commercial offer aiming to reduce the payback period for the PV
installation to at most 6 years;
In performance of the works, since worksite visits and audits effectively made it possible to
eliminate negligent installers and nonconforming equipment.
However, the economic and political environment is not conducive to PV installation. The
electricity buyback price fell constantly during the first two years of the project, as well as the
tax credit from which customers benefit.
The great majority of the identified potential customers intend to materialize their choice of PV
equipment. For the 24 customers identified, the ratios are as follows:
- 30% signed the agreement with EDF and are or will be equipped with PV panels;
- 46% customer's decision pending:
- 13% dossiers in the process of invitation to tender from the panel of installers;
- 11% did not follow up.
These few customers, identified by EDF as potential customers, then assisted according to the
scheme, in the end did not materialize the installation of photovoltaic panels on the roof of their
house. The reasons why these customers pulled out are of two orders:
- financial, because the cost of the customer's investment is not compatible with their available
cash at the time (about 5000 to 6000€);
- technical, because in most situations it is necessary, to confirm incorporation in the building, to
cut out the under-tile sheeting, and this can create fragility in the roof waterproofing system.
Moreover, the gestation of a potential customer's dossier takes a relatively long time given the
various stages required until the customer's final decision-making process. Three main periods can
be noted.
The first period involving setting an appointment for the CSTB's technical visit, taking into account
the timetables of the customer and the CSTB and weather conditions, covers about fifteen days.
Then, compilation of the technical dossier after the visit, sending it to the installers, the time allotted
for their replies, analysis on return by the CSTB and, finally, sending to EDF for transmission to the
customer takes around five weeks.
Finally, the customer's decision is subject to two constraints: the timetables of the installers
selected for the visit for physical confirmation of their quote, and the season, since it is not always
possible to know the electricity buyback price because this price, revised each quarter, is
announced only once the quarter is well underway.
Accordingly, everything combined, the time elapsing between identification of a potential customer
and their signature of the agreement can be as much as around three months.
Tuesday, 21 October 2014
230
DEMO6 - dD6.6 Halfway assessment of the smart solar district
So we couldn’t reach the objective for all the solar districts (30% of the district electricity
consumption is bringing by the PV electricity production) but we reach it for 3 of them.
Two districts will benefit of a production of 24kWc for one (hostel) and an additional 140kWc for the
other one (enterprise). The last district is expected to benefit 18kWc (6 housings).
Tuesday, 21 October 2014
231
DEMO6 - dD6.6 Halfway assessment of the smart solar district
4.1.12 Main documents used in the process
Communication document: I AM A CONSUM-ACTOR IN THE SMART SOLAR DISTRICT. Guide
of the CONSUM-ACTOR explaining instructively the potential benefits of demand management.
Communication document: A brochure presenting the "Smart solar equipment" offer described in
section 4.
Tuesday, 21 October 2014
232
DEMO6 - dD6.6 Halfway assessment of the smart solar district
Tuesday, 21 October 2014
233
DEMO6 - dD6.6 Halfway assessment of the smart solar district
Communication document: Notices in the town of Carros to raise inhabitants' awareness of the
project.
Tuesday, 21 October 2014
234
DEMO6 - dD6.6 Halfway assessment of the smart solar district
Tuesday, 21 October 2014
235
DEMO6 - dD6.6 Halfway assessment of the smart solar district
4.2 Offers proposed by EDF to customers to
encourage the introduction of PV
The massive introduction of new energies such as photovoltaic power on the grid creates new
challenges for the electrical system, which must adapt to receive these forms of production, which
are intermittent and erratic.
Strengthening the grid or building production facilities which would back up the intermittent
production sources would be possible solutions, but they are expensive for the community.
In the NICE GRID project, we are in fact testing an alternative, which involves adapting
consumption to production, and not the opposite as was done in the "incumbent" system. To
achieve this, the customer is invited to play a far more active role interacting with the network.
Within the framework of the NICE GRID project, EDF proposes to its customers in Carros, private
individuals or businesses, to take part in this ambitious project which announces the city of
tomorrow.
Concretely, EDF presents consumers of the 6 solar districts with 3 offers or "experiments" to take
part in a new generation of smart solar districts:
Solar bonus
Smart hot water cylinder
Smart solar equipment.
-
Tuesday, 21 October 2014
236
DEMO6 - dD6.6 Halfway assessment of the smart solar district
4.2.1 Description of the offers
Solar bonus
During the 40 "solar days" of the summer of 2014 and then the summer of 2015, indicated the day
before by SMS and/or e-mail, the district produces more electricity than it consumes between 12
pm and 4.00 pm. EDF invites customers in this experiment to shift their electricity consumption to
25
these hours, called "solar hours". At the end of each summer, EDF pays a gift cheque enabling
the customer to benefit from a price equivalent to off-peak hours for their electricity consumption
during the Solar Hours.
25
The amount of this gift cheque is calculated according to the following formula: the difference
between the peak hour or base-load price of your electricity supply contract and the off-peak-hour
price applied to your electricity consumption from 12 pm to 4.00 pm during the Solar Days. In all
cases, customers continue to pay for their electricity consumption from 12 pm to 4.00 pm at the
price indicated in their electricity supply contract. The prices can be looked up on the
"particuliers.edf.com" website.
Tuesday, 21 October 2014
237
DEMO6 - dD6.6 Halfway assessment of the smart solar district
Smart hot water cylinder
The "SMART HOT WATER CYLINDER" experiment began in June 2014. Why is it smart? It's
smart because it will be charged automatically at the times when the district's panels are productive
(about 40 days from 1 May to 30 September), thereby preventing excess production which could
result in some solar panels being disconnected from the electricity grid. This recharging takes place
in addition to its normal operation at night, so there is no impact on the customer's comfort. And
Tuesday, 21 October 2014
238
DEMO6 - dD6.6 Halfway assessment of the smart solar district
since abundant energy is then available in the district ("peak production"), customers benefit from
an electricity price between 12 pm and 4.00 pm equivalent to the off-peak-hour price so as to
encourage them to also shift their consumption to these so-called "solar" hours.
Smart solar equipment
The "SMART SOLAR EQUIPMENT" experiment encourages the customer to become equipped
with photovoltaic panels thanks to technical assistance from the CSTB to contribute to the quality of
the installations, and financial aid. This aid is granted for the PV installation and a storage solution
of the electric battery type provided by partner SAFT. This battery can store electricity at times
when the panels are most productive, to consume it later. Here again the customer benefits from
an electricity price reduced to the off-peak-hour price for their electricity consumption from 12 pm to
4.00 pm on "solar" days so as to encourage them to consume when there is excess production, or
else store it.
Tuesday, 21 October 2014
239
DEMO6 - dD6.6 Halfway assessment of the smart solar district
The so-called "solar" days are indicated to the customer by EDF the day before by SMS message
or email.
Each participant is entitled to detailed monitoring of their electricity consumption and their
production where applicable.
4.2.2 Results obtained for the first summer 2014:
The results for the first summer (as at 31 July 2014) are as follows (recruitment on 475
inhabitants):
Verbal
agreements
Written agreements
Active
Smart solar equipment (PV
24
+ battery)
6 (agreement for PV
installation)
Battery agreement at
signature of
customers in October
2014
Smart hot water cylinder
(cylinder management via
Linky)
30
25
24
Solar bonus
44
37
36
TOTAL
98
68
60
SUMMER
26
Recruitment is continuing, in particular via a sponsorship campaign to reach about one hundred
consum-actors in the solar districts (i.e. a recruitment target of 20% of the inhabitants of the solar
districts).
4.3 Individual battery management
4.3.1 Introduction: Scope of tests
Within the framework of the NiceGrid Smart Grids demonstration project, the use of a residential
battery is experimented in response to various requests from grid managers.
This battery is one of the levers allowing implementation of the Use Cases defined for the project:
Reduction in peak power;
Massive introduction of PV.
26
Active: actually take part in the experiments (the technical requirements for the customer's
subscription are met)
Tuesday, 21 October 2014
240
DEMO6 - dD6.6 Halfway assessment of the smart solar district
Management of this battery is performed by a local smart system (EDELIA box) itself servo
controlled by a remote platform managing demand.
Depending on the request from the PFD, the local smart system can use three battery
management strategies:
1. Default mode (no load);
2. Preparation mode (SOC to be reached by a given date);
3. Modulation mode (charge or discharge power to be applied – insofar as possible – during a
defined period of time).
This document presents a summary of the tests underway at EDF Lab les Renardières in the
"Multi-Energy Home" laboratory and the ConceptGrid tests at EDF Lab les Renardières, which
validate the operation of this local smart system before it is deployed on the experimental sites.
4.3.2 Description of tested equipment
The tested system consists of:
an electrochemical storage system (INTENSIUM HOME) from SAFT;
a 6.0H SUNNY ISLAND inverter system from SMA;
the local smart system, itself consisting of:
o an EDELIA gateway;
o a TIC reader-transmitter (MC11) supplied by EDELIA.
Diagram presenting all the storage and management equipment deployed:
Tuesday, 21 October 2014
241
DEMO6 - dD6.6 Halfway assessment of the smart solar district
SAFT 4 kWh Li-Ion battery
The electrochemical storage device is an NCA (Nickel Cadmium Aluminium) type Li-Ion battery, the
main characteristics of which are as follows:
Capacity: 82 Ah (4 kWh) (the charging time of the battery depends on the power load)
48 VDC (2 SYNERION 24V modules in series)
Pmax discharge: 7,6 kW
Pmax Charge: 4 kW
Efficiency (charge or discharge) : > 95 %.
The 3 modules (2 SYNERION + 1 BMM) are contained in a cabinet which comes in 2 versions for
the project: indoor version (doc. [4]) and outdoor version (doc. [5]).
Indoor version :
IP20 – 95 kg ;
Gas Management System ;
Cables on the top.
Outdoor version :
IP54 – 95 kg ;
Heating system and ventilation ;
Cables on the bottom.
-
Tuesday, 21 October 2014
242
DEMO6 - dD6.6 Halfway assessment of the smart solar district
Figure 78. SAFT "indoor" battery
Tuesday, 21 October 2014
243
DEMO6 - dD6.6 Halfway assessment of the smart solar district
Figure 79. SAFT "outdoor" battery
SMA Sunny Island inverter
The SMA inverter serves as the interface between the battery and the electricity grid. In particular,
it is this device which controls battery charging or discharging according to requests from the
gateway, taking into account the real-time operating parameters provided by the battery itself.
It is a 6.0H Sunny Island inverter equipped with its wired remote control SRC (Sunny Remote
Control) (cf. documents [6] and [7]):
Rated power (AC): 4.6 kW;
Rated input DC voltage: 48 V;
Battery types: Pb (FLA,VRLA), Li-Ion;
Capacity range of Li-Ion batteries 50 to 10,000 Ah;
European efficiency: 94.3%
Consumption:
Standby: < 4 W;
Open circuit and discharge: < 27 W
-
Figure 80. Sunny Island and Sunny Remote Control (SRC)
The SRC has a slot for insertion of an SD card on which the inverter records its operating data at 1
min. intervals and events such as alarms.
EDELIA gateway
The gateway serves as an interface between the PFD and the local system. It also contains the
algorithm for battery management according to local parameters (consumption, condition of the
battery, etc.) and requests coming from the PFD.
It communicates (cf. document [2] § III):
via Internet (Ethernet cable link to the internet customer’s box or GPRS) with the PFD;
via an RS485 cable (SMANET protocol) with the SMA inverter (connection to an USB port).
via radio (EN13757-4 (868MHz)) with the TIC MC11 reader, in Receive mode only.
-
Tuesday, 21 October 2014
244
DEMO6 - dD6.6 Halfway assessment of the smart solar district
Figure 81. EDELIA gateway
EDELIA TIC reader: MC11
The TIC reader-transmitter (MC11) is connected to the customer remote information (TIC) output of
the ERDF electronic meters. It is compatible with the communicating meters “Linky” (used in the
context of NiceGrid). It recovers the information sent over this output such as the energy set point,
the current tariff period, etc., which it sends in broadcast mode to the gateway.
It communicates via an encrypted one-way radio link with this gateway.
A LED indicates the status of the TIC link, for a few minutes.
Some technical characteristics (cf. document [2] § III):
Operation on non-replaceable battery;
Service life: about three years;
Radio protocol: EN13757-4 (868MHz);
Data sending: every 3 min.
Radio range: about 30 metres indoors
-
Figure 82. TIC MC11 reader
Operating principle:
Depending on the requests from the PFD, the current tariff period and the various energy flows on
the site, the gateway calculates set-point battery charge and discharge values which it sends to the
inverter so that the latter may apply them if they are appropriate for the limits of the inverter-battery
system.
Otherwise, the inverter may stop charging or discharging, or else change the set-point value to
make it compatible with the operating limits.
There are three possible management modes:
1. Default mode: No request is made by the PFD. In this case the gateway applies 2
strategies depending on whether the customer has a PEAK/OFF-PEAK or BASE-LOAD
tariff.
In the case of a PEAK/OFF-PEAK tariff the battery is charged in off-peak hours and
discharged in peak hours according to the customer's consumption.
For a BASE-LOAD tariff, no charging or discharging is performed.
In all cases, the gateway ensures that the battery's SOC is at SOC_0H at 00h00 every day
Tuesday, 21 October 2014
245
DEMO6 - dD6.6 Halfway assessment of the smart solar district
2. Preparation mode: The PFD sends to the gateway a target SOC to be reached before the
end of the allotted period while taking into account the customer's consumption.
3. Modulation mode: In this third mode the PFD provides a set-point value in charge or
discharge power, during a defined period of time, that the gateway tries to comply with as
well as possible depending on the customer's consumption.
The following table27 summarizes these various operating modes:
Customers with
peak/off-peak tariff
Default mode
To charge the most possible during
the peak hours
To discharge the most possible
duringt he off-peak hours
Preparation mode
To charge or discharge the battery
to reach SOC target
To respect the charge/discharge
hours
Modulation mode
To follow as well as possible the
PFD set-point
Customers with Base-load
tariff
To limit the customer loss
To maintain the battery level
around SOC00h
Charge or discharge the battery to
reach SOCtarget
To follow as well as possible the
PFD set-point
Protection mechanisms
High SOC protection
When the battery's SOC reaches the value SOC_MAX, the gateway stops battery charging, unless
a higher preparation target SOC overrides this rule.
Low SOC protection
When the battery's SOC reaches the value SOC_MIN, the gateway stops battery discharging,
unless a lower preparation target SOC overrides this rule.
Critical SOC protection
The gateway has a protection mode when the SOC reaches a critical low threshold
(SOC_CRITICAL): whatever the operating mode (default, preparation, power), it gives the inverter
the order to recharge the battery to a power of FLOATING_POWER or higher value if the current
mode requires recharging the battery.
This recharging is stopped when the SOC reaches SOC_MIN.
Moreover, the inverter also has its own parameter determining the minimum value of the SOC
authorizing battery discharging. Below this value, which is set to a point lower than the
SOC_CRITICAL, the inverter stops any discharging.
Finally, below 3% for more than 5 min., the inverter is switched off and a manual action is
27
Source: EDELIA
Tuesday, 21 October 2014
246
DEMO6 - dD6.6 Halfway assessment of the smart solar district
necessary to restart it.
No circuit breaker tripping
When the battery is recharging, it consumes energy on the grid. This consumption is added to that
of the customer in whose home the battery is installed. Charge management must take into
account the total consumption of the house (with the battery) to prevent exceeding the customer's
contract power and thus causing circuit breaker tripping of the installation.
When it receives consumption data from the MC11 (every 3 min. in theory), the gateway checks
that the power consumed does not exceed the contract power given by the Linky meter and adjusts
the battery's set-point charge value.
Since the time interval (3 min.) is too high to ensure no circuit breaker tripping in real time, a safety
factor is applied to the battery's set-point charge value and a safety margin is applied to the
maximum power to reduce the risk.
No injection
Conversely, when the battery is discharging, it must not inject energy into the grid. The power
supplied by the battery must not exceed that consumed by the customer.
When it receives consumption data from the MC11 (every 3 min. in theory), the gateway checks
that the power injected into the grid is zero and adjusts the battery's set-point discharge value.
Since the time interval (3 min.) is too high to ensure no injection in real time, a safety factor is
applied to the battery's set-point discharge value and a safety margin is applied to the reinjection
threshold to reduce the risk.
Limiting operating losses
The inverter's power supply is provided by the battery.
The inverter specifications indicate own consumption of:
< 27 W in normal operation;
< 4 W in standby mode.
To limit operating losses, the inverter is placed in standby mode when no charge or discharge is
requested of the system.
Data reporting
The gateway reports every hour the collected data :
from the Linky meter via the MC11 with a 3 mn interval (extraction and injection set point,
current tariff period, date, etc.); the PDF receive the collected data every 10 mn.
from the inverter with a 1 mn interval (status: operation, standby, warning, error, SOC,
current P charge or discharge, power meters, etc.).
In the event of a warning or error message sent by the inverter, it transmits the error code in real
time.
Summary of gateway prototype development tests
In early 2014, development tests for a prototype of the gateway were performed in the MM-E
laboratory.
The main objectives of these tests were to:
Tuesday, 21 October 2014
247
DEMO6 - dD6.6 Halfway assessment of the smart solar district
-
Validate the choice of management algorithm in order to finalize its specifications;
Test in real time the SMANET communication protocol with the inverter (since EDELIA has
no inverter).
The prototype consisted of a laptop computer under Windows on which the algorithm was run.
Communication with the inverter was implemented via a radio interface (a USB key at the computer
end and a box with an RS485 interface at the inverter end) supplied by WATTECO.
Since WATTECO has pulled out of the project, a cable-connected communication solution has had
to be examined and EDELIA has had to include management of the SMANET protocol in its
software.
Since the MC11 box of the prototype was not configured to read the standard TIC, the Linky meter
was configured as an historical TIC. In this mode, some data, especially those relating to injection,
are not present.
A gateway prototype then replaced the computer, and this led to the following architecture, which
has become definitive for the validation tests:
ERDF Meter
Gateway
MC11
Inverter
ADSL box
W-MBUS (radio 868 MHz)
SMANet over RS-485 (RJ45 cable)
TCP/IP (ETHERNET cable)
Figure 83. Final prototype architecture (doc [3])
Tuesday, 21 October 2014
248
DEMO6 - dD6.6 Halfway assessment of the smart solar district
These tests made it possible to check that the management algorithm corresponded to the
definition of the need (doc. [2]), and in particular battery management in the various modes.
They also contributed to:
Determination of connector systems and the physical characteristics of communication with
the inverter.
Consolidation of the data exchanged between the gateway and inverter (operating
parameters, operating values, alarms);
Improvement of alarm management between the battery and the inverter (entailing an
update of the battery parameters by SAFT);
Definition of the TIC data allowing monitoring of the site's extraction and injection.
Adjustment of the algorithm's operating parameters (cf. Table § 0).
During these tests the decision was taken to eliminate the three-phase sites from the scope of the
experiment, since overall TIC data, and not phase by phase, cannot ensure satisfactory functioning
of the algorithm.
These tests also highlighted problems of reliability regarding TIC data transmission between the
MC11 and the gateway.
Reception problems were a priori attributed to the disturbed environment of the laboratory, but it
was decided to investigate this point in greater detail during the validation tests.
The limitations of the prototype compared with the planned final version (historical TIC, poor
transmission between the MC11 and the gateway) meant that improvements were considered in
order to increase the robustness of the algorithm in degraded operation.
4.3.3 Description of the installations and the test
instrumentation
28
Two installations have been made to operate the test (see pictures in Annexe 2).
In the Multi-Energy Home (MM-E) laboratory
This laboratory has an acquisition system which measures continuously (every 10s) the average
battery charge and discharge power values, and installation injection and extraction.
The electric power supply is single-phase. The Linky meter, of the L+G brand, is configured in
PEAK/OFF-PEAK tariff with off-peak hours from 11.00 pm to 7.00 am.
The battery cabinet used is of the indoor type.
The following diagram shows the installation in the laboratory.
28
An indoor battery and a outdoor battery have been tested in EDF Labs (cf. Figure 84 and figure
85).
Tuesday, 21 October 2014
249
DEMO6 - dD6.6 Halfway assessment of the smart solar district
Figure 84. Single-line diagram of the installation in the MM-E laboratory – Indoor battery
In the ConceptGrid laboratory
This installation is not monitored. Only the information reported by the EDELIA gateway and the
data recordings of the inverter on the SD Card of the SRC are available.
The electric power supply is single-phase. The Linky meter, of the ITRON brand, is configured in
base-load tariff.
The battery cabinet used is of the outdoor type.
This installation was used mainly for the operating tests and certain limit tests.
Tuesday, 21 October 2014
250
DEMO6 - dD6.6 Halfway assessment of the smart solar district
Figure 85. Single-line diagram of the installation in the ConceptGrid- Outdoor battery
4.3.4 Test conditions
The following table lists the various operating parameters of the management algorithm
incorporated in the EDELIA gateway as they were set at the start of the tests.
During the tests, adjustments were made to these parameters.
Field Name
Description
SOC_CRITICAL
Critical SOC before emergency stoppage (at 3%) of the
inverter
8%
SOC_MIN
Minimum SOC for discharge
15%
SOC_MAX
Maximum SOC for charge
90%
SOC_0H
Reference SOC at midnight
15%
CHARGE_MARGIN
No-circuit-breaker-tripping margin
500W
DISCHARGE_MARGIN
No-reinjection margin
200W
Tuesday, 21 October 2014
Value
251
DEMO6 - dD6.6 Halfway assessment of the smart solar district
MIN_CHARGE_POWER
Min. charge power
100W
MAX_CHARGE_POWER
Max. charge power
4000W
MIN_DISCHARGE_POWER
Min. discharge power
100W
MAX_DISCHARGE_POWER
Max. discharge power
4500W
FLOATING_POWER
Floating charge power
500W
Lower SOC strip
SOC_STRIP_INF
5%
(allowance for self-discharge)
Upper SOC strip
SOC_STRIP_SUP
2%
(allowance for hysteresis in charging)
DEFAULT_POWER_PCT
Percentage of power in default mode
75%
WD_TIMEOUT
Watchdog tripping timeout (minutes)
10mn
Figure 86. Single-line diagram of the complete installation in the laboratory
4.3.5 Test procedure
The first tests concerned the reliability of transmission between the MC11 and the gateway.
During these tests the Linky meter of the L+G brand was replaced by a meter of the ITRON brand,
since problems of compatibility were detected on the MC11/Landis+Gyr meter pair (cf. § ).
Since the inverter was originally planned for the German electricity grid, SMA provided us with a
procedure to change certain decoupling parameters to bring it into line with French regulations.
These adjustments were possible only after updating the SUNNY ISLAND software from version
3.0 to version 3.1.
Note that for the prototype tests the inverter software version was number 2.3.
During the tests, improvements were made to the management algorithm, in particular regarding
the following aspects:
Floating charge;
Robustness with regard to possible inverter malfunctions.
The following table summarizes these changes.
Description of change
Correction of an UTC/Local time difference causing off-peak charge 2 hours
late
Correction of a problem of collection punctuality
Correction of a FedInSocStr/Stp initialization problem
Reactivation of FedInSpntCom at each starting of the inverter
Reduction of floating charge power
Date of
Firmware Specifications
deployment
version
version
(2014)
1.0.2
< v3.0
June
1.0.2
1.0.3
1.1.3
1.1.3
< v3.0
v3.0
v3.0
v3.0
June
20 August
20 August
20 August
Figure 87. Table of changes in the management algorithm
Tuesday, 21 October 2014
252
DEMO6 - dD6.6 Halfway assessment of the smart solar district
4.3.6 Test results and analysis/interpretation
The list of tests is given below together with their interpretation when they have been completed.
The complete performance report at the date of the document is presented in Appendix 1.
Operating tests
Default operation
On the BASE-LOAD tariff, default operation, which involves keeping the battery at a SOC of 15%
(SOC_0H), causes, in nominal operating conditions, regular so-called "floating" recharging to
compensate for the system's self-discharge.
We note:
An excessive recharge power given the SOC to be achieved (+5% in the test
configuration). => change in the algorithm to manage the "floating charge" concept with an
appropriate power.
A discharge sometimes follows the charge when an SOC jump occurs after stopping
charging. => increase in the SOC_STRIP_SUP parameter, the role of which is to allow for
these SOC jumps.
In PEAK/OFF-PEAK tariff the operation which involves charging in off-peak hours and then
discharging in peak hours highlighted the following behaviour, specific to the test sites:
In off-peak hours, charging is very rapid (<1 hour) because the consumption profile of the
test sites is low.
In peak hours, discharging is slow and even insufficient (>15 hours) because the
consumption profile of the test site is low or even no consumption can be observed
This second point made it possible to observe regularly the response of the algorithm concerning
non-injection.
Concerning the first point, these results led to the proposal of a reduction in the charge/discharge
factor in order to reduce the risks of circuit breaker tripping on the sites of customers whose
consumption profile will be more erratic and higher.
Preparation mode
Several preparation orders were sent at 90% or 15% of SOC. In satisfactory radio reception
conditions, all the orders were carried out. The same observations as in the default mode were
made in the MM-E where the low and very erratic consumption lengthened the time before
reaching the set-point value, although without exceeding the allotted time.
Modulation mode
In modulation mode, the system must follow a fixed set-point power value over a given period
within the limits of the constraints of the inverter/battery and the instantaneous consumption of the
site.
As for the other modes, compliance with the set-point value in charging posed no problem. In
discharging, the set-point value was not always able to be complied with given the low
consumption in the MM-E.
However, set-point value following was regularly interrupted by tripping of the watchdog caused by
Tuesday, 21 October 2014
253
DEMO6 - dD6.6 Halfway assessment of the smart solar district
the absence of data reception from the MC11 for more than 10 minutes.
Figure 11. Modulation punctuated by safety stoppages
This limitation is the direct consequence of the radio problems encountered between the MC11 and
the gateway.
Mode sequences
Sequencing of operating modes posed no problems during the tests and the sequence took place
satisfactorily.
Limit tests
High SOC
The high SOC limit is directly secured by the operation of the battery inverter system which cannot
be charged beyond 100%. For reasons of efficiency, however, the algorithm stops all charging at
90% (SOC_MAX).
Floating charge
The floating charge is designed to offset losses due to self-consumption by the inverter and the
battery. It is started whenever the SOC diverges by more than 5% (SOC_STRIP_INF) below the
current SOC set-point value.
When the SOC goes below the bar of (SOCtarget-5%), the battery is recharged up to SOCtarget.
In its initial version, the algorithm did not specifically define the floating charge. This was implicit
due to failure to reach the set-point value. The power of the charge was therefore the default power
used in default or preparation mode and hence oversized for recharging the battery by 5%
(200Wh).
Tuesday, 21 October 2014
254
DEMO6 - dD6.6 Halfway assessment of the smart solar district
A change was therefore made to limit the power in the lower SOC strip to 1000W
(FLOATING_POWER). Under these conditions, a floating charge lasts about ten minutes.
Safety charge
When the SOC goes below the 8% bar, the battery is recharged up to 15%.
The same behaviour as for the safety charge is observed:
When the gateway stops recharging at 15%, it may occur that a SOC jump raises this
value to 18%, which generates a battery discharge of up to 15%, the operating mode being
the default mode.
The change for the floating charge above was likewise applied to limit this phenomenon.
No circuit breaker tripping and no injection
During the tests, injection periods were observed. Operating analysis showed a good response of
the system to injection (appropriate reduction in the discharge). However, the response time did not
make it possible to completely prevent injection.
A test is underway to place the installation in a critical case for circuit breaker tripping, and the
results should be similar.
These observations are due to the MC11 sending period of 3 minutes, possibly extended in the
event of reception problems, which cannot fully ensure non-injection or no circuit breaker tripping of
the installation.
In order to prevent these two phenomena, the safety margins and factors should be adapted in
order to reduce the risks of placing the system in a critical situation.
Low set-point values
A management inhibition function when the set-point value is low can place the inverter in a linear
zone.
When the charge or discharge set-point value is less than 100W, no order is sent to the inverter.
SOC jumps
During the tests, SOC jumps of between 1% and 2% were regularly observed. These were
provided for as of the algorithm design stage and their management is ensured by the upper/lower
SOC strips. However, larger jumps (up to 5%) were observed occasionally at the end of charging
or discharging.
By increasing the upper SOC strip and reducing the floating charge power, the appearance of
these jumps or their impact was able to be reduced.
Communication
Use of PLC connectors
Two PLC connectors were installed in the MM-E laboratory:
The first with an Ethernet link with the gateway;
The second connected to an output of the laboratory router.
No change in the system's operation was detected. In particular, communication with the PFD
(reception of requests, data and alarm reporting) was not adversely affected.
Tuesday, 21 October 2014
255
DEMO6 - dD6.6 Halfway assessment of the smart solar district
ERDF Meter
Gateway
MC11
PLC plug
PLC plug
Inverter
ADSL box
PLC over Electric cable
W-MBUS (radio 868 MHz)
SMANet over RS-485 (RJ45 cable)
Figure 88. Testing scheme with PLC plugs
Reliability between the MC11 and the gateway
The first reliability tests revealed a problem of compatibility of the MC11 (detection of the TIC
signal) with the Linky meters of the Landis+Gyr brand.
In one of the laboratories, the L+G Linky meter was replaced with an ITRON meter.
Measurements performed with a spy (supplied by EDELIA) gave the following frame reception
averages:
Average
Maximum
Standard
deviation
MM-E
00:05:43
00:36:00
00:04:16
ConceptGrid
00:05:39
00:41:59
00:04:10
The various analyses performed concluded that radio problems are caused by a combination of
various factors:
Radio environment (the risk of radio collision is especially high when the number of
sensors on the frequency band is high).
MC11/Gateway distance (since the power of the signal weakens based on a factor of the
square of the distance).
Length of the sent frame (the standard TIC frame being longer than an historical TIC
frame, the risk of radio collision is statistically higher).
The operating conditions on the two test sites cannot be considered as critical (clean radio
Tuesday, 21 October 2014
256
DEMO6 - dD6.6 Halfway assessment of the smart solar district
environment, small MC11/gateway distance, target frame length).
Reception problems were regularly observed between the MC11 and the gateway. These are due
to radio collisions on frames not retransmitted (broadcast transmission).
So far, no technical solution has been able to be provided.
Tests in degraded mode
Loss of communication
Gateway – Inverter
The cable between the gateway and the inverter was disconnected in 2 operating configurations
(battery in charging and discharging mode): in these configurations the inverter stopped when the
SOC reached its operating limits (100% for charging, FedInSOCStp for discharging).
Gateway – ADSL box
In the event of interruption of communication between the gateway and the PFD, the gateway
correctly performs the instructions that it has stored in memory, then goes into default mode.
When communication returns, remote control can be resumed.
Gateway – TIC reader
A halt in reception of TIC frames by the gateway causes resetting of the set-point value by the
gateway after the time defined by the Watchdog. An alarm is sent to the PFD.
Inverter – Battery
When the communication cable linking the battery to the inverter is disconnected, battery charging
or discharging stops and the inverter goes to alarm mode.
Electric power outage
This test has not yet been performed.
Data measurement and collection
Energy measurements
Verification of the measurements reported via the gateway is in progress.
Alarms
During the various tests, the alarms related to malfunctions were suitably sent to the PFD.
In particular, one of these alarms made it possible to identify a problem at the battery level which is
being dealt with.
Efficiency of the inverter/battery system
Tuesday, 21 October 2014
257
DEMO6 - dD6.6 Halfway assessment of the smart solar district
The overall efficiency of the complete system (including the power supply for auxiliaries) will be
calculated at the end of the tests.
4.4 Conclusion
The implementation process of the PV panels was satisfactory on the following points:
In its technical assistance measures, the support of the CSTB is a major asset for EDF.
This support is a real guarantee of trustworthiness and neutrality which encourages
customers to agree to take part in the project.
In the content of the commercial offer aiming to reduce the payback period for the PV
installation to at most 6 years;
In performance of the works, since worksite visits and audits effectively made it possible to
eliminate negligent installers and nonconforming equipment.
However, the economic and political environment is not conducive to PV installation. The electricity
buyback price fell constantly during the first two years of the project, as well as the tax credit from
which customers benefit.
So we could not reach the objective for all the solar districts (30% of the district electricity
consumption is bringing by the PV electricity production) but we reach it for 3 of them.
Two districts will benefit of a production of 24kWc for one (hostel) and an additional 140kWc for the
other one (enterprise). The last district is expected to benefit 18kWc (6 housings).
However, the participation of people for management of the PV in their neighborhood was pretty
good. Indeed, 14% of prospects have signed a participation agreement. So they agreed to store
electricity in a battery, or engage their hot water or move their consumption during peak production.
Recruitment is continuing, in particular via a sponsorship campaign to reach about one hundred
consum-actors in the solar districts (i.e. a recruitment target of 20% of the inhabitants of the solar
districts).
Now, for the individual battery management system, the tests in progress are on the whole
satisfactory and show no problems preventing satisfactory operation of the local smart system.
The latter satisfactorily manages the system's various operating modes (default, preparation,
modulation).
Alarm reporting is performed correctly.
Management of limit cases (floating charge, high and low SOC threshold, etc.) and degraded
modes means it is possible to limit cases requiring manual intervention to a minimum.
A few tests still have to be completed, in particular measurement verification, calculation of the
system's overall efficiency, and electric power outage.
However, these tests revealed a few weaknesses of the system:
Incompatibility of the MC11 with the version 1 Linky meters of the Landys + GYR
brand;
Unreliability of broadcast sending of TIC data by the MC11.
Time interval of 3 minutes for these data, making it impossible to ensure non-injection
Tuesday, 21 October 2014
258
DEMO6 - dD6.6 Halfway assessment of the smart solar district
and no circuit breaker tripping (unless, for the latter point, the customer's contract
power is increased or the battery's charge power is severely limited);
To ensure the end of 2014 deployment, management solution presented in this document will be
deployed on ITRON meters and will limit the power of the batteries. The project team is considering
the implementation of a rapid feedback loop to provide a solution to ensure the non-injection or not
exceeding contracted power and the house PV production.
These tests also made it possible to detect:
An inverter management problem (following the transition to version 3.1) which must be
corrected to ensure satisfactory operation of the system;
A weakness of the battery which seems to accept rather excessive charge powers, and
this can cause stoppage of the battery, requiring a manual intervention to start again.
These two points are currently being dealt with.
The first summer (2014) was used to evaluate the performance of storage solution via hot water
cylinders or displacement of consumption through price incentives. The second summer (2015) will
also test the use of electric storage (planned deployment on winter 2014/2015).
Tuesday, 21 October 2014
259
DEMO6 - dD6.6 Halfway assessment of the smart solar district
4.5 Appendices
4.5.1 Appendix 1:
Family
Name
Status
Result
Installation
Initial installation of the system
Completed
OK (V1.1.3)
Operation
Nominal operation of the default
algorithm
Completed
OK
Default charge/discharge power
Completed
OK
SOC_OH verification
Completed
OK
Nominal operation of the
preparation algorithm
Completed
OK
Nominal operation of the
modulation algorithm
Completed
OK
Mode sequences
Completed
OK
Change or cancellation of orders
Completed
Warning
Verification of the SOC_MAX charge limit
(or 90% < SOCTarget < 100% in
preparation)
Completed
OK
Verification of the SOC_MIN discharge limit
(or 0% < SOCTarget < 15% in preparation)
Completed
OK
Floating charge test
Completed
OK
Safety charge
Completed
OK
Minimum charge and discharge powers
Completed
OK
Tests for no circuit breaker tripping and no
injection
In progress
SOC jump measurements in cases of
charge or discharge at high power
In progress
SOC jump measurements in cases of
charge or discharge at low power
In progress
ADSL communication via PLC connectors
Completed
Limits
Communication
Tuesday, 21 October 2014
OK
260
DEMO6 - dD6.6 Halfway assessment of the smart solar district
Degraded
Data
Reliability of MC11/gateway communication
Completed
Warning (the 3
min. interval is
not complied
with)
Loss of inverter communication in charging
(preparation or modulation mode)
Completed
OK
Loss of inverter communication in
discharging (preparation/modulation mode)
Completed
OK
Loss of inverter communication on standby
Completed
OK
Loss of meter communication (MC11)
Completed
OK
Loss of ADSL communication of the
gateway during mode
NOT
completed
Loss of ADSL communication of the
gateway before a sequence (preparation,
modulation)
Completed
Loss of Inverter-Battery communication
In progress
Grid power outage
NOT
completed
Energy measurements
In progress
Alarm reporting to the PFD
Completed
Measurement of Inverter-Battery system
efficiency
In progress
Tuesday, 21 October 2014
OK
OK
261
DEMO6 - dD6.6 Halfway assessment of the smart solar district
4.5.2 Appendix 2 : Pictures of the 2 installations
Figure 89. Outdoor battery at the Conceptgrid laboratory
Tuesday, 21 October 2014
262
DEMO6 - dD6.6 Halfway assessment of the smart solar district
Figure 90. Indoor battery at the MM-E laboratory
4.6 References
[1]
PE/E13/14/05:
[2]
LV4-12-1:
[3]
[4]
SDU/MTH/BD/13-0650:
[5]
SDU/MTH/BD/13-2400:
[6]
[7]
SI80H-60H-IA-fr-20W:
SI60H-80H-BE-fr-20W:
Tuesday, 21 October 2014
Test programme - Tests for validation of the local smart system
managing the residential battery – NiceGrid project (2014);
Specification of the architecture and components (residential
customers);
NiceGrid
Edelia
gateway
algorithm
specifications
(v2.9 & v3.0);
INDUSTRIAL BATTERY UNIT - SAFT Li-ion unit - Intensium
Home – 4kWh battery system;
INDUSTRIAL BATTERY UNIT - SAFT Li-ion unit - Outdoor
Intensium Home – 4kWh battery system;
Installation instructions - SUNNY ISLAND 6.0H / 8.0H;
Operating instructions - SUNNY ISLAND 6.0H/8.0H - SUNNY
REMOTE CONTROL;
263