1
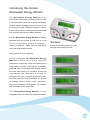
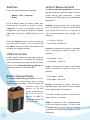
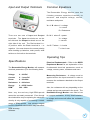
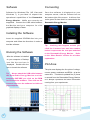
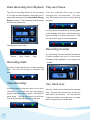
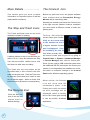
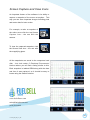
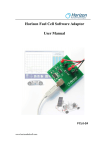
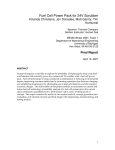
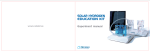
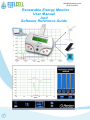
[email protected]
(979) 703-1925
Renewable Energy Monitor
User Manual
And
Software Reference Guide
1
Introducing the Horizon
Renewable Energy Monitor
The Renewable Energy Monitor is an
educational evaluation monitoring device with
PC measurement software for graphical display
of performance characteristics on its own 2 line
LCD screen or your Windows computer. It has a
2 line LCD screen for viewing measurements that
you cycle through just by pushing a button.
And the Renewable Energy Monitor is battery
operated and comes with a USB port so it can
also be used with or without a computer –
Screens
indoors or outdoors – where you can make direct
Just push the Select button to cycle
solar and wind measurements.
through the following screens:
And its power is in its simplicity!
Horizon developed the Renewable Energy
Monitor to allow you to avoid using the
multimeters confusing setup and cumbersome
computations in order to provide an immediate,
graphical way for recording data directly with no
formulas and nothing to calculate. Numerous
experiments and evaluation activities for
hydrogen fuel cells, miniature wind turbine kits,
and solar panels are now quantifiable in real time
for voltage, current, power, joules, resistance,
and even wind turbine RPM speed – all viewable
and recordable at the same time!
The Renewable Energy Monitor is fully
compatible with any of Horizon’s educational kits.
2
Units of Measurements
Switches
There are only two switches to operate:
The Renewable Energy Monitor measures
standard electrical units like voltage, current,
• Battery – OFF - Computer
power, energy and resistance.
It also
• Select
measures the RPM speed of the WindPitch
wind turbine.
Set it to Battery when you want to make your
measurements outside or without using a
Voltage is measured in volts or millivolts
computer, or set it to Computer when it’s
(mV). A millivolts is 1/1000 of a volt but when
plugged into your computer using the supplied
seen on the LCD screen it can provide a
USB cable. And set it to OFF when it’s not in
more accurate measure of the voltage. For
use.
example…
Push the Select button to cycle through the
1.23 volts = 1230 mV
four main LCD screens. You can even hold
10.456 volts = 10456 mV
the Select button to “freeze” the display if the
numbers are changing too fast.
Current is measured in amps or milliamps
(mA). A milliamp is 1/1000 of an amp. For
USB Connection
A USB “type B” connector on the back of the unit
allows connection to a Windows PC computer
(MAC computers are not supported at this time).
Power for the Renewable Energy Monitor is
supplied by the PC via the USB cable.
example…
0.003 amps = 3 mA
1.256 amps = 1256 mA
Power is measured in watts or milliwatts
(mW). A milliwatt is 1/1000 of a watt. For
example…
Battery Requirements
The Renewable Energy Monitor uses a
standard 9 volt radio battery that is easily
replaced when necessary. The LCD screen will
indicate when
indicate when the
battery is low and
needs replacement.
Be sure to set the
switch to OFF to
extend the battery life
when not in use.
0.034 watts = 34 mW
2.987 watts = 2987 mW
Energy is measured in Joules. Energy is
basically power x time and one Joule is equal
to one watt-second. For example.
21 Joules = 21 watt-seconds or the amount of
power used in 21 seconds.
RPM is a measure of the rotational speed
of the wind turbines blades. RPM is used
in experiments to show how the above
parameters are affected by higher or lower
RPM rates. 3
Input and Output Terminals
Common Equations
The Renewable Energy Monitor uses the
following common equations internally to
measure
and compute voltage, current,
resistance and power.
V = I * R where V = voltage
I = current
R = Resistance
There are two sets of Input and Output
P = V * I where P = power
terminals. The Input terminals are on the
V = voltage
left side and the Output terminals are on the
I = current
right side of the unit. The Red terminal is +
or positive while the Black terminal is – or
J = P * T where J = Joules
negative. You must observe the correct polarity
T = time in sec
when hooking up batteries, solar panels, wind
turbines or fuel cells to the terminals.
Operating Tips
Specifications
Electrical Fundamentals – Refer to the REES
Experiment Manual for an explanation of the
The Renewable Energy Monitor will measure
fundamental electrical parameters such as
electrical parameters up to the following limits:
voltage, current, power, resistance and more.
Voltage:
0 - 28 VDC
Measuring Resistance – A voltage must be
Current:
0 - 1 amp DC
applied across the Input terminals in order to
Power:
0 - 28 watts
measure the resistance attached to the Output
Resistance: 0 - 999 ohms
Energy:
0 - 65535 Joules
RPM:
200 - 2500
terminals.
Also, the resistance will vary depending on the
voltage and current produced in the circuit. The
Note: very low and very high RPM speeds
Renewable Energy Monitor uses Ohm’s Law
cannot be accurately measured. Even though
to compute resistance, so any small variations
the wind turbine may be spinning the electronic
in voltage and current will affect the resistance
circuitry is only capable of measuring a certain
reading.
range of RPM speeds. Low voltage outputs
from the WindPitch wind turbine may also affect
RPM accuracy.
Software
4
Software
Connecting
Software for Windows PCs (XP, Vista and
Once the software is displayed on your
Windows 7) is provided to expand the
computer screen, click the Connect icon on
operational capabilities of the Renewable
the bottom-right of the screen. It will turn from
Energy Monitor. MACs are currently not
red to green to show that it is connected to the
supported. Connect the USB cable between
Renewable Energy Monitor.
the Monitor and your computer for vivid
graphical displays of data.
Installing the Software
Insert the supplied CDROM disc into your
computer and follow the directions in order to
load the software.
Tip:
Nothing will happen unless you
click the Connect icon and the number
Running the Software
After the software is installed
on your computer a Desktop
icon like the one here is
displayed. Double-click the
below it represents the com port attached
to the Renewable Energy Monitor.
Refer
to the “More Details” section for a further
explanation.
Plot Area
icon to launch the software.
The plot area displays the line plots of voltage,
Tip:
Always attach the USB cable between
the Renewable Energy Monitor and the
computer BEFORE you click on the REM
icon to start the software. Then click on the
Connect icon once the software is visible on
your computer.
5
current, power, resistance and RPM – all at the
same time. This data is updated five (5) times
a second from the Renewable Energy Monitor
so it always represents the latest information
coming from your experiments.
Color-Coded Plotting Lines
Joules and RPM Display
Each data plot is in a different color in order to
Joules is a measure of energy (power x
make it easy to see what is being measured.
time). It is equivalent to a watt-second
or the number of watts generated in one
Green- Voltage in volts
second and shows how much energy the
Blue - Current in amps
experiment is generating.
Red
Power in watts
-
Black -
Resistance in ohms
RPM is displayed as RPM x 100 in order to
Pink
RPM x 100
better fit in the plot area. For example an
-
RPM reading of 1436 is shown as 14.36.
Adjusting the Plot Scale
You can change the plot
scale to match the incoming
data from the Renewable
Energy Monitor by using the
Screen Snapshots
Plot Scale icon. The vertical
Yo u c a n c a p t u r e
+ and – control the vertical
scale while the horizontal +
and – control the time scale. Clicking the reverse
arrow icon (bottom-left) clears the screen and
allows a fresh plot of data to be displayed.
a snapshot of the
screen at anytime
by clicking the top
Screen Capture
icon. Then click the
Screen View icon
below it to see what
you captured.
Meters and LED On-Off buttons
Four vertical meters display the voltage, current,
power and resistance along with corresponding
numbers at the bottom.
Clicking any of the LED
buttons at the bottom of each meter turns the
corresponding plot line ON or OFF. The LEDs are
color coded to match the plot lines to make it easier
to understand.
6
Data Recording and Playback Play and Pause
The built in recording feature is like recording
Click the (triangle) Play icon to begin
a TV show for later playback except that you’re
replaying the recorded data. The Play
using data coming from the Renewable Energy
icon will change from white to green during
Monitor instead. The Recording and Playback
playback.
controls are shown here.
You can Pause the playback by clicking again
on the (triangle) Play icon. It will change from
a green triangle to a green double line. Click
the Pause icon again to resume playback.
The top three controls are…
Recording Counter
Record
Play – Pause
Stop
Recording Data
The Recording Counter indicates the number
of data samples that are (or have been)
recorded for later playback. It can range from
1 to 999.
Click the (round) Record icon to start recording
data. The icon will change to a brighter red
color.
Stop Recording
Click the (square) Stop icon when you’re done
recording.
The Stop icon will momentarily
change color from white to green – then back to
white again. The red Recording icon will also
turn off and the plot will go back to real time.
7
The Trash Icon
Click the Trash icon to erase all the recorded
data. This will also reset the time on the plot
area back to 0.0 minutes. You can push the
Trash icon anytime; just make sure you really
want to erase all the recorded data.
Sample Rate
Zooming
You can control the rate at which you sample
While plotting data in real time or replaying
data by clicking the + or – icons on the Sample
data after recording, you can zoom in on
Rate indicator.
a portion of the data at anytime. Simply
position the mouse cursor over the area
you want to zoom in to and click the left
mouse button.
The default is ALL which means that all
Then release the left
mouse button to execute the zoom feature.
data from the Renewable Energy Monitor is
recorded. Clicking the minus icon will slow
the sample rate to the following:
8
More Details ……………..
The Connect Icon
This section gives you more in depth
Before any plots can occur, the graphic software
information on important topics of interest
must connect with the Renewable Energy
(and possible confusion).
Monitor that is transmitting data.
Normally the number just below the Connect icon
is the right com port number; however, sometime
The Stop and Trash Icons
The Trash and Stop icons are the most
important controls for plotting.
you must select a different number to make the
plotting work.
To do so, first select the
correct Comm port number.
Click on the arrow next
to the number to see if
a higher number Comm
port is displayed. If so,
it’s probably the one to
use. When in doubt, find
If plotting seems to stop or not do what you
want it to do, it may be because the Stop
icon was not clicked. Make sure to click
the correct Comm port on your PC by going to
Control Panel -> System -> Hardware Manager
-> Device Manager then click on Comm port.
the Stop icon after each recording.
Since you are using a USB connection rather than
The Trash icon not only erases all the
number is not dependent on hardware so much,
recorded data, it also controls the time
scale on the plot area. Click the Trash icon
the traditional RS-232 connection, the Comm port
but rather on software settings in the Control
Panel of the Windows operating system.
to reset the (horizontal) time scale to start
at 0.0 minutes again. When in doubt, click
both of them to get back to normal plotting.
When correct, the Connect
icon will show that the
connection is made. If the
The Recycle Icon
Click the Recycle
icon to set the plot
scales back to
default settings.
9
Comm port is still not correct
an error message will be
displayed, which is usually
due to the Comm port already
in use by another Windows
application.
Screen Capture and View Icons
An important feature of the software is its ability to
capture a snapshot of the screen at anytime. This
way you can save important images including plots
and meter data for later review.
For example, to take a snapshot of
the entire scree click the top Screen
Capture icon – the one with the
camera.
To view the captured snapshot, click
the Screen View icon – the one with
the magnifying glass.
All the snapshots are saved to the computers hard
disk. Just look under C:/Desktop/ Documents/
Horizon where you will find a listing similar to this.
Each snapshot is labeled REM along with the date
and time it was captured, so it should be easy to
locate using the Search function.
www.fuelcellstore.com
[email protected]
(979) 703-1925
10
FCJJ-24_REM_UM_V1.1_EN