1
Cedar User Manual
Copyright © 2015 Custom Instrumentation Services Corporation. All rights
reserved.
This document is proprietary to Custom Instrumentation Services Corporation.
No part of this manual may be copied or reproduced in any form, nor can its
contents be revealed in any manner or to any person except to meet the purpose
for which it was delivered, without prior written approval of Custom
Instrumentation Services Corporation.
The screen representations, data, and other figures used as examples herein are
fictitious.
The information in this document applies to Cedar version 5 or greater and is
subject to change. Custom Instrumentation Services Corporation reserves the
right to make changes to any part of the product herein to improve its function or
design. Revisions and updates may be issued from time to time to document
changes and/or additions.
Cedar is a trademark of Custom Instrumentation Services Corporation.
All other trademarks, products, or services mentioned in this document are
trademarks or registered trademarks of their respective holders.
Custom Instrumentation Services Corporation
7841 S. Wheeling Ct.
Englewood, CO 80112
Tel: (303) 790-1000
Fax: (303) 790-7292
Document generated February 11, 2015.
Table of Contents
Chapter 1: Introduction To Cedar ..................................................................... 1
Cedar Applications............................................................................................ 2
Cedar Databases .............................................................................................. 3
Data Points ....................................................................................................... 4
Monitor Codes .................................................................................................. 5
Process Codes ............................................................................................... 10
Alarm Categories ............................................................................................ 11
Alarm Severity Levels ..................................................................................... 12
Cedar5.ini File ................................................................................................ 13
Historical Data Retrieval (HDR) ...................................................................... 15
Chapter 2: Data Monitor .................................................................................. 17
Data Monitor Alarms ....................................................................................... 18
Data Monitor Facility-Specific Windows .......................................................... 21
Data Monitor Giant Numbers .......................................................................... 22
Data Monitor Trends ....................................................................................... 25
Data Monitor Bar Graphs ................................................................................ 29
Data Monitor Calibration Checks Window ....................................................... 34
Auto Calibration Checks ................................................................................. 36
Auto Calibration Checks - Suggested Configurations...................................... 40
Data Validation for 40 CFR 75 Calibration Checks.......................................... 44
Data Monitor Settings ..................................................................................... 46
Data Monitor I/O Auditing................................................................................ 49
Data Monitor File Menu .................................................................................. 52
Data Monitor View Menu................................................................................. 53
Data Monitor Tools Menu................................................................................ 54
Data Monitor Options ...................................................................................... 55
Data Monitor Options: General ....................................................................... 56
Data Monitor Options: Alarms - Visual ............................................................ 58
Data Monitor Options: Alarms - Audible .......................................................... 60
Data Monitor Options: Alarms - Acknowledgement ......................................... 61
Data Monitor Options: Alarms - Displayed Units ............................................. 63
Data Monitor Options: Alarms - Send Email .................................................... 64
Chapter 3: Report Generator........................................................................... 65
Hourly Reports................................................................................................ 68
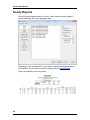
Daily Reports .................................................................................................. 69
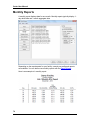
Monthly Reports ............................................................................................. 70
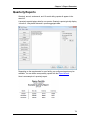
Quarterly Reports ........................................................................................... 71
Semiannual Reports ....................................................................................... 72
Annual Reports ............................................................................................... 73
Cedar User Manual
12-Month Rolling Reports ............................................................................... 75
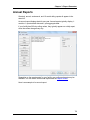
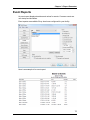
Event Reports ................................................................................................. 77
Calibration Check Reports .............................................................................. 79
Excess Emissions Reports ............................................................................. 81
CEMS Downtime Reports ............................................................................... 84
Conflicts in Excess Emission and CEMS Downtime Reports .......................... 87
Alarm Reports................................................................................................. 88
Audit Reports .................................................................................................. 90
Audit Reports: 1-Hour and 1-Minute ............................................................... 91
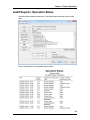
Audit Reports: Operation Status ..................................................................... 95
Audit Reports: I/O Audits ................................................................................ 97
CGA/Linearity Check Reports ....................................................................... 100
Opacity Calibration Error Test Reports ......................................................... 102
CGT and Calibration Drift Test Reports (Canada) ......................................... 103
Settings Reports ........................................................................................... 104
Report Comments......................................................................................... 106
Auto Reports................................................................................................. 107
Configuring Auto Reports.............................................................................. 108
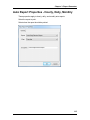
Auto Report Properties - Hourly, Daily, Monthly ............................................ 115
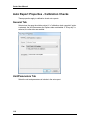
Auto Report Properties - Calibration Checks................................................. 116
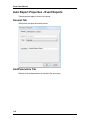
Auto Report Properties - Event Reports ........................................................ 118
Auto Report Properties - Excess Emissions .................................................. 120
Auto Report Properties - CEMS Downtimes.................................................. 122
Auto Report Properties - Alarms ................................................................... 124
Report Wizard............................................................................................... 126
Report Wizard: Create Custom Report ......................................................... 127
Report Wizard: Modify Report ....................................................................... 140
Report Wizard: Duplicate Report .................................................................. 142
Report Wizard: Delete Report ....................................................................... 145
Report Generator Options............................................................................. 147
General......................................................................................................... 148
Facility Info ................................................................................................... 149
Data Validity ................................................................................................. 150
Auto Reports................................................................................................. 152
Calibration Checks........................................................................................ 154
Excess Emissions and CEMS Downtimes .................................................... 156
Chapter 4: Data Editor ................................................................................... 159
Data Editor File Menu ................................................................................... 160
Edit/View Data Menu .................................................................................... 161
Alarm Log ..................................................................................................... 163
View Calibration Checks ............................................................................... 164
Graph Calibration Checks ............................................................................. 166
Edit Data Points ............................................................................................ 171
vi
Chapter 1: Introduction To Cedar
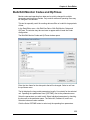
Bulk Edit Monitor Codes and OpTimes ......................................................... 175
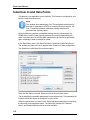
Substitute Invalid Data Points ....................................................................... 178
Rebuild Data Points ...................................................................................... 180
Edit Excess Emissions and CEMS Downtimes ............................................. 183
Rebuild Excess Emissions and CEMS Downtimes ....................................... 186
Edit CGAs and Linearity Checks ................................................................... 188
Edit Opacity Calibration Error Tests .............................................................. 193
Edit CGTs and Calibration Drift Tests (Canada) ........................................... 194
Data Editor Settings ...................................................................................... 195
Analyzer Information ..................................................................................... 198
Data Editor Database Utilities Menu ............................................................. 199
CiSCO Menu ................................................................................................ 200
7-Day Calibration Error Test ......................................................................... 201
Chapter 5: Database Backup & Utility .......................................................... 207
Database Tables .......................................................................................... 208
Daily Automatic Backup ................................................................................ 209
Backup Databases........................................................................................ 211
Restore Data ................................................................................................ 212
Restore Configuration ................................................................................... 214
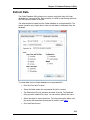
Extract Data .................................................................................................. 215
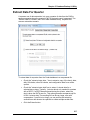
Extract Data For Quarter............................................................................... 217
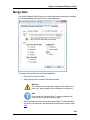
Merge Data ................................................................................................... 219
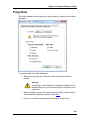
Purge Data ................................................................................................... 221
Chapter 6: Cedar Security ............................................................................. 223
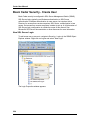
Basic Cedar Security - Create User .............................................................. 224
Basic Cedar Security - Database Roles ........................................................ 228
Advanced Cedar Security - Accounts............................................................ 229
Advanced Cedar Security - Permissions ....................................................... 233
Delete User................................................................................................... 236
Glossary ......................................................................................................... 243
vii
Chapter 1: Introduction To Cedar
What is Cedar?
Cedar is a software package for data acquisition and reporting. It is designed
primarily for use with continuous emission monitoring systems (CEMS).
Cedar runs on a Microsoft Windows-based computer. The computer and
software together are called a Data Acquisition System (DAS) or Data Acquisition
and Handling System (DAHS).
Cedar is a product of Custom Instrumentation Services (CiSCO).
Cedar User Manual
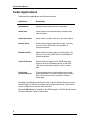
Cedar Applications
Cedar has these applications and Windows services.
Application
Description
Data Monitor
Displays real-time data, alarms, and graphs.
Data Editor
Allows users to view and edit data. Provides many
utility functions.
Report Generator
Allows users to create, view, print, and save reports.
Backup Utility
Allows users to backup and restore data. This utility
runs only on the DAS, and is not available on
remote computers.
Database Utility
Allows users to extract (copy) and merge data. This
utility runs only on the DAS, and is not available on
remote computers.
Cedar I/O Service
Collects real-time data from the CEMS and other
devices. Runs as a Windows service on the DAS.
This service must be running for Cedar to collect
data.
Cedar Data
Recorder Service
Performs calculations on data, and stores the data
in the databases. Runs as a Windows service on the
DAS. This service must be running for Cedar to
collect data.
By default, the Data Recorder Service runs under the Network Service account,
and the Cedar I/O Service runs under the Local Service account. The services
can be configured to run under other accounts.
Microsoft SQL Server is installed on the DAS computer. The SQL Server service
must be running for Cedar to collect data.
2
Chapter 1: Introduction To Cedar
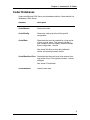
Cedar Databases
Cedar uses Microsoft SQL Server as its database platform. Cedar defines five
databases in SQL Server.
Database
Description
Cedar5Alarms
Stores alarm data.
Cedar5Config
Stores user settings and the facility-specific
configuration.
Cedar5Data
Stores data that must be retained for a long period
of time (several years). This typically includes 1hour averages, 6-minute opacity, and all averages
that are longer than 1 minute.
Also stores QA data, such as daily calibration
checks and quarterly linearity checks.
Cedar5DataShortTerm Stores data that does not have to be retained for a
long period of time. This typically includes 1-minute
averages.
Also stores I/O audit data.
Cedar5Realtime
Stores current data.
3
Cedar User Manual
Data Points
Cedar's primary purpose is to acquire, store, and display data. Each data point
may contain two pieces of information:
•
The value is the numeric value of the data point.
•
The monitor code indicates the validity of the data point.
The value and monitor code are stored together as a single data point.
Most parameters (tags) store both values and monitor codes. For example, a
NOx ppm data point may have a value of 4.6 ppm, with a monitor code of 00
(Valid).
Operating time parameters (tags) only store values; they do not have monitor
codes. The values represent hours as a decimal number. For example, 0.25
represents 15 minutes, 1.00 represents 60 minutes, and 24.00 represents a full
day (24 hours).
Process codes are also stored as simple values, with no monitor codes.
Warning
Use caution when editing data. Values and Monitor Codes should
only be edited when there is a sound technical basis for the change.
Editing data without valid justification violates environmental
regulations.
4
Chapter 1: Introduction To Cedar
Monitor Codes
Monitor Codes indicate the validity of a data point. Every monitor code is in one
of these three categories:
•
Valid: the unit or process is operating and the data is valid.
•
Invalid: the unit or process is operating and the data is not valid.
•
Offline: the unit or process is not operating.
Cedar Monitor Codes
Monitor
Code
Description
Validity
00
Normal
Valid
11
Pollutant analyzer out of control
Invalid
12
Diluent analyzer out of control
Invalid
13
Process offline
Offline
14
Calibration check
Invalid
15
Preventative maintenance
Invalid
16
Pollutant analyzer malfunction
Invalid
17
Diluent/ancillary analyzer malfunction
Invalid
18
DAHS malfunction (also used as the default monitor
code for invalid values)
Invalid
19
Sample handling system malfunction (dryer fault, etc.)
Invalid
20
Corrective maintenance
Invalid
21
Other
Invalid
22
I/O communications problem
Invalid
23
Sample point not selected; process offline (used for
Offline
5
Cedar User Manual
timeshare systems)
6
25
Backflush
Invalid
26
Value is calculated or derived from substituted data
Valid
27
ODBC data not available (data missing in an external
database)
Invalid
28
Formula input out-of-range
Invalid
29
Calibration check; process offline
Offline
30
Sample point not selected (used for timeshare systems)
Invalid
31
Value out-of-range
Invalid
32
Value out-of-range; process offline
Offline
33
Data not QA (for example, 26 hours passed without a
calibration check, or a linearity check is missing)
Invalid
34
Not sufficient data (used when there is insufficient data
to create an average, but creating an invalid monitor
code would be difficult or irrelevant. For example:
subpart Da and Db 30-operating-day averages)
Invalid
35
Valid data, generated by Cedar. Measured value has
been replaced with 200 % of Maximum Potential
Concentration (MPC) or 200 % of full-scale range.
Valid
36
Valid data, generated by PLC or other non-Cedar
source. Measured value has been replaced with 200 %
of Maximum Potential Concentration (MPC) or 200 % of
full-scale range. Typically used with HDR data.
Valid
37
Invalid data generated by PLC or other non-Cedar
source. Typically used with HDR data.
Invalid
38
Valid Data, generated by PLC or other non-Cedar
source. Typically used with HDR data.
Valid
39
Offline data, generated by PLC or other non-Cedar
source. Typically used with HDR data.
Offline
Chapter 1: Introduction To Cedar
40
Substituted Data: average of hour before and hour after
Valid
41
Substituted Data: average of X hours before and X
hours after, where the missing data period is X hours
Valid
42
Substituted Data: max value in the previous 30 calendar
days
Valid
43
Substituted Data: max value in the previous 365
calendar days
Valid
44
Substituted Data: max value since CEMS certification
date
Valid
45
Substituted Data: other method
Valid
46
Substituted Data: 40CFR75 initial data substitution
Valid
47
Substituted Data: 40CFR75 90th percentile
Valid
48
Substituted Data: 40CFR75 95th percentile
Valid
49
Substituted Data: 40CFR75 maximum in lookback
period
Valid
50
Substituted Data: 40CFR75 average of lookback period
Valid
51
Substituted Data: 40CFR75 maximum potential value
Valid
Note
Monitor codes 53-58, 62, 63, and 66 apply to
the South Coast Air Quality Management
District (SCAQMD) only.
53
Process offline (SCAQMD only)
Valid
54
Process offline; value below 5% of range replaced with
zero (SCAQMD 2012 - NOx only)
Valid
55
Value below 10% of range (SCAQMD only)
Valid
56
Value below 10% of range; replaced with 10% of range
Valid
7
Cedar User Manual
(SCAQMD only)
8
57
Value above 95% of range; replaced with 10% of next
certified range (SCAQMD only)
Valid
58
Value above 95% of highest certified range (SCAQMD
only)
Invalid
59
Invalid Data, flagged by user; this monitor code may not
be affected when data points are rebuilt/recalculated
Invalid
60
Data is not applicable (N/A); used for special averaging
requirements
Offline
61
Diluent cap used in formula
Valid
62
Process offline and CEMS in maintenance (SCAQMD
only)
Invalid
63
Too many partial CEMS maintenance hours in day
(SCAQMD 2012 - NOx only)
Invalid
64
CEMS in maintenance; process offline
Offline
65
Backflush; process offline
Offline
66
Value below 10% of range but is not fully quality
assured; data will be valid once it is replaced with 10%
of range and MC 56 (SCAQMD only)
Invalid
67
Sample not available (typically used with gas
chromatograph data)
Invalid
68
Data is not applicable (N/A); used for special averaging
requirements; may be redefined/renamed for sitespecific requirements
Offline
70
Realtime data is unavailable
Invalid
71
Realtime data is expired/outdated
Invalid
72
Data does not exist in database
Invalid
Chapter 1: Introduction To Cedar
73
Data does not exist in database (used for parameters
that do not store monitor codes)
Valid
9
Cedar User Manual
Process Codes
Process codes indicate the state of the unit or process relative to permit
requirements and exemptions.
Typical Cedar Process Codes
Process
Code
Description
01
Facility-specific
02
Facility-specific
03
Startup
04
Shutdown
05
Facility-specific
06
Facility-specific
07
Facility-specific
08
Normal (no special permit conditions are in effect)
09
Facility-specific
13
Process Offline
Process codes 01, 02, 05, 06, 07, and 09 are reserved for facility-specific permit
requirements or exemptions. All process codes except 08 and 13 may be
redefined for facility-specific requirements.
10
Chapter 1: Introduction To Cedar
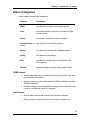
Alarm Categories
Cedar supports several alarm categories:
Category
Description
CEMS
Are related to emission monitoring equipment.
Limit
Are usually related to emission limits defined by the
source's permit.
Status
Are usually informational status messages.
Communication (or
Comm)
Are related to communication failures.
Backup
Are related to automatic daily database backup.
Config
Are related to user settings.
DAS
Are related to conditions that may affect how the
DAS operates.
Security
Indicate changes to security settings within Cedar.
CEMS alarms
•
Serious alarms alert you to conditions that may cause invalid data, such
as a calibration check failure.
•
Warning alarms alert you to other abnormal CEMS conditions, including
CEMS maintenance.
•
Info alarms display other informational messages such as whether a unit
is online or a calibration check is in progress.
Limit alarms
•
Serious alarms indicate that a permit limit has been exceeded.
•
Warning alarms indicate that the unit could exceed a permit limit.
11
Cedar User Manual
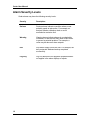
Alarm Severity Levels
Cedar alarms may have the following severity levels:
12
Severity
Description
Serious
Serious alarms Indicate a condition where a user
probably needs to take action. For example, an
analyzer failed a calibration check or a unit
exceeded an emission limit.
Warning
Warning alarms indicate abnormal or undesirable
conditions, or that the user may need to take action
to prevent a potential problem. For example, a
value may be above an alarm setpoint.
Info
Info alarms simply inform the user. For example, the
daily automatic database backup completed
successfully.
Log only
Log only alarms are for diagnostic purposes and do
not appear in the alarm displays or reports.
Chapter 1: Introduction To Cedar
Cedar5.ini File
The Cedar5.ini file contains basic information that Cedar needs to operate, such
as folder paths and database connection strings. This file is usually located in
C:\Program Files (x86)\Ciscocems\Cedar5. This file is configured when Cedar is
installed, and is rarely modified.
Below are some of the entries in the INI file.
SiteID
This entry identifies the Cedar configuration. This is typically the name of the site.
Facilities with multiple DAHS computers will have multiple configurations, each
with a different Site ID. The Site ID is limited to 10 characters.
DahsComputerName
This is the name of the DAHS computer. Cedar uses this name to determine
whether an application is running on the DAHS or a remote computer.
DahsDescription
This entry is optional and can provide a description of the DAHS.
Database connection strings
Cedar uses the database connection strings to connect to the Cedar databases.
A full discussion of connection string options is beyond the scope of this manual.
Cedar uses the SQL Native Client from Microsoft for database access. The
Provider value varies with the version of SQL Server.
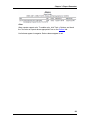
SQL Server
version
SQL Server 2008
SQL Server 2008
R2
SQL Server 2012
SQL Server 2014
CedarDir
Provider value
SQLNCLI10
SQLNCLI10
SQLNCLI11
SQLNCLI11
This is the main Cedar folder. Cedar creates additional subfolders in this folder.
LogsDir
Cedar creates log files in this folder. Cedar creates additional subfolders in this
folder.
BackupDir
Cedar creates daily backup files in this folder. See the section on daily automatic
backup for more details.
13
Cedar User Manual
Administrative rights to modify Cedar5.ini
If Windows User Account Control (UAC) is enabled, administrative rights are
required to modify files in the Program Files folder. Without administrative rights,
you may view Cedar5.ini in Notepad, but you may not modify it.
To run Notepad with administrative rights, right-click on the Notepad icon, and
click "Run as administrator".
14
Chapter 1: Introduction To Cedar
Historical Data Retrieval (HDR)
For most CEMS where the CEMS PLC has been supplied by CiSCO, the PLC
also functions as a data logger to store a limited number of data points. This
historical backup data allows Cedar to acquire data for short periods when Cedar
is not running. This is useful for DAS maintenance, such as software upgrades
and system reboots.
Newer PLCs with large memory capacities store 1-minute data, usually for 7
days. Older PLCs with less memory may store 1-hour averages for up to 7 days.
The actual amount of data stored varies with the system configuration.
The HDR process automatically runs every night shortly after midnight.
If the PLC provides 1-minute data, the HDR process also recalculates 1-hour
averages.
The HDR process automatically rebuilds excess emissions and CEMS
downtimes for the previous day.
Replacement conditions
HDR replaces existing data only when one or more of the following
conditions are true:
•
The existing value is Null and the existing monitor code is 18,
22, 70, 71, 72 or 73. This includes the case where the data
does not exist in the database.
•
The existing value is Null and the existing monitor code is
valid.
•
The existing data has monitor code 18, 22, 70, 71, 72 or 73,
and the historical data is valid or offline.
HDR does not replace existing process code data in the database.
15
Chapter 2: Data Monitor
Overview
The Data Monitor displays real-time data, alarms, and graphs. You can perform
these common functions in the Data Monitor.
•
View/Acknowledge alarms
•
View calibration checks
•
Change facility-specific settings
•
Select facility-specific windows
•
Set application options
•
Display giant numbers
•
Display real-time graphs of data
•
Display bar graphs
•
Start/stop I/O audits
The Data Monitor also provides links to the Data Editor and the Report
Generator.
Cedar User Manual
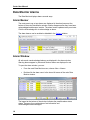
Data Monitor Alarms
The Data Monitor displays alarms several ways.
Alarm Banner
The most recent one or two alarms are displayed in the alarm banner at the
bottom of the main Data Monitor window. Alarms disappear after they have been
acknowledged and become inactive. The alarm banner updates twice per minute.
Click the Acknowledge link to acknowledge an alarm.
The alarm banner can be enabled or disabled in the Options window.
Alarm Window
All active and unacknowledged alarms are displayed in the alarm window.
Warning alarms appear in yellow and Serious alarms are displayed in red.
To open the alarm window, you can:
•
From the main Data Monitor menu, choose View > Alarms.
•
Double-click the alarm count in the lower left corner of the main Data
Monitor window.
The legend at the bottom of the window indicates the possible alarm status
states. There are four combinations of active/inactive and
acknowledged/unacknowledged.
18
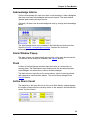
Chapter 2: Data Monitor
Acknowledge Alarms
Click the Acknowledge link next to an alarm to acknowledge it. Alarms disappear
after they have been acknowledged and become inactive. The alarm window
updates approximately twice per minute.
Optionally, all alarms can be acknowledged at once by clicking the Acknowledge
button.
The Acknowledge button can be enabled in the Data Monitor Options window.
Select the Alarms - Acknowledgement page. Uncheck the "user must
acknowledge each alarm individually" box.
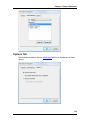
Alarm Window Popup
The alarm window can automatically pop up when a new alarm becomes active.
This feature can be enabled or disabled in the Options window.
Flash
Portions of the Data Monitor windows flash when there is a new serious or
warning alarm. The Data Monitor stops flashing once the new alarm has been
acknowledged. Info alarms do not need to be acknowledged.
The flash colors are typically red for serious alarms, yellow for warning alarms,
and magenta for communication alarms. The colors can be changed in the
Options window.
Active Alarm Count
The status bar in the lower left corner of the main Data Monitor window displays
the number of alarms that are currently active. In this example, the Data Monitor
shows "4 Active Alarms".
19
Cedar User Manual
Audible Sound
The Data Monitor can play a sound when there is an unacknowledged serious or
warning alarm. The computer must have audio capability, and the audio must not
be muted. The sound can be configured in the Options window.
Alarm Acknowledgement with Multiple Users or
Computers
By default, alarm acknowledgement is specific to each user account. If multiple
users are running the Data Monitor using different user accounts, then each user
must acknowledge alarms. If one user acknowledges an alarm, that alarm is not
acknowledged for the other users.
If multiple users run the Data Monitor using the same account, then an alarm
acknowledgement is effective for all users sharing that account.
If you prefer that an acknowledgement by any user should acknowledge the
alarm for all users, please contact CiSCO to modify your Cedar configuration.
Cedar Data Recorder Service Restart
If the Cedar Data Recorder service is stopped and restarted, all active alarms are
deactivated. The service may be stopped and restarted when the DAS reboots,
or when a new version of Cedar is installed.
If the alarms are still active, the alarms will reappear.
20
Chapter 2: Data Monitor
Data Monitor Facility-Specific Windows
Facility-specific windows are customized for your facility.
Facility-specific windows are available from the View menu.
Check marks indicate which windows are open, even if they are minimized or
hidden. To view a hidden or minimized window, click View and the window you
wish to see.
21
Cedar User Manual
Data Monitor Giant Numbers
Giant number windows display the current values of your most critical
parameters in a large format for quick and easy viewing. The giant number
windows can be resized and repositioned anywhere on the desktop.
Giant number windows are available from the Giant Numbers menu in the Data
Monitor main window.
Adding a Giant Number Window
To add a new parameter to the list, click Giant Numbers > Add New.
The Select Parameter window appears.
Use the pull down menus to select the Unit and Parameter and click OK. A new
giant number window appears.
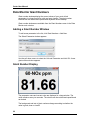
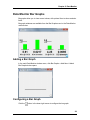
Giant Number Display
The parameter name and current value are displayed in a large window. The
value refreshes every ten seconds. The window can be resized and repositioned
as desired.
The background and text of giant numbers change according to whether the
value is good, down or invalid.
22
Chapter 2: Data Monitor
Alarm Flash
When there is an unacknowledged alarm, a bar at the bottom of each giant
number window flashes with the appropriate color.
Bringing Giant Number Windows to the Front
When a Giant Number window is opened and you select a different window, the
newly selected window may come in front. The Giant Number window may
become hidden because it is behind the newly selected window.
To bring the Giant Number windows to the front again, click Giant Numbers >
Bring to Front, or press Control+G on the keyboard.
Any open Giant Numbers windows come to the front of any other windows. Any
open trend windows and bar graph windows also come to the front. If you select
a different window, the Giant Numbers may move behind the newly selected
window again.
23
Cedar User Manual
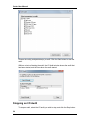
Renaming a Giant Number Window
In the main Data Monitor window menu, click Giant Numbers > Rename/Delete.
A window lists all the giant number windows that have been created. Highlight
the name of a giant number window in the list and click Rename. Type the new
name and click OK.
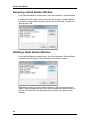
Deleting a Giant Number Window
In the main Data Monitor window menu, click Giant Numbers > Rename/Delete.
A window lists all the giant number windows that have been created.
Highlight the name of the giant number window you want to remove and click
Delete. The item disappears from the list, and is permanently deleted when you
click OK. Click Cancel to exit this window without deleting any giant number
windows.
24
Chapter 2: Data Monitor
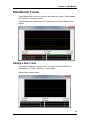
Data Monitor Trends
Trending allows you to view current and recent data as a graph. Trends update
at 10 second or 1 minute intervals.
Trend windows are available from the Trends menu in the Data Monitor main
window.
Adding a New Trend
In the main Data Monitor window menu, click either Trends > Add New (10
second data) or Trends > Add New (1 minute data).
A blank trend window opens.
25
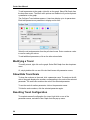
Cedar User Manual
To add a parameter to the graph, right-click on the graph. Select Edit Graph from
the drop down menu. The other menu options are disabled until you have placed
a parameter on the graph.
The Configure Trend window appears. A trend can display up to six parameters.
Each tab represents one parameter to display and its color.
Select the unit and parameter from the pull-down boxes. Enter a maximum value
to use for scaling the values.
To add additional parameters, click on the other colored tabs.
Modifying a Trend
To modify a trend, right click on the graph. Select Edit Graph from the drop down
menu.
Or, simply double-click on one of the six black boxes with parameter names.
Show/Hide Trend Scale
To show the numbers on the scale, click a parameter name. The scale on the left
side of the graph displays the numbers corresponding to the scale of the selected
parameter. The scale color matches the color of the selected parameter.
To see the scale of another parameter, click on the parameter name.
To hide the scale numbers, click the selected parameter again.
Resetting Trend Configuration
To complete erase all configuration for a trend, right click on one of the
parameter names, and select Clear Graph from the pop-up menu.
26
Chapter 2: Data Monitor
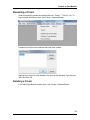
Renaming a Trend
Cedar automatically names the trend windows as "Trend 1", "Trend 2", etc. To
give a trend a descriptive name, click Trends > Rename/Delete.
A window lists all the trend windows that have been created.
Highlight the name of a trend window in the list and click Rename. Type the new
name and click OK.
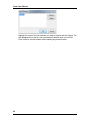
Deleting a Trend
In the main Data Monitor window menu, click Trends > Rename/Delete.
27
Cedar User Manual
Highlight the name of the trend window you want to remove and click Delete. The
item disappears from the list, and is permanently deleted when you click OK.
Click Cancel to exit this window without deleting any trend windows.
28
Chapter 2: Data Monitor
Data Monitor Bar Graphs
Bar graphs allow you to view current values, with optional lines to show emission
limits.
Bar graph windows are available from the Bar Graphs menu in the Data Monitor
main window.
Adding a Bar Graph
In the main Data Monitor window menu, click Bar Graphs > Add New. A blank
Bar Graph window opens.
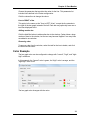
Configuring a Bar Graph
Click the
button in the lower right corner to configure the bar graph.
29
Cedar User Manual
Window name
Enter a descriptive title for the bar graph window.
Unit and Parameter
Select the unit and parameter that you want to display in the bar graph.
The parameter list includes both real-time values and one-minute values.
Enter the scale for the bar graph.
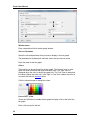
Colors
Three colors can be configured for the bar graph. The "normal" color is used
when the value is between the upper and lower limits. The "high" color is
displayed when the value is above the upper limit. The "low" color is used when
the value is below the lower limit. If the "high" or "low" limit is blank, that color is
not used. Also see the example below.
Click the colored boxes to change the colors.
Line to LEFT of bar
Check the Visible box to enable the bar graph to display a line to the left of the
bar graph.
Enter a title (name) for the line.
30
Chapter 2: Data Monitor
Choose the parameter that provides the value for the line. This parameter list
includes limits defined in the Cedar configuration.
Click the colored box to change the colors.
Line to RIGHT of bar
This option is the same as the "Line to LEFT of bar", except the line extends to
the right of the bar graph instead of the left. Each bar may optionally have one or
two lines displayed with it.
Adding another bar
Click the Add Bar button to add another bar to the window. Cedar allows a large
number of bars in the window, but the text may become illegible if too many bars
are added to one window.
Removing a bar
To remove a bar from the window, select the tab for the bar to delete, and click
the Remove Bar button.
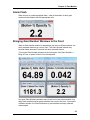
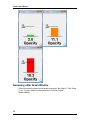
Color Example
The bar graph color can be configured to change with "normal", "high", and "highhigh" conditions.
In this example, the "normal" color is green, the "high" color is orange, and the
"high-high" color is red.
The bar graph color changes with the value.
31
Cedar User Manual
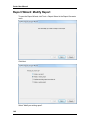
Renaming a Bar Graph Window
Cedar automatically names the bar graph windows as "Bar Graph 1", "Bar Graph
2", etc. To give a window a descriptive name, click Bar Graphs >
Rename/Delete.
32
Chapter 2: Data Monitor
A window lists all the bar graph windows that have been created.
Highlight the name of a bar graph window in the list and click Rename. Type the
new name and click OK.
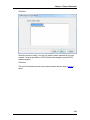
Deleting a Bar Graph Window
In the main Data Monitor window menu, click Bar Graphs > Rename/Delete.
Highlight the name of the bar graph window you want to remove and click Delete.
The item disappears from the list, and is permanently deleted when you click OK.
Click Cancel to exit this window without deleting any bar graph windows.
33
Cedar User Manual
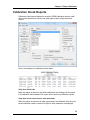
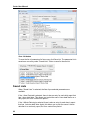
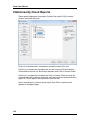
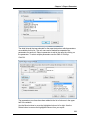
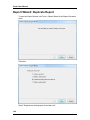
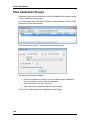
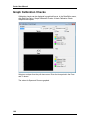
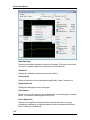
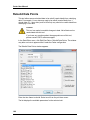
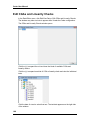
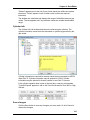
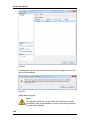
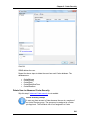
Data Monitor Calibration Checks Window
In this window, you can view recent CEMS calibration checks.
In the Data Monitor main window menu, click View > Calibrations. The
Calibration Checks window appears.
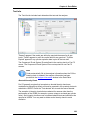
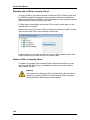
Select Cals
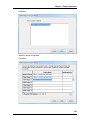
Click the Select Cals button. The Select Cal Data window opens.
The following options are available:
•
Enter the time period you wish to view. Select a specific parameter, or
view all parameters.
•
View all calibration checks in the last 1-72 hours.
•
View most recent calibration checks (Cedar looks back up to 14 days).
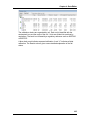
Click OK to view the calibration checks.
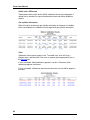
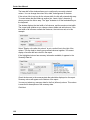
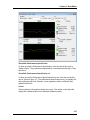
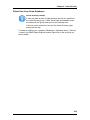
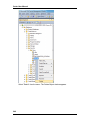
The calibration checks are organized into groups by unit. Each unit is identified
with the smokestack icon and the name of the unit.
34
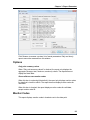
Chapter 2: Data Monitor
Units are divided into sections by regulations. The book icon is used to depict
regulation type followed by the name of the regulation such as 40CFR60 or
40CFR75.
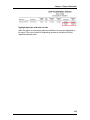
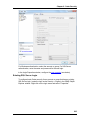
Each line displays the results of the calibrations for each parameter calibrated.
A blue check mark on the left edge indicates a passed calibration. A red “X”
indicates a failed calibration. The Results column gives a more detailed
explanation of the fail status.
35
Cedar User Manual
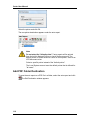
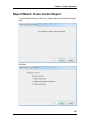
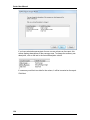
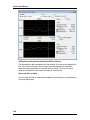
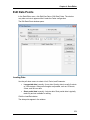
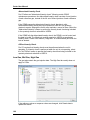
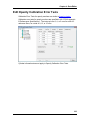
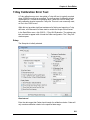
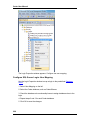
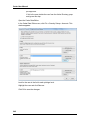
Auto Calibration Checks
In the Data Monitor main window menu, click Tools > Auto Calibration Checks.
This feature is available if it has been configured for your facility.
The CEMS automatically runs calibration checks at the same time every day.
This window provides additional options for when calibration checks should be
run.
See suggested configurations for this window.
Calibration checks are configured separately for each sample train. The left pane
allows you to select each sample train. When you make a change in the right
pane, the buttons in the left pane are disabled until you click either Save or
Cancel.
Disable automatic calibration checks
Check this box to disable all automatic calibration checks in the CEMS.
36
Chapter 2: Data Monitor
Daily Calibration Checks
Perform calibration checks at (time)
This is the normal time when the CEMS runs a calibration check every day.
Skip the daily cal check if the unit is offline at this time
If this box is checked, Cedar will skip the daily calibration check if the unit is
offline at the normal daily cal time. Approximately 10 minutes before the normal
daily cal time, Cedar checks whether the unit is offline. Cedar skips the
calibration check by temporarily adding one hour to the normal cal time setting,
and then changing it back after the normal daily cal time has passed.
Note
If the unit starts operating after Cedar has decided to skip the daily
calibration check but before the normal daily cal time, Cedar may not
be able to prevent the calibration check from being skipped even
though the unit is online.
Skip the daily cal check if an online cal check has already run during the
day
If this box is checked, Cedar will skip the daily calibration check if online
calibration checks have already been performed earlier in the day for all
analyzers in the sample train. This feature is intended to minimize unnecessary
online calibration checks.
Approximately 10 minutes before the normal daily cal time, Cedar checks
whether online calibration checks have already been performed for the day.
Cedar skips the calibration check by temporarily adding one hour to the normal
cal time, and then changing it back after the normal daily cal time has passed.
Calibration Checks At Unit Startup
These options may be used to start calibration checks after the unit begins
operating.
Note
These settings do not prevent the CEMS from performing a
calibration check at the normal cal start time.
(For example, if the unit is in startup at the normal cal start time,
most CEMS will start a cal check. Some CEMS have logic to prevent
cals from running while the unit is starting up, or to delay a cal check
until the unit is in normal operation.)
Please contact CiSCO if you need your CEMS to prevent auto
calibration checks while the unit is starting.
37
Cedar User Manual
Do not automatically perform cal checks for unit startup
If this option is selected, Cedar will not start any additional calibration checks
following unit startup.
Perform a cal check (x) minutes after the unit begins running
If this option is selected, Cedar will start a calibration check after the unit begins
running. You can configure the delay period. The delay is calculated from the
time the unit begins running.
If the unit stops running, Cedar will not cancel the calibration check if it has
already started. If the unit stops running near the end of the delay period, Cedar
may not be able to prevent the calibration check from starting.
Perform a cal check (x) minutes after the unit enters 'normal operation'
If this option is selected, Cedar will start a calibration check after the unit
completes startup and enters "normal operation". The definition of "normal
operation" is specific to the unit. You can configure the delay period. The delay is
calculated from the time the unit enters "normal operation".
If the unit stops running, Cedar will not cancel the calibration check if it has
already started. If the unit stops running near the end of the delay period, Cedar
may not be able to prevent the calibration check from starting.
Do NOT run a 'unit startup' cal check if an online cal check has already
occurred during the day
If this box is checked, Cedar will skip the unit startup calibration check if online
calibration checks have already been performed earlier in the day for all
analyzers in the sample train. This option generally makes Cedar run a
calibration check for only the first startup in a day.
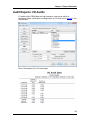
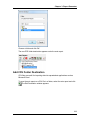
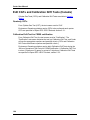
40CFR75 CEMS Using Offline Cal Checks For Data
Validation
Regulatory overview
This option is for use with CEMS that have passed an "offline calibration
demonstration" (40 CFR 75 Appendix B, section 2.1.1.2). This provision allows
the CEMS to use a combination of online and offline calibration checks to
validate data (40 CFR 75 Appendix B, section 2.1.5, and additional provisions in
the Part 75 Policy Manual). For an hour to be valid, both of these requirements
must be met:
1. The CEMS must have passed a calibration check (online or offline) within
the previous 26 clock hours (the current hour counts as one of the 26
hours). If the CEMS failed a calibration check, it is out-of-control until it
passes a calibration check.
2. The CEMS must have passed an online calibration check within the
previous 26 "unit operating hours".
38
Chapter 2: Data Monitor
Keep these points in mind:
•
An hour is considered a "unit operating hour" if the unit operates for any
portion of the hour.
•
The hour in which the most recent online calibration check completed is
considered the first hour of the 26 "unit operating hours" allowed.
•
If a CEMS fails an online calibration check, it is out-of-control until it
passes an online calibration check.
Cedar operation
When the box is checked, Cedar tracks the number of unit operating hours that
have passed since the most recent online calibration check. Cedar will start a
calibration check if the unit is online and the number of unit operating hours is
greater than 25.
The box below the checkbox indicates the number of unit operating hours since
the most recent online calibration check. The border turns red when the number
of unit operating hours is greater than 26.
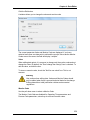
Status Indicator
The box at the bottom of the window displays the current status of this feature. It
indicates whether the unit is operating, and whether Cedar is preparing to start a
calibration check.
Buttons
Start Cal Check and Abort Cal
Click these buttons to start a calibration check, or abort a calibration check that is
currently running. These buttons are available if they have been configured for
your CEMS.
Save and Cancel
After making any changes in this window, click one of these buttons to save or
cancel the changes. When you make a change in the right pane of this window,
the buttons in the left pane are disabled until you click either Save or Cancel.
39
Cedar User Manual
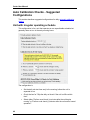
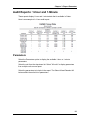
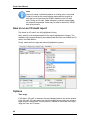
Auto Calibration Checks - Suggested
Configurations
This section describes suggested configurations for daily automatic calibration
checks.
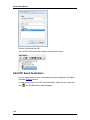
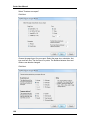
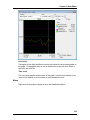
Unit with irregular operating schedule
This configuration is for a unit that operates on an unpredictable schedule but
generally does not run in the early morning hours.
The configuration is:
40
•
Set the daily cal start time early in the morning, before the unit is
expected to run.
•
Check the box for "Skip the daily cal check if the unit is offline at this
time".
•
Select either "Perform a cal check (x) minutes after the unit begins
running" or "Perform a cal check (x) minutes after the unit enters 'normal
operation'".
Chapter 2: Data Monitor
•
Check the box for "Do NOT run a 'unit startup' cal check if an online cal
check has already occurred during the day".
•
If the CEMS is subject to Part 75 and has passed on offline calibration
error demonstration, check the "40CFR75 CEMS Using Offline Cal
Checks For Data Validation" box.
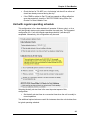
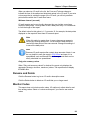
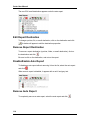
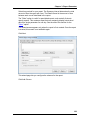
Unit with regular operating schedule
This configuration is for a base-loaded unit (operates 24 hours a day), or for a
unit that typically starts running about the same time each day. The suggested
configuration for a "unit with irregular operating schedule" (see above) is
acceptable. Alternatively, this configuration may be used.
Selecting the daily cal start time is the most important aspect of this
configuration.
•
Set the daily cal start time at a convenient time when the unit is usually in
normal operation.
The additional options below are useful for instances when the unit deviates from
its typical operating schedule.
41
Cedar User Manual
•
Check the box for "Skip the daily cal check if the unit is offline at this
time".
•
Select either "Perform a cal check (x) minutes after the unit begins
running" or "Perform a cal check (x) minutes after the unit enters 'normal
operation'".
•
Check the box for "Do NOT run a 'unit startup' cal check if an online cal
check has already occurred during the day".
•
If the CEMS is subject to Part 75 and has passed on offline calibration
error demonstration, check the "40CFR75 CEMS Using Offline Cal
Checks For Data Validation" box.
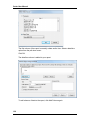
Simple configuration
This configuration will perform a calibration check at the same time each day,
whether the unit is operating or not. Cedar will not start any additional calibration
checks.
If this configuration is used, the unit operator or CEMS technician may need to
manually start additional calibration checks to meet the daily QA requirements.
The configuration is:
42
Chapter 2: Data Monitor
•
Set the daily cal start time to a convenient time when the unit is usually in
normal operation.
•
Uncheck the box for "Skip the daily cal check if the unit is offline at this
time".
•
Uncheck the box for "Skip the daily cal check if an online cal check has
already run during the day".
•
Select either "Do not automatically perform cal checks for unit startup".
•
Uncheck the box for "Do NOT run a 'unit startup' cal check if an online cal
check has already occurred during the day".
•
Uncheck the "40CFR75 CEMS Using Offline Cal Checks For Data
Validation" box.
43
Cedar User Manual
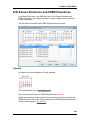
Data Validation for 40 CFR 75 Calibration Checks
Online calibration checks
Part 75 generally requires that calibration checks are performed when the unit is
online. Offline calibration checks cannot be used to validate data unless the
CEMS has passed an "offline calibration demonstration".
Prospective data validation
When the CEMS passes a calibration check, the data is prospectively validated
for the next 26 clock hours. The hour in which the calibration completes is
considered the first hour of the 26 hour period. After 26 hours, the validation
period expires, and the data is invalid until another calibration check is passed.
Calibration check failure
When a CEMS fails a calibration check, the CEMS is out-of-control from that time
forward and the data is invalid. When the CEMS passes a calibration check, it is
in-control again and the data is valid with respect to the calibration check
requirements.
When a CEMS fails a calibration check, all data prior to the completion of the
failed calibration check, and in the same hour that the calibration completed, is
invalid. For example, a calibration check begins at 8:30 and ends at 8:55. The
CEMS fails the calibration check. The data is invalid beginning at 8:00. Data prior
to 8:00 is not affected by the 8:55 calibration check.
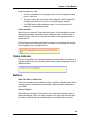
8-Hour startup grace period
A startup grace period may apply to the calibration check requirement when a
unit begins operating. There are two requirements to qualify for the startup grace
period:
1. The unit must have begun operating after being offline for at least one
entire clock hour. (For example, a unit begins operating at 5:20. To qualify
for the startup grace period, the unit must have been offline from 4:00 to
5:00.)
2. The CEMS must have passed the most recent online calibration check
within 26 clock hours of the hour in which the unit ceased operating. For
example, a unit ceases operating at 10:15 on Day 2. To qualify for the
startup grace period when the unit starts up again, the unit must have
passed an online calibration check between 9:00 on Day 1 and 10:15 on
Day 2.
If both conditions are met, then an 8-hour grace period applies, starting with the
first hour in which the unit resumes operating. Data is considered valid during the
startup grace period.
Only one 8-hour startup grace period is allowed per outage. If the unit starts up,
stops operating, and starts up again, the 8-hour startup grace period begins with
the first startup. The grace period does not begin again for the second startup.
44
Chapter 2: Data Monitor
Dual-range analyzers
When either range of a dual-range analyzer fails a calibration check, both ranges
are out-of-control (invalid) until both ranges have successfully passed a
calibration check. (See 40 CFR 75 Appendix B, section 2.1.5.1(3).)
A passed-but-expired calibration check on one range does not affect the
validation status of the other range. For example, if the high range passed its
most recent calibration check but more than 26 hours have passed, and the low
range is up-to-date on its calibration requirement, then data from the low range is
considered valid.
Regulation references
The requirements for data validation with respect to calibration checks are found
in 40 CFR 75 Appendix B, sections 2.1.1 and 2.1.5. The Part 75 Policy Manual
contains additional clarifications and examples.
45
Cedar User Manual
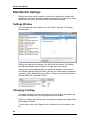
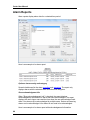
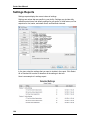
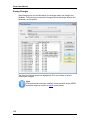
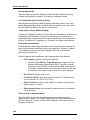
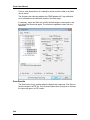
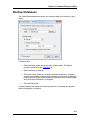
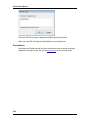
Data Monitor Settings
Settings are values that are specific to your facility. Settings may include daily
calibration start times, fuel density settings for gas and/or oil, bias factors, on-line
setpoints for fuel, water, and steam flows, and backflush intervals.
Settings Window
In the Data Monitor main window menu, click Tools > Settings. The Settings
window opens.
Settings are organized into groups in the left side of the window. The settings
and their associated values are listed in the right side of the window.
Settings with a red magnifying glass icon cannot be changed. A lock near the
icon indicates that the setting is locked. This can occur if the setting is password
protected, or if the Settings window is offline. If Cedar is unable to communicate
with the CEMS, the value reads "Offline".
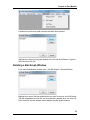
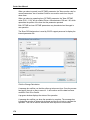
Changing a Setting
To change a setting, select the setting group on the left side of the window, and
then select the setting in the list on the right side of the window.
If there is a default value and you want to change the setting to this default value,
click Change to Default.
To enter a new value, click Change Value, or double-click on the setting in the
list.
46
Chapter 2: Data Monitor
After you enter a new value, the list displays "Updating" until the new value has
been saved.
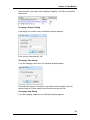
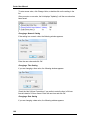
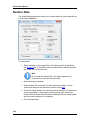
Changing a Numeric Setting
If the setting is a numeric value, the following window appears:
Enter the new value and click OK.
Changing a Time Setting
If you are changing a time value, the following window appears:
Check the Use 24-Hour Format box if you prefer to enter the time in 24-hour
format instead of 12-hour format. Enter the new time and click OK.
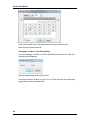
Changing a Date Setting
If you are changing a date value, the following window appears:
47
Cedar User Manual
Check the "No date" box if the setting should not have any date at all.
Enter the new time and click OK.
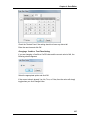
Changing a Yes/No or True/False Setting
If you are changing a Yes/No or On/Off value and the current value is Null, the
following window appears.
Select the appropriate option and click OK.
If the current value is already Yes, No, True, or False, then the value will simply
toggle when you click Change Value.
48
Chapter 2: Data Monitor
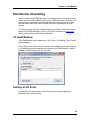
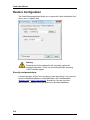
Data Monitor I/O Auditing
Cedar normally reads CEMS data every 10 seconds. When an I/O audit is active,
Cedar reads the selected parameters from the CEMS as quickly as possible. The
read frequency depends on the communication speed and the amount of other
data that Cedar must read from the CEMS, but may be as often as once per
second.
I/O auditing can be useful for troubleshooting, and analyzer response time tests
required for CEMS certification. Once an I/O audit is complete, an audit report
can be printed from the Cedar Report Generator.
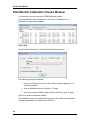
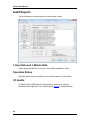
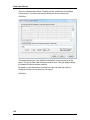
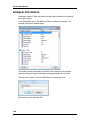
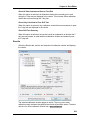
I/O Audit Window
In the Data Monitor main window menu, click Tools > I/O Auditing. The I/O Audit
window appears.
An I/O audit can be started from this window. If the CEMS control panel supports
it, I/O auditing may also be started with a button in the CEMS shelter or cabinet.
Multiple I/O audits may be active at one time.
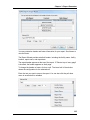
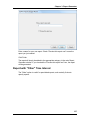
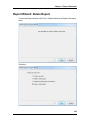
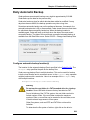
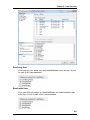
Starting an I/O Audit
Click the Start I/O Audit button to start a new audit. A window displays the
parameters that can be audited.
49
Cedar User Manual
Choose the unit(s) and parameter(s) to audit. Click the Start button to start the
audit.
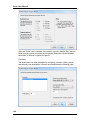
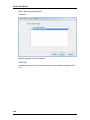
Within a minute of starting the audit, the I/O Audit window shows the audit that
has been started, and the time when the audit started.
Stopping an I/O Audit
To stop an audit, select the I/O audit you wish to stop, and click the Stop button.
50
Chapter 2: Data Monitor
If an I/O audit was started from the CEMS shelter or cabinet, it must be stopped
from that location. It cannot be stopped from this window.
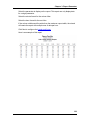
I/O Audit Status
The Data Monitor status bar indicates when an I/O audit is active.
I/O Audit Alarm
Cedar generates an alarm if an I/O audit remains active for more than 3 hours.
The alarm reappears every 20 minutes until the I/O audit is stopped.
51
Cedar User Manual
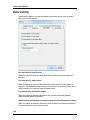
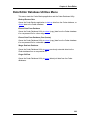
Data Monitor File Menu
The File menu has these options:
Close
Closes the current active window only. It does not close the Data Monitor.
Reports
Opens the Report Generator for displaying and printing reports.
Data Editor
Opens the Data Editor to allow viewing and/or editing of stored data.
Print Screen
Prints a screen shot of the Data Monitor window to the default printer.
Exit
Closes the Data Monitor. A dialog box asks you to confirm that you want to exit.
The exit operation may be password protected. After clicking OK in the dialog
box, you may have to enter a password.
52
Chapter 2: Data Monitor
Data Monitor View Menu
The View menu has these options:
Alarms
Opens the Alarms window.
Calibrations
Opens the Calibration Checks window, where you can view recent CEMS
calibration checks.
Facility-specific windows
The remaining windows are specific to your facility. A check mark next to the
menu item indicates that the window is open, although it may be minimized or
hidden. To view a hidden or minimized window, click View and the window you
wish to see.
53
Cedar User Manual
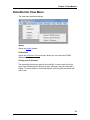
Data Monitor Tools Menu
The Tools menu has these options:
I/O Auditing
Allows you to start, stop, and change I/O auditing.
Settings
Allows you to change settings that affect the software and CEMS.
Auto Calibration Checks
Allows you to configure auto calibration checks for the CEMS. This menu item is
disabled if the monitoring system does not support this feature.
Options
Allows you to change options within the Data Monitor.
Software Support
This menu is intended to assist CiSCO software support personnel.
Make Sure Last Cals Are In Database
Forces Cedar to verify that the most recent calibration checks from the CEMS
has been stored in the database. This feature is rarely used. When the Cedar
Data Recorder Service starts running, it automatically retrieves the most recent
calibration checks from the CEMS.
Make Sure Last CGAs/Linearity Checks Are In Database
Forces the software to verify that the most recent CGA or Linearity Check data
has been stored in the database. This feature is rarely used. It is useful if Cedar
was not running when a CGA or linearity check was performed, and the data now
needs to be retrieved from the CEMS.
Make Sure Historical PLC Data Is In Database
For CEMS that store backup data in the PLC, Cedar automatically retrieves the
data every night to fill in any "gaps" in the data. Use this menu item to manually
start the historical data retrieval (HDR) process. This feature is rarely needed, but
can be useful if Cedar was not running overnight.
54
Chapter 2: Data Monitor
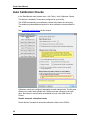
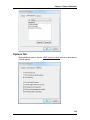
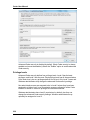
Data Monitor Options
The Options window allows you to customize certain features and provide
general information about system settings and file locations.
In the Data Monitor main window menu, click Tools > Options.
The Options window has these pages:
•
General
•
Alarms - Visual
•
Alarms - Audible
•
Alarms - Acknowledgement
•
Alarms - Displayed Units
•
Alarms - Send Email
•
Automatic Functions
55
Cedar User Manual
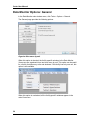
Data Monitor Options: General
In the Data Monitor main window menu, click Tools > Options > General.
The General page provides the following options:
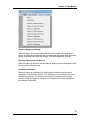
Organize View menu by unit
When this option is checked, the facility-specific windows in the Data Monitor
View menu are organized into a two-level menu by unit. This option can be useful
for a facility that has many units and windows. If the facility has only one unit, this
option is not available.
When this option is unchecked, all the facility-specific windows appear in the
main View menu.
56
Chapter 2: Data Monitor
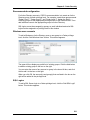
Confirm changes to settings
When this option is checked, Cedar asks the user to confirm any change to a
setting. A dialog box prompts the user to confirm that the setting value should be
saved, or the user can cancel the change. This option applies to all users.
Show free disk space in status bar
When this option is checked, the Data Monitor displays the free disk space of the
local machine in the status bar.
Use MDI environment
When this option is unchecked, the facility-specific windows can be moved
anywhere on the Windows desktop. The windows are not confined to the main
Data Monitor window. This option can be useful for computers with multiple
monitors. When this option is changed, the Data Monitor must be restarted for
the change to take effect.
57
Cedar User Manual
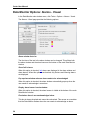
Data Monitor Options: Alarms - Visual
In the Data Monitor main window menu, click Tools > Options > Alarms - Visual.
The Alarms - Visual page provides the following options:
Alarm window font size
The font size of the text in the alarm window can be changed. This affects both
the alarm window and the alarm banner at the bottom of the main Data Monitor
window.
Show 'Info' alarms
When this option is checked, Info alarms are displayed in the alarm window and
alarm banner. When this option is unchecked, only Serious and Warning alarms
are displayed.
Pop up alarm window when an alarm needs to be acknowledged
When this option is checked, the alarm window automatically pops up when the
user needs to acknowledge a new alarm.
Display alarm banner in main window
When this option is checked, the alarm banner is visible at the bottom of the main
Data Monitor window.
Flash when there is an unacknowledged alarm
This box is always checked and cannot be unchecked. This serves as a reminder
that the Data Monitor flashes when the user needs to acknowledge an alarm.
58
Chapter 2: Data Monitor
Flash when there is a communications problem
This box is always checked and cannot be unchecked. This serves as a reminder
that the Data Monitor flashes continuously when there is a communications
failure. This flash usually indicates that Cedar cannot communicate with a CEMS
PLC.
Flash main window background for unacknowledged alarms
When this option is checked, the background of the main Data Monitor window
flashes when there is an unacknowledged alarm.
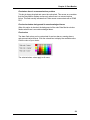
Flash colors
The alarm flash colors can be customized for serious alarms, warning alarms,
and communication failures. Click the colored box to display the available colors.
Click the color of your choice.
The selected alarm colors apply to all users.
59
Cedar User Manual
Data Monitor Options: Alarms - Audible
In the Data Monitor main window menu, click Tools > Options > Alarms - Audible.
The Alarms - Audible page provides the following options:
Play WAV files when there are unacknowledged alarms
When this option is checked, the Data Monitor can play .WAV-format audio files
when the user needs to acknowledge an alarm.
WAV file to play for unacknowledged Serious alarms
If a valid WAV file is selected in the box, the Data Monitor will play the sound
when the user needs to acknowledge a serious alarm.
WAV file to play for unacknowledged Warning alarms
If a valid WAV file is selected in the box, the Data Monitor will play the sound
when the user needs to acknowledge a warning alarm. If serious and warning
alarms both need to be acknowledged, the Data Monitor will play the serious
sound.
WAV file to play for certain other alarms
This option is rarely used. Cedar can be configured so that selected alarms play
a third audio file, separate from the serious and warning sounds. Click the
question mark button to see the list of alarms that use this audio file. If your
facility needs this option to be configured, please contact CiSCO software
support.
60
Chapter 2: Data Monitor
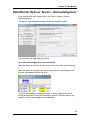
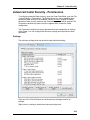
Data Monitor Options: Alarms - Acknowledgement
In the Data Monitor main window menu, click Tools > Options > Alarms Acknowledgement.
The Alarms - Acknowledgement page provides the following options:
The options on this page apply to all users.
User must acknowledge each alarm individually
When this option is checked, the user must click on each alarm to acknowledge
it.
When this option is unchecked, the alarm window has an Acknowledge button
that can acknowledge all alarms at once.
This option only applies to the alarm window. It does not apply to the alarm
banner at the bottom of the main Data Monitor window. The alarm banner only
allows the user to acknowledge alarms individually.
61
Cedar User Manual
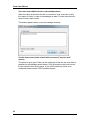
User must enter additional text to acknowledge alarms
When this option is checked, the user is instructed to enter some text, usually
their name or initials, in order to acknowledge an alarm. Provide instructions for
what the user needs to enter.
This window appears when a user acknowledges an alarm.
Certain alarms can only be cleared with a password ("manual reset"
alarms)
This option is rarely used. Cedar can be configured so that the user must enter a
password to acknowledge certain alarms. Click the question mark button to see
the list of alarms that use this option. If your facility needs this option to be
configured, please contact CiSCO software support.
62
Chapter 2: Data Monitor
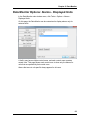
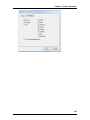
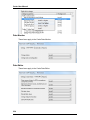
Data Monitor Options: Alarms - Displayed Units
In the Data Monitor main window menu, click Tools > Options > Alarms Displayed Units.
On this page, the Data Monitor can be customized to display alarms only for
selected units.
A facility may have multiple control rooms, and each control room operates
certain units. This page allows each control room to show only the alarms for
units that are operated by that control room.
Alarms that are not unit-specific always appear for all users.
63
Cedar User Manual
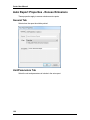
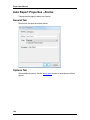
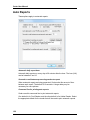
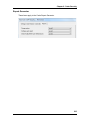
Data Monitor Options: Alarms - Send Email
In the Data Monitor main window menu, click Tools > Options > Alarms - Send
Email.
On this page, Cedar can be customized to send email messages for new alarms.
Configuring this feature often requires coordination with IT personnel who are
responsible for the email server. Please contact CiSCO software support if you
need assistance setting up this feature.
64
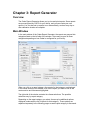
Chapter 3: Report Generator
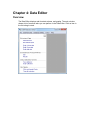
Overview
The Cedar Report Generator allows you to view and print reports. Some reports
are pre-configured by CiSCO for your facility, and you can create your own
reports. You can also set up reports to run automatically, such as every day or
after calibration checks are complete.
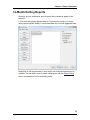
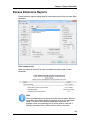
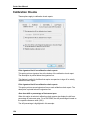
Main Window
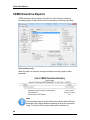
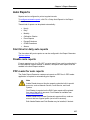
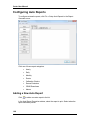
In the main window of the Cedar Report Generator, the reports are grouped into
categories listed on the left side of the window. There may be more or fewer
categories depending on how Cedar is configured for your facility.
When you click on a report category, the reports for that category are displayed
in the center section of the window. Click on the report you wish to view in this
center section and it becomes highlighted.
The right side of the window contains time frame selections. The possible
selections vary by report category.
Depending on the report category you select, there may be additional options
displayed underneath the list of reports for that category. These options are
explained separately in the following pages as each report category is discussed.
Cedar User Manual
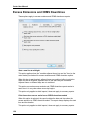
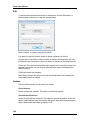
PDF Reader
The Cedar Report Generator creates most reports as PDF files. A PDF reader
application is required to view and print the reports. Foxit Reader
(www.foxitsoftware.com) and Adobe Reader (get.adobe.com/reader) are the
most popular reader applications.
Note
Adobe Reader does not function properly under the built-in special
accounts, such as Network Service, Local Service, and Local
System.
Foxit Reader is required on the DAS if auto reports will be printed
from one of the built-in accounts. Foxit Reader is available from
www.foxitsoftware.com.
Adobe Reader may be used if automatic reports will run under an
account that has a typical profile (not a built-in account).
Both Adobe Reader and Foxit Reader may be installed, if desired.
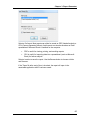
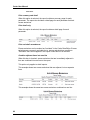
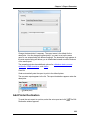
Previewing a Report
Click Preview to generate a report. A progress bar appears while Cedar prepares
the data and generates the report file.
The report is displayed in your PDF reader application.
Printing a Report
Click Print to print a report. A progress bar appears while Cedar prepares the
data and generates the report file. Your PDF viewer application opens and prints
the report.
The Print button sends the report to your default printer. If you want to print to a
different printer, click the Preview button. Once the report appears in your PDF
viewer application, use its print feature to choose a different printer.
Saving a Report
The Save As option is useful for exporting data to Microsoft Excel or emailing a
report in PDF format.
Click the Save As button. The Save Report As window appears.
66
Chapter 3: Report Generator
Select a file format. Most reports can either be saved as PDF (Adobe Acrobat) or
CSV (Comma Separated Values). Audit reports can also be saved as an Excel
spreadsheet if Microsoft Excel is installed on the computer.
•
PDF is useful for viewing, printing, and emailing reports.
•
CSV is useful for importing data into a spreadsheet (such as Microsoft
Excel) for further analysis.
Select a location to save the report. Use the Browse button to choose a folder
and filename.
If the "Open file after saving" box is checked, the report will open in the
associated application after it has been saved.
67
Cedar User Manual
Hourly Reports
An hourly report displays data for one hour. Hourly reports typically display 1minute detail data and 1-hour aggregate data.
Depending on the requirements for your facility, several pre-configured reports
are available. You can define new hourly reports with the Report Wizard.
Here is an example of an hourly report.
68
Chapter 3: Report Generator
Daily Reports
A daily report displays data for one day. Daily reports typically display 1-hour
detail data and 1-day aggregate data.
Depending on the requirements for your facility, several pre-configured reports
are available. You can define new daily reports with the Report Wizard.
Here is an example of a daily report.
69
Cedar User Manual
Monthly Reports
A monthly report displays data for one month. Monthly reports typically display 1day detail data and 1-month aggregate data.
Depending on the requirements for your facility, several pre-configured reports
are available. You can define new monthly reports with the Report Wizard.
Here is an example of a monthly report.
70
Chapter 3: Report Generator
Quarterly Reports
Quarterly, annual, semiannual, and 12-month rolling reports all appear in the
same list.
A quarterly report displays data for one quarter. Quarterly reports typically display
1-month or 1-day detail data and 1-quarter aggregate data.
Depending on the requirements for your facility, pre-configured reports may be
available. You can define new quarterly reports with the Report Wizard.
Here is an example of a quarterly report.
71
Cedar User Manual
Semiannual Reports
Quarterly, annual, semiannual, and 12-month rolling reports all appear in the
same list.
A semiannual report displays data for six months, January-June or JulyDecember. Semiannual reports typically display 1-month detail data and 6-month
aggregate data.
Depending on the requirements for your facility, pre-configured reports may be
available. You can define new semiannual reports with the Report Wizard.
Here is an example of a semiannual report.
72
Chapter 3: Report Generator
Annual Reports
Quarterly, annual, semiannual, and 12-month rolling reports all appear in the
same list.
An annual report displays data for one year. Annual reports typically display 1month or 1-quarter detail data and 1-year aggregate data.
If your facility has 365-day rolling values, they typically appear on a daily report,
since the values change every day.
Depending on the requirements for your facility, pre-configured reports may be
available. You can define new annual reports with the Report Wizard.
Here is an example of an annual report.
73
Cedar User Manual
74
Chapter 3: Report Generator
12-Month Rolling Reports
Quarterly, annual, semiannual, and 12-month rolling reports all appear in the
same list.
A 12-month rolling report displays data for 12 consecutive months. 12-month
rolling reports typically display 1-month detail data and 12-month aggregate data.
Depending on the requirements for your facility, pre-configured reports may be
available. You can define new 12-month rolling reports with the Report Wizard.
Here is an example of a 12-month rolling report.
75
Cedar User Manual
76
Chapter 3: Report Generator
Event Reports
An event report displays durations and values for events. Common events are
unit startup and shutdown.
Event reports are available if they have been configured for your facility.
Here is an example of an event report.
77
Cedar User Manual
In this example, the events are configured to show the durations, but there are no
values associated with the events.
Events have values when, for example, the unit has an emission limit for pounds
per startup or pounds per shutdown.
78
Chapter 3: Report Generator
Calibration Check Reports
Calibration check reports display the results of CEMS calibration checks, stack
flow monitor interference checks, and other types of daily quality assurance
checks.
Here is an example of a calibration check report.
Only show failed cals
When this option is selected, only failed calibrations are displayed on the report.
If all calibration checks passed, the report will not show any calibration checks.
Only show most recent cals for each parameter
When this option is selected, all other report options are disabled. Only the most
recent calibration check in the last 30 days for each parameter are displayed.
79
Cedar User Manual
Online cals / Offline cals
These options allow online and/or offline calibration checks to be displayed. If
neither box is checked, the report includes both online and offline calibration
checks.
Gas cylinder information
When this option is selected, gas cylinder information is displayed, if available.
Here is an example of a calibration check report with gas cylinder information.
Color
Calibration check reports support color. To enable color, click the Tools >
Options menu, and check the "Use color on reports where appropriate" box on
the General tab.
If color is enabled, failed calibrations appear in red text. Otherwise, failed
calibrations appear in bold text.
If color is enabled, calibrations that occurred when the unit was offline appear in
blue text.
80
Chapter 3: Report Generator
Excess Emissions Reports
Excess emission reports display data for times when permit limits may have been
exceeded.
Print summary only
When this option is selected, the report includes a summary page for each
parameter.
Note
The total operating time is derived from the monitor codes. Different
parameters may display different operating times for the same date
range. This occurs if the monitor codes are inconsistent, for
example, when one parameter has an online monitor code and a
different parameter has an offline monitor code for the same
81
Cedar User Manual
date/time.
Print summary and detail
When this option is selected, the report includes a summary page for each
parameter. The report also includes a detail page for each parameter that had
excess emissions.
Print detail only
When this option is selected, the report includes a detail page for each
parameter.
Print excluded' exceedences
Excess emissions can be marked as "excluded" in the Cedar Data Editor. Excess
emissions are commonly excluded due to startup and shutdown conditions.
"Excluded" items do not appear in this report unless this box is checked.
Combine adjacent times into one line
When this box is checked, excess emissions that are immediately adjacent in
time are combined into one line on the report.
This option only applies to detail reports.
This example shows two excess emissions that are adjacent, but on separate
lines.
This example shows the same two excess emissions combined on one line.
82
Chapter 3: Report Generator
Options button
Click the Options button to see additional options for excess emission reports.
The options are also available by clicking the Tools > Options menu and
selecting the Excess Emissions and CEMS Downtimes tab.
Color
Excess emission detail reports support color. To enable color, click the Tools >
Options menu, and check the "Use color on reports where appropriate" box on
the General tab.
When color is enabled, "excludable" excess emissions appear in blue on the
report.
Conflicts
Conflicts may appear on a separate page at the end of the report. Conflicts
indicate an inconsistency in the data and should be resolved.
83
Cedar User Manual
CEMS Downtime Reports
CEMS downtime reports display information for times when an emissions
monitoring system or other monitor was not operating or collecting valid data.
Print summary only
When this option is selected, the report includes a summary page for each
parameter.
Note
The total operating time is derived from the monitor codes. Different
parameters may display different operating times for the same date
range. This occurs if the monitor codes are inconsistent, for
84
Chapter 3: Report Generator
example, when one parameter has an online monitor code and a
different parameter has an offline monitor code for the same
date/time.
Print summary and detail
When this option is selected, the report includes a summary page for each
parameter. The report also includes a detail page for each parameter that had
CEMS downtimes.
Print detail only
When this option is selected, the report includes a detail page for each
parameter.
Print 'excluded' CEMS downtimes
CEMS downtimes can be marked as "excluded" in the Cedar Data Editor.
"Excluded" items do not appear in this report unless this box is checked.
Combine adjacent times into one line
When this box is checked, CEMS downtimes that are immediately adjacent in
time are combined into one line on the report.
This option only applies to detail reports.
This example shows some CEMS downtimes that are adjacent, but on separate
lines.
This example shows the same CEMS downtimes combined on one line.
85
Cedar User Manual
Options button
Click the Options button to see additional options for CEMS downtime reports.
The options are also available by clicking the Tools > Options menu and
selecting the Excess Emissions and CEMS Downtimes tab.
Color
CEMS downtime detail reports support color. To enable color, click the Tools >
Options menu, and check the "Use color on reports where appropriate" box on
the General tab.
When color is enabled, "excludable" CEMS downtimes appear in blue on the
report.
Conflicts
Conflicts may appear on a separate page at the end of the report. Conflicts
indicate an inconsistency in the data and should be resolved.
86
Chapter 3: Report Generator
Conflicts in Excess Emission and CEMS
Downtime Reports
When the "Print log of any operating-time conflicts" option is selected, the report
generator checks for conflicts between the monitor codes and the excess
emissions or CEMS downtimes. Any conflicts appear on a separate page at the
end of the report.
A conflict exists when:
•
There is an excess emission but the monitor code indicates the unit is
offline or the data is invalid.
•
There is a CEMS downtime but the monitor code indicates the unit is
offline or the data is valid.
Conflicts can be resolved by editing the monitor codes and/or by rebuilding the
excess emissions or CEMS downtimes.
This option applies to summary reports and detail reports.
87
Cedar User Manual
Alarm Reports
Alarm reports display alarm data for a selected time period.
Here is an example of an alarm report.
Options: alarm severity and category
Several checkboxes list the alarm severities and categories. The report only
displays alarms with the selected alarm severities and categories.
Show acknowledgment info
When "Show acknowledgement info" is checked, the report displays
acknowledgement information for alarms that were acknowledged. The report
displays the user's logon name and the time when the user acknowledged each
alarm. One alarm may be acknowledged by multiple users. Serious and warning
alarms can be acknowledged. Info alarms do not need to be acknowledged.
Here is an example of an alarm report with acknowledgement information.
88
Chapter 3: Report Generator
Color
Alarm reports support color. To enable color, click Tools > Options, and check
the "Use color on reports where appropriate" box on the General tab.
Limit alarms appear in magenta. Serious alarms appear in red.
89
Cedar User Manual
Audit Reports
The Audit category includes reports for several types of data.
1-Hour Data and 1-Minute Data
These reports provide the 1-hour and 1-minute data available in Cedar.
Operation Status
Operation status reports are based on the monitor codes of 1-minute data.
I/O Audits
I/O audits collect CEMS data at a high frequency, and can be useful for
certification and diagnostics. An I/O audit can be started in the Data Monitor.
90
Chapter 3: Report Generator
Audit Reports: 1-Hour and 1-Minute
These reports display 1-hour and 1-minute data that is available in Cedar.
Here is an example of a 1-hour audit report.
Parameters
Select the Parameters option to display the available 1-hour or 1-minute
parameters.
Select the unit from the drop-down list. Select "All units" to display parameters
from multiple units on one report.
Select the parameters to include in the report. The Select All and Deselect All
buttons affect the entire list of parameters.
91
Cedar User Manual
Save List button
To save the list of parameters for future use, click Save List. The parameter list is
saved as a new entry under "Saved Lists". Enter a name for the new list.
Saved Lists
When "Saved Lists" is selected, the lists of pre-selected parameters are
available.
If the 1-Hour Data tab is selected, there is also an entry for each daily report that
has 1-hour detail data. This allows you to print the same 1-hour data that is on a
daily report, but for a custom time period.
If the 1-Minute Data tag is selected, there is also an entry for each hourly report
that has 1-minute detail data. Again, this allows you to print the same 1-minute
data that is on an hourly report, but for a custom time period.
92
Chapter 3: Report Generator
Click Rename to rename a custom list of saved parameters. Daily and hourly
reports cannot be renamed from this window.
Options
Only print summary values
When "Only print summary values" is checked, the report only displays the
aggregate (average, total, minimum, maximum) values. The report does not
display the detail data.
Show valid non-zero monitor codes
When this box is unchecked (the default), the report only displays monitor codes
for data that is invalid or offline. The report does not display monitor codes for
valid data.
When this box is checked, the report displays monitor codes for valid data,
except monitor code 00.
Monitor Codes
This report displays monitor codes in brackets next to the data point.
93
Cedar User Manual
A legend at the end of the report shows the descriptions of all monitor codes that
appear in the report.
94
Chapter 3: Report Generator
Audit Reports: Operation Status
Operation status reports summarize 1-minute process code and monitor code
data.
Here is an example of an operation status report.
95
Cedar User Manual
Show duration
When this option is selected, the report includes a Duration column with hours
and minutes.
Start new line at midnight
When this box is checked, adjacent data on the same day are combined.
Adjacent monitor codes on different days are not combined. This option can
make reports easier to read, since it is very clear where a new day begins.
96
Chapter 3: Report Generator
Audit Reports: I/O Audits
I/O audits collect CEMS data at a high frequency, and can be useful for
monitoring system certification and diagnostics. An I/O audit can be started in the
Data Monitor.
Here is an example of an I/O Audit report.
97
Cedar User Manual
Note
Gaps in the data, indicated by dashes or missing times, are normal.
Cedar is limited by the communication speed and the quantity of
data that it must read from the CEMS in addition to the I/O audit
data. During an I/O audit, Cedar attempts to read the selected data
as frequently as possible. Cedar may not able to read all the CEMS
data every second.
How to run an I/O Audit report
First select an I/O audit in the list (highlighted in blue).
Next, select the unit and parameters for the report (highlighted in orange). The
available unit(s) and parameter(s) were determined when the user started the I/O
audit in the Data Monitor.
Finally, select the time range and options (highlighted in green).
Options
Time range
If "All data in I/O audit" is selected, the report displays data for the entire duration
of the I/O audit. I/O audit reports can be very lengthy because they can include a
large number of data points. In many cases, it is better to narrow the time range
using the From and To boxes.
98
Chapter 3: Report Generator
When you select an I/O audit in the list, the From and To boxes change to
indicate the time of the earliest and latest data points in the I/O audit. If you enter
a time range that is outside the range of the I/O audit, you will only see data
points that are within the I/O audit time frame.
Minimum interval (seconds)
I/O audit reports can be very lengthy because they can include a very large
number of data points. You may want to see a data point every 5 or 10 seconds
to limit the length of the report.
The default value for this option is 1. If you enter 10, for example, the data points
displayed on the report will be at least 10 seconds apart.
Note
When this option is greater than 1, some columns may appear to
have many missing data points. This is because Cedar could not
read all the data points in the same second. Change this setting to 1
to see all the data points.
Note
Because I/O audit reports often contain large amounts of data, it can
be very helpful to save the report in CSV format and open it in a
spreadsheet, such as Microsoft Excel. Averages and totals can be
easily calculated in a spreadsheet.
Only print summary values
When "Only print summary values" is checked, the report only displays the
aggregate (average, minimum, maximum) values. The report does not display
the detail data.
Rename and Delete
Click the Rename button to give an I/O audit a descriptive name.
Click the Delete button to delete an I/O audit that you no longer need.
Monitor Codes
This report does not include monitor codes. I/O audits only collect data for realtime analog values. Select a 1-minute audit report if you need to see monitor
codes
99
Cedar User Manual
CGA/Linearity Check Reports
These reports display data for quarterly Cylinder Gas Audits (CGA), Linearity
Checks, and similar QA tests.
Each unit is identified with a smokestack icon and the name of the unit.
Click the (+) to expand the tree below the unit and view the CGA and Linearity
Checks defined for that unit. Book icons represent each CGA or Linearity Check.
Click the (+) to expand the tree below the CGA or Linearity Check and view the
individual tests that have been performed. Individual icons are represented with a
page icon. Click a specific test to preview or print that test.
Here is an example of a linearity check report. Each CGA or linearity check
appears on a separate page.
100
Chapter 3: Report Generator
Show allowable ranges for reference gases
When "Show allowable ranges for references gases" is checked, the report
calculates and displays the range of allowable reference values for each gas
level.
To see the allowable ranges, the analyzer information must have been entered in
the Data Editor.
If color is enabled, the reference gas text is displayed in red if the reference value
is outside the allowable range. To enable color, click the Tools > Options menu,
and check the "Use color on reports where appropriate" box on the General tab.
Print all CGAs/linearity checks for one unit in one quarter
Select this option to include all CGAs and linearity checks for one unit and one
quarter in the report. In the tree, select the unit icon, or select any book icon or
individual test.
101
Cedar User Manual
Opacity Calibration Error Test Reports
Calibration Error Tests for opacity monitors are similar to linearity checks.
Calibration error tests for opacity monitors are specified in 40 CFR 60 Appendix
B Performance Specification 1. The test may have 3, 4, or 5 runs for each of 3
reference filters, for a total of 9, 12, or 15 runs.
102
Chapter 3: Report Generator
CGT and Calibration Drift Test Reports (Canada)
Cylinder Gas Tests (CGTs) and Calibration Drift Tests are similar to linearity
checks.
Quarterly CGTs
For a Cylinder Gas Test (CGT), the test reason must be "QA".
Environment Canada regulations require CGTs to be performed each quarter.
CGTs are specified in Report EPS 1/RG/7 Revised, section 6.3.1.
Calibration Drift Test for CEMS certification
For a Calibration Drift Test, the test reason must be "Certification". The
"Certification" test reason indicates the test is a Calibration Drift Test, and Cedar
will use the appropriate equations and pass/fail criteria. (CGTs and Calibration
Drift Tests use different equations and pass/fail criteria.)
Environment Canada regulations require daily Calibration Drift Tests during the
168-hour Operational Test Period for CEMS certification. A Calibration Drift Test
involves 3 injections of 3 gases, for a total of 9 injections. Calibration Drift Tests
are specified in Report EPS 1/RG/7 Revised, section 5.3.2.
103
Cedar User Manual
Settings Reports
Settings reports display the current values of settings.
Settings are values that are specific to your facility. Settings may include daily
calibration start times, fuel density settings for gas and/or oil, bias factors, on-line
setpoints for fuel, water, and steam flows, and backflush intervals.
In the tree, select the settings that you want to include in the report. Click Select
All or Deselect All to select or deselect all the settings in the tree.
Here is an example of a settings report.
104
Chapter 3: Report Generator
Include date/time of last setting change
When this box is checked, the report includes the date and time the setting was
most recently changed.
105
Cedar User Manual
Report Comments
Users can optionally enter comments that appear on the bottom of a report.
To enable this feature, click the Tools > Options menu in the main Report
Generator window. Select the General tab, and check the 'Allow me to enter a
comment for each report' box.
When this feature is enabled, a window appears when the Print or Preview
buttons are clicked.
Enter a comment, and click OK.
Here is an example of a comment on a report.
To create the report with no comment, click the "OK (No Comment)" button.
To disable the comment feature, click the "Don't ask me for a comment again"
box. Or, disable it in the General tab in the Options window.
106
Chapter 3: Report Generator
Auto Reports
Reports can be configured to print at regular intervals.
To configure automatic reports, click File > Setup Auto Reports in the Report
Generator menu.
These kinds of reports can be printed automatically:
•
Hourly
•
Daily
•
Monthly
•
Calibration Checks
•
Event Reports
•
Excess Emissions
•
CEMS Downtimes
•
Alarms
Start time for daily auto reports
The time when daily auto reports run can be configured in the Report Generator
Options window.
Disable auto reports
For auto reports to run, the "Do NOT run auto reports" box must be unchecked in
the Data Monitor Options window. In addition, the specific auto reports must be
enabled in the Auto Reports window.
PDF reader for auto reports
The Cedar Report Generator creates most reports as PDF files. A PDF reader
application is required to automatically print reports.
Note
Adobe Reader does not function properly under the built-in special
accounts, such as Network Service, Local Service, and Local
System.
Foxit Reader is required on the DAS if auto reports will be printed
from one of the built-in accounts. Foxit Reader is available from
www.foxitsoftware.com.
Adobe Reader may be used if automatic reports will run under an
account that has a typical profile (not a built-in account).
Both Adobe Reader and Foxit Reader may be installed, if desired.
107
Cedar User Manual
Configuring Auto Reports
To configure automatic reports, click File > Setup Auto Reports in the Report
Generator menu.
Click one of these report categories:
•
Hourly
•
Daily
•
Monthly
•
Events
•
Calibration Checks
•
Excess Emissions
•
CEMS Downtimes
•
Alarms
Adding a New Auto Report
Click
to add a new auto report to the list.
In the Auto Report Properties window, select the report to print. Select when the
report should be printed.
108
Chapter 3: Report Generator
Change the description if necessary. The report name is the default for the
description. You can change this description if you want to set up the same
report to run automatically with different settings. The description only appears in
the auto reports listing and allows you to differentiate between modified versions
of the same report.
The properties window has additional options for calibration checks, excess
emissions, CEMS downtimes, and alarms.
Click OK.
Cedar automatically sets the report to print to the default printer.
The new auto report appears in the list. The report destinations appear under the
description.
Add Printer Destination
To send the auto report to a printer, select the auto report and click
Destination window appears.
. The Edit
109
Cedar User Manual
Select the printer and click OK.
The new printer destination appears under the auto report.
Note
Do not select the "default printer" if auto reports will be printed
from the built-in Network Service or Local Service accounts. The
default printer for these accounts is often a virtual printer, such as an
XPS document writer.
Select a specific printer instead of the "default printer".
The Local System account uses the default printer that is defined for
"all users".
Add PDF Folder Destination
To save the auto report as a PDF file in a folder, select the auto report and click
. The Edit Destination window appears.
110
Chapter 3: Report Generator
Choose a folder and click OK.
The new PDF folder destination appears under the auto report.
Add CSV Folder Destination
CSV files are useful for importing data into spreadsheet applications such as
Microsoft Excel.
To save the auto report as a CSV file in a folder, select the auto report and click
. The Edit Destination window appears.
111
Cedar User Manual
Choose a folder and click OK.
The new CSV folder destination appears under the auto report.
Add PDF Email Destination
For auto report emails to work, email settings must be configured in the Report
Generator Options window.
To send the auto report as a PDF email attachment, select the auto report and
click
112
. The Edit Destination window appears.
Chapter 3: Report Generator
Enter email addresses for the recipients and click OK.
The new PDF email destination appears under the auto report.
Add CSV Email Destination
For auto report emails to work, email settings must be configured in the Report
Generator Options window.
To send the auto report as a CSV email attachment, select the auto report and
click
. The Edit Destination window appears.
Enter email addresses for the recipients and click OK.
113
Cedar User Manual
The new CSV email destination appears under the auto report.
Edit Report Destination
To change a printer, file, or email destination, click on the destination and click
. A window will appear to edit the destination properties.
Remove Report Destination
To remove a report destination (a printer, folder, or email destination), click on
the destination and click
.
Be sure to click on the destination, and not on the report.
Disable/Enable Auto Report
To disable an auto report without removing it from the list, select the auto report
and click
.
When an auto report is disabled, it appears with a red X and gray text.
Remove Auto Report
To completely remove an auto report, select the auto report and click
114
.
Chapter 3: Report Generator
Auto Report Properties - Hourly, Daily, Monthly
These properties apply to hourly, daily, and monthly auto reports.
Select the report to print.
Select when the report should be printed.
115
Cedar User Manual
Auto Report Properties - Calibration Checks
These properties apply to calibration check auto reports.
General Tab
Select when the report should be printed. If a "calibration check complete" option
is selected, the Unit/Parameters and Options tabs are disabled. If "Every day" is
selected, the other tabs are enabled.
Unit/Parameters Tab
Select the unit and parameters to include in the auto report.
116
Chapter 3: Report Generator
Options Tab
Select additional options. See the calibration checks report section for
descriptions of these options.
117
Cedar User Manual
Auto Report Properties - Event Reports
These properties apply to event auto reports.
General Tab
Select when the report should be printed.
Unit/Parameters Tab
Select the unit and parameters to include in the auto report.
118
Chapter 3: Report Generator
Options Tab
Select additional options. See the event report section for descriptions of these
options.
119
Cedar User Manual
Auto Report Properties - Excess Emissions
These properties apply to excess emissions auto reports.
General Tab
Select when the report should be printed.
Unit/Parameters Tab
Select the unit and parameters to include in the auto report.
120
Chapter 3: Report Generator
Options Tab
Select additional options. See the excess emissions report section for
descriptions of these options.
121
Cedar User Manual
Auto Report Properties - CEMS Downtimes
These properties apply to CEMS downtimes auto reports.
General Tab
Select when the report should be printed.
Unit/Parameters Tab
Select the unit and parameters to include in the auto report.
122
Chapter 3: Report Generator
Options Tab
Select additional options. See the CEMS downtime report section for descriptions
of these options.
123
Cedar User Manual
Auto Report Properties - Alarms
These properties apply to alarm auto reports.
General Tab
Select when the report should be printed.
Options Tab
Select additional options. See the alarm report section for descriptions of these
options.
124
Chapter 3: Report Generator
125
Cedar User Manual
Report Wizard
The Report Wizard allows you to perform the following:
Create a new report
Modify an existing report
Duplicate an existing report for another unit
Delete an existing report
126
Chapter 3: Report Generator
Report Wizard: Create Custom Report
To open the Report Wizard, click Tools > Report Wizard in the Report Generator
menu.
Click Next.
127
Cedar User Manual
Select "Create a new report".
Click Next.
Choose the page layout for your report. Select the page size, orientation, font
type, and font size. The font size is in points. The distance between lines and
columns can also be changed.
Click Next.
128
Chapter 3: Report Generator
Select time periods for your report. The Summary interval determines the total
amount of time the report will cover. The Detail interval is the amount of time
between each row of detail data in the report.
The "Other" option is useful for specialized reports, such as daily 6-minute
opacity reports. This creates a report that can compactly display minute-level
data for a single parameter for one day. See the end of this section for the
"Other" option.
This wizard screen appears only when the report is first created. Once the report
is created, this screen is not available again.
Click Next.
This wizard page lets you configure the columns for the report.
Click Add Column.
129
Cedar User Manual
The first column of the report is normally a date and/or time. Select a date/time
option from the pull-down menu.
Click OK.
The date/time column is added to your report.
To add columns of data to the report, click Add Column again.
130
Chapter 3: Report Generator
The detail interval that was selected for the report determines which parameters
are available for this list. The unit name and a dashed line separates the
parameters for each unit. Select a parameter to add to the report by clicking on
the parameter. To select multiple parameters use the Shift or Ctrl keys.
Click OK.
The parameters you chose have been added to the list of columns in the upper
half of the window.
Use the Move buttons to move the highlighted column left or right. Use the
Delete button to remove the highlighted column from your report.
131
Cedar User Manual
The lower half of the window allows you to configure the currently selected
column. You can change the column title, width, and alignment of the data.
If the column title is too long for the column width, the title will automatically wrap.
To control where the title breaks to another line, insert a "pipe" character (|)
where you want the title to wrap. The "pipe" character is on the backslash key on
the keyboard.
The window displays the total width of all columns, and the maximum total width.
The current total updates as you change column widths and add columns. If the
total width of all columns exceeds the maximum, the text turns red, as in this
example.
Select "Display a line after this column" to put a vertical line to the right of the
column. This can help to visually group related columns together. You cannot
display a line after the last column in the report.
If the highlighted column has summary information available, it appears in the
Summary Data list.
Check the box next to the summary data that should be displayed on the report.
Summary values will appear on the bottom of the report.
You may not select any summary data for the first (leftmost) column. This column
is reserved for descriptions of the summary data.
Click Next.
132
Chapter 3: Report Generator
If you have separated columns into groups by checking the "Display a line after
this column" boxes (on the previous screen), you have the option to add a title to
each group of columns. If you have not grouped the columns, the fields on this
screen will be disabled.
The column names for the group appear in the first field. You may optionally
enter a title for the group in the second field. The group title appears on the
report centered above the columns that are in the group.
Use the Previous Group and Next Group buttons to select groups.
Click Next.
133
Cedar User Manual
If you have selected summary data for one or more columns on the report, this
screen displays descriptions of the summary rows. To change the summary row
description, click on the text in the Actual Description column.
If a summary row title is too wide for the column, it will be truncated on the report.
Click Next.
134
Chapter 3: Report Generator
You may customize header and footer information for your report. Scroll down to
view the footer.
The Report Wizard provides a default header, including the facility name, facility
location, report name, and report date.
The report header appears at the top of the report. If "Show at top of every page"
is checked, the header appears on each page.
To change the header or footer, click on a cell. The lower half of the window
shows the configuration for the selected cell.
Enter the text you want to see on the report. You can also click the pull down
menu to access built-in variables.
135
Cedar User Manual
There is no default report footer. To edit the footer, scroll down to the Report
Footer section. The footer cells can be edited just like the header cells.
Click Next.
This screen allows you to put additional information in a grid at the top of the
report. The grid is often used to display emission limits. The grid appears below
the header and above the data columns.
By default, no grid information is configured. A grid can take some time to
configure but may be very useful for your report.
Click Next.
136
Chapter 3: Report Generator
Enter a name for your new report. Check "Preview this report now" to see the
report you just created.
Click Finish.
The report will simply be added to the appropriate category in the main Report
Generator window. If you checked the "Preview this report now" box, the report
will be generated.
Report with "Other" Time Interval
The "Other" option is useful for specialized reports, such as daily 6-minute
opacity reports.
137
Cedar User Manual
When the "Other" box is checked, the summary interval is always "Day" and the
Detail interval must be one of the minute options. Select the minutes between
detail data. "6 Minutes" is typical for opacity.
Click Next.
The wizard does not show the pages for configuring columns, column groups,
and summary row descriptions. Instead, the wizard shows the following page.
138
Chapter 3: Report Generator
Select the parameter to display on the report. This report can only display data
for a single parameter.
Select the minute format for the column titles.
Select the hour format for the row titles.
If the column widths would be wider than the maximum report width, the wizard
will create the report with multiple rows of data per hour.
Click Next to configure the header and footer.
Here is an example of this report.
139
Cedar User Manual
Report Wizard: Modify Report
To open the Report Wizard, click Tools > Report Wizard in the Report Generator
menu.
Click Next.
Select "Modify an existing report".
140
Chapter 3: Report Generator
Click Next.
Select the report to modify. You can only modify custom reports that you have
created. If a report provided by CiSCO needs to be changed, contact CiSCO
software support.
Click Next.
The rest of the wizard screens are the same screens that are used to create a
report.
141
Cedar User Manual
Report Wizard: Duplicate Report
To open the Report Wizard, click Tools > Report Wizard in the Report Generator
menu.
Click Next.
Select "Duplicate an existing report for another unit".
142
Chapter 3: Report Generator
Click Next.
Select the report to duplicate.
Click Next.
143
Cedar User Manual
The original report can be duplicated multiple times by this one screen. In this
example, the original report is for Turbine 1, and will be duplicated for Turbine 2
and Turbine 3.
The Allowable Unit Numbers are from the internal Cedar configuration, and may
not match the actual unit name or number. Contact CiSCO software support if
you need clarification for the unit numbers.
Note
If you do not change the unit numbers or report name, the wizard will
make an exact duplicate of the existing report.
Click Finish.
144
Chapter 3: Report Generator
Report Wizard: Delete Report
To open the Report Wizard, click Tools > Report Wizard in the Report Generator
menu.
Click Next.
145
Cedar User Manual
Select "Delete an existing report".
Click Next.
Select the reports you want to delete.
Click Finish.
A message box will ask you to confirm that you want to delete the reports. Click
Yes.
146
Chapter 3: Report Generator
Report Generator Options
To open the Options window, click the Tools > Options menu.
The Options window has several tabs:
General
Facility Info
Data Validity
Auto Reports
Calibration Checks
Excess Emissions and CEMS Downtimes
147
Cedar User Manual
General
These options apply throughout the Report Generator.
Allow me to enter a comment for each report
Check this box to enable comments on reports.
Use color on reports where appropriate
Some reports support color when this box is checked.
Close the report generator after it has been open for 12 hours
When this box is checked, the Report Generator will close itself after 12 hours. If
users launch multiple Report Generator instances but do not close the instances,
this option can help clean up the stale instances.
Attempt to close PDF Reader after clicking the 'Print' button
When this box is checked, the Report Generator tries to close any Adobe Reader
or Foxit Reader windows after a PDF report has been printed by clicking the Print
button. Some versions of PDF reader applications do not automatically terminate
themselves after a report has been printed.
148
Chapter 3: Report Generator
Facility Info
These options apply throughout the Report Generator.
Enter the name and location of the facility. This information appears on many
reports.
149
Cedar User Manual
Data Validity
These options apply to reports that display typical data points, such as hourly,
daily, and monthly reports.
Use bold text for invalid values
When this option is selected, data points with invalid monitor codes appear in
bold text.
Use bold text for down values
When this option is selected, data points with offline monitor codes appear in
bold text. This includes periods when the unit was offline, and may include other
offline conditions, such as an inactive bypass stack.
Use bold text for substituted values
When this option is selected, data points with monitor codes that indicate
substitute data appear in bold text.
Show monitor code numbers instead of names for invalid and down values
When this option is selected, the monitor code numbers are displayed instead of
the short description of the monitor codes.
150
Chapter 3: Report Generator
Ignore data prior to
If this option is selected, all data prior to the entered date is considered offline.
This is useful, for example, to disregard data points (such as 1-minute and 1-hour
data) prior to CEMS certification, without having to edit the monitor codes for that
data.
151
Cedar User Manual
Auto Reports
These options apply to automatic reports.
Automatic daily report hour
Automatic daily reports run every day at 28 minutes after the hour. The hour (HH)
can be between 2 and 15.
Seconds to wait between processing each auto report
When automatic reports are being generated, Cedar waits this amount of time
between each report. The default is 10 seconds. A longer delay may be
necessary for some printers.
Command line for printing auto reports
Cedar uses this command line to print automatic reports.
One default is for Foxit Reader, and the other default is for Adobe Reader. Select
the appropriate default for the reader that will be used to print automatic reports.
152
Chapter 3: Report Generator
Note
Adobe Reader does not function properly under the built-in special
accounts, such as Network Service, Local Service, and Local
System.
Foxit Reader is required on the DAS if auto reports will be printed
from one of the built-in accounts. Foxit Reader is available from
www.foxitsoftware.com.
Adobe Reader may be used if automatic reports will run under an
account that has a typical profile (not a built-in account).
Both Adobe Reader and Foxit Reader may be installed, if desired.
Command line for sending auto reports via email
Cedar uses this command line to send automatic reports via email.
The Default button provides the typical command line that Cedar uses. Several
items must be configured before the command line will work, such as the SMTP
(mail) server, account name (if any), password (if any), and TCP port.
The Test button attempts to send a sample email to check whether the command
line and mail server are configured correctly.
Contact CiSCO software support if you need assistance configuring this
command line.
153
Cedar User Manual
Calibration Checks
These options apply to calibration check reports.
Print signature line #1 on calibration check reports
This option prints a signature line at the bottom of the calibration check report.
The description is printed below the signature line.
This feature is useful for facilities that require a supervisor to sign off on a daily
calibration check report.
Print signature line #2 on calibration check reports
This option prints a second signature line on each calibration check report. The
description is printed below the signature line.
Also show drift as percentage of instrument span
When this option is selected, calibration check reports also display the drift as a
percentage of instrument span. For a PM CEMS, the drift percentage is based on
the upscale reference value (URV).
The drift percentage is highlighted in this example.
154
Chapter 3: Report Generator
Highlight duplicate calibration records
When this option is selected any duplicate calibration records are highlighted on
the report. This can be useful for diagnosing uncommon situations involving
duplicate calibration data.
155
Cedar User Manual
Excess Emissions and CEMS Downtimes
These options apply to excess emissions and CEMS downtimes reports.
Start a new line at midnight
This option applies when the "combine adjacent times into one line" box (on the
main window) is checked for excess emissions and CEMS downtime reports.
When this box is not checked, adjacent items are combined without restriction.
When this box is checked, adjacent items on the same day are combined.
Adjacent items on different days are not combined.
This option can make excess emission and CEMS downtime reports easier to
read, since it is very clear where a new day begins.
This option only applies to detail reports; it does not apply to summary reports.
Print times when excess emissions or CEMS downtimes ended
When this option is selected, the report includes the date and time when the
excess emission or CEMS downtime ended. The report always displays the start
time and the duration.
This option only applies to detail reports; it does not apply to summary reports.
156
Chapter 3: Report Generator
Print total duration of excess emissions or CEMS downtimes
When this option is selected, the report includes a total duration at the bottom.
This option only applies to detail reports; it does not apply to summary reports.
New page for each parameter
When this option is selected, the data for each parameter starts on a new page.
This option applies to summary reports and detail reports.
Print log of any operating-time conflicts
When this option is selected, the report generator checks for conflicts between
the monitor codes and the excess emissions or CEMS downtimes. Any conflicts
appear on a separate page at the end of the report. Conflicts indicate an
inconsistency in the data and should be resolved.
This option applies to summary reports and detail reports.
157
Chapter 4: Data Editor
Overview
The Data Editor displays real-time data, alarms, and graphs. The main window
shows a list of common tasks you can perform in the Data Editor. Click an item in
the list to begin a task.
Cedar User Manual
Data Editor File Menu
Change DAHS
This menu item is enabled if Cedar is configured for multiple DAHS computers.
Click this item to switch to a different DAHS.
Security Setup - Accounts
Click this item to enable advanced Cedar security features and assign accounts
to each of the Cedar privilege levels.
Security Setup - Permissions
Click this item to configure advanced Cedar security permissions for each of the
Cedar privilege levels.
Print Screen
Prints a screen shot of the Data Editor window to the default printer.
Reports
Opens the Report Generator for displaying and printing reports.
Exit
Closes the Data Editor.
160
Chapter 4: Data Editor
Edit/View Data Menu
Alarm Log
Displays alarms history.
View Calibration Checks
Displays calibration check history.
Graph Calibration Checks
Displays calibration checks in a graphical format.
Graph Data
Displays minute, hourly, and daily data in a graphical format.
Edit Data Points
Allows you to edit data points that are stored in the Cedar database.
Bulk Edit Monitor Codes and OpTimes
Allows you to quickly change monitor codes and operating time data for multiple
parameters and large time periods. Only monitor codes and operating times may
be changed with this feature.
Substitute Invalid Data Points
Allows you to perform missing data substitution for invalid data points. This
feature is for sources that report substitute data per state or local requirements.
This feature is not used for reporting emissions to USEPA for Part 75.
Rebuild data points
Allows you to rebuild (recalculate) data points.
Edit Excess Emissions and CEMS Downtimes
Displays excess emissions and CEMS downtimes data. Allows you to edit
descriptions of the reasons and actions.
Rebuild Excess Emissions and CEMS Downtimes
Allows you to rebuild (recalculate) excess emissions and CEMS downtimes
based on the underlying data.
Edit CGAs and Linearity Checks
Allows you to view and edit data for CGAs and linearity checks.
161
Cedar User Manual
Evaluate Linearity Checks for Operating Hours
Checks unit operating hours and linearity checks to determine whether the
necessary linearity checks have been performed for the current quarter. This
feature is for sources that are subject to 40 CFR 75.
Settings
Displays the settings / constants defined in Cedar. With appropriate privileges,
the settings may be edited.
Analyzer and Monitor Information
Displays basic information about the analyzers and monitors that are used for
monitoring emissions.
162
Chapter 4: Data Editor
Alarm Log
In the Data Editor menu, click Edit/View Data > Alarm Log. The Alarm log window
opens.
Enter the From and To dates and times for the date range you wish to view. The
date range automatically defaults to midnight of the previous day and the current
date and time.
Check the boxes for the alarm severities and alarm categories you want to see.
Some alarms are specific to a plant unit. Select the unit(s) you want to see.
Alarms which are not unit-specific appear regardless of which units are selected.
Click the Refresh button. The Alarm Log will display information for each alarm.
indicating the time an alarm came on, when the alarm was cleared and when the
alarm was acknowledged for the time range you selected.
163
Cedar User Manual
View Calibration Checks
Calibration checks can be viewed from within the Database Editor without having
to print a calibration checks report.
In the Data Editor menu, click Edit/View Data > View Calibration Checks. A blank
Calibration Checks window opens.
Click the Select Cals button. The Select Cal Data window opens.
The following options are available:
•
Enter the time frame you wish to view. Also select specific parameters
from the pull down menu or view all parameters.
•
View Parameters in the last 1-72 hours.
•
View most recent calibrations (within the last 14 days).
Click OK. The calibration checks are displayed in the window.
164
Chapter 4: Data Editor
The calibration checks are organized by unit. Each unit is identified with the
smokestack icon and the name of the unit. Units are divided into sections by
regulations. The book icon followed by a regulatory reference such as 40CFR60
or 40CFR75.
A blue check mark indicates a passed calibration. A red “X” indicates a failed
calibration. The Results column gives a more detailed explanation of the fail
status.
165
Cedar User Manual
Graph Calibration Checks
Calibration checks can be displayed in graphical format. In the Data Editor menu,
click Edit/View Data > Graph Calibration Checks. A blank Calibration Check
Graph window opens.
Select an analyzer from the pull down menu. Enter the time period in the From
and To boxes.
The values for Span and Zero are graphed.
166
Chapter 4: Data Editor
Show/hide Performance Specification
To show or hide the Performance Specification, click the colored box next to
"Perform Spec". The performance specification is used when performing a 7-day
drift check.
Show/hide Performance Specification x 2
To show or hide the Performance Specification times two, click the colored box
next to "Perform Spec x 2". The performance specification times 2 is typically the
daily calibration drift limit. However, some regulations define a different daily
calibration drift limit.
Cursor
Click anywhere in the graph to display the cursor. The values on the right side
display the calibration data for the selected calibration check.
167
Cedar User Manual
Calibration check date/time and Online/offline indicator
The date and time that correspond with the position of the cursor are displayed in
the "Time" box on the right. This box may also show whether the calibration
check was performed while the unit was online or offline. The box may show
whether the calibration was started manually or automatically.
Show only Zero or Span
You can view the Zero or Span values separately by checking or un-checking the
Zero and Span boxes.
168
Chapter 4: Data Editor
Line colors
The legend on the right identifies the colors and values for each line displayed on
the graph. To change the color of a line, double click on the color box. Select a
new color and click OK.
Time scroll
The time range appears at the bottom of the graph. Use the arrow buttons in the
center of the window to scroll forward or scroll backward in time.
Menu
Right click on the graph to display a menu with additional options.
169
Cedar User Manual
Hide (date/time)
Removes the selected calibration check from the graph. This can be useful when
you want to compare calibration checks that are not consecutive.
Unhide All
Displays any calibration checks that have been hidden.
Perform Spec
Shows or hides lines for the performance specification, times 2, and times 4.
Background color
Changes the background color of the graph.
Print Options
Allows you to print the graph on your default printer, or send the graph to another
printer. You can also save the graph as a PDF file.
Linear Regression
Displays a message that indicates whether the measured value is currently
increasing or decreasing, and projects when the value will exceed the daily drift
limits if it drifts at a constant rate.
170
Chapter 4: Data Editor
Edit Data Points
In the Data Editor menu, click Edit/View Data > Edit Data Points. The window
may take a minute to appear while it loads the Cedar configuration.
The Edit Data Points window opens.
Loading Data
Use the pull down menus to select a Unit, Period, and Parameter.
•
Long period data is usually 1-hour data. Opacity data is usually 6-minute
or 3-minute data. Other period lengths are possible, such as 15-minute,
3-hour, and 24-hour data.
•
Short period data is usually 1-minute data. Short period data is typically
read-only and not available for editing.
Click the Load Data button.
The data points appear in the window.
171
Cedar User Manual
If an operating time parameter is selected, the values represent the portion of
an hour when the process or parameter was operating. A time value of 0.00
means the parameter did not operate during the hour. A value of 1.00 means the
parameter operated for the entire hour. Operating Time parameters do not have
Monitor Codes.
Process code parameters do not have monitor codes.
Editing Data
Select data points to edit. There are several ways to select data points.
172
•
To select one data point, click on the row.
•
To select a block of data points, click the first row. Hold the Shift key and
click the last row in the block.
•
To select non-contiguous data points, hold the Ctrl key and click each
row.
•
Click the Select All button to select all the rows.
•
Click the Invert Selection button to "flip" the selected/unselected state of
all the rows. This is useful if you want to edit all the data points except for
a few rows.
Chapter 4: Data Editor
Click the Edit button.
A window allows you to change the value and monitor code.
The current parameter Value and Monitor Code are displayed. If you have
selected more than one data point to edit and the current Values and/or Monitor
Codes are not the same, the field will display “multiple”.
Value
When editing data points, it is common to change only the monitor code and not
change the value. By default, the "Dont' change the value(s)" box is checked. To
edit the value, uncheck the box.
To store no numeric value, check the "Null for new value" box. This is not
common.
Warning
Use caution when editing data. Values and Monitor Codes should
only be edited when there is a sound technical basis for the change.
Editing data without valid justification violates environmental
regulations.
Monitor Code
Use the pull down menu to select a Monitor Code.
The Monitor Code fields are disabled for Operating Time parameters and
Process Code parameters, since they do not have monitor codes.
173
Cedar User Manual
Saving Changes
After changing one or more data points, the changes need to be saved to the
database. You must save or cancel the changes before selecting a different unit,
parameter, or time period.
The Save and Cancel buttons are highlighted. Click one of them to save or
discard your changes.
Note
After data points have been modified, excess emission and/or CEMS
downtime data may need to be rebuilt (recalculated).
174
Chapter 4: Data Editor
Bulk Edit Monitor Codes and OpTimes
Monitor codes and operating time data can be quickly changed for multiple
parameters and large time periods. Only monitor codes and operating times may
be changed in this window.
This tool is especially useful for marking data as offline or invalid for large periods
of time.
In the Data Editor menu, click Edit/View Data > Bulk Edit Monitor Codes and
OpTimes. The window may take a minute to appear while it loads the Cedar
configuration.
The Bulk Edit Monitor Codes and OpTimes window opens.
Enter the time frame for the data points that will be changed. Select a unit from
the pull down menu.
The list displays the long period parameters (usually 1-hour data) for the selected
unit. Operating time parameters show "[OPTIME]" next to the parameter name.
Select the parameters you wish to edit. Select individual parameters by checking
the box next to the parameter name. The Select All, Deselect All, and Invert
Selection buttons are also available.
Click the Select OPTIME button to select only the operating time parameters.
175
Cedar User Manual
When you select a normal (non-OPTIME) parameter, the "New monitor code for
normal parameters" box is enabled. Select a new monitor code from the pulldown menu.
When you select an operating time (OPTIME) parameter, the "New OPTIME
value (0.00 – 1.00)" box is enabled. Enter a value between 0.00 and 1.00, which
represents the portion of the hour that the parameter operated.
Both OPTIME and non-OPTIME parameters may be selected and changed in
one operation.
The Show PID Numbers box is used by CiSCO support personnel to display the
internal parameter IDs.
Click the Change Data button.
A message box notifies you that the edits may take some time. Once the process
has begun, there is no way to cancel it. It will continue until the data has been
modified. Click OK or Cancel.
A progress window displays the status of the operation.
A message box notifies you when the operation is complete. The message box
indicates the number of data points changed and the time it took to complete the
operation. This can be used to estimate the time required for further edits.
176
Chapter 4: Data Editor
Note
After data points have been modified, excess emission and/or CEMS
downtime data may need to be rebuilt (recalculated).
177
Cedar User Manual
Substitute Invalid Data Points
This feature is not applicable to most facilities. This feature is configured for your
facility if required by the permit.
Note
This window does not perform Part 75 missing data substitution for
data that is submitted to USEPA in quarterly electronic reports. The
Part 75 reporting software substitutes missing data before it
generates the quarterly report.
Some facilities are required to substitute missing data for periods when the
CEMS data is invalid. Cedar typically performs the missing data substitution
while it acquires data, but missing data substitution may need to be performed
again, especially if data is changed or edited.
In the Data Editor menu, click Edit/View Data > Substitute Invalid Data Points.
The window may take a minute to appear while it loads the Cedar configuration.
The Substitute Invalid Data Points window opens.
Enter the time frame to rebuild. Select a unit from the pull down menu.
The list displays the available parameters for the selected unit. The parameter list
is blank unless this feature is configured for your facility.
Select the parameters you wish to edit. Select individual parameters by checking
the box next to the parameter name. The Select All, Deselect All, Deselect
Above, and Deselect Below buttons are also available.
178
Chapter 4: Data Editor
The Show PID Numbers box is used by CiSCO support personnel to display the
internal parameter IDs.
Click the Substitute button.
A message box notifies you that the substitution operation may take some time.
A progress window displays the status of the operation. A message box notifies
you when the operation is complete. The message box indicates the number of
data points changed and the time it took to complete the operation.
Note
After data points have been modified, excess emissions data may
need to be rebuilt (recalculated) if permit limits apply to the data that
was substituted.
179
Cedar User Manual
Rebuild Data Points
This tool allows some calculated data to be rebuilt (recalculated) from underlying
data. For example, 1-hour data may need to be rebuilt (recalculated) from 1minute data. Or, 1-hour data (such as NOx lbs) may need to be recalculated from
underlying 1-hour data.
Caution
This tool can make irreversible changes to data. Not all data can be
recalculated with this tool.
If you have any questions about the appropriate use of this tool,
please contact CiSCO software support.
In the Data Editor menu, click Edit/View Data > Rebuild Data Points. The window
may take a minute to appear while it loads the Cedar configuration.
The Rebuild Data Points window appears.
Enter the time frame to rebuild. Select a unit from the pull down menu.
The list displays the available parameters for the selected unit.
180
Chapter 4: Data Editor
Select the parameters you wish to edit. Select individual parameters by checking
the box next to the parameter name. The Select All, Deselect All, Deselect
Above, and Deselect Below buttons are also available.
The Show PID Numbers box is used by CiSCO support personnel to display the
internal parameter IDs.
Caution
Existing data that has already been edited may be overwritten with
the recalculated data. For example, if some data points were
originally valid and you have edited them to be invalid, rebuilding that
data will probably make the data valid again.
To force edited invalid data to remain invalid, use monitor code 59.
See additional notes below.
Check the "Overwrite all values and monitor codes" box to force all data points to
be rebuilt in this operation. When this box is not checked, certain data points are
not rebuilt.
Note
When the "Overwrite all values and monitor codes" box is not
checked, data points with any of these monitor codes are not
rebuilt:
36
Valid data, generated by PLC or other non-Cedar source.
Measured value has been replaced with 200 % of
Maximum Potential Concentration (MPC) or 200 % of fullscale range.
38
Valid Data, generated by PLC or other non-Cedar source
39
Offline data, generated by PLC or other non-Cedar
source
59
Invalid Data, flagged by user; this monitor code may not
be affected when data points are rebuilt/recalculated
Note
When the "Overwrite all values and monitor codes" box is not
checked, an existing data point is not modified if the recalculated
data point has a Null (blank/empty) value and monitor code 18. This
can happen, for example, when attempting to rebuild 1-hour
averages from 1-minute data, but the 1-minute data has been
purged from the Cedar database.
181
Cedar User Manual
Caution
When the "Overwrite all values and monitor codes" box is checked,
and you are recalculating 1-hour data from 1-minute data, make sure
the 1-minute data has not been purged from the Cedar database. If
the 1-minute data has been purged, the 1-hour data will be
overwritten with Null values and monitor code 18.
Caution
When the "Overwrite all values and monitor codes" box is checked,
existing data that came from HDR may be overwritten with the
recalculated data.
Click the Rebuild button.
A message box notifies you that the rebuild operation may take some time.
A progress window displays the status of the operation. A message box notifies
you when the operation is complete. The message box indicates the number of
data points changed and the time it took to complete the operation.
Note
After data points have been modified, excess emission and/or CEMS
downtime data may need to be rebuilt (recalculated).
182
Chapter 4: Data Editor
Edit Excess Emissions and CEMS Downtimes
In the Data Editor menu, click Edit/View Data > Edit Excess Emissions and
CEMS Downtimes. The window may take a minute to appear while it loads the
Cedar configuration.
The Edit Excess Emissions and CEMS Downtimes window opens.
Calendar
By default, the window displays a 4-month calendar.
The selected day(s) have a gray background.
Days with excess emissions or CEMS downtimes have red text.
Cedar assumes that a reason needs to be entered for all excess emissions and
CEMS downtimes. Days with excess emissions and CEMS downtimes that have
a blank reason appear in red underline.
183
Cedar User Manual
Edit
To edit the selected excess emissions or downtimes, click the Edit button. A
window opens to allow you to edit the selected items.
Enter a reason, or select a reason from the list.
If an action is required, enter a reason or select a reason from the list.
Use the Add To List button to add a reason or action to the drop-down list. Use
the Delete From List button to remove a reason or action from the drop-down list.
Check the "This item can be excluded from reports" box to prevent the item from
appearing on reports. An item may be excluded from reports if allowed by the
source's permit.
Click Save to save the changes.
Alternatively, reason text, action text, and the exclude status can be edited for
single items directly in the grid.
Options
Click the Options button to see a menu of options.
Show Calendar
Shows or hides the calendar. This option is selected by default.
Show Excess Emissions
Shows or hides excess emissions. This option is selected by default. When this
option is not selected, days the calendar will ignore days with excess emissions
when it determines which days to display in red.
184
Chapter 4: Data Editor
Show CEMS Downtimes
Shows or hides CEMS downtimes. This option is selected by default. When this
option is not selected, days the calendar will ignore days with CEMS downtimes
when it determines which days to display in red.
Show Values/Limits
This option only applies to excess emissions. This option shows or hides two
additional columns, which display the value and the limit that was exceeded.
185
Cedar User Manual
Rebuild Excess Emissions and CEMS Downtimes
An excess emission occurs when a source exceeds a permit limit. A CEMS
downtime occurs when an emissions monitoring system or other monitor is not
operating or collecting valid data.
Cedar performs the initial checks for excess emissions and CEMS downtimes as
data points are collected and written to the database. Excess emissions and
CEMS downtimes may need to be rebuilt (recalculated) after data has been
modified.
In the Data Editor menu, click Edit/View Data > Rebuild Excess Emissions and
CEMS Downtimes. The window may take a minute to appear while it loads the
Cedar configuration.
The Rebuild Excess Emissions and CEMS Downtimes window appears.
Enter the time frame to rebuild. Select a unit from the pull down menu.
The list displays the exceedence and/or CEMS downtime parameters for the
selected unit.
Select the parameters you wish to edit. Select individual parameters by checking
the box next to the parameter name. The Select All, Deselect All, and Invert
Selection buttons are also available.
The Show PID Numbers box is used by CiSCO support personnel to display the
internal parameter IDs.
186
Chapter 4: Data Editor
Click the Rebuild button.
A message box notifies you that the rebuild operation may take some time.
A progress window displays the status of the operation. A message box notifies
you when the operation is complete. The message box indicates the number of
exceedences and CEMS downtimes that were added and/or deleted.
Note
If the rebuild operation added new exceedences or CEMS
downtimes, you will need to edit the reason text for the new
exceedences or CEMS downtimes.
187
Cedar User Manual
Edit CGAs and Linearity Checks
In the Data Editor menu, click Edit/View Data > Edit CGAs and Linearity Checks.
The window may take a minute to appear while it loads the Cedar configuration.
The CGAs and Linearity Checks window opens.
Click the (+) to expand the unit and view the kinds of available CGAs and
linearity checks.
Click the (+) to expand one kind of CGA or linearity check and view the individual
tests.
Click the date of a test to select that test. The test data appears on the right side
of the window.
188
Chapter 4: Data Editor
Test Info
The Test Info tab includes basic data about the test and the analyzer.
"Passed" appears if the results are within the required tolerances for all gas
levels. "Failed" appears in red if the results failed for any gas level. "Cylinder
Expired" appears if any cylinder expiration date is prior to the test date.
The Component ID and System ID are defined in the monitor plan for a Part 75
source. The Component ID and System ID are not required for non-Part 75
sources.
Note
Cedar automatically fills in the analyzer information when the CGA or
linearity check is created if the analyzer information has been
provided in the Analyzer Information window in the Data Editor.
Aborted Linearity Check
Part 75 generally requires that incomplete or aborted linearity checks are
considered as though they failed, and must be reported in the quarterly electronic
submittal to USEPA. Check the "Test aborted" box to mark the test as aborted.
The exception is linearity checks that are aborted for reasons other than the
performance of the CEMS (for example, a power outage or a closed gas cylinder
valve). Such linearity checks are not considered aborted tests and should not be
reported to USEPA. You may want to delete such a linearity check to avoid
confusion.
189
Cedar User Manual
Abbreviated Linearity Check
Part 75 allows an "abbreviated linearity check" following certain CEMS
maintenance procedures. An abbreviated linearity check consists of one injection
of each reference gas, instead of the full set of three injections of each reference
gas.
If the CEMS passes the abbreviated linearity check, the data is valid.
Abbreviated linearity checks are never reported to USEPA in the quarterly
electronic reports, although the facility must maintain a record of them. Select the
"Abbreviated Linearity" reason to prevent the linearity check from being included
in the quarterly electronic submittal to USEPA.
If the CEMS fails the abbreviated linearity check, the CEMS is out-of-control and
the data is invalid. The failed test must be reported to USEPA as an aborted
linearity check. Select a test reason ("Diagnostic" is recommended) and mark the
test as aborted.
Offline Linearity Check
Part 75 requires that linearity checks must be performed when the unit is
operating. If a linearity check is performed when the unit is not operating, select
the "Unit Offline" reason to prevent the linearity check from being included in the
quarterly electronic submittal to USEPA.
Low Gas, Mid Gas, High Gas
The gas tabs contain the gas injection data. The High Gas tab usually does not
apply to CGAs.
If the reference values or response values are changed, click Recalculate to
update the results.
190
Chapter 4: Data Editor
"Passed" appears next to the limit if one or both results are within the required
tolerances. "Failed" appears in red if neither result is within the required
tolerances.
The window also calculates and displays the range of allowable reference gas
values. The text appears red if any reference values are outside the allowable
range.
Cylinder Info
The Cylinder Info tab includes data about the reference gas cylinders. The
cylinder information comes from the data sheet or cylinder tag provided by the
gas vendor.
Cylinder information is required for linearity checks that are reported to USEPA
under Part 75. Cylinder information may be optional for CGAs. Cylinder
information may be optional for linearity checks for non-Part 75 sources.
If the cylinder expiration date is prior to the test date, a warning icon appears.
"Cylinder Expired" appears in red on the Test Info tab and the Low, Mid, or High
Gas tab.
Save changes
Click the Save button to save any changes you have made. Or click Cancel to
discard the changes.
191
Cedar User Manual
Manually add a CGA or Linearity Check
For many CEMS, a user pushes a button to initiate a CGA or linearity check and
the CEMS automatically injects the reference gases. Cedar then acquires the
gas injection data from the CEMS. This is the easiest and most common way that
Cedar acquires CGA and linearity check data.
If Cedar cannot automatically acquire the CGA or linearity check data, you can
manually add a new check.
Click the book icon for the kind of CGA or linearity check that you need to create.
Then click the New CGA or New Linearity Check button.
A window allows you to select the date of the new CGA or linearity check. Then
Cedar creates the new check and you can enter the data.
Delete a CGA or Linearity Check
To delete an unneeded CGA or linearity check, select the test date in the tree
and press the Del (Delete) key. A message box asks you to confirm that you
want to delete the test.
Warning
Use caution when deleting a CGA or linearity check. Environmental
regulations (including 40 CFR 75) require that all CGAs or linearity
checks that affect data validity must be reported.
192
Chapter 4: Data Editor
Edit Opacity Calibration Error Tests
Calibration Error Tests for opacity monitors are similar to linearity checks.
Calibration error tests for opacity monitors are specified in 40 CFR 60 Appendix
B Performance Specification 1. The test may have 3, 4, or 5 runs for each of 3
reference filters, for a total of 9, 12, or 15 runs.
Cylinder information does not apply to Opacity Calibration Error Tests.
193
Cedar User Manual
Edit CGTs and Calibration Drift Tests (Canada)
Cylinder Gas Tests (CGTs) and Calibration Drift Tests are similar to linearity
checks.
Quarterly CGTs
For a Cylinder Gas Test (CGT), the test reason must be "QA".
Environment Canada regulations require CGTs to be performed each quarter.
CGTs are specified in Report EPS 1/RG/7 Revised, section 6.3.1.
Calibration Drift Test for CEMS certification
For a Calibration Drift Test, the test reason must be "Certification". The
"Certification" test reason indicates the test is a Calibration Drift Test, and Cedar
will use the appropriate equations and pass/fail criteria. (CGTs and Calibration
Drift Tests use different equations and pass/fail criteria.)
Environment Canada regulations require daily Calibration Drift Tests during the
168-hour Operational Test Period for CEMS certification. A Calibration Drift Test
involves 3 injections of 3 gases, for a total of 9 injections. Calibration Drift Tests
are specified in Report EPS 1/RG/7 Revised, section 5.3.2.
194
Chapter 4: Data Editor
Data Editor Settings
Settings are values that are specific to your facility. Settings include, but are not
limited to, daily calibration start times for each sample train, fuel density settings
for gas and/or oil, bias factor settings, on-line setpoints for fuel, water, and steam
flows, and backflush intervals.
Settings Window
In the Data Editor menu, click Edit/View Data > Settings. The Settings window
opens.
Settings are organized into groups in the left side of the window. The settings
and their associated values are listed in the right side of the window.
Settings with a red magnifying glass icon cannot be changed. A lock near the
icon indicates that the setting is locked. This can occur if the setting is password
protected, or if the Settings screen is offline. If Cedar is unable to communicate
with the CEMS, the value reads "Offline".
Changing a Setting
To change a setting, select the setting group on the left side of the screen, and
then select the setting in the list on the right side of the screen.
If there is a default value and you want to change the setting to this default value,
click Change to Default.
195
Cedar User Manual
To enter a new value, click Change Value, or double-click on the setting in the
list.
After you enter a new value, the list displays "Updating" until the new value has
been saved.
Changing a Numeric Setting
If the setting is a numeric value, the following window appears:
Enter the new value and click OK.
Changing a Time Setting
If you are changing a time value, the following window appears:
Check the Use 24-Hour Format box if you prefer to enter the time in 24-hour
format instead of 12-hour format. Enter the new time and click OK.
Changing a Date Setting
If you are changing a date value, the following window appears:
196
Chapter 4: Data Editor
Check the "No date" box if the setting should not have any date at all.
Enter the new time and click OK.
Changing a Yes/No or True/False Setting
If you are changing a Yes/No or On/Off value and the current value is Null, the
following window appears.
Select the appropriate option and click OK.
If the current value is already Yes, No, True, or False, then the value will simply
toggle when you click Change Value.
197
Cedar User Manual
Analyzer Information
Calibration checks, CGAs, and linearity checks require additional information
about the analyzer.
In the Data Editor menu, click Edit/View Data > Analyzer Information. The
Analyzer Information window opens.
The window contains information records for every analyzer in the system.
Analyzers with two ranges (dual-range analyzers) appear twice in the list.
Click an item to select it. Click the Edit button to change the value.
Enter the new value and click OK.
198
Chapter 4: Data Editor
Data Editor Database Utilities Menu
This menu starts the Cedar Backup application and the Cedar Database Utility.
Backup/Restore Data
Opens the Cedar Backup application to backup data from the Cedar database, or
restore data to the Cedar database.
Extract Data From Database
Opens the Cedar Database Utility to extract (copy) data from the Cedar database
to a compressed file for a time range.
Extract Data From Database (One Quarter)
Opens the Cedar Database Utility to extract (copy) data from the Cedar database
to a compressed file for a calendar quarter.
Merge Data Into Database
Opens the Cedar Database Utility to merge previously extracted data into the
Cedar database from a compressed file.
Purge Old Data
Opens the Cedar Database Utility to purge (delete) old data from the Cedar
databases.
199
Cedar User Manual
CiSCO Menu
This menu provides access to features that are not commonly used, and tools
that provide diagnostic information for CiSCO software support personnel.
Enable this menu
Most of this menu is disabled until this menu item is clicked. If advanced Cedar
security is enabled, then privilege level 3 is required to enable this menu.
Change last backup date
See the Daily Auto Backup section for an explanation of this item.
Retrieve manual historical data
For some facilities, Cedar is configured to acquire data from an external
database or historian system. This tool can be used to force Cedar to retrieve
data from the external source again.
7-day drift evaluation
See the 7-Day Calibration Error Test section for an explanation of this item.
200
Chapter 4: Data Editor
7-Day Calibration Error Test
A 7-day calibration error test, also called a 7-day drift test, is typically required
when a CEMS is certified or recertified. The test consists of calibration checks
conducted over 7 consecutive operating days. Cedar has a tool to easily find
daily calibration checks to pass the 7-day test. This tool is not commonly used,
so it is in the CiSCO menu.
While this tool provides significant assistance for finding and reporting a 7-day
drift tests, a full discussion of these tests is outside the scope of this manual.
In the Data Editor menu, click CiSCO > 7-Day Drift Evaluation. The window may
take a minute to appear while it loads the Cedar configuration. The 7-Day Drift
window opens.
Setup
The Setup tab is initially selected.
Date Interval
Enter the date range that Cedar should search for calibration checks. Cedar will
only examine calibration checks in the specified date range.
201
Cedar User Manual
Include Manual Cals
When this option is selected, calibration checks that are marked as manually
initiated are included in the search. This option is selected by default.
6 of 7 Calibration Days Passed (CO ppm)
Most regulations require the CEMS to pass all calibration checks in the 7-day
period. Some regulations allow one failed calibration check in the 7-day period
for a CO CEMS. By default, this option is not selected.
3 Days Online, 4 Days Offline (Peaking)
Typically, all calibration checks in the 7-day test must be performed while the unit
is operating. Part 75 allows a 7-day test for a peaking unit to include up to 4
calibration checks on days when the unit was not operating. The unit must meet
the Part 75 definition of a "peaking unit". By default, this option is not selected.
Performance Specification
A CEMS passes a typical daily calibration check if the drift does not exceed two
times the performance specification (there are exceptions). However, to pass a
7-day calibration error test, the daily calibration drift must not exceed the
performance specification.
Select the performance specification that is appropriate for the analyzer.
•
2.5% of Span is typically used for NOx and SO2.
•
Check the "Use APS of 5 if appropriate" box to allow use of the
Alternate Performance Specification (APS). The APS is typically
allowed for Part 75 CEMS, but not for other CEMS. When this box
is checked, a CEMS passes a calibration check when the drift does
not exceed 2.5% of span or 5 ppm, whichever is less restrictive.
•
5% of Span is typically used for CO.
•
0.5 Absolute Scale is typically used for O2 and CO2. Calibration drift
may not exceed 0.5 % O2 or 0.5 % CO2.
•
Other % of Span is used for other CEMS. For example, a flow monitor
typically uses 3 % of span.
•
Other Absolute Scale may be used for cases which are not covered by
the other options.
Show All Cals in Selected Interval
When this option is selected, all calibration checks in the date range are
displayed in the results. This includes calibration checks that occurred before or
after the 7-day test. This also includes offline calibration checks that occurred
during the 7-day test.
202
Chapter 4: Data Editor
Show All Cals from Interval Start to Test End
When this option is selected, all calibration checks that occurred prior to and
during the 7-day test are displayed in the results. This includes offline calibration
checks that occurred during the 7-day test.
Show Only Cals Used to Pass Drift Test
When this option is selected, only calibration checks that were necessary to pass
the 7-day test are displayed in the results.
Show Drift Test Summary
When this option is selected, the results include an explanation of whether the 7day test was passed, or what additional calibration checks are needed to pass
the 7-day test.
Results
Select the Results tab, and the tool searches for calibration checks and displays
the results.
The selected calibration checks appear in the list. The icon next to each
calibration check indicates the pass/fail result and online/offline status. The date
and time for offline calibration checks has a gray background.
203
Cedar User Manual
Click on a the date and time of a calibration check to see the data in the fields
next to the list.
The Summary box indicates whether the CEMS passed the 7-day calibration
error test based on the calibration checks in the date range.
If necessary, select the Setup tab, modify the date range or other options, and
then select the Results tab again. The results are updated to reflect the new
selections.
Save Results
The Save button is only enabled when the Results tab is selected. Click Save to
save the results to a PDF file. If the Preview Report After Saving box is checked,
the report will open in a PDF reader.
204
Chapter 4: Data Editor
Offline calibration checks have a gray background in the report.
The options on the Setup tab affect how many calibration checks are included in
the report, and whether the test summary appears at the bottom of the report.
205
Chapter 5: Database Backup & Utility
Cedar has a Backup application to make backup copies of data and to restore
data to the Cedar databases. Cedar also has a Database Utility application that
provides other options to get selected data from and into the Cedar databases.
Cedar Backup Application
The Cedar Backup application makes backup copies of the data in the Cedar
databases.
Cedar performs an automatic backup every night. You can also:
•
Backup data manually.
•
Restore data into the Cedar database.
•
Restore the Cedar configuration.
Backup files
Each backup file is compressed and contains the data and configuration for one
day. The filenames use the Cedar site ID, the date that the data is for, and the
date and time that the backup file was generated. Here is an example of a folder
with backup files.
Cedar Database Utility
The Database Utility allows you to perform these operations on the Cedar
databases.
•
Extract (copy) data from the Cedar databases to a compressed file.
•
Merge extracted data into the Cedar databases.
•
Purge old data from the Cedar databases.
Extract and merge allow you to copy data from one SQL Server instance to
another.
Purge allows you to permanently delete old data from the databases.
Cedar User Manual
Database Tables
The restore, extract, merge, and purge operations only affect the tables the user
selects. This section describes the type of data that is stored in each table.
Constants
The Constants table stores constants and similar data that has a constant value
for a defined period of time.
DataPoints (Long Term)
The long term DataPoints table stores data points that must be retained for a
long period of time (several years). This typically includes 1-hour averages,
longer averages, and 3-minute and 6-minute opacity.
QADaily
The QADaily table stores data for daily QA checks, such as calibration checks.
QATests
The QATests table stores data for QA tests that are performed on a less frequent
basis. This includes CGAs and linearity checks.
DataPoints (Short Term)
This table stores data that does not have to be retained for a long period of time.
This typically includes 1-minute averages.
IOAuditData
The IOAuditData table stores data for I/O audits. For more information, see the
sections on starting and stopping I/O audits and generating reports for I/O audit
data.
ConfigData
The ConfigData table stores facility-specific configuration data.
UserConfigData
The UserConfigData table stores user settings.
Alarms
The Alarms table stores alarm data.
Realtime
The Realtime tables store current data and history. Realtime data can be purged.
208
Chapter 5: Database Backup & Utility
Daily Automatic Backup
Cedar performs an automatic backup every night at approximately 3:00 AM.
Cedar backs up the data for the previous day.
Cedar also backs up days for which data has been edited or modified. If many
days have been modified, the backup operation may take a long time.
Sometimes automatic backup can not be performed because, for example, the
external backup device is full or disconnected. Cedar stores the most recent date
for which data was successfully backed up. When the backup location is
available again, Cedar will back up all days since the date of the most recent
successful backup. The date of the most recent successful automatic backup is
available from the Data Editor menu. Select CiSCO > Change Last Backup Date.
Configure automatic backup location(s)
The location for the automatic backup files is specified in the Cedar5.ini file. The
BackupDir entry specifies the path for the backup files.
Cedar can copy backup files to multiple locations. This can be useful to backup
to both a local location and to a network server. In the BackupDir entry, separate
multiple locations with a semicolon. Here is an example of the BackupDir entry
with multiple locations:
BackupDir=F:\Backup;C:\Cedar\NetworkBackup
Warning
Do not use the root folder of a FAT-formatted drive for a backup
location. Some USB stick drives are factory formatted as FAT.
Due to limitations of the FAT file system, the root folder can hold a
limited number of files. If the root folder contains the maximum
number of files, no more files can be created in the root folder, even
if the drive has a large amount of free space.
Other file systems, such as NTFS and FAT32 do not have this
limitation.
To determine the file system of a drive, right-click on the drive in
209
Cedar User Manual
Windows Explorer and click Properties. The Properties window
displays the file system used for the drive.
Secondary backup location
In addition to the backup location(s) specified in the Cedar5.ini file, Cedar also
writes backup files to the SecondaryBackup folder in the Cedar folder. This path
is typically C:\Cedar\SecondaryBackup. The path will be different if the Cedar5.ini
file specifies a different path for the Cedar folder.
Alarm for low free space in backup location(s)
Cedar creates an alarm if an automatic primary backup location is getting low on
available space. The daily automatic backup operation creates the alarm if the
free space is less than 10% of the total drive space.
Disable auto backup
For auto backup to run, the "Do NOT perform auto database backup everyday"
box must be unchecked in the Data Monitor Options window.
210
Chapter 5: Database Backup & Utility
Backup Databases
The Cedar Backup application allows you to backup data to the location of your
choice.
To backup data:
•
Select the folder where the backup files will be created. The default
location is specified in the Cedar5.ini file.
•
Select the day(s) to backup.
•
Check the Faster Speed box to allow the backup operation to complete
as quickly as possible. In some cases, backing up many days of data may
interfere with the Cedar Data Recorder and prevent it from recording data
while the backup operation is in progress.
•
Click the Start button.
A window displays the status of the backup operation. A message box appears
when the operation is complete.
211
Cedar User Manual
Restore Data
The Cedar Backup application allows you to restore data from Cedar backup files
into the Cedar databases.
To restore data:
•
Select the folder for the backup files. The default location is specified in
the Cedar5.ini file. If the folder contains multiple backup files for the same
day, Cedar will use the latest file.
Note
Do not unzip the backup files. The restore operation will
unzip the files to get the necessary data.
212
•
Select the day(s) to backup.
•
Select the data to be restored. For help choosing the tables, see the
section that describes the data that is stored in each table.
•
Check the Faster Speed box to allow the restore operation to complete as
quickly as possible. In some cases, restoring many days of data may
interfere with the Cedar Data Recorder and prevent it from recording data
while the restore operation is in progress.
•
Click the Start button.
Chapter 5: Database Backup & Utility
Warning
Existing data for the selected day(s) will be deleted and
replaced with data from the backup file.
A window displays the status of the restore operation. A message box appears
when the operation is complete.
Security and permissions
A restore operation will fail if the user does not have permissions. The user must
have the CedarBackupRestore, CedarDataReader, and CedarDataWriter
database roles in basic Cedar security. Alternatively, the user may have
administrator or database owner permissions for the Cedar databases.
213
Cedar User Manual
Restore Configuration
The Cedar Backup application allows you to restore the Cedar configuration that
was in use on a specific date.
Warning
Restoring the Cedar configuration will completely replace the
existing configuration. This is only recommended after contacting
CiSCO software support.
Security and permissions
A restore operation will fail if the user does not have permissions. The user must
have the CedarBackupRestore, CedarDataReader, and CedarDataWriter
database roles in basic Cedar security. Alternatively, the user may have
administrator or database owner permissions for the Cedar databases.
214
Chapter 5: Database Backup & Utility
Extract Data
The Cedar Database Utility allows you to extract (copy) data from the Cedar
database to a compressed file. Data extraction is useful for transferring data from
one SQL Server instance to another.
The selected data is copied from the Cedar database to a compressed file. The
extract operation only copies data; it does not alter data or delete data from the
database.
To extract data from the Cedar database to a compressed file:
•
Enter the From and To dates.
•
Select the folder where the compressed file will be created.
•
The Destination File box indicates the name of the file. The Database
Utility provides a default file name. You can enter a different file name.
•
Select the tables to extract data from. For help choosing the tables, see
the section that describes the data that is stored in each table.
•
Click the Extract button.
215
Cedar User Manual
A window displays the status of the extract operation. A message box appears
when the operation is complete.
216
Chapter 5: Database Backup & Utility
Extract Data For Quarter
A common use of data extraction is to copy a quarter of data from the DAS to
another computer where the quarterly Part 75 electronic report is prepared. The
"Extract Data For Quarter" tab in the Cedar Database Utility simplifies this
common extraction scenario.
To extract data for a quarter from the Cedar database to a compressed file:
•
Check the "extract minute data..." box to extract a copy of the hourly data,
daily QA checks, other QA checks, and configuration data for an entire
quarter.
•
Check the "extract minute data" box to extract 1-minute data for a
selected day or days. Typically, 1-minute data is only needed for quarters
with a RATA. If a RATA was performed during the quarter, select the
day(s) when the RATA was run. This option generates a separate zip file
for the 1-minute data. The resulting file can be very large, even with
compression. If one file is too large, you can perform the extraction
several times with shorter time periods to create multiple smaller files.
•
Click the Extract button.
217
Cedar User Manual
A window displays the status of the extract operation. A message box appears
when the operation is complete.
The compressed file with the extracted data is placed in a the
"ExtractForDownload" folder. This folder is typically
C:\Cedar5\ExtractForDownload. The actual folder is determined by the
Cedar5.ini file.
218
Chapter 5: Database Backup & Utility
Merge Data
The Cedar Database Utility allows you to take data that was previously extracted
from Cedar databases and import it into Cedar databases.
To merge extracted data into the Cedar databases:
•
Enter the From and To dates.
•
Select the zip file that contains the extracted data.
Warning
Do not enter a time range that is larger than the data in the
source file. Existing data will be deleted and not replaced.
Note
Do not unzip the extracted files. The merge operation will
unzip the files to get the necessary data.
•
Select the tables that will receive the imported data. For help choosing
the tables, see the section that describes the data that is stored in each
table.
219
Cedar User Manual
•
Click the Merge button. If the button is disabled, see below.
A window displays the status of the merge operation. A message box appears
when the operation is complete.
Merge button disabled
The Merge button is disabled by default.
To enable the Merge button, start the Cedar Data Editor. From the menu, select
Database Utilities > Merge Data Into Database.
Security and permissions
A merge operation will fail if the user does not have permissions. The user must
have the CedarBackupRestore, CedarDataReader, and CedarDataWriter
database roles in basic Cedar security. Alternatively, the user may have
administrator or database owner permissions for the Cedar databases.
220
Chapter 5: Database Backup & Utility
Purge Data
The Cedar Database Utility allows you to purge (delete) old data from the Cedar
databases.
To purge old data from Cedar databases:
•
Select the month and year. Data prior to the selected month will be
deleted.
Warning
All data prior to the purge date in the selected table(s) will be
deleted. Make sure you have backup files for data prior to the
purge date.
•
Select the tables to purge. For help choosing the tables, see the section
that describes the data that is stored in each table.
•
Check your selections carefully before clicking the Purge button.
221
Cedar User Manual
Caution
Check the purge date carefully before clicking the Purge
button.
Check the table selection carefully before clicking the Purge
button.
•
Click the Purge button. If the button is disabled, see below.
A window displays the status of the purge operation. A message box appears
when the operation is complete.
Purge button disabled
The Purge button is disabled by default.
To enable the Purge button, start the Cedar Data Editor. From the menu, select
Database Utilities > Purge Old Data.
Security and permissions
A purge operation will fail if the user does not have permissions. The user must
have the CedarBackupRestore, CedarDataReader, and CedarDataWriter
database roles in basic Cedar security. Alternatively, the user may have
administrator or database owner permissions for the Cedar databases.
222
Chapter 6: Cedar Security
Overview
Cedar security has two parts: basic and advanced.
Basic Cedar security determines a user's permissions for the Cedar database.
Basic security is configured in SQL Server. Most importantly, basic Cedar
security determines whether a user has read-only or read-write permissions for
the Cedar database.
Advanced Cedar security affects users with read-write permissions. It provides a
finer level of control over Cedar features that can modify data. Most facilities do
not use advanced Cedar security.
SQL Server enforces basic security at the database level. Advanced Cedar
security is enforced at the application level.
Cedar User Manual
Basic Cedar Security - Create User
Basic Cedar security is configured in SQL Server Management Studio (SSMS).
SQL Server logins typically use Windows authentication or SQL Server
authentication. Windows authentication is more secure, but requires Active
Directory for access from remote computers. SQL Server authentication is less
secure, but access from remote computers is easier to set up. A full discussion of
SQL Server login configuration is outside the scope of this manual. See
Microsoft's SQL Server documentation or other resources for more information.
New SQL Server Login
To add a new user or account, navigate to Security > Logins in the SSMS Object
Explorer window. Right-click on Logins and select "New Login".
The Login Properties window appears.
224
Chapter 6: Cedar Security
For Windows authentication, select the account or group. For SQL Server
authentication, enter the name and password for the new login.
In the Login Properties window, configure the user mapping (see below).
Existing SQL Server Login
To configure basic Cedar security for an account or group that has an existing
SQL Server login, locate the login under Security > Logins in the SSMS Object
Explorer window. Right-click on the login name and select "Properties".
225
Cedar User Manual
The Login Properties window appears. Configure the user mapping.
Configure SQL Server Login: User Mapping
Use the Login Properties window to map a login to the predefined Database
Roles.
1. Select User Mapping on the left.
2. Select the Cedar database, such as Cedar5Alarms.
3. Check the database role membership boxes to assign database roles to the
login.
4. Repeat steps 2 and 3 for each Cedar database.
5. Click OK to save the changes.
226
Chapter 6: Cedar Security
Read-only User
For a read-only user, assign only the CedarDataReader role to the login. Do this
for each of the Cedar databases.
Read-write User
For a read-write user, assign the CedarDataReader and CedarDataWriter roles
to the login. Do this for each of the Cedar databases.
227
Cedar User Manual
Basic Cedar Security - Database Roles
Database roles define a set of permissions which can easily be applied to logins
in SQL Server Management Studio (SSMS).
Cedar defines the following database roles. Some databases do not define all
these roles.
Role
Description
CedarDataReader
Defines read permissions for the database. This
role is used for both "read-only" and "read-write"
users. This role allows "read-only" users to
acknowledge alarms, but not to write or modify
any other data.
CedarDataWriter
Defines write permissions for the database. This
role is used for "read-write" users. This role is
required for all users that will write or modify
Cedar data.
CedarBackupRestore Defines additional permissions required for
restoring backup data, merging extracted data,
and/or purging old data.
CedarWebApp
228
Is used for Cedar web applications. This database
role is needed for the account which runs the IIS
web site. This role is not used for typical user
accounts.
Chapter 6: Cedar Security
Advanced Cedar Security - Accounts
To configure advanced Cedar security, open the Cedar Data Editor, and click File
> Security Setup > Accounts.
First time configuration
To configure advanced Cedar security for the first time, the Cedar Data Editor
must run with administrative privileges. You may see this message box.
Close the Cedar Data Editor. Right-click on the Cedar Data Editor icon, and click
"Run as administrator".
Now you can configure advanced Cedar security.
In the Cedar Data Editor menu, click File > Security Setup > Accounts. This
window appears:
229
Cedar User Manual
Advanced Cedar security is disabled by default. (Basic Cedar security is always
enabled and cannot be disabled.) Select the "Enable" option to enable advanced
Cedar security.
Privilege levels
Advanced Cedar security defines four privilege levels. Level 0 has the least
privileges, and Level 3 has the most. Each privilege level has all the permissions
of the lower level, plus any privileges defined for its level. Only Level 3 users and
Windows administrators may change the advanced Cedar security settings.
Non-administrative users are assumed to be in Level 0 unless they have been
assigned to a higher level. Level 0 read-write users are allowed to utilize Cedar
features for which no minimum privilege level has been selected.
Windows administrators have Level 2 permissions by default, plus they can
change the advanced Cedar security settings. Windows administrators may
optionally be assigned to Level 3.
230
Chapter 6: Cedar Security
Recommended configuration
For Active Directory accounts, CiSCO's recommendation is to create an Active
Directory group for each privilege level. For example, create three groups named
"Cedar Level 1", "Cedar Level 2", and "Cedar Level 3". Assign the Active
Directory groups to their appropriate privilege levels in this Cedar window. Then
add individual users to the appropriate groups in Active Directory.
SQL logins cannot be managed by groups, so each individual read-write SQL
login must be assigned to a privilege level in this window.
Windows user accounts
To add a Windows or Active Directory user or user group to a Cedar privilege
level, click the "Add Windows User" button. This window appears.
The upper left box displays a partial list of existing groups. Click the Add button
to add an existing group to the box on the right.
You can enter the name of any account or group in the lower left box, and click
Add to add it to the box on the right.
When you click OK, the account(s) and group(s) that are listed in the box on the
right will be added to the privilege level.
SQL Logins
To add a SQL Server login to a Cedar privilege level, click the "Add SQL Login"
button. This window appears.
231
Cedar User Manual
Enter the SQL Server logins. Separate multiple logins with commas.
When you click OK, the login(s) will be added to the privilege level.
Permissions
After advanced Cedar security has been enabled and user accounts have been
assigned to privilege levels, you can set permissions for the privilege levels.
232
Chapter 6: Cedar Security
Advanced Cedar Security - Permissions
To configure advanced Cedar security, open the Cedar Data Editor, and click File
> Security Setup > Permissions. The Permissions menu item is disabled when
advanced Cedar security is not enabled. Use the Accounts window to enable
advanced Cedar security, and then the Permissions window will be enabled. The
Permissions window may take a minute to appear while it loads the Cedar
configuration.
The Permissions window lists many operations that can change data or settings
within Cedar. You can configure the minimum privilege level required for these
operations.
Settings
The minimum privilege level can be set for each individual setting.
Click one of the "Set All" buttons to set the minimum privilege level for all
settings.
Right-click on a setting to select the minimum privilege level.
233
Cedar User Manual
Data Monitor
These items apply to the Cedar Data Monitor.
Data Editor
These items apply to the Cedar Data Editor.
234
Chapter 6: Cedar Security
Report Generator
These items apply to the Cedar Report Generator.
235
Cedar User Manual
Delete User
To delete a user, follow these steps:
1. Delete the SQL Server login.
2. Delete the user from each SQL Server Cedar database.
3. If advanced Cedar security is enabled, remove the user from any Cedar
privilege levels.
Delete SQL Server Login
Active Directory Groups
A user may have access to Cedar because the user is a member of
an Active Directory group. A SQL Server login is defined for the
group rather than for the individual user.
If this is the case, delete the user from the Active Directory group
and ignore this step.
Open SQL Server Management Studio (SSMS).
To delete an existing login, navigate to Security > Logins in the SSMS Object
Explorer window. Right-click on the login that you want to delete.
236
Chapter 6: Cedar Security
Select "Delete" from the menu. The Delete Object window appears.
237
Cedar User Manual
Click OK.
A message box cautions that more steps are required to completely remove the
user from the database.
Click OK.
SSMS deletes the login.
Note
To completely delete the user from SQL Server, the user must also
be deleted in each Cedar database. Perform the following procedure
for each Cedar database.
238
Chapter 6: Cedar Security
Delete User from Cedar Databases
Active Directory Groups
A user may have access to Cedar because the user is a member of
an Active Directory group. A SQL Server login and database users
are defined for the group rather than for the individual user.
If this is the case, delete the user from the Active Directory group
and ignore this step.
To delete an existing user, navigate to Databases > (database name) > Security
> Users in the SSMS Object Explorer window. Right-click on the user that you
want to delete.
239
Cedar User Manual
Select "Delete" from the menu. The Delete Object window appears.
240
Chapter 6: Cedar Security
Click OK.
SSMS deletes the user.
Repeat the above steps to delete the user from each Cedar database. The
databases are:
•
•
•
•
•
Cedar5Alarms
Cedar5Config
Cedar5Data
Cedar5DataShortTerm
Cedar5Realtime
Delete User in Advanced Cedar Security
Skip this step if advanced Cedar security is not enabled.
Active Directory Groups
A user may have access to Cedar because the user is a member of
an Active Directory group. The group may be assigned to a Cedar
privilege level. The individual user is not assigned to a Cedar
241
Cedar User Manual
privilege level.
If this is the case, delete the user from the Active Directory group
and ignore this step.
Open the Cedar Data Editor.
In the Cedar Data Editor menu, click File > Security Setup > Accounts. This
window appears:
Look for the user in the list for each privilege level.
Highlight the user and click Remove.
Click OK to save the changes.
242
Glossary
4
40 CFR 60: Part 60 of Chapter 40 of the U.S. Code of Federal Regulations.
Part 60 has many detailed requirements for monitoring, handling, and
reporting air emissions data.
40 CFR 75: Part 75 of Chapter 40 of the U.S. Code of Federal Regulations.
Part 75 has many detailed requirements for monitoring, handling, and
reporting air emissions data.
40 CFR 98: Part 98 of Chapter 40 of the U.S. Code of Federal Regulations.
Part 98 has many detailed requirements for monitoring, handling, and
reporting greenhouse gas emissions data.
C
CEM: Continuous Emission Monitor. CEM and CEMS are often used
interchangeably.
CEMS: Continuous Emission Monitoring System. CEM and CEMS are often
used interchangeably.
CEMS Downtime: CEMS downtime occurs when an emissions monitoring
system or other monitor is not operating or collecting valid data.
CGA: Cylinder Gas Audit. A quarterly test required by 40 CFR 60 for many
gas monitoring systems. Typically requires 3 injections of 2 reference
gases. Is similar to a Linearity Check.
CGT: Cylinder Gas Test. Specified by Environment Canada, Report EPS
1/PG/7. Is similar to a linearity check.
CO: Carbon monoxide.
CO2: Carbon dioxide.
D
DAHS: Data Acquisition and Handling System. This term is defined by Part
75 to include software that substitutes missing data according to the Part
75 routines.
DAS: Data Acquistion System. The combination of a computer and software
that acquires data from measurement systems.
E
EPA: See USEPA.
Exceedence: See Excess Emission.
Excess Emission: An Excess Emission occurs when a source exceeds a
permit limit.
Cedar User Manual
G
GHG: Greenhouse Gas. Many gases contribute to the global "greenhouse
effect". Common GHGs include CO2 (carbon dioxide), CH4 (methane),
and N2O (nitrous oxide).
H
HDR: Historical Data Retrieval. A CEMS PLC may store backup averages,
which allows the DAS to acquire data for short periods when the DAS is
not running.
Hg: Mercury.
L
Linearity Check: A quarterly test required by 40 CFR 75 for many gas
monitoring systems. Typically requires 3 injections of 3 reference gases.
Is similar to a Cylinder Gas Audit.
M
MER: Maximum Emission Rate. Is defined in a 40 CFR 75 monitoring plan.
Monitor Code: A Cedar monitor code indicates the validity of a data point.
Monitor Downtime: See CEMS Downtime.
MPC: Maximum Potential Concentration. Is defined in a 40 CFR 75
monitoring plan.
N
NH3: Ammonia. Is commonly used to control NOx emissions.
NOx: Oxides of nitrogen. Includes NO and NO2.
O
O2: Oxygen.
Opacity Calibration Error Check: A quarterly test for opacity monitors
specified in 40 CFR 60 Appendix B Performance Specification 1. Has 3-5
runs for each of 3 reference values. Is similar to a Linearity Check.
P
Part 60: See 40 CFR 60.
Part 75: See 40 CFR 75.
PLC: Programmable Logic Controller, often used to control CEMS hardware
and provide data to a DAS.
244
Glossary
PM: Particulate matter.
PM10: Particulate matter, with a nominal diameter of 10 microns.
PM2.5: Particulate matter, with a nominal diameter of 2.5 microns.
PPM: Parts per million. 1 percent = 10,000 ppm.
Process Code: A process code indicates the state of the process relative to
certain permit conditions. Typical process codes are: Unit Offline, Startup,
Shutdown, and Normal Operation.
R
RATA: Relative Accuracy Test Audit. Compares the CEMS emission data
against emission data from a "reference method". Is typically performed
by a third-party test team. Is commonly performed on an annual basis, but
shorter and longer intervals are possible.
Report EPS 1/PG/7 (Revised): CEMS requirements for Environment
Canada, titled "Protocols and Performance Specifications for Continuous
Monitoring of Gaseous Emissions from Thermal Power Generation".
S
SCAQMD: South Coast Air Quality Management District is the agency
responsible for managing air pollution in the greater Los Angeles,
California area.
SCR: Selective catalytic reduction (SCR) is a means of controlling NOx
emissions with the aid of a catalyst by injecting ammonia or urea into a
stream of exhaust gas.
SNCR: Selective non-catalytic reduction (SNCR) is a means of controlling
NOx emissions in solid-fuel power plants by injecting ammonia or urea
into a stream of exhaust gas, without the aid of a catalyst.
SO2: Sulfur dioxide.
U
USEPA: United States Environmental Protection Agency.
245