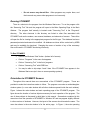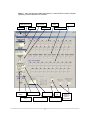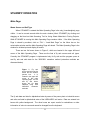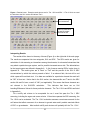
1
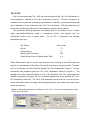
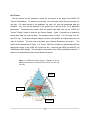
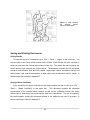
2005-03
Final Report
Screening Tool for Using
Waste Materials in
Paving Projects
(STUWMPP)
Technical Report Documentation Page
1. Report No.
2.
3. Recipients Accession No.
MN/RC – 2005-03
4. Title and Subtitle
5. Report Date
SCREENING TOOL FOR USING WASTE MATERIALS IN
PAVING PROJECTS (STUWMPP)
December 2004
7. Author(s)
8. Performing Organization Report No.
6.
Michael S. Friend, Paul R. Bloom, Thomas R. Halbach, Kim E.
Grosenheider, Marilyn R. Johnson
9. Performing Organization Name and Address
10. Project/Task/Work Unit No.
University of Minnesota
Department of Soil, Water and Climate
1991 Upper Buford Circle
St. Paul, Minnesota 55108
11. Contract (C) or Grant (G) No.
12. Sponsoring Organization Name and Address
13. Type of Report and Period Covered
Minnesota Department of Transportation
Research Services Section
395 John Ireland Boulevard Mail Stop 330
St. Paul, Minnesota 55155
Final Report 2004
(c) 81655
(wo) 81
14. Sponsoring Agency Code
15. Supplementary Notes
http://www.dot.state.mn.us/stateaid/res_flyash.html .
http://www.lrrb.org/PDF/200503.pdf
The website which houses the actual software can be found at:
The report can be found at:
16. Abstract (Limit: 200 words)
The properties of soft fine grained soils sometimes require enhancement to facilitate road construction and
increase long term road durability. One option for roadbed stabilization is to treat the soil with fly ash, which
possesses several beneficial engineering properties. However, the concentrations of elements in fly ash may
potentially pose an unacceptable risk to human health. The Screening Tool provides straightforward
assessments of this hazard. This tool is intended to be used as part of the assessment of due diligence of these
risks. The Screening Tool does not give permission for the use of fly ash and the screening tool was not
designed to predict the effects on surface waters, which are regulated by the Minnesota Department of Natural
Resources (DNR) and Minnesota Pollution Control Agency (MPCA). This computer program provides
guidance to users, but users must make sure the proposed project complies with all applicable and relevant rules
and regulations that govern use of fly ash. Details of the calculation and further discussion of the importance of
site-specific data is included in this document.
17. Document Analysis/Descriptors
18.Availability Statement
Fly ash
Soil stabilization
Environmental screening
No restrictions. Document available
from: National Technical Information
Services, Springfield, Virginia 22161
19. Security Class (this report)
20. Security Class (this page)
Unclassified
Unclassified
21. No. of Pages
38
22. Price
Screening Tool for Using Waste Materials in Paving Projects
(STUWMPP)
Local Road Research Board
Mn/DOT Office of Research Services
Mail Stop 330
395 John Ireland Boulevard
St. Paul, Minnesota 55155
(651) 282-2274
Developed by:
Michael S. Friend
Paul R. Bloom
Thomas R. Halbach
Kim E. Grosenheider
Marilyn R. Johnson
University of Minnesota
Information in this document, including URL and other Internet Web site references, is subject to change
without notice. Complying with all applicable copyright laws is the responsibility of the user. Without
limiting the rights under copyright, no part of this document may be reproduced, stored in or introduced
into a retrieval system, or transmitted in any form or by any means (electronic, mechanical, photocopying,
recording, or otherwise), or for any other purpose, without the express written permission of the Local
Road Research Board.
© 2004 LRRB. All rights reserved.
The Local Road Research Board makes no representation or warranties, expressed or implied, with
respect to the reuse of the data provided by the STUWMPP program, regardless of its format or the
means of its transmission. There is no guarantee or representation to the user as to the accuracy,
currency, suitability, or reliability of this data for any purpose. The user accepts the data as is, and
assumes all risks associated with its use. By acceptance of this data, the user agrees not to transmit this
data or provide access to it or any part of it to another party unless the user shall include with the data a
copy of this disclaimer. The Local Road Research Board assumes no responsibility for actual or
consequential damage incurred as a result of any user's reliance on this data. The Local Road Research
Board shall not be liable for any direct, indirect, special, incidental, compensatory damages or claims
resulting from the use of this software even if the Local Road Research Board has been advised of the
possibility of such potential loss of damage. User agrees to indemnify and hold the Local Road Research
Board harmless from any demands, claims, or suits by a third party for loss, judgment, damages, or
expenses (including attorney's fees) arising out of or related to misuse of the software by user or any
other person.
Microsoft Access, Microsoft Word, Windows, Windows 98, NT, and XP are either registered trademarks
or trademarks of Microsoft Corporation in the USA or other countries. © 1983-2004 Microsoft
Corporation. All rights reserved.
WinZip is a registered trademark of WinZip Computing, Inc.
Copyright© 2004 WinZip Computing, Inc.
NOTE: Screenshots of the program shown in this document were taken in Microsoft Windows XP and
may not appear exactly the same on other operating systems.
Contents
INTRODUCTION .......................................................................................................................... 1
About This Document ....................................................................................................... 1
Disclaimer ........................................................................................................................ 1
STUWMPP Overview ....................................................................................................... 1
Confidence Intervals and Safety Factors .......................................................................... 3
GETTING STARTED .................................................................................................................... 4
Installation ........................................................................................................................ 4
Running STUWMPP ......................................................................................................... 5
Orientation to STUWMPP Screens .................................................................................. 5
STUWMPP OPERATION ............................................................................................................ 8
Main Page ......................................................................................................................... 8
Waste Source and Soil Type ................................................................................. 8
Mixture Percent ..................................................................................................... 9
Calculating Results................................................................................................ 9
Interpreting Results ............................................................................................. 10
Accessing Databases for Other Soil and Fly Ash Data ....................................... 11
Changing Extraction Methods ............................................................................. 12
Confidence Intervals and Safety Factors............................................................. 12
Evaluation of Results........................................................................................... 14
Site-specific Data for Fly Ash and Soils .......................................................................... 14
Tier 2 SLV Page.............................................................................................................. 16
Soil Texture ......................................................................................................... 17
Soil pH................................................................................................................. 18
Climate Region.................................................................................................... 18
Mixing Depth and Depth to Ground Water .......................................................... 18
Saving and Printing Documents ...................................................................................... 19
Saving Results .................................................................................................... 19
Saving a Waste Certificate .................................................................................. 19
Printing ................................................................................................................ 20
Help................................................................................................................................. 20
Appendix A: SRV and SLV Criteria.............................................................................. 21
Appendix B: Guidelines and rules for utilizing fly ash .............................................. 23
Appendix C: Recommended procedures for soil and waste sampling
and analysis ............................................................................................. 24
Appendix D: Details on the use of SRV and SLV criteria in STUWMPP................... 26
Appendix E: Multiple Layer Mixing Routine (for future use)..................................... 28
Appendix F: Sample of Detailed Output...................................................................... 29
Appendix G: Sample of Waste Certificate................................................................... 32
______________________________________________________________________
i
List of Figures
Figure 1. Main operating page within main window. Labels show the location of
Objects necessary for basic operation of STUWMPP...................................... 6
Figure 2. Fly ash source and soil type list boxes and the mixture percent box.
Located in the upper left corner of the main operating page. The soil and
fly ash boxes shown are for data obtained using EPA 3050/3051
extraction methods. ......................................................................................... 7
Figure 3. Button to run the calculations as well as options for using site-specific data
and Tier 2 SLV. Located on left side of main operating page. ......................... 8
Figure 4. Results boxes. Example results shown are for Tier 1 SLV and SRV. If
Tier 2 SLVs are used the title above the SLV section will indicate Tier 2. ....... 9
Figure 5. Decision tree for pass/fail determination. ...................................................... 10
Figure 6. Main window menu bar showing how to select data for different extraction
methods. ...................................................................................................... 11
Figure 7. Main window menu bar showing where to select different confidence
intervals and safety factors. .......................................................................... 12
Figure 8. Warning message that appears if only one or two soil datapoints for the
selected soil type is in the database. A similar warning is shown for waste
materials if only one or two analyses are available. ...................................... 13
Figure 9. Site-specific data page. Used to enter any data that is not included in the
database. ..................................................................................................... 14
Figure 10. Adjustable parameters for calculation of Tier 2 SLVs. These are located
below the results section of the main page. ................................................ 15
Figure 11. USDA soil texture triangle. Example of how to determine the texture of a
soil that is 37% sand, 41% silt, and 22% clay. ............................................ 16
Figure 12. Map showing the different climate regions of Minnesota. ........................... 18
Table A-1. List of Tier 1 SLV and SRV for each element. ............................................ 20
Table A-2. List of target organs and the elements of concern for each that are
used in assessing potential SRV risks for elements that interact. .............. 21
Figure E-1: Multiple layer mixing page. Used to input data from projects that
involve mixing of layers that are part of the existing pavement. ................. 27
______________________________________________________________________
ii
INTRODUCTION
About This Document
This User Guide is intended to provide basic information that will enable users to take
advantage of the features in the Screening Tool for Using Waste Materials in Paving Projects
(STUWMMP) version 1.1 and to begin evaluating the potential environmental concerns for using
waste materials in paving projects.
Disclaimer
This computer program provides guidance for users, but users must make sure the
proposed project complies with all applicable and relevant rules and regulations that govern use
of fly ash. Beneficial use of fly ash comes under Minnesota Rule 7035.2860 “Beneficial use of
solid waste” (See Appendix B for more information) which is administered by the Minnesota
Pollution Control Agency (MPCA). The MPCA Soil Leaching Values (SLV) and Soil Reference
Values (SRV) limits used in STUWMPP are based on human health risk criteria used to
safeguard against direct excessive human exposure to contaminants in soil and soil dust and
indirect exposure due to transport of contaminants to ground water. These limits are protective
of human health but are not necessarily protective of all organisms living in surface waters. This
screening tool was not designed to predict effects on surface waters, which are regulated by the
Minnesota Department of Natural Resources (DNR) and Minnesota Pollution Control Agency
(MPCA). The MPCA and DNR generally require ash products not be placed in areas adjacent
to lakes, streams and wetlands, or in soils which have a normal seasonal water table within
three feet of the surface.
STUWMPP Overview
Clayey soils may need enhancement for increased road durability. One option for roadbed
modification/stabilization is to treat subsoil with fly ash, which possesses several beneficial
engineering properties. However, the concentrations of elements in fly ash may potentially pose
an unacceptable risk to human health.
STUWMPP is a calculation tool that provides a
straightforward assessment of this concern. This tool is intended to be used as part of the
assessment of due diligence (see Appendix B for a definition) of these risks. STUWMPP does
______________________________________________________________________
1
NOT give permission for the use of fly ash. Users must comply with all applicable and relevant
rules and regulations governed by the MPCA and the DNR (see Appendix B).
STUWMPP’s evaluation of hazard is based on two models developed by the MPCA, "Risk
Based Guidance for the Soil Human Health Pathway" and "Risk Based Guidance for the Soil
Leaching Pathway”. Twenty-one elements, mostly metals, have been identified by the MPCA
when found at elevated concentrations to potentially exceed acceptable risk limits. STUWMPP
calculates the concentration of these elements of concern (EOC) in the soil/ash mixture. The
human health pathway analysis has set upper limits for EOC, known as soil reference values
(SRV). The soil leaching pathway analysis has set upper limits for EOC, known as soil leaching
values (SLV).
STUWMPP uses the SRV and SLV to examine the soil/ash mixture’s EOC
concentration and calculates a pass or fail result. Details of the calculation of pass/fail are
covered later in this document.
There are two ways for STUWMPP to obtain ash and soil EOC concentrations needed for
the pass/fail determination. One way is for STUWMMP to use existing EOC data, which has
been compiled into a Microsoft Access file, “database.mdb”. This data can be viewed by going
to the “Screening Tool” folder in the “Programs Files” folder on Drive C. Note the database has
been locked and only the LRRB has the ability to make edits. The database however must be
used with care. Limited soil data are available and considering the high variability of EOC
concentrations in soils it is unlikely that any available data will represent exactly the proposed
construction site. The soils database is most useful in the early stages of planning. The ash
database is more extensive, but the size of the dataset varies by ash producer.
EOC
concentration in ash is directly related to fuel source, boiler design, and pollution control
devices. If any of the mentioned parameters change, new EOC data will need to be generated.
The second way for STUWMPP to obtain ash and soil EOC concentrations is for the user to
input data directly into the model using the “Input Site Data” button. Before implementation of a
project, site-specific data for soils will be necessary. It may also be necessary to use sitespecific fly ash data if coal source, boiler design, or pollution control devices have changed
since the earlier data was acquired, or existing data is not sufficient. Further discussion of the
importance of site-specific data is given later in this document.
______________________________________________________________________
2
Confidence Intervals and Safety Factors
Prediction of the composition of a particular sample of soil or ash using a database requires
knowledge of the variability in the data in the database. STUWMPP can calculate the mean and
standard deviation (SD) of the data. The SD is used to compute confidence interval (CI) values,
which are used to adjust the mean values so that comparisons with SLV and SRV limits can be
made with a defined level of confidence.
This is done using one of two options: 95%
“Confidence Interval” or 99% “Confidence Interval”. Calculations based on 95% confidence
compare the SRV and SLV limits to the mean plus two standard deviations. Calculations based
on the 99% confidence compare the SRV and SLV limits to the mean plus three standard
deviations. If an even greater assurance that the limits are being met is desired, a “Safety
Factor”, 20% of the mean, can be added to the data in addition to the two or three standard
deviation level. Note, adding a 20% factor on top of a 99% CI can result in a number that is
1
defined as an “outlier” using US-EPA methodology .
Given the conservative protective
assumptions already built into the SRV and SLV criteria there should be a very compelling
reason before using this option. When using the database for due diligence environmental
assessment during project implementation comparison must be made using at least the 95% CI.
For the soil database, where there are generally two or fewer data points for any one soil
type, SD values cannot be calculated directly. Single data points or mean values of with no CI
can be used for early stage planning. Also 95% and 99% CI “estimates” can be generated
using the SD values, using the whole soil database. The estimated CI values (95% or 99%)
imposed using this estimation are necessarily higher than would be expected if replicate data
were available for each soil type. Similar estimates of CI are made for the fly ash database if
there are only one or two entries in the database.
1
US EPA (QA/G-9) Guidance for Data Quality Assessment: Practical Methods for Data Analysis (July 00)
______________________________________________________________________
3
GETTING STARTED
Installation
The program will be available in two formats: by CD and by download. If you are replacing
an existing version of STUWMPP with a newer version, be sure to uninstall the old version first.
From CD
•
Insert CD
•
Double-click on “My Computer”
•
Double-click on the CD drive (labeled “STUWMPP Install”)
•
Double-click on “setup.exe” file
•
Installation begins
The program must be installed into the directory "C:\Program Files\ Screening Tool”
From Downloaded Version
•
Open the file using Winzip
o
A freeware version of Winzip is available at
http://www.winzip.com/downwz.htm.
•
Extract files into a new folder
o
Neither the location nor name of the folder is important as long as you can
find the folder.
•
Double-click on “setup.exe” file
o
The program must be installed into the directory "C:\Program Files\
Screening Tool".
•
Installation begins
To Uninstall
•
Click on the Windows “Start” Button
•
Click on “Control Panel”
•
Click on “Add/Remove Programs”
•
Remove the listing for Screening Tool.
______________________________________________________________________
4
o
Do not remove any shared files. Other programs may require them, and
their removal may cause other programs to run incorrectly.
Running STUWMPP
There is a shortcut to the program from the Windows Start menu. To run the program click
the “Screening Tool” link and the program will open to the Main Operating Page in the Main
Window.
The program itself actually is located under "Screening Tool" in the "Programs"
directory.
The other shortcuts in this directory are linked to other files associated with
STUWMPP such as the readme, user manual, database, and elements of concern. These links
will open the file for viewing in the appropriate program for the file type. The database has been
password protected and cannot be modified. All database revisions will be carried out by LRRB
and may be available for download. Changing the name or location of any of the necessary
files could result in STUWMPP functioning incorrectly.
To Run STUWMPP
•
Click on the Windows “Start” button (bottom left of screen)
•
Click on “Programs” in the menu that appears
•
Click on “Screening Tool” in the list of programs
•
Click on “Screening Tool” with LRRB icon
•
You may be able to skip steps 2 and 3 here if the STUWMPP icon appears in the
Windows Start menu (as it does on some operating systems).
Orientation to STUWMPP Screens
Throughout this manual there are screenshots of the STUWMPP program.
These are
provided to make the instructions easier to follow. The program runs under a mother/daughter
window system (i.e. one main window with all other windows opened inside the main window).
Figure 1 shows the main window and main operating page of the STUWMPP program. The
figure shows the location of various objects necessary for basic operation of the program. The
use of these objects is discussed in detail later in this manual. Screenshots contained in this
manual are from the operation of STUWMPP in Windows XP and may appear slightly different
in other versions of windows. However, the layout of the screens should remain the same. The
menu bar shown in the main window is for the active page. In Figure 1, the main operating
______________________________________________________________________
5
page is active and the menu bar is for this page. However, when other pages are active, the
menu bar will change according to the needs of the particular active page. The toolbar does not
change.
______________________________________________________________________
6
Figure 1. Main operating page within main window. Labels show the location of objects
necessary for basic operation of STUWMPP.
Waste Source list
Menu Bar
Calculate
Button
Soil Type list
Mixture
Toolbar
Tier 2 SLV Select
Sand, Silt, and
Clay
Soil Texture
Site-specific Data
SLV
SRV
Target Organ
Soil
pH
Climate Region
Depth of
mixture and
depth to
ground water
______________________________________________________________________
7
STUWMPP OPERATION
Main Page
Waste Source and Soil Type
When STUWMPP is started the Main Operating Page is the only (inner/daughter) page
visible. It can be moved around within the main window (titled: STUWMPP) by clicking and
dragging on the blue bar titled Screening Tool for Using Waste Materials in Paving Projects.
While STUWMPP is running this Main Operating Page remains visible. If the Main Operating
Page is closed by accident, click on “File”→ “Load Main Page” on the Menu bar on the
outer/mother window and the Main Operating Page will reload. The Main Operating Page is the
window for all data input and display of results.
There are two list boxes shown in Figure 2, which are located in the upper left-hand
corner of the Main Operating Page. These are the lists of fly ash sources and soil types.
Currently the STUWMPP program is implemented only for fly ash and the program opens to
coal fly ash and soils data for the 3050/3051 extraction method (extraction methods are
discussed below).
Figure 2: Fly ash
source and soil type list
boxes and the mixture
percent box.
It is
located in the upper left
corner of the main
operating page. The soil
and fly ash boxes
shown are for data
obtained using EPA
3050/3051
extraction
methods.
The fly ash data are listed in alphabetical order by name of the power plant or industrial source
and soils are listed in alphabetical order of the USDA-NRCS soil series. Data are entered into
boxes with yellow background. The other boxes are report results for calculations or other
information of value to users and cannot be changed from the keyboard.
______________________________________________________________________
8
Mixture Percent
The mixture percentage is the dry weight concentration of the waste material in the final
soil/fly ash mixture. The default value is 10%, indicated just below the waste source and soil
type list boxes (Figure 2). Only whole percentages can be entered. Decimal and fractions of a
percent cannot be entered.
Calculating Results
To calculate the Tier 1 SRV and SLV comparisons for the mixture click on the "Calculate"
button (Figure 3).
Figure 3: Button to run the
calculations as well as
options for using sitespecific data and Tier 2
SLV. It is located on left
side of main operating
page.
Example 1. Basic Run Using 3050/3051 Databases
•
Select ash source using “Fly Ash” dialog box
•
Select soil series using “Soil Type” dialog box
•
Enter the % fly ash using “Waste/Soil Mixture (%)” dialog box
•
Click the “Calculate” button
•
Results for Tier 1 SRV and Tier 1 SLV are displayed (see Figure 4)
Unless the CI (Confidence Interval) option has been reset, as discussed below, results will be
calculated using only the data means and no confidence interval.
______________________________________________________________________
9
Figure 4: Results boxes. Example results shown are for Tier 1 SLV and SRV. If Tier 2 SLVs are used
the title above the SLV section will indicate Tier 2.
SRV assuming
no interactions
SRV for interactions
in specific organs
and cancer risk
Interpreting Results
The results will be shown in the array of boxes (Figure 4) on the right side of the main page.
The results are separated into two categories, SLV and SRV. The SRV results are given for
calculation of risk assuming no interactions among the elements, for elemental interactions that
may attack a particular organ system, and for possible increased cancer risk. The abbreviations
for the target organs are defined in Appendix A. A list of cancer-causing EOCs is also given in
Appendix A. The results given are a "Pass" or "Fail" and the percent of the SLV or SRV
concentrations by which the mixture passed or failed. If an element fails, the text will be red
while a pass will have black text. If no data are available for a particular element the result will
be "ND" in blue text. Notice that in the SLV section, the elements Mn and Tl and in the SRV
section Mo and Sr have a result of "NA" (not applicable). This means that these elements are
not relevant in the SLV/SRV calculation.
This indicates that there are no Soil
Leaching/Reference Values for these particular elements. The Tier 1 SLVs and SRVs are listed
in Appendix A.
For a soil/fly ash mixture to be acceptable for use it must first pass the Tier 1 SRV
screening, including the organ and cancer criteria. If the mixture passes the SRV screening, the
Tier 1 SLV can be evaluated. The Tier 1 SLV evaluation assumes a worst-case scenario for the
soil factors that affect movement of an element to ground water and it predicts maximal effects
of EOC on groundwater. Most realistic soil/fly ash mixtures will probably fail the Tier 1 SLV.
______________________________________________________________________
10
However, if the mixture passes both the Tier 1 SRV human health screening and the Tier 1 SLV
ground water protection screening it can be considered for use in a project (see Figure 5). If it
passes Tier 1 SRV and fails Tier 1 SLV further evaluation can be conducted using Tier 2 SLV
where factors that affect the movement of elements to groundwater: soil texture, soil pH, depth
of affected zone and distance to water table, are entered into STUWMPP. This is discussed in
“Tier 2 SLV Page” section (page 15).
Figure 5: Decision tree for Pass/Fail determination.
Pass
Pass
SLV
Tier 1
Pass
Fail
SRV
Tier 1
Fail
OK
SLV
Tier 2
Fail
OK
STOP
STOP
A failure for chromium (Cr) for either the SLV or SRV criteria does not necessarily mean the
ash mixture poses a risk for Cr. Chromium can exist in two forms (valences), Cr(III) (trivalent)
and Cr(VI) (hexavalent). Chromium (VI) is highly mobile and is highly toxic, while the toxicity
and mobility of Cr(III) are low. STUWMPP assumes all the Cr is Cr(IV). A detailed analysis of
Cr could be conducted to determine the concentration of Cr(VI). For more discussion of Cr see
Appendix D.
To immediately run calculations on a different fly ash source or soil type, simply select a new
one from the appropriate list and click "Calculate" again. The results for the new mixture will
replace the results of the previous calculation. If you would like to try a new fly ash mixture
percentage, type the new percentage into the mixture percent text box and click "Calculate".
The new results will be displayed.
Accessing Databases for Other Soil and Fly Ash Data
If the desired soil or ash source is not listed, it still may be available for a different extraction
method.
Different acid extraction methods have been approved by the U.S. EPA for
______________________________________________________________________
11
determination of “total” elemental contents in soils and waste materials and two options are
available: “3050/3051” or “3052/PIXE*”. Generally, the 3050 and 3051 methods yield similar
values for most elements and in the database these methods are considered as one method.
The 3050 and 3051 methods are very commonly used for making decisions for human health
and ecological risks of EOCs in soils. The 3052 method yields more complete digestion of
some elements that are tied up within the structures of very insoluble minerals. Other methods
which yield similar results to the 3052 method are neutron activation analysis (NAA) and proton
induced x-ray emission (PIXE). These are listed together as “3052/PIXE*”.
Changing Extraction Methods
The default extraction method for both the waste material and soils data is 3050/3051 but
you can also select 3052/PIXE*. To select a method, go to “Data”→ “Methods” in the menu bar
of the main window and select the preferred method for either the waste material or soil (Figure
6). The appropriate list box(es) will be repopulated with the newly selected data if available.
The extraction methods for the waste and soil are independent of each other and may be
changed separately or together. If there are no data for the selected extraction method for fly
ash or soil, then ash or soil will not appear in the list.
Figure 6: Main window menu bar
showing how to select data using
different extraction methods.
Confidence Intervals and Safety Factors
The default confidence interval (CI) for the database is zero and comparison with the
SRV and SLV limits is made based on mean values for each element.
This may either
underestimate or overestimate the real concentration in the soils or ash used at a project. In
order to assure that an underestimate in concentration is not used for concentrations of EOCs, a
CI value can be added to the calculated means. Two CI options are available: 95% or 99% and
these CIs can be used with or without an additional safety factor of 20% of the mean. The CI
settings for the waste and soil are independent of each other. To change the CI setting go to
“Settings” → “Confidence Interval” in the menu bar and select the desired CI (Figure 7) for either
______________________________________________________________________
12
the fly ash or soil. To add the 20% safety factor go to “Settings” in the menu bar and select
"Add'l Safety Factor" in either the waste or soil sub-menu. Any combination of CI and safety
factors can be selected.
Figure 7: Main window menu bar showing
where to select different confidence intervals
and safety factors.
Example 2. Tier 1 SRV and Tier 1 SLV Run Using Fly Ash 3052/PIXE Database with 95%
CI and the Soil 3050/3051 Database with no CI.
•
Change the analytical method for ash to 3052/PIXE. See Figure 5.
•
Select ash source using Fly Ash dialog box. This is a different list of ash than was
seen for the 3050/30501 data.
•
Verify that the soil CI is set to none. See Figure 6.
•
Select soil series using Soil Type dialog box
•
Click the Calculate button
•
Results for Tier 1 SRV and Tier 1 SLV are displayed on the right side of the page
Example 3. Example 2 but with a 95% CI for the Soil Database Values
•
Enter the fly ash data as in Example 2
•
Change soil CI to 95%
•
Click Calculate button
•
See results.
•
Because the soils database typically has 2 or fewer entries for each soil type, the
CI for soils is estimated using a method that will give high values (see next
page). This method of calculation will give more “fail” results than the examples
above.
______________________________________________________________________
13
Evaluation of Results
If a confidence interval is selected but there are two or fewer data points in the database
for either the selected fly ash or soil type, a warning message similar to Figure 8 will appear.
This warning states that the CI for each element is calculated using the entire soil ash database.
When the number of samples is two or fewer Standard Deviation (SD) values are meaningless
and cannot be calculated. If there are two or fewer records in the database and you choose to
make the calculations based on a 95% or 99% CI, an SD estimate is calculated by determining,
for each element, the coefficient of variance (CV) of all records in the fly ash or soil data tables.
The CV is calculated by dividing the SD by the mean of all values in the database and this is
used to estimate the SD for the single value or mean of two values used in the calculation of
SLV and SRV limits. The warning message shown in Figure 8 lets you know that this has
occurred for either the fly ash or soil type you have selected. Click the "OK" button to use the
estimated SD, or the "Cancel" button to stop the calculations.
Figure 8: Warning message that
appears if only one or two soil
datapoints for the selected soil
type is in the database. A similar
warning is shown for waste
materials if only one or two
analyses are available.
Site-Specific Data for Fly Ash and Soils
The STUWMPP program allows for the input of site-specific data for the composition of fly
ash and/or soil.
Calculations with site-specific data do not apply a CI (even if a CI was
previously specified). To input site-specific data, check the box for site-specific soil and/or fly
ash data and click the "Input Site Data" button (Figure 1). Site-specific soil data can be used
with database fly ash values and site-specific fly ash data can be used with database values for
soil, or site-specific data can be entered for both materials. A new screen will appear (Figure 9).
The data should be in parts per million (ppm = mg/kg) and can contain up to three decimal
places. The data can be saved by going to “Data”→ “Save” in the menu bar and selecting the
location and name of the file you want to create. This will save the data currently on the sheet
as a word document. To load a saved dataset, go to “Data”→ “Load” and open a previously
______________________________________________________________________
14
saved dataset and the program will load the data into the form. After the data are entered, click
"OK" to return to the main page. See Appendix D for guidelines on collecting site-specific data.
Figure 9: Site-specific data
page. Used to enter any data
that is not included in the
database.
Example 4: Tier 1 SRV and Tier 1 SLV Run with 95% CI Database Values for Fly Ash and
Site-Specific Soils 3050/3051 Database with a 95% CI.
•
Enter fly ash data from the databases as in Example 2 or 3.
•
Check the box for site-specific soils data at the right hand side of the screen
•
Select “Input Site Data”
•
Enter the fly ash concentrations in mg/kg on the Site Specific Data screen (Figure 8)
•
Click the Calculate button
•
Results for Tier 1 SRV and Tier 1 SLV are displayed on the right side of the page
Example 4 could be used for project implementation if good database information is
available for ash and good soil laboratory data are available from the project site.
______________________________________________________________________
15
Tier 2 SLV
If all of the elements pass Tier 1 SRV but some elements fail the Tier 1 SLV calculations; it
is then possible to calculate a Tier 2 SLV comparison (Figure 5). The rate of dispersion of
elements in the soil and rate of leaching to groundwater is affected by several parameters that
can be adjusted to fit the construction site in the Tier 2 calculation.
With less dispersion and
slower rate of leaching the effect on the concentration in ground water is reduced.
The parameters affecting dispersion and leaching rate are soil texture, soil pH, climatic
region (precipitation/infiltration), depth of contaminant mixture, and distance from the
contaminant mixture zone to ground water.
For the Tier 1 calculations, the following
assumptions are used.
Soil Texture
Soil pH
Climate Region
Sandy Loam
7.0
D
Mixture Layer Thickness
15 ft
Depth: Mixture Layer to Highest Water Table
0 ft
These default values call for a worst case scenario for the leaching of most EOCs and can
result in an overestimation of the effect of the soil/fly ash mixtures on ground water. To enable
the Tier 2 calculation, click the check box marked "Tier 2 SLV Parameters" (Figure 1). To enter
site-specific soils properties select the "Tier 2 SLV Parameters" check box (Figure 1). The
heading for the SLV results will change to "Tier 2 SLV Pass/Fail" if the Tier 2 parameters are
enabled (not grayed out) (Figure 10). To turn these parameters off, simply uncheck the "Tier 2
SLV Parameters" check box. The Tier 2 SLV parameters can be turned on or off at any time,
but the calculations must be run again after changing parameter values before the results reflect
the current selection.
Figure 10: Adjustable parameters for calculation of Tier 2 SLVs. These are located below the results
section of the main page.
______________________________________________________________________
16
Soil Texture
The soil texture can be changed to match the soil texture at the project site (USDA Soil
Texture Classification). To determine soil texture, you will need to know the percent sand, silt,
and clay. For some records in the database, the sand, silt, and clay percentage data are
available. If so, they will be displayed in the proper box to the left of the Tier 2 adjustable
parameters. To determine the texture from the particle size data, click on the "USDA Soil
Texture Triangle" button to show the soil texture triangle. Figure 11 shows how to determine
texture from sand, silt, and clay data. The example shown in Figure 11 is 37% sand, 41% silt,
and 22% clay. To determine texture imagine a line for each particle size value (sand, silt, and
clay) as indicated. The area where the three lines intersect determines the texture.
The
texture of the example soil in Figure 11 is "Loam". After the soil texture is determined select the
appropriate texture in the USDA Soil Texture list box. Note that the USDA and Mn/DOT soil
classifications differ slightly. The calculations are based on the USDA classification scheme. If
there are no data available then use the default soil texture.
Figure 11: USDA soil texture triangle. Example of how to
determine the texture of a soil that is 37% sand, 41% silt, and
22% clay.
41% Silt
22% Clay
37% Sand
______________________________________________________________________
17
Soil pH
The soil pH can be changed to match the soil pH at the project site. Values from 4.9 to
8.0 can be entered. The clayey subsoils in Minnesota that are in need of stabilization will
typically have pH values in the range of 6.5 to 8.0. During initial planning, if actual soil pH is not
known you may use the default value of 7.0. In the due diligence calculations for implementation
of a project an actual pH value is necessary.
Climatic Region
The climatic region option allows for adjustments for annual precipitation and infiltration
rates in a particular area of the state. To select the appropriate climatic region, click on the
"Minnesota Climate Region Map" button and the image in Figure 12 will appear. Simply select
the region where the waste material is to be used and insert that letter into the "Climate Region"
box on the main page. The default region is "D", which corresponds to the region that generally
runs north and south through the center of the state and is the average for the state.
Mixing Depth and Depth to Ground Water
The final two adjustable parameters are the "Mixture Layer Thickness" and "Depth: Mixture
Layer to Highest Water Table". The mixture layer thickness is the depth to which the fly ash will
be mixed into the soil. The depth to water table is the distance from the bottom of the mixture
layer to the highest annual water table for that area. These depths are measured in inches and
the default values for Tier 2 are 24 and 36, respectively.
______________________________________________________________________
18
Figure 12: Map showing
the
different
climatic
regions of Minnesota.
Saving and Printing Documents
Saving Results
To save the results of a calculation go to “File”→ “Save”→ “Output” in the menu bar. You
can also click on the "Save" button located on the toolbar. Both of these will open a window in
which you can name the file and select where to save it to. The default file name is the fly ash
source and soil type used for the current results. The document includes the soil and waste
elemental concentration, SLV and SRV results, target organ results, confidence interval and
safety factors used, and the assumptions or data values used to determine the SLV values. A
sample output file is shown in Appendix F.
Saving a Waste Certificate
If you would like to create a certificate for the waste material you plan to use, go to “File”→
“Save”→ “Waste Certificate” in the menu bar.
This document contains the elemental
concentration of the selected waste material as well as the confidence interval and safety
factors used in determining the concentrations used in the calculations. This can be signed by
the waste supplier verifying the elemental content of the material to be used in a project. A
sample certificate is shown in Appendix F.
______________________________________________________________________
19
Printing
There are two results documents that can be printed by STUWMPP. The first is a simple
page with the soil and waste elemental concentration and results for the SLV, SRV and target
organ calculation. This printout does not include the confidence interval, safety factor or any of
the assumptions of Tier 2 SRV data used to calculate the results. To do this, go to “File”→
“Print”→ “Output Only” in the menu bar or click the "Print" button on the toolbar.
The second printout is the same as the saved results document. This includes all of the
information listed above. To print this document, go to “File”→ “Print”→ “Output (Detailed)”.
There is no toolbar button to print this document.
You can also print a list of the waste sources and soil types in the database. The list of
waste sources only includes the sources for the waste type currently selected.
Help
The help list in the menu bar includes links showing the elements of concern. The
"Elements" link will open a small message box listing the elements and their symbols for
reference. The "EOC" button on the toolbar also opens this list.
______________________________________________________________________
20
Appendix A: SRV and SLV Criteria
Table A-1. List of Tier 1 SLV and SRV for each element
Tier 1
Element
Symbol
SRV
SLV
mg kg-1
mg kg-1
Antimony
Sb
14.0
2.7
Arsenic
As
10.0
15.1
Barium
Ba
1200.0
842.0
Beryllium
Be
55.0
1.4
Boron
B
3000.0
145.0
Cadmium
Cd
35.0
4.4
Chromium
Cr
71.0
18.0
Cobalt
Co
2000.0
30.0
Copper
Cu
100.0
400.0
Lead
Pb
400.0
525.0
Manganese
Mn
1400.0
NA†
Mercury
Hg
0.7
1.6
Molybdenum
Mo
NA
6.0
Nickel
Ni
520.0
88.0
Selenium
Se
170.0
1.5
Silver
Ag
170.0
3.9
Strontium
Sr
NA
19240.0
Thallium
Tl
3.0
NA
Tin
Sn
15000.0
2964.0
Vanadium
V
210.0
500.0
Zinc
Zn
8700.0
1500.0
NA† = No SLV/SRV for this element.
______________________________________________________________________
21
Table A-2. List of target organs and the elements of concern for each that are used in assessing
potential SRV risk for elements that interact.
Target Organ/System
Elements of Concern
Cardiovascular/Blood (CV/BLD)
Antimony, Arsenic, Cobalt, Selenium, Thallium
Central Nervous System/
Pulmonary Nervous System (CNS/PNS)
Arsenic, Manganese, Mercury, Selenium
Immune System (IMMUN)
Cobalt, Mercury
Kidney (KIDN)
Cadmium, Tin
Liver/Gastrointestinal (LIV/GI)
Beryllium, Selenium, Tin
Reproductive (REPRO)
Boron, Mercury, Thallium
Respiratory (RESP)
Beryllium, Cobalt
Skin (SKIN)
Arsenic, Selenium, Silver
Whole Body (WHOLE)
Antimony, Nickel
Cancer
Arsenic, Beryllium, Cadmium, Chromium, Nickel
______________________________________________________________________
22
Appendix B: Guidelines and rules for utilizing fly ash
Minnesota Pollution Control Agency Rule for Fly Ash Use
In early 2004 MPCA completed new rules that govern beneficial use of solid wastes, including
fly ash (amendments to Minn Rule Ch 7035). These rules establish a system to assist waste
generators to identify beneficial uses for those wastes. The solid waste utilization rules identify
three different conditions under which wastes can be used rather than disposed of: standing
beneficial use determinations (SBUD), case specific beneficial use determinations (CSBUD),
and
demonstration
/
research
projects
(DRP).
Details
are
available
at
http://www.pca.state.mn.us/waste/sw-utilization.html
Definition of Due Diligence
1. The diligence reasonably expected from, and ordinarily exercised by, a person who seeks to
satisfy a legal requirement or to discharge an obligation. – Also termed reasonable diligence. 2.
Corporations & securities. A prospective buyer’s or broker’s investigation and analysis of a
target company, a piece of property, or a newly issued security. * A failure to exercise due
diligence may sometimes result in liability, as when a broker recommends a security without first
investigating it adequately.
From: Black’s Law Dictionary, St. Paul, Minn.: West Group, 1999.
______________________________________________________________________
23
Appendix C: Recommended procedures for soil and waste sampling
and analysis
Soil Sampling
Because soils vary in composition, site-specific data are needed for implementation of a
project. Soil samples should be obtained from the soil strata that will be mixed with the ash
during stabilization. Sample along the centerline of the proposed road from every soil mapping
unit (soil series or soil complex) delineated in the county soil survey. However, soil samples
must be obtained at a minimum of every 1320 ft.
Several methods can be used for collecting soil samples but analysis of the elements of
concern (EOC) requires a relatively small amount of soil (<25 grams). Because most of the
EOCs are metals, it is important to minimize contamination by metal equipment which could
result in elevated concentrations for some metals. Coring equipment that has plastic tube liners
to encapsulate the soil sample will greatly reduce the possibility of metal contamination.
However, the usually minor contamination from carbon steel coring tools may be acceptable for
many projects and steel coring equipment can be used. Stainless steel contains Cr, Ni and Mn
and should be avoided, if possible. Hand tools that come in contact with the soil samples
should be plastic or plastic coated. Drilling fluids can cause cross-contamination; therefore they
should not be used. ASTM D 6640-01 (Standard Practice for Collection and Handling of Soils
Obtained in Core Barrel Samplers for Environmental Investigations) can be referenced for
specifics on collection and handling of soils using core barrel samplers.
Soil samples sent to a laboratory should only contain the strata that will be used in
stabilization. Samples should be placed in clean polyethylene bags or glass jars with poly lined
caps. Label with project name, date, time, location, and collector’s name and submit to a
laboratory. See “Analysis” section below.
Ash Sampling
The concentration of EOCs in fly ash is very dependent on coal source, boiler
conditions, and pollution control devices. If existing data are to be used from the database
these factors must match current plant conditions. However, often it will be necessary to obtain
recent samples from the ash source.
The manner in which an ash sample is collected could affect the concentration of the
EOCs. The more samples collected, the more representative the results will be of the stock of
______________________________________________________________________
24
ash used in the project. ASTM C311-02, (Standard Test Methods for Sampling and Testing Fly
Ash or Natural Pozzolans for Use in Portland-Cement Concrete) provides guidance for ash
sampling. Sampling to evaluate environmental concerns is not directly addressed in this ASTM
method; however, the methods described are currently used in fly ash sampling and are well
understood by many ash generators. ASTM C311-02 gives options for sampling from bulk
storage, at point of discharge, or from rail cars and road tankers. It also provides the option of
sampling from bags in storage, or from conveyor delivering to bulk storage.
In project planning it may be necessary to use data for ash that was produced before the
stock of ash that will actually be used in the project. Recently-obtained ash data can be used if
coal source, boiler conditions, and pollution control devices are the same as for the ash that will
be used in the project.
The greatest concentration values for each element can be used to
provide the best assurance that the ash generated after the samples were obtained will not
exceed the values used in planning.
The number of samples collected form the ash used in a project is dependent on the
size of the proposed project. If only one truckload of ash is to be used, then a grab sample from
that truck would be sufficient. However, if a project involves the use of several truckloads of
ash, then a sample should be collected from each truck and analyzed individually. Label all
samples with at minimum the date, time, collectors name and location where sample was taken
from.
See “Analysis” section below.
Analysis
Store and ship sample in glass jars with poly-lined caps or polyethylene plastic bags.
Only employ analytical laboratories that are state certified for Resource Conservation and
Record Program (RCRP) metals.
Minnesota
Department
An up-to-date list of such laboratories is given at the
of
Health’s
http://www.health.state.mn.us/divs/phl/cert/alllabs_nm.html.
website
at
Request the laboratory to conduct
a total digestion on the soil/ash sample (EPA Method number 3050, 3051, or 3052). Have the
laboratory analyze for the twenty-one elements of concern. Laboratories should report the
concentration of the EOC on a dry weight basis, and they should include analysis method,
reporting limits and quality assurance information.
Enter soil and ash data for each section of road sampled into STUWMMP. Use the data
for the soil and the ash used in that section of road. If more that one ash truckload was used in
a section, use the mean of the concentrations obtained for each element.
______________________________________________________________________
25
Appendix D: Details on the use of SRV and SLV criteria in STUWMPP
STUWMPP is based on the "Risk Based Guidance for the Soil Human Health Pathway" and
"Risk Based Guidance for the Soil Leaching Pathway" models developed by the Minnesota
Pollution Control Agency (MPCA). The Soil Human Health Pathway evaluation considers the
risk associated with human contact with contaminated soil. Concentrations of specific soil
contaminants, above which an unacceptable risk to human health is predicted, are referred to
as soil reference values (SRVs). The SRVs vary with the exposure scenario. In STUWMPP we
use the Tier 1 SRV exposure, which assumes a residential (unrestricted) exposure scenario.
The Tier 1 SRV values are given in Table A-1. The SRV analysis also considers elemental
interactions that might affect the target organs listed in Table A-2 and the risk of increased
incidence of cancer for the carcinogenic elements listed in Table A-2.
Evaluation of the Soil Leaching Pathway consists of assessment of the possible risk posed
to groundwater by EOC leaching from a soil source. Tier 1 Soil Leaching Values (SLV) for
contaminants is defined in Table A-1. The Tier 1 SLV assumes a contaminant is uniformly
distributed throughout a 15 ft depth of a coarse soil that directly overlies the ground water. The
calculated SLVs set the upper acceptable limit of a contaminant that will assure the Health Risk
Limits (HRL), which the Minnesota Department of Health (MDH) defines for groundwater, are
not exceeded. In Tier 2 the user enters site-specific parameters concerning the nature of a soil.
The program uses the MPCA SLV worksheet to compute limits based on the predicted effects
on soluble concentration of EOC in the groundwater. The predicted groundwater concentrations
are compared to the MDH HRL values
The upper limits defined by the SRVs and SLVs were
originally intended to serve as guidelines for making corrective action decisions for cleanup of
contaminated sites but these guidelines can also be useful for conducting due diligence when
wastes are added to soil in a construction project.
For the organs that are affected by more than one EOC, exposure hazard index (HI) values
are calculated for each element and a sum is calculated. The sum must be less than 1. The
following equation is used to calculate the HI for each target organ.
______________________________________________________________________
26
HI = ∑ C*(HQ/SRV)
Where
C = Site concentration
SRV = Tier 1 SRV
HQ = Allowable SRV hazard quotient (0.2 for most elements)
In addition, the sum of the predicted increase in cancer risk is calculated. The increase in
cancer over background must not exceed 1 case in a population of 100,000 (risk = 1 x 10⁻⁵).
More information regarding these worksheets can be found on the MPCA website at
http://www.pca.state.mn.us/cleanup/riskbasedoc.html#slp.
The Tier 1 SLVs and SRVs are listed in Appendix A as well as in the "HRL_SLV_SRV" table
in the database. The Tier 1 SRV, Tier 1 SLV and HRL limits can be changed by authorized
LRRB personnel if MPCA or MDH changes the limits.
Possible Over-estimate of Chromium
Entry of total Cr (e.g. USEPA 3050, 3051, or 3052 extraction and analysis) into STUWMPP
will result in over estimation of the actual risk posed by Cr because Cr in fly ash and soils is
composed of two different forms with widely different mobility and toxicity. Chromium (VI) is
highly toxic and is very mobile, while the toxicity and mobility of Cr(III) are low enough that the
Tier 1 SRV and Tier 1 SLV limits for Cr(III) will not be exceeded for any of the sources of coal
ash available in Minnesota, even for mixtures that contain little or no soil. Analysis for Cr(VI) in
soil and ash is possible and direct determination of the Cr(VI) concentration would give a more
reasonable indication of the risk posed by Cr. However, Cr(VI) analysis in solid media is not a
routine procedure used in most laboratories and analysis is relatively expensive. However, the
added cost of measuring Cr(VI) would result in a better estimate of actual Cr risk.
______________________________________________________________________
27
Appendix E: Multiple Layer Mixing Routine
(For possible future use, not currently used)
If the project calls for mixing two or more layers (e.g. milled asphalt, fly ash and sub soil)
then click the "Input Layer Mixing Data" button (Figure 9) and a new screen will appear (Figure
E-1). Select the number of layers to be included by checking the appropriate box. This number
does not include any waste material (e.g. fly ash) that will be added to the soil mixture. Input
the thickness and elemental data into the appropriate boxes for each layer. After all data are
added, click "OK" and you will return to the previous screen.
To save this dataset go to “Data”→ “Save” in the menu bar and select the location and
name of the file you want to create. To load a saved dataset, go to “Data”→ “Load” and open a
previously saved dataset and the program will load the data into the form. Click "OK" to return
to the Site-specific Data page. To use the data you just typed in or loaded, mark the "Use layer
mixing data" check box (Figure E-1). The soil data input boxes will be filled with the calculated
values. These values are a weighted calculation based on the ratio of depth of each layer to the
total mixing depth. Now you can enter data for a specific waste material as mentioned above
and/or click "OK" to return to the main page.
Figure E-1: Multiple layer
mixing page. Used to input
data from projects that
involve mixing of layers
that are part of the existing
pavement.
______________________________________________________________________
28
Appendix F: Sample of Detailed Output
9/24/2004
Page 1 of 2
Report for use of waste materials in soil stabilization and/or paving projects
Project Name: Sample Soil and Fly Ash Mixture
Waste Type: FlyAsh
Date of Waste Data: 2001
Waste Source: Black Dog
Data Collection Method: 3050/3051
Soil Type: Bearden silty clay loam_Grand Forks
Mix
Percent: 10 %
Elemental concentrations for the waste material and soil are given in parts per
million (ppm).
Element
Soil
Waste
Tier 1 SLV Pass/Fail
Tier 1 SRV Pass/Fail
------------------------------------------------------------------------------Sb
0.114
0.76
PASS
93%
PASS
99%
As
6.135
12.5
PASS
55%
PASS
32%
Ba
457.5
4979.
FAIL
8%
PASS
24%
Be
0.539
2.95
PASS
44%
PASS
99%
B
40.5
587.5
PASS
34%
PASS
97%
Cd
0.692
0.935
PASS
84%
PASS
98%
Cr
6.575
65.5
PASS
31%
PASS
82%
Co
3.49
13.85
PASS
85%
PASS
100%
Cu
20
154.5
PASS
92%
PASS
67%
Pb
4.955
34
PASS
99%
PASS
98%
Mn
400
135.5
NA
NA
PASS
73%
Hg
0
0.186
ND
ND
ND
ND
Mo
1.28
8.75
PASS
66%
NA
NA
Ni
10.41
48
PASS
84%
PASS
97%
Se
0.519
10.8
FAIL
3%
PASS
99%
Ag
0.139
0
Sr
517.5
2265
ND
ND
ND
ND
PASS
96%
NA
NA
______________________________________________________________________
29
Tl
0.154
0.435
Sn
0.585
V
Zn
9/24/2004
NA
NA
PASS
94%
3.6
PASS
100%
PASS
100%
24
174
PASS
92%
PASS
81%
25.5
35.5
PASS
98%
PASS
100%
Page 2 of 2
CV/BLD CNS/PN IMMUN
KIDN
LIV/GI REPRO
RESP
SKIN
WHOLE
CANCER
-----------------------------------------------------------------------------PASS
PASS
PASS
PASS
PASS
PASS
PASS
PASS
PASS
PASS
Waste Confidence Interval:
No Confidence Int.
Waste Safety Factor Applied: No Add'l Safety Factor
Soil Confidence Interval:
Soil Safety Factor Applied:
No Confidence Int.
No Add'l Safety Factor
Tier 1 Assumptions
-------------------Soil Texture:
Soil pH:
Mixture Thickness:
Depth: Bottom of Mixed Layer to GW:
Minnesota Climate Region:
Soil Bulk Density:
Thickness of Aquifer:
Adjusted Infiltration Rate:
Sandy Loam
7
15 ft.
0 ft.
D
1.5 g/cm^3
30 ft.
5.51 in/yr
------------------------------------------------------------------------------Percentages given are the percent of the SLV or SRV that the mixture passed or
failed. (i.e. 16 would return a 50% PASS for an SLV/SRV of 32 or a 300% FAILS
for an SLV/SRV of 4)
NA = Not Applicable
ND = No Data or Not Determined
------------------------------------------------------------------------------Warning: The Local Road Research Board makes no representation or warranties,
expressed or implied, with respect to the reuse of the data provided herewith,
regardless of its format or the means of its transmission. There is no
guarantee or representation to the user as to the accuracy, currency,
suitability, or reliability of this data for any purpose. The user accepts the
data as is, and assumes all risks associated with its use. By acceptance of
this data, the user agrees not to transmit this data or provide access to it or
any part of it to another party unless the user shall include with the data a
copy of this disclaimer. The Local Road Research Board assumes no
______________________________________________________________________
30
responsibility for actual or consequential damage incurred as a result of any
user's reliance on this data. The Local Road Research Board shall not be liable
for any direct, indirect, special, incidental, compensatory or claims resulting
from the use of this software even if the Local Road Research Board has been
advised of the possibility of such potential loss of damage. User agrees to
indemnify and hold the Local Road Research Board harmless from any demands,
claims, or suits by a third party for loss, judgment, damages, or expenses
(including attorney's fees) arising out of or related to misuse of the software
by user or any other person.
______________________________________________________________________
31
Appendix G: Sample of Waste Certificate
Certificate of Elemental Concentration
9/24/2004
Project Name: Sample Waste Certificate
Waste Type:
FlyAshWaste Source: Black Dog
Data Collection Method: 3050/3051
Date of Waste Data: 2001
Elemental concentrations for the waste material and soil are given in parts
per million (ppm).
Element
Conc.
------------------Sb
0.76
Element
Conc.
------------------As
12.5
Ba
4979.
Be
2.95
B
587.5
Cd
0.935
Cr
65.5
Co
13.85
Cu
154.5
Pb
34
Mn
135.5
Hg
0.186
Mo
8.75
Ni
48
Se
10.8
Ag
0
Sr
2265
Tl
0.435
Sn
3.6
V
174
Zn
35.5
-----------------------------------------------------------------------------Waste Confidence Interval:
No Confidence Int.
Waste Safety Factor Applied: No Add'l Safety Factor
Soil Confidence Interval:
Soil Safety Factor Applied:
No Confidence Int.
No Add'l Safety Factor
I _________________________, as a representative of _____________________,
certify that the FlyAsh supplied for the Sample Waste Certificate project is
at or below the above levels for the respective elements of concern.
______________________________________________________________________
32