1
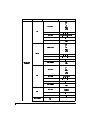
System 824
RTA Option
Reference Manual
Larson•Davis
1681 West 820 North, Provo, UT 84601-1341
Phone: (801) 375-0177, FAX: (801) 375-0182
www.lardav.com
I824.04 Rev. A
824-RTA USER MANUAL
Copyright
Copyright Ó 1999 by Larson•Davis. This manual and the software described in it are
copyrighted, with all rights reserved. The manual may not be copied in whole or in part
for any use without prior written consent of Larson•Davis.
Warranty
Larson·Davis warrants this product to be free from defects in material and workmanship
for two years from the date of original purchase.
During the first year of warranty period, Larson·Davis will repair or, at its option, replace
any defective component(s) without charge for parts or labor if the unit is returned,
freight prepaid, to an authorized service center. The product will be returned freight prepaid.
During the second year warranty period, there will be no charge for replacement parts
provided the product is returned to Larson·Davis repair facility.
Product defects caused by misuse, accidents, or user modification are not covered by this
warranty. The warranties described above are exclusive and in lieu of all other warranties
whether statutory, express or implied including, but not limited to, any implied warranty
of merchantability or fitness for a particular purpose and all warranties arising from the
course of dealing of usage or trade. The buyer’s sole and exclusive remedy is for repair or
replacement of the non-conforming product or part thereof, or refund of the purchase
price, bur in no event shall Larson·Davis (its contractors and suppliers of any special,
indirect, incidental, or consequential damages) whether the claims are based in contract,
in tort (including negligence), or otherwise with respect to or arising out of the product
furnished hereunder. Representation and warranties made by any person, including its
authorized dealers, representatives and employees of Larson ·Davis which alter or are in
addition to the terms of this warranty shall not be binding upon Larson Davis unless in
writing and signed by on of its officers.
Disclaimer
The following paragraph does not apply in any state or country where such statements are
not agreeable with local law:
Even though Larson•Davis has reviewed its documentation, Larson•Davis provides this
publication “as is” without warranty of any kind, express or implied, including but not
limited to, the implied warranties of merchantability or fitness for a particular purpose.
This documentation is subject to change without notice, and should not be construed as a
commitment or representation by Larson•Davis.
ii
824-RTA USER MANUAL
This publication may contain inaccuracies or typographical errors. Larson•Davis will
periodically update the material for inclusion in new editions. Changes and improvements to the products and/or programs described in this manual may be made at any time.
824 Serial # ______________________
iii
824-RTA USER MANUAL
iv
Table of Contents
Chapter 1
1-1
Chapter 2
2-1
Settings Menu ................................................................................... 1-2
Settings Descriptions ........................................................................ 1-5
RTA Settings Menu..................................................................... 1-5
Autostore Settings Menu............................................................. 1-7
Arm Settings Menu ..................................................................... 1-8
Trigger Settings Menu................................................................. 1-9
End Settings Menu ...................................................................... 1-11
Then Settings Menu .................................................................... 1-12
Trigger Settings Menu (continued) ............................................. 1-13
RTA Settings (continued) ........................................................... 1-14
RT60-A and RT60-B Instrument Definition............................... 1-15
Rooms RTA Instrument Definition............................................. 1-17
RTA Views ....................................................................................... 2-1
Trigger Views ................................................................................... 2-4
Autostore Views ............................................................................... 2-6
Autostore ByTime Spectral History............................................ 2-10
ByTime Spectrum Check Menu.................................................. 2-11
ByTime Graph Check Menu ....................................................... 2-12
RT-60 .......................................................................................... 2-14
RT60 Check Menu ...................................................................... 2-15
Spatial Avg Views ............................................................................ 2-16
Spatial Avg Check Menu ............................................................ 2-17
Avg History Check Menu ........................................................... 2-19
Rooms Views ................................................................................... 2-19
3/26/99
i
ii
system 824 user manual
3/26/99
CHAPTER
1
Introduction to 824 RTA; Setup
Menu
Welcome to the System 824 Real-Time Analysis Firmware
Option. This option adds high speed spectral data gathering
to the System 824 and will enable you to perform the following measurements:
• Architectural Acoustics
• On-board RT60 analysis
• Room Criterion
• Acoustic Impulse Event Analysis
• Pass-by Event analysis
The 824 RTA option provides the following features:
• RTA for fast spectral data
• Performs room acoustics: RT60, RC, NCB, HTL
• Averages any number of spectra
• Uses measurement triggering for flexible acquisition
• Autostores up to 400 spectra per second
• Has both exponential and linear detectors
7/7/99
Introduction to 824 RTA; Setup Menu
1-1
This 824 RTA Addendum assumes
that you are familiar with the operation of the 824. For general operation see the 824 Reference Manual
(I824.01 Rev B).
This manual has 2 chapters and covers the following topics:
• Chapter 1 - Introduction to 824 RTA; Setup Menu: Discusses the features and applications for the RTA Option.
Explains the Setup Menu.
• Chapter 2 - Display Views and Menus: Explanation of
the different views available showing RTA Spectra, Trigger Status, Autostore Records, and Spatial Averaging.
For other information pertaining to the RTA Instrument, see
the following in the 824 Reference Manual:
• For Data Storage, see Chapter 4.
• For Printing RTA Reports see Chapter 8.
• For I/O commands, see Appendix C.
• For RTA specifications see Appendix D.
Settings Menu
The Settings menu for the RTA instrument is accessed from
the S SETUP key. There are three permanent RTA instrument definitions (ID) available: ROOMS.RTA, RT60A.RTA, and RT60-B.RTA.
To select an RTA instrument press the S SETUP key, scroll
down to RTA and press the c check key. The RTA Live
view will now be displayed. Press the S SETUP key again
to return to the SETUP menu. At the top of the Setup menu
“Edit Settings” will be highlighted. Press the c check key
to edit the RTA settings menu.
.
See chapter 5 of the 824 Reference Manual for more
details on selecting instrument IDs.
1-2
System 824 User Manual
7/7/99
The menu layout of the RTA settings is shown in the table
below:
Menu Items
Title
Submenu
Gain
(dB)
Bandwidth
Detector
Lin Detc Time
RTA
Exp Detc Time
(seconds)
Exp Store Rate
Transducer
Autostore
Autostore
Pretrigger #
Save ByTime
Trigger Setup
7/7/99
Triggering
Trigger Source
Available Settings Options
User customized text entry
-20
-10
+0
+10
+20
+30
+40
+50
1/1
1/3
Lin
Exp
0.0025 to 99.9975 sec
1/32
1/16
1/8
1/4
1/2
1
2
4
8
16
32
64
1/2 second
1/8 second
Condnsr
Elctret
Direct
No
Yes
Available Settings Options
0-400 samples
No
Yes
No
Yes
Any 1/1 or 1/3 octave filter
Flat
Introduction to 824 RTA; Setup Menu
1-3
Menu Items
Submenu
Available Settings Options
Arm Mode
Arm
Arm Level
Arm Time
Arm Samples
Arm Logic In
Trigger Mode
Trigger
Trigger Setup
(continued)
Trigger Level
Trigger Time
Trig Samples
Trig Logic In
End mode
End
End Level
End Time
End Samples
End Logic In
End Then
Then
Run on Input
1-4
Repeat Count
Average Count
No
Yes
System 824 User Manual
Available Settings Options
Now
L<
L=
L>
Input
Time
Count
0.0 - 255.9 dB
00.0000 to 99.9975 sec
0 - 65535
Low
High
Now
L<
L=
L>
Input
Time
Count
0.0 - 255.9 dB
00.0000 to 99.9975 sec
0 - 65535
Low
High
Never
L<
L=
L>
Input
Time
Count
0.0 - 255.9dB
00.0000 to 99.9975 sec
0 - 65535
Low
High
Stop
Repeat
Average
0 - 255
0-9
7/7/99
Menu Items
Trigger Setup
(continued)
RT60 dB Down
Note
Submenu
Available Settings Options
Logic Out
0 - 65535
Available Settings Options
5
10
20
30
8 Characters
Settings Descriptions
Title Setting
Use the title setting to create a title or heading for printed
reports. This title will be placed at the top of each RTA
report you print.
RTA Settings Menu
Gain Setting
Gain adjusts the voltage level delivered to the measuring
portion of the meter from the microphone and preamplifier.
Bandwidth Setting
Selects 1/1 or 1/3 octave filter bandwidth for real-time analysis.
Detector Setting
Selects the averaging method to be used.
• Linear
• Exponential
7/7/99
Introduction to 824 RTA; Setup Menu
1-5
Linear Detector Time
The Linear Detector Time will be
adjusted to an integer multiple of
0.0025 seconds (2.5mS).
Allows the user to select the averaging time when the linear
detector is used. Also sets the storage rate for the Autostore
ByTime records.
• 0.0025 to 99.9975 seconds
Exponential Detector Time
When an exponential detector is selected, this parameter sets
the exponential decay time.
• 1/32 to 64 seconds
Exponential Store Rate
The Exponential Detector Time mutiplied by the Exponential Store Rate
gives the total Auto Store time.
Selects the rate at which spectral samples are output and
stored when the detector is exponential. The interval time,
time between successive samples, is equal to the exponential
detector time multiplied by the exponential store rate.
• 1/2
• 1/8
NOTE: For example, if the detector time is 1/8 and the store rate is
1/2, then the 824 would generate spectra samples at a rate of 16
times per second.
Transducer
When a condenser microphone is
used, the 824 requires a stablization
time of approximately 45 seconds
before a measurement can be taken.
1-6
• Condenser - This indicates that the microphone being
used is an air condenser type and the 824 will generate
the appropriate polarization voltage.
• Electret - This indicates that the microphone being used
is an “Electret” (pre-polarized) microphone. The 824
will not generate any polarization voltage.
• Direct - This indicates that no microphone is being used
and electrical signals are being injected directly into the
preamplifier. No polarization voltage is generated.
System 824 User Manual
7/7/99
Autostore Settings Menu
Autostore
When a linear detector is selected,
the store rate is that of the linear
detector.
When an exponential detector is
selected, samples are stored every
(exponential detector time) multiplied by the (exponential store rate).
Turns the Autostore function on or off. It allows the 824 to
measure and store basic information such as the Leq, Max,
and Min spectra when a measurement is ended by the triggering setup or by pushing the run/stop key. When Autostore
is on, ByTime data is automatically stored in the Autostore
record if Save ByTime is set to Yes. For setups with a linear
detector, spectra are stored once every linear detector time.
For setups with an exponential detector, samples are stored
every 1/256 of a second to 32 seconds.
Pretrigger #
Pretrigger samples are only available when the trigger function is
used to start the measurement.
Allows the user to select the number of pretrigger samples
that are stored with an Autostore record. The 824 keeps a
circular buffer of the most recent 400 samples. The buffer is
reset every time a new run is started. The number of spectra
in the buffer is displayed in the Trigger Status view. This setting determines how many of these spectra to copy into the
beginning of the Autostore record.
• 0 - 400 samples
Save ByTime
When Autostore is turned on, ByTime
records are automatically stored.
This feature allows the user to enable or disable turn storage
of ByTime data in an autostore record. With this feature
turned off and the Autostore function turned on, the 824 will
only store Leq, Max, and Min spectra.
By default, the RT60-A and RT60-B
instruments have Autostore and
ByTime enabled.
7/7/99
Introduction to 824 RTA; Setup Menu
1-7
Triggering
Turns triggering on or off. There are four parts to triggering:
Arm, Trigger, End, and Then. Arm and Trigger work in
tandem to create a two step trigger to start an Autostore. End
and Then work together to determine when to stop measuring.
Trigger Source
You can also set the trigger source
from the Trigger Status display by
moving the cursor to the desired
check key and
band, press the
select “Set Source” from the menu.
c
Allows the user to select a filter or flat overall as a trigger
source.
Arm Settings Menu
Arm Mode
Elapsed time and qualifying times
are evaluated only when a new
ByTime sample is created. This
causes the minimum effective time
resolution to become the same as the
update interval.
“L” indicates the level of the filter
specified by the Trigger Source setting.
1-8
The 824 becomes armed when the following conditions are
met:
• Now - The 824 will arm immediately.
• L < - When the level is less than the “Arm Level” for the
“Arm Time”, then, the 824 will arm.
• L = - When the level is equal to the “Arm Level”, +/-0.5
dB, for “Arm Time” then the 824 will arm.
• L > - When the level is greater than the “Arm Level” for
“Arm Time”, then, the 824 will arm.
• Input - The 824 arms when the logic input line changes
to “Arm Logic In” state.
• Time - The 824 arms after the “Arm Time” seconds in
the ready mode.
System 824 User Manual
7/7/99
•
Count -
The 824 arms after “Arm Count” samples of
data have been received.
Arm Level
Arm Time is used in conjunction with
Arm Level as a qualifier for the level
setting. See example below.
A typical trigger having the following settings,
Trigger Source: 1 kHz
Arm Level: 80.0 dB
Arm Mode: L >
Arm Time: 2.0 second
Would transition to arm after the 1
kHz filter level was greater than 80
dB for 2 seconds.
This trigger level is used when the “Arm Mode” is set to a
level state (L<, L=, L>). This level must be reached before
the 824 will arm.
• 0.0 - 255.9 dB
Arm Time
When the “Arm Mode” is set to Time, the “Arm Time” must
expire before the 824 will arm.
This is also a qualifier for the level settings. If the time is
non-zero, then the level condition must be met for the specified time before Arm Mode is entered.
• 00.0000 to 99.9975 seconds
Arm Samples
When the “Arm Mode is set to Count; “Arm Samples” is the
number of samples that will be taken before the 824 is
armed.
• 0 - 65535
Arm Logic In
When the “Arm Mode” is set to Input, the 824 will arm
when the state of the Logic In line changes to this level.
Logic In is sampled 32 times each second.
• Low
• High
7/7/99
Introduction to 824 RTA; Setup Menu
1-9
Trigger Settings Menu
Trigger Mode
The 824 triggers and starts recording an Autostore recordwhen Armed and the following conditions are met:
• Now - The 824 starts recording an Autostore immediately.
• L < - When the level is less than the “Trigger Level” for
“Trigger Time”, then, the 824 begins recording an
Autostore.
• L = - When the level is equal to the “Trigger Level”, +/0.5 dB, for “Trigger Time”, then, the 824 begins recording an Autostore.
• L > - When the level is greater than the “Trigger Level”
for “Trigger Time”, then, the 824 begins recording an
Autostore.
• Input - The 824 starts recording an Autostore when the
logic input line changes to “Trigger Logic In” state.
• Time - The 824 starts recording an Autostore after “Trigger Time” seconds.
• Count - The 824 starts recording an Autostore after
“Trig Samples” of data have been received.
Trigger Level
“L” indicates the level of the filter
specified by the Trigger Source setting.
This level is used when the “Trigger Mode” is set to Level
(L<, L=, L>). This is the amplitude in dB at which the 824
will start recording an Autostore record. It must be valid for
the period of time set by “Trigger Time”.
• 0.0 - 255.9 dB
Trigger Time
When the “Trigger Mode” is set to Time, this is the time that
must pass before the 824 starts recording an Autostore
record. This is also a qualifier for the level settings. If the
1-10
System 824 User Manual
7/7/99
time is non-zero, then the level condition must be met for the
specified time before the trigger will occur.
• 00.0000 to 99.9975 seconds
Trig Samples
When the “Trigger Mode” is set to Count; “Trig Samples” is
the number of samples that will be taken before the 824
starts recording an Autostore record.
• 0 - 65535
Trig Logic In
When the “Trigger Mode” is set to Input, the 824 starts
recording an Autostore record when the logic input line
changes to the “Trig Logic In” state.
• Low
• High
End Settings Menu
End Mode
The measurement ends when the following conditions are
met:
• Never - The measurement continues until the run/stop
key is pressed.
• L < - When the level is less than the “End Level” for
“End Time”, then , the 824 stops recording an Autostore.
• L = - When the level is equal to the “End Level”, +/-0.5
dB , then, the 824 stops recording an Autostore.
• L > - When the level is greater than the “End Level” for
“End Time”, then , the 824 stops recording an Autostore.
• Input - The 824 stops recording an Autostore after the
logic input line changes to “End Logic In” state.
7/7/99
Introduction to 824 RTA; Setup Menu
1-11
•
Time - The 824 stops recording an Autostore after “End-
•
Count - The 824 stops recording an Autostore after “End
Time”.
Samples” of data have been received.
End Level
This level is used when the “End Mode” is set to Level (L<,
L=, L>). It is the amplitude in dB at which the 824 will stop
recording an Autostore record.
• 0.0 - 255.9 dB
If set to 0 seconds, at least 2 samples
will be stored. One, due to the Arm
Sample, and one, due to the Trigger
Sample.
If set to 0 samples, the measurement
will not end.
End Time
The 824 stops recording an Autostore record when the “End
Time” has been satisfied.
• 00.0000 to 99.9975 seconds
End Samples
The 824 stops recording an Autostore after “End Samples”
has been satisfied.
• 0 - 65535
End Logic In
When the “End Mode” is set to Input, the 824 stops recording an Autostore record when the logic In line changes to
“End Logic In” state.
• Low
• High
Then Settings Menu
End Then
After the measurement ends, the 824 may do the following:
1-12
System 824 User Manual
7/7/99
• Stop - The measurement ends.
• Repeat - The measurement repeats when the Arm and
Trigger settings have been satisfied. A new Autostore
record is created for each repeated measurement.
.
Repeat
Averaging requires the End
Mode
to be set to Time or Count so
.
that all records are the same length.
• Average - The measurement repeats (like repeat above)
except that the spectra are averaged with the preceding
spectra.
Repeat Count
Allows the user to select how many times the measurement
will repeat when the “End Then” setting is set to Repeat.
• 0 - 255
Average Count
This is the number of times the measurement is repeated and
averaged when the “End Then” setting is set to Average.
• 0-9
Trigger Settings Menu (continued)
Run on Input
When set to Yes the instrument will run when the logic input
line changes to the “Run Logic In” state.
• No
• Yes
Run Logic In
• Low
• High
7/7/99
Introduction to 824 RTA; Setup Menu
1-13
Logic Out
These lines can be used to control
lights in a remote control device to
indicate the current state.
Ended
The Logic Out bit value determines which lines (heater, cal,
or logic) will be used on the control connecter to indicate
each of the five states.
• 0 - 65535
The setting for the Output Logic state selection is combined
into one 15-bit setting that has 3 bits (one for each outputline-Logic Out, Heater Out, and Cal Out) for each of the five
states (Stop, Ready, Armed, Triggered, Ended).
Use the table below to determine how these will be set up.
Triggered
Armed
Ready
Stop
16284
8192
4096
2048
1024
512
256
128
64
32
16
8
4
2
1
Heat
Cal
Logic
Out
Heat
Cal
Logic
Out
Heat
Cal
Logic
Out
Heat
Cal
Logic
Out
Heat
Cal
Logic
Out
The default setting indicates the
following:
Ended state is output on logic out.
Triggered state is output on logic
out.
The default setting is 04768 which is shown by the bolded
squares in the table above.
The Logic output is on pin 2 of the control connector and
will be driven to +5 volts through a 1000 ohm resistor when
asserted or zero volts when not asserted. Pin 1 is the ground
signal.
Armed state is output on cal.
Ready state is output on heat.
Stop state is not outputed.
1-14
System 824 User Manual
7/7/99
RTA Settings (continued)
RT60 dB Down
The automatic RT60 algorithm will search for a point 5 dB
down from the peak and then calculate an RT60 between
that point and the next point, “RT60 dB Down”, from the 5
dB point.
NOTE: If “RT60 dB Down” is set to 30 dB, the RT60 will be calculated for the data between 3 and 35 dB down from the max.
•
•
•
•
5 dB
10 dB
20 dB
30 dB
Note
An 8 character note field is provided to annotate a spatial
average. This is useful when describing the measurement
you are taking and keeping track of different measurements
or their location.
RT60-A and RT60-B Instrument Definition
The System 824 contains two special RTA IDs on the setup
menu which will simplify making an RT60 measurement.
Both of these setups load the RTA instrument but with the
triggering, arm, and end menus configured for two types of
measurements.
The RT60-A and RT60-B RTA instruments are accessed
from the S SETUP key.
7/7/99
Introduction to 824 RTA; Setup Menu
1-15
RT60-A
Although the settings are predefined
in RT60-A and RT60-B, they can be
changed at any time and used as customized setups for a personalized
RT60 measurement. See the 824 Reference manual on creating your own
instrument IDs.
The RT60-A setup is designed to gather data to measure an
RT60 by stimulating a room with a steady state noise. It is
configured in the following way:
• Detector: Linear
• Detector Time: 0.01 seconds
• Autostore: Yes
• PreTrigger: 50
• Save ByTime: Yes
• Triggering: ON
• Trigger Source: 1 kHz
• Arm Mode: L >
• Arm Level: 80.0 dB
• Arm Time: 2.0 second
• Trigger Mode: L <
• Trigger Level: 80.0 dB
• Trigger Time: 00.0000 seconds
• End Mode: Time
• End Time: 3.0 seconds
• Then: Stop
RT60-B
The RT60-B setup is designed to measure an RT60 by stimulating a room with impulsive noise such as a gunshot or a
ballon popping and is configured in the following way:
• Detector: Linear
1-16
System 824 User Manual
7/7/99
•
•
•
•
•
•
•
•
•
•
•
•
•
Detector Time: 0.01 seconds
Autostore: Yes
PreTrigger: 10
Save ByTime: Yes
Triggering: ON
Trigger Source: 1 kHz
Arm Mode: Now
Trigger Mode: L >
Trigger Level: 80.0 dB
Trigger Time: 00.0000 seconds
End Mode: Time
End Time: 3.0 seconds
Then: Stop
Rooms RTA Instrument Definition
The System 824 has an Instrument Definition that makes it
easy to measure room criteria, NCB and RC, using the RTA
in 1/1 octave bandwidth. The setup is configured to take data
for 10 seconds at each location in a room. Each measurement is automatically stored in the Autostore ByTime history.
ROOMS.RTA is configured in the following way:
• Bandwidth: 1/1 octave
• Detector: Linear
• Linear Detector Time: 00.1000 seconds
• Autostore: Yes
• ByTime: No
7/7/99
Introduction to 824 RTA; Setup Menu
1-17
•
•
•
•
•
1-18
Triggering: ON
Trigger Mode: Now
End Mode: Time
End Time: 10.0000 seconds
End Then: Stop
System 824 User Manual
7/7/99
CHAPTER
2
Display Views and Menus
This Chapter explains the various displays available under
the View key. Once a measurement has been taken, the 824
allows you to view the results and manipulate the data.
RTA Views
The RTA Display Views are accessed through the V
View key. To select the RTA Display Views press the V
View key. The following menu will appear:
u
d
Now press therright arrow key to bring up the “View
RTA” display view menu.
up and
down arrow
Use the
keys to highlight the desired display.
The RTA display view menu offers 5 choices: Live, Leq,
Max, Min, and Times. Use the c check key to select the
Live display.
7/7/99
Display Views and Menus
2-1
Live
If the sample time is greater than
0.25 seconds a display spectrum is
generated and displayed to keep the
live data current.
The RTA Live display shows the live spectrum and is the current sampled data with a sample time based upon the detector,
detector time and detector store rate settings. The Live display
is updated regularly when the 824 is running.
Display label
Current filter level in dB
Bandwidth (1/1 or 1/3 oct.)
Selected filter frequency
Live spectrum’s duration
1/1 octave cursor
Leq
V
Press the
View key again to display the “View RTA” menu. Press
up and
down arrow
the
keys to highlight the desired display
check key to select
and press the
the highlighted display.
u
c
d
The LEQ display shows the equivalent level of all the samples. A current or overall reset will reset the Leq.
Display label
Filter level in dB
Bandwidth (1/1 or 1/3 oct.)
Selected filter frequency
Leq spectrum’s duration 1/1 octave cursor
NOTE: Leq, Max, and Min are measured only while triggered, if triggering is enabled. If triggering is disabled they are measured while
R/S key. If Autostore is
the 824 is running by pressing the
enabled, Leq, Max, and Min will be reset at every trigger (or run if
Triggering is off), otherwise they will accumulate for each R/S measurement until manually reset.
s
2-2
System 824 User Manual
7/7/99
Max
There is no correlation between the
RTA Max spectrum which are the bin
by bin maximum values for each filter and the instantaneous maximum
spectrum when the broadband Lmax
occurred. This is a feature of the SSA
instrument.
The Max spectrum shows the maximum level obtained by
each filter and the maximum broadband (Flat) level. This is
a bin-by-bin maximum level. The Max spectrum is reset by
a current or overall reset.
Display Label
Filter level in dB
Bandwidth (1/1 or 1/3 oct.)
Selected filter frequency
Leq spectrum’s duration1/1 octave cursor
Min
u
d
Once in a display view, you can simply use the
up and
arrow
keys to move between the views.
The Min spectrum shows the minimum level obtained by
each filter along with the minimum broadband (Flat) level.
This is a bin-by-bin minimum level. The Min spectrum is
reset by a current or overall reset.
Display label
Filter level in dB
Bandwidth ( 1/1 or 1/3 oct.)
Selected filter frequency
Leq spectrum’s duration
1/1 octave cursor
7/7/99
Display Views and Menus
2-3
Times
The Times display shows the date and time when the overall
measurement began and the date and time when the last
measurement ended. These times are not affected by the
automatic reset or the manual “Current” reset, but are reset
with an “OverAll” reset. The total running time is also displayed. This is the total elapsed time of all measurements
since the previous “OverAll” reset.
Display label
Overall start date and time
Overall end date and time
Overall runtime
Trigger Views
The Trigger Display Views are accessed through the V
View key. To select the Trigger Display Views press the
VView key. The following menu will appear:
Use the uup and ddown arrow keys to highlight “Trigger”.
Now press therright arrow key to bring up the “View
Trigger” display view menu.
2-4
System 824 User Manual
7/7/99
The Trigger display view offers 2 choices: Status and Setup.
Use the c check key to select the Status display.
Status
The Trigger status display shows the current state of the
RTA, showing either Stopped, Ready, Armed, Triggered, or
End. This display shows a copy of the Live spectrum and its
graph. Also displayed is the repeat count when set to repeat
or repeat with average, and the number of samples gathered
pre or post trigger.
Display label
Trigger
Statein dB
Filter level
Selectedsource
filter frequency
Trigger
Repeat count frequency
No.
of pretrigger
bytime
sample or triggered
d
V c
Setup
Use the
down arrow key to move
to the Setup display or press the
VIEW key, highlight Setup and
Check key.
press the
The Trigger Setup display shows the trigger settings in an
interpretive way. Only applicable settings are displayed.
Shows that triggering is turned on
Display Label
Arm conditions
Trigger condtions
End conditions
Repeat measurement 2 times
7/7/99
Display Views and Menus
2-5
The interpretation of the Trigger Setup display is as follows:
• The 824 will arm when the 1 kHz filter is greater than
80.0 dB for a period of 1 second.
• When the level of the 1 kHz filter drops below 80.0 dB
for 0 seconds (immediately), the 824 is triggered and
begins taking a measurement.
• The measurement continues until the End condition is
met which means that the level must drop below 50 dB
for 2 seconds.
• The measurement will repeat 2 more times before stopping.
As the settings are changed the Trigger Setup display will
show the relevent settings in an easy to read form.
Autostore Views
If triggering is enabled, the record is
stored when the End conditon is met
R/S key stops the
or when the
measurement. If triggering is not
enabled the record is stored when the
R/S key stops the measurement.
s
s
l
If you just came from the Trigger
Setup display, press the
left
arrow key to back out to the main
VIEW menu.
2-6
An Autostore is a historical record of triggered data that is
stored automatically when the Autostore setting is set to Yes.
The Autostore includes summary data (Leq, Max, and Min
spectra) covering the entire duration of the Autostore and
ByTime spectra. RT-60 analysis of the ByTime spectral time
history is also provided.
The Autostore Display Views are accessed through the V
VIEW key. To select the Autostore Display Views, press the
V VIEW key and the u up and ddown arrow keys to
highlight “Autostore”. The following menu will appear like
this:
System 824 User Manual
7/7/99
Now press therright arrow key to bring up the “View
Autostore” view menu.
u
d
Press therright arrow key to select the available
Autostore summary data views which are Leq, Max, and
Min.
up and
down
Use the
arrow keys to highlight the desired
display.
Press the c check key to view the Leq display.
Leq
The autostore Leq display shows a bin by bin equivalent
level of all the ByTime Autostore samples.
Autostore occurance date and time
Display label
Record number
Filter
level in(1/1dBor 1/3 oct.)
Bandwidth
Selected filter
frequency
Autostore
duration
Number of autostore records
To move to the next Autostore display, press the c check
key and then the rright arrow key.
7/7/99
Display Views and Menus
2-7
Max
The Autostore Max display shows the maximum level
obtained by each filter and the broadband maximum level
from all the Autostore ByTime records in a particular measurement.
Autostore occurance date and time
Display label
Record number/total records
Filter level in dB
Bandwidth (1/1 or 1/3 oct.)
Selected filter frequency
Autostore duration
Number of autostore records
Min
The Autostore Min display shows the minimum level
obtained by each filter and the broadband minimum level
from all the Autostore ByTime records in a particular measurement.
Autostore occurance date and time
Display label
Record number
Filter level in dB
Bandwidth (1/1 or 1/3 octave)
Selected filter frequency
Autostore
Number ofduration
autostore records
Pressing the c check key twice while in any of these display views will toggle you between the Leq, Max, and Min
autostore displays.
The uup and ddown arrow keys will move you to the
next or previous Autostore records.
2-8
System 824 User Manual
7/7/99
Press the V View key to return to the “View
Autostore”sub- menu.
Press the lleft arrow key to back out to the main “View
Autostore” menu showing Autostore, ByTime, and RT-60
menu items.
Use the d down arrow key to highlight the “ByTime”
menu item and press the rright arrow key to access the
“ByTime” menu and displays.
The following “View ByTime” menu appears:
Press the c check key to view the ByTime spectrums
recorded during the Autostore.
7/7/99
Display Views and Menus
2-9
Autostore ByTime Spectral History
The Autostore ByTime spectral history has two displays for
both ways to view the time history data. The first is called
the ByTime Spectrum and the second is called the ByTime
Graph.
Spectrum
The Autostore ByTime Spectrum display shows just one
sample in time and the entire frequency spectrum with frequency on the horizontal axis.
Autostore record number
Display label
Current
ByTime
Filter level
in dBsample number
Total number of ByTime samples
Selected filter frequency
ByTime sample time
The ByTime display shows that 600
spectra were taken and we are currently looking at record number 597.
c
To move to the ByTime Graph discheck key twice.
play, press the
2-10
With the uup and ddown arrow keys you can view
each ByTime spectrum sample that was recorded. Use the
lleft and rright arrows to move the cursor to look at
each individual frequency.
NOTE: Notice as you move through each ByTime sample that the
sample time changes. A minus sign in front of the time indicates
that they are pretrigger samples. 0 is the time where the trigger
occured.
System 824 User Manual
7/7/99
Graph
The Autostore ByTime Graph display is a time graph of just
one filter frequency, plotted with time as the horizontal axis.
This graph is useful in seeing the level “rise or fall” characteristics of each individual filter.
Autostore
record number
Display
label
Current ByTime sample number
Filter level in dB
Total
numbergraph
of Bytime
samples
Horizontal
scaling
Selected
filter frequency
ByTime sample
time
The uup and ddown arrow keys move you through
each filter. The lleft and rright arrow keys move to
the previous and next ByTime sample.
ByTime Spectrum Check Menu
As discussed earlier, in order to move between the ByTime
spectrum display and the ByTime Graph display you pressed
the c check key twice (toggling between the ByTime Spectrum view and the ByTime Graph view). Pressing the c
check key once when viewing the ByTime spectrum display
puts you in the check menu. The check menu is shown
below:
The check menu offers the following options:
• ByTime Graph - View the time graph of one filter
• Autostore - View the Autostore Leq, Max, and Min spectra
7/7/99
Display Views and Menus
2-11
The Locate menu helps you find the
record you would like to view.
The Find function allows you to enter
the exact record number that you
would like to view
.
The Spatial Averaging displays and
menus are covered later in this chapter.
If 1/3 octave filters are selected, the
Rooms display gives you the Hearing
Threshold Level or HTL for this
spectrum.
• Locate - Locate an Autostore/ByTime record
- Next - The next Autostore record
- Prev - The previous Autostore record
- First - The first ByTime record
- Last - The last ByTime record
- Find - Finds the specified ByTime record
• Average - Add spectrum to spatial average or view spatial spectra average
•
Rooms - View NCB and RC Room Criteria for this spec-
trum (must be in 1/1 octave filters)
• Graph - Adjusts the graph scale and offset (See 824 Reference Manual)
- Graph Level -Allows numerical entry of graph
level in dB.
- Graph Scale - Allows numerical entry of graph
scale
ByTime Graph Check Menu
Pressing the c check key once when viewing the ByTime
spectrum display puts you in the check menu. The check
menu is shown below:
The check menu gives you the following options:
• ByTime Spctrm - View the Bytime spectrum
2-12
System 824 User Manual
7/7/99
The Locate menu helps you find the
record you would like to view.
The horizontal graph adjustment,
(Graph-H), provides a useful feature
that allows you to view a large
amount of time data in the ByTime
Graph view. A scale factor of 1 to
1024 can be selected . A scale factor
of greater then 1 will cause multiple
pieces of time data to be graphed to 1
bar. The measured data can be
left or
viewed by pressing the
right arrow keys. The cursor will
not move to the next graph point until
the selected number of data points
have been displayed numerically.
This facility allows up to 1024
numeric data points to be displayed
for each graph cursor point and
allows the user to observe an overall
shape of the measured data on screen
without the need for scrolling.
r
7/7/99
l
• Autostore - View the Autostore Leq, Max, and Min spectrum
• Locate - Locate an Autostore ByTime record
- Next - The next Autostore record
- Prev - The previous Autostore record
- First - The first ByTime record
- Last - The last ByTime record
- Find - Finds the specified ByTime record
• Graph-V - Adjusts the vertical graph scale and offset
- Graph Level -Allows numerical entry of graph
level in dB.
- Graph Scale - Allows numerical entry of graph
scale
• Graph-H - Adjusts the horizontal graph scale
Press the uup and ddown arrow keys to
adjust the horizontal scale factor.
Press the c check key to exit.
Display Views and Menus
2-13
RT-60
The RT-60 display is accessed by pressing the V View key
and highlighting “Autostore”. The menu appears like this:
Press the rright arrow key to bring up the “View
Autostore” display view menu.
Highlight “RT-60” and press the c check key.
RT60
The RT-60 analysis display uses the ByTime history to calculate a room decay time. This time is calculated from the
cursor position to a point a number of dB down as set by the
“RT60 dB Down” setting and then extrapolated to a drop of
60 dB using a “Least Squares” slope calculation method.
RT-60 time
in seconds at frequency shown
Display
label
Current ByTime sample number
RT-60
dB
down
setting
RT-60
delta
time
Horizontal
graphfrequency
scaling
Selected
filter
ByTime sample time
Total number of ByTime samples
2-14
System 824 User Manual
7/7/99
u
r
d
The
up and
down arrow
keys move you to the next higher and
left
lower filter frequency. The
right arrow keys move you
and
to the previous and next ByTime
sample.
l
An auto-find routine will automatically locate the cursor to
be 5 dB below the maximum level. The auto-find is executed on demand from the check menu and the first time the
RT-60 display is selected. There is a vertical line for the cursor specifying the beginning of the measurement and a horizontal line drawn at the dB down level.
Auto-find also sets the horizontal zoom so that the whole
decay fits on screen.
RT60 Check Menu
Pressing the c check key when viewing the RT60 display
puts you in the RT60 check menu. The check menu is shown
below:
The check menu offers the following options:
• RT60 dB Down - dB down setting for RT-60 calculation
• Auto-Select - Auto-Select cursor position
• Graph-V - See page 2-13 for explanation
• Graph-H - See page 2-13 for explanation
• View Back - Returns you to the previous display
7/7/99
Display Views and Menus
2-15
Spatial Avg Views
The Spatial Averaging facilities allow user selected spectra
to be averaged on an equal weighting basis. It is often used
to average the spectra that were measured at various locations around a noise source or across the length of a wall or
partition. The resulting average is displayed and can be
stored into a history for later viewing.
The Spatial Avg Display Views are accessed through the V
View key. To select the the Spatial Avg Display Views press
the V View key and highlight “Spatial Avg”. The following
menu will appear:
Now press therright arrow key to bring up the “View
Avg” display view menu.
The “View Avg” display view menu offers 2 choices: Spatial
Avg and Avg History. Use the c check key to select the
Spatial Avg display.
Spatial Avg
The “Spatial Avg” display shows the spectra which have
been currently averaged.
2-16
System 824 User Manual
7/7/99
Display label
Bandwidth
or 1/3 oct.)
Selected
filter(1/1frequency
Spatial averaged sample count
*Annunciator or note
Spatial averaged spectrum
NOTE: *If the right digit of the annunciator is numeric then it will
auto-increment with each spatial average store operation from the
check menu.
Any display which shows a spectrum
can be averaged using the “+Average” item on its check menu.
There is effectively no limit on the
number of spectra that may be averaged.
Each display that can show a spectrum has a check menu
item, “+Average”, that, when selected, will prompt the user
“Add to Average?”. It then offers the following choices:
• Yes -averages the spectrum being viewed to those previously averaged.
• No - the spectrum is not averaged into the previous average but the spatial average display is shown
• Cancel - nothing happens and the previous display is
shown
Once, one or more spectra have been averaged, they can be
stored into the “Avg History”.
Spatial Avg Check Menu
The Spatial Avg check menu is shown below:
To access the check menu simply press the c check key
when in the “Spatial Avg” display.
7/7/99
Display Views and Menus
2-17
The 824 will prompt you to reset the
“Spatial Avg” buffer. This does not
reset the “Avg History”.
The check menu offers the following options:
• Note- Note is used to describe this average which is to be
stored to the Avg History
• Store - Store Spatial Average in Spatial Average History
• Reset - Resets the Spatial Average buffer
• Avg History - View the Spatial Average History
• Rooms - View Room Criteria for this spectrum
• View Back - Return to the previous display
• Graph - Adjusts the vertical graph scale and offset
Avg History
If the data being viewed has come
from a stored file, the +average
function is not available and will
beep instead of bringing up the
prompt “Add to Average?”.
The Avg History display shows a history of the spatial averages which have been stored using the “Store” function in
the “Spatial Avg” check menu. Use the V View menu or
the “Spatial Avg” check menu to access the “Avg History”
display.
Occurance
Display
label date and time
Current average history record number
Level in dB of selected filter
Bandwidth
(1/1frequency
or 1/3 oct.)
Selected
filter
Numberaverage
of spectra
averaged
Spatial
history
note field
Total number of spatial average history records
In order to clear the “Avg History”
records, an overall reset is required.
2-18
Use the uup and ddown arrow keys to move to the
previous and next spatial average history records.
To manipulate the “Avg History” records, press the c
check key to access the “Avg History” check menu.
System 824 User Manual
7/7/99
Avg History Check Menu
The “Avg History” check menu is shown below:
If you are viewing an “Avg History”
record use the +average function to
average records which are already in
the average history together.
Remember that all records are
weighted equally. If you have an
average history record which was
comprised of 100 samples it will be
averaged as one record.
The check menu offers the following options:
• Edit Note - Edit the note of this stored record.
• Locate - Locate a Spatial Avg history record
- First - The first Spatial Avg history record
- Last - The last Spatial Average history record
- Find - Finds the specified Spatial Average history record
• +Average - Add spectrum to spatial average
• Rooms - View Room Criteria for this spectrum
• View Back - Return to the previous display
• Graph - Adjusts the vertical graph scale and offset
Rooms Views
NCB and RC are calculated and displayed from any spectral display
including snapshot or Averaged
Spectrum and are accessed from
their individual check menus.
7/7/99
The Rooms Views are accessed from the check menu of
every display that can show a spectrum.
The Rooms displays consist of RC, NCB and HTL. All these
measurements are based on ANSI S12.2-1995.
The NCB and RC Criteria for 1/1 octave data calculates the
following:
Display Views and Menus
2-19
• SIL - speech interference level
• Pass/Fail on Rumble check
• Pass/Fail on Hiss check
• Mid-frequency average Lmf and RC
• Neutral, Hiss, Rumble or Vibration/Rumble check
RC, NCB and HTL are accessed in the “Rooms” display
from any spectrum’s check menu.
NCB and RC are only displayed
when using 1/1 octave filters.
Rooms NCB
The Rooms NCB display shows the noise criterion for the
spectrum being displayed when “Rooms” is chosen from
any spectrum check menu.
Display label
Level
infilter
dB offrequency
selected filter
Selected
Room level in dB
Room data NCB status
NCB curve line, an annoyance or loudness spectrum indication
The “NCB status” indicator can show the following:
• Under - indicates that SIL (speech interference level) is
under the defined range for NCB
• Over - indicates that SIL is above the defined range for
NCB
• (H) - indicates the NCB Hiss check failed
• (R) - indicates the NCB Rumble check failed
u
d
Use the
up and
down arrow
keys to move between the RC and
NCB displays.
2-20
Rooms RC
The Rooms RC display shows the noise criterion for the
spectrum being displayed when “Rooms” is chosen from a
check menu.
System 824 User Manual
7/7/99
Display label
Level in dB of selected filter
Selected filter frequency
Room midfrequency average level
Room data
RC status
RCB line, fixed slope annoyance or interference indication line
The “RC status” indicator can show the following:
• Under - indicates that Lmf (midfrequency average level)
is under the defined range for RC
• Over - indicates that Lmf is above the defined range for
RC
• (N) - indicates the RC is Neutral
• (RV) - indicates the RC Vibration/Rumble check failed
• (R) - indicates the RC Rumble check failed.
Rooms HTL
The “Rooms HTL” display is only
available when 1/3 octave filters are
selected.
The Rooms HTL display shows the Hearing Threshold
Level for the spectrum being displayed when “Rooms” is
chosen from any spectrum’s check menu.
Display label
Level in dB of selected filter
Selected filter frequency
HTL status
The “NTL status” indicator can show the following:
7/7/99
Display Views and Menus
2-21
•
Pass - indicates the recording environment is suitable to
produce recordings without audible background noise
• Fail - indicates the recording environment is NOT suitable to produce recordings without audible background
noise
2-22
System 824 User Manual
7/7/99
Index
A
E
Arm Level ..............................1-9
Arm Logic In ..........................1-9
Arm Mode ..............................1-8
Arm Samples ..........................1-9
Arm Settings Menu ................1-8
Arm Time ...............................1-9
Autostore ................................1-7
Autostore
ByTime Graph
2-10
ByTime Spectral History 2-10
ByTime Spectrum
2-10
Autostore Leq .........................2-7
Autostore Max ........................2-8
Autostore Settings Menu ........1-7
Autostore Views .....................2-6
Average Count .......................1-13
Average History .....................2-18
Average History Check Menu 2-19
End Level ...............................1-12
End Logic In ...........................1-12
End Mode ...............................1-11
End Samples ...........................1-12
End Settings Menu .................1-11
End Then ................................1-12
End Time ................................1-12
Exponential Detector Time ....1-6
Exponential Store Rate ...........1-6
B
N
Bandwidth Setting ..................1-5
ByTime ...................................1-7, 2-10
ByTime Graph Check Menu ..2-12
ByTime Spectrum Check Menu 2-11
P
D
Detector Setting ......................1-5
3/26/99
G
Gain Setting ............................1-5
L
Linear Detector Time .............1-6
Logic Out ...............................1-13
Note ........................................1-15
Pretrigger ................................1-7
R
Repeat Count ..........................1-13
Rooms ....................................1-17
Rooms HTL ............................2-21
i
Rooms NCB ........................... 2-20
Rooms RC ............................. 2-20
Rooms Views ......................... 2-19
RT-60 ..................................... 2-14
RT60 Check Menu ................ 2-15
RT60 dB Down ...................... 1-14
RT60-A .................................. 1-15
RT60-B .................................. 1-15
RTA Leq ................................ 2-2
RTA Live ............................... 2-2
RTA Max ............................... 2-3
RTA Min ............................... 2-3
RTA Settings Menu ............... 1-5
RTA Times ............................ 2-4
RTA Views ............................ 2-1
Run Logic In .......................... 1-13
Run on Input .......................... 1-13
Trigger Time .......................... 1-10
Trigger Views ........................ 2-4
Triggering .............................. 1-8
S
Save ByTime ......................... 1-7
Settings Descriptions ............. 1-5
Settings Menu ........................ 1-2
Spatial Average ..................... 2-16
Spatial Average Views .......... 2-16
T
Then Settings Menu ............... 1-12
Title Setting ........................... 1-5
Transducer ............................. 1-6
Trig Logic In .......................... 1-11
Trig Samples .......................... 1-11
Trigger Level ......................... 1-10
Trigger Mode ......................... 1-9
Trigger Settings Menu ........... 1-9
Trigger Setup ......................... 2-5
Trigger Source ....................... 1-8
Trigger Status ........................ 2-5
ii
system 824 user manual
3/26/99