1
Economical Real-Time Monitoring of Power Consumption
Colin Copeland
December 13, 2006
Contents
1 Introduction
1
2 Feedback, Behavior, and The Consumer
2.1 Public Posted Feedback . . . . . . . . . . . . . . . . . . . . . . . . . . . . . . . . . .
2.2 Simple Meter Reading . . . . . . . . . . . . . . . . . . . . . . . . . . . . . . . . . . .
2.3 Setting Goals with Natural Gas Consumption . . . . . . . . . . . . . . . . . . . . . .
3
4
5
6
3 Proposal
7
4 Earlham Energy Awareness Project
8
5 EEAPnode Solution
5.1 Develop Baseline System . . . . . . . . . . .
5.2 Build Sensor . . . . . . . . . . . . . . . . .
5.3 Signal Conditioning and Calculating Power
5.4 Data Acquisition . . . . . . . . . . . . . . .
5.5 Calibration . . . . . . . . . . . . . . . . . .
5.6 Results . . . . . . . . . . . . . . . . . . . . .
1
.
.
.
.
.
.
.
.
.
.
.
.
.
.
.
.
.
.
.
.
.
.
.
.
.
.
.
.
.
.
.
.
.
.
.
.
.
.
.
.
.
.
.
.
.
.
.
.
.
.
.
.
.
.
.
.
.
.
.
.
.
.
.
.
.
.
.
.
.
.
.
.
.
.
.
.
.
.
.
.
.
.
.
.
.
.
.
.
.
.
.
.
.
.
.
.
.
.
.
.
.
.
.
.
.
.
.
.
.
.
.
.
.
.
.
.
.
.
.
.
.
.
.
.
.
.
.
.
.
.
.
.
.
.
.
.
.
.
8
8
9
10
11
11
12
Introduction
Energy is a crucial national and international concern. It’s tied closely to environmental problems,
much of it is imported, and unequal global consumption raises questions of international resource
equity and sustainability (Smoot 1995). The total United States energy consumption in 1992 was
82.4 quads of energy, more than any year in the past and accounts for one-fourth of global energy
use, despite having less than 5% of the total world population. Coal, the most significant energy
source for electricity, has a vast reserve base exceeding 425 billion metric tons across 32 states, far
exceeding both natural gas and crude oil, whose reserves are fairly limited (Tillman, Warshauer, and
Prinzing 1995). One estimate (Ashworth and Little 2001) on natural gas world reserves believes
about 5,100 trillion cubic feet (TCF) of natural gas remains, while the United States currently
consumes 22 TCF annually. Further, fossil fuel usage is tied very closely to environmental concerns.
The combustion of coal produces nitrogen and sulfur oxides that are the key causes of acid rain and
nitrogen oxide can lead to an increased production of ozone in the troposphere and stratospheric
ozone depletion (Smoot 1995). The burning of natural gas, like other fossil fuels, produces carbon
dioxide, but almost no other waste other than water vapor (Tillman, Warshauer, and Prinzing
1
!"#
$%#
&'#
&#
Coal
6ther 8!rewood<
Electricity
6il
"#
Natural gas
>ercentage of Aotal
Energy Bources
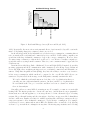
!esidential Energy Sources
Figure 1: Residential Energy Sources (Komor and Moyad 1995)
1995). Regrettably, the most serious environmental effects of actions made today will occur in the
future. Long lasting changes in consumer behavior are needed.
As shown in Appendix A, the industrial sector leads in energy consumption, consuming almost
twice as much as the residential and commercial sectors combined. Public utility companies can
spend time with large industrial consumers to help reduce energy consumption. However, there
are many, many consumers, so this method would not be cost effective for utility companies to
spend time with every single small consumer. Therefore, some consumers must be approached in
a different way.
In an interview with Gregg Duke of Richmond Power and Light (RPL), I inquired about their
metering equipment and their communication with consumers about reducing energy. Richmond
Power and Light offers on sight monitoring services to residential, commercial, and industrial consumers. Using Data Acquisition Units (DAQ), they have the ability to monitor every circuit to
isolate energy consumption, which can then be compared to the over all bills. RPL believes consumers are very interested in their usage, as the DAQ units constantly remain in the field.
We tend to think the residential customers don’t have a lot of sophistication that you
generally associate with an industrial customer, but there’s still a lot of sophistication
in a residential audit. You go to a residence and there’s a lot more education to it then
there is data analysis.
Generally, residences contact RPL about saving money. For example, a common concern is with
heating bills. The first step taken is to educate the customer —inform them about programmable
thermostats, more efficient appliances, or encourage them to look into alternative types of heating
systems, like geothermal heating and they investigate other large energy users, like dehumidifiers
and air conditioners. Further, in relation to utilities spending time with larger customers, they’ve
setup test systems to allow industrial consumers to closely monitor consumption. For example,
a wireless web server continuously monitors Hill’s Pet Nutrition Inc. around the clock, allowing
workers to log on track their consumption at any time. Monitoring usage statistics and collecting
2
continuous data over time allows the information to be quantified for the consumer, “a picture is
worth a thousand words, and that’s no joke here... If you educate them, they will change.”
Figure 1 shows that natural gas and electricity are significant energy sources for residential
energy consumption. Monitoring gas use would require severing gas lines, which is possible, but
not the easiest method. Electricity is an easier resource to monitor, because monitoring equipment
can be installed without interrupting the service. How can we help people change their behavior
and conserve?
2
Feedback, Behavior, and The Consumer
Energy use is generally invisible to the consumer (Darby 2006). Domestic energy use, being limited
to monthly utility bills, is directed towards the cost of each utility, and leads consumers to think
solely in terms of dollars per month. People may hold vague ideas about their energy consumption,
but it usually doesn’t concern their day-to-day behavior and activity. Although single everyday
actions use small amounts of energy on a national scale (aggregated across millions of people and
billions of occasions) they must be taken into consideration (Stern 1981).
For that reason, there must be a focus on behavior. Consumer behavior is influenced by feedback
and Darby outlines various types of feedback, including: direct, indirect, and inadvertent (Darby
2006).
Direct feedback is available on demand; the consumer learns by looking or paying. Self-meterreading, direct display, and interactive feedback via a PC are all examples of direct feedback. All
involve having direct access at any time to information. This can be as simple as walking outside
to read utility meters. Further, a computer can be used to present feedback information, possibly
displaying consumption statistics over time or allowing the homeowner to interact with the data
(view specific time periods, change the rate feedback, generate graphs, etc).
Indirect feedback is learning by reading and reflecting. Rather than seeing how certain activities
directly effect energy consumption with frequent feedback, the feedback is presented indirectly, in
that the data is processed by the utility and sent out to customers on a larger time scale. Utility
bills are examples of indirect feedback; they can be very detailed with historical information, etc,
but are less frequent. Therefore the consumer reads and reflects on what they did, rather than
seeing their actions directly effect the feedback, i.e. looking at a meter and seeing how a space
heater consumes electricity.
Finally, inadvertent feedback is learning by association. For example: small scale microgeneration. In contrast to energy consumption, micro-generation allow homes to generate energy
through the use of photovoltaic (PV) arrays, wind turbines, etc. Generation on a small scale forces
consumers to watch their energy habits closely. Weather can directly effect energy production —
cloud cover and calm days greatly decrease energy production. Home owners learn to pay attention
to weather changes, changing their behavior accordingly. This form of inadvertent feedback leads
consumers to not only monitor their battery banks on a day-to-day basis, but to be aware of the
weather as well. They’re the fully informed and aware consumers.
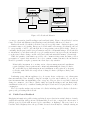
Beyond the various forms of feedback, an integral aspect lies in with how it effects the consumer.
van Houwelingen and van Raaij outline the functions of feedback. Information through feedback
is used as a basis for improvement. For example, consumers may not be aware of changes they
can make to conserve energy. However, they can learn to understand the results of their actions
through different types of feedback and reduce their uncertainty. van Houwelngen and van Raaij
believe this influences habit formation. Subsequently, as habits are being set and reinforced, people
are behaving in an “energy conscious way” and this behavior causes people to adapt new attitudes
3
Behavior
Effects
Feedback
Leads to
Types of Feedback
Habit Formation
Direct
Inadvertent
Guides Internalization
of Behavior for
Indirect
New Attitudes on
Energy Conservation
Figure 2: Feedback and Behavior
on energy conservation (van Houwelingen and van Raaij 1989). Figure 2 shows Darby’s various
forms of feedback and illustrates van Houwelngen and van Raaig’s functions of behavior.
Further, the method by which feedback in conveyed is very important —display, frequency, and
presentation improve it’s quality. Energy use feedback with better message presentation can lead
to energy savings of 10% to 20% through direct energy-saving actions (Stern 1981). Therefore,
combining data frequency with better presentation can lead to substantial savings. “Feedback adds
no information beyond what is already on people’s utility meters, but it provides the information
soon after any behavior change, and in a vivid and easily understandable manner” (Stern 1981).
While the quantity of information provided to the consumers is important, the main goal is a
presentation to capture their attention. In order to sustain consumer attention, the information
should be persuasive enough to penetrate into their day-to-day activities.
Behaviorally, investment is a one-time action, whereas management and curtailment
require changing behavior patterns and continuously maintaining the changed behavior.
We would thus expect that management and curtailment would require more frequent
feedback to make visible the energy effects of changed behavior. (Kempton, Darley, and
Stern 1992)
Purchasing energy efficient appliances (e.g., hot water heater, refrigerator, etc), thermostats
that automatically reduce heating/cooling use at night, low flow water utilities, etc, are all one
time investments that can significantly reduce energy use. However, there is very little behavioral
change in consumers. According to (Darby 2006) and (van Houwelingen and van Raaij 1989),
curtailment is achieved by consumers learning through feedback and developing habits to reduce
consumption,
The below studies analyze various forms of feedback, including public feedback, feedback frequency, and goal setting with feedback.
2.1
Public Posted Feedback
Displaying information for public viewing can bring about a reduction in certain behaviors. A study
(van Houten and Nau 1981) performed in Dartmouth, Nova Scotia, compared the effectiveness of
publicly posted feedback with increased police surveillance on highways. The test focused on a
four-lane divided highway where the speed limit decreased from 80 km/h to 50 km/h entering an
4
urban area. A large sign, placed adjacent to the speed limit sign, displayed the percentage of drivers
traveling under the speed limit the previous week (“Drivers Not Speeding Last Week”) and the
highest percentage achieved to (“Best Record”).
The study showed that public posting achieved greater percentage reductions relative to the
baseline averages than the police radar surveillance and ticketing, concluding that public posting
was at least 10 times more efficient in controlling speeding (van Houten and Nau 1981). The
researchers believe that “strict enforcement is not effective in reducing speeding behavior” (van
Houten and Nau 1981), and suggests the driver slows down only when the police vehicle is visible
to him.
This form of indirect feedback is unique, in that it’s approach is a public posting. The posting
displays speeding information relating to drivers as a group, while the feedback is reflected upon
individually by each driver. Drivers reflect on not only their personal speeding behavior, but see
where they stand in relation to the average driver. Therefore, the drivers ideology plays a significant
role in their behavior (i.e. considering their effect on the group as a whole and slowing down or
reflecting on the posting solely as an individual and feeling speeding is OK because the average is
low).
In conclusion, public posted feedback brought about a significant reduction in the number of
speeding drivers. The average was decreased, even though not everybody probably participated in
the reduction.
2.2
Simple Meter Reading
The study was performed on 40 homeowners in identical three-bedroom town houses in New Jersey.
During the summer months, after recording baseline values, homeowners were told they were in an
energy study and were informed of energy saving techniques (focused primarily on air conditioning,
which consisted of 70% of the electricity used by the homes (Seligman and Darley 1977)). The
households were then randomly assigned to a control or feedback group.
For the feedback group, a research assistant read the electric meters on a daily basis to calculate
the consumption. They also maintained a predicted performance value, which was calculated using
the last 24-hour consumption value and hourly temperature readings. Therefore, using a regression equation, the researchers could predict daily electric consumption from average temperature
readings (Seligman and Darley 1977). Every day at 5:00 PM, each households consumption value,
along with their prediction, was inserted into a 5 x 3 inch plastic number display that was set up
in the kitchen window. Homeowners could then see how well they performed the previous day in
comparison to their predicted performance. The predicted value is, in effect, the target or goal
each homeowner can strive to achieve.
In the end, the feedback group consumed 10.5% less electricity than the control group –
suggesting direct feedback significantly assisted in consumption reduction. In comparison to the
previous study, feedback focused on the homeowners individually, rather than combining and displaying the information to their neighbors. The plastic number display could very well have been
turned around to face their neighbors, allowing the surrounding households to see each homeowners
consumption reduction as well. The results might have been much different. A combination of both
methods could possible have achieved the greatest reduction.
On a separate note, the researchers opted not to use an automatic monitoring system:
A totally automated system to give feedback is by no means beyond the range of engineering technology: Electrical components are available from which such a system
could be constructed, but we did not attempt to build it for the present study. Cost
5
and time-consuming problems are involved in producing several devices that would be
reliable and cheap. (Seligman and Darley 1977)
The participating households agreed to allow a researcher to enter their yard and read the
electric meter. Would more frequent or detailed feedback, which would have been impossible with
the method they used, have changed the average consumption reduction?
While direct feedback significantly effected consumption, many questions still remained unanswered. For example, no post-experimental data was collected. How long will the effects of feedback
persist after the study? Maybe the information presented in feedback could have changed. Would
displaying the feedback in dollars and cents been more effective?
2.3
Setting Goals with Natural Gas Consumption
A natural gas conservation study (van Houwelingen and van Raaij 1989) focused on a large number
of identical rental homes in Nieuwegein, Netherlands. Most Dutch homes are heated with natural
gas. A subset of the total of the 325 participating families agreed to strive for a savings of 10%, while
the houses that did not agree to the conservation goal were assigned to a separate control group.
Fifty select households received electronic devices to monitor natural gas use, called “Indicators”,
which displayed the daily amount of natural gas in comparison with the conservation goal. The rest
of the testing group was divided into two groups: one received monthly external feedback about
their gas use and the other monitored their own gas use by looking at their utility meters.
The study hypothesized the following:
1. Goal-setting and the use of the Indicator (plus information about energy conservation) will
reduce the use of natural gas for home heating.
2. The reduction of gas use in the Indicator condition will be larger than in the monthly external
feedback and self-monitoring conditions.
3. The reduction of gas use in the experimental conditions will be larger than in the control
conditions (if there is a reduction in the control conditions at all).
4. The reduction of energy use use in the Indicator condition (and in the other experimental
conditions) will last after the experimental period of one year; i.e., there will be a significant
difference between the experimental and the control groups in long-term effects.
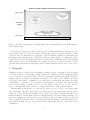
Experimental groups are shown in relation to their presentation frequency and quality in Figure 3. The self monitoring group with limited presentation quality (reading consumed therms on
standard meters outside of the household) had the option of checking their meters as frequently
as desired (direct feedback), but ended up tailing the other two groups with an average reduction
of 5.1%. The informed group, with feedback on a monthly basis (indirect feedback, less frequent),
received detailed reports of their consumption patterns in the mail and achieved an average reduction of 7.7%. Finally, the greatest average reduction of 12% was achieved by the Indicator group,
who had feedback presented on digital displays in their living rooms (direct feedback).
To test the fourth hypothesis, all testing conditions were removed from participating households
and the energy used during the year following the experiment was recorded for each group. The
results show that energy use in the groups (including the Indicator group) during the experimental
period did not hold during the post-experimental period. This suggests that the feedback had an
effect only during the period it was given and that no long term habit formation or internalization
occurred.
6
Natural Gas Study-Feedback Presentation and Frequency
>$?@e)*A,aB$'C
Presentation
Quality
!"d$ca'()*+)(,-*
.*/("0e)2ed*
345
!":();ed*
+)(,-*.*
/("0e)2ed*
<=<5
EeB:*6("$'()$"?*+)(,-*.*
/("0e)2ed*F=35
9(De)*A,aB$'C
9e00*F)e8,e"'
Presentation Frequency
6()e*F)e8,e"'
Figure 3: Feedback comparisons for participating groups in natural gas study (van Houwelingen
and van Raaij 1989)
In conclusion, energy monitoring feedback presented to participants with a goal-setting ideology
has a positive effect on energy conservation. Participants reported a growing awareness of their
energy use and over half said they would like to have the Indicator installed permanently (van
Houwelingen and van Raaij 1989). “The Indicator has a positive impact on consumer knowledge
of household energy use and helps residents reduce their gas use” (van Houwelingen and van Raaij
1989). However, the post-experimental period implies the effects of energy monitoring feedback
only lasts when present and residents may require a reminder in their home in order to save energy.
3
Proposal
Changing energy use behavior has a promising potential for energy conservation. Feedback plays
a very important role in increasing consumer awareness. Timely feedback is helpful in guiding
people to effective conservation behavior. Feedback presentation quality is important. The more
unequivocally the feedback gives information, the more effect it has on the consumer. Feedback
perspective is important to consumer ideology. Obviously, ones principals can greatly effect their
commitment to conservation. Incorporating feedback inputs to encompass more than a single
person and presenting a combined view to everyone involved, allows one to see not only how
they’re performing historically, but also to compare their efforts to that of their neighbors.
Instrumenting feedback can be a costly process, but it proves to be more cost effective than
other alternatives. Houten compared the cost effectiveness of police surveillance and the public
posting procedure (van Houten and Nau 1981). On the other hand, Seligman and Darley used
man-hours instead of an automated system to implement their feedback presentation, stating “cost
and time-consuming problems are involved in producing several devices that would be reliable and
cheap” (Seligman and Darley 1977). van Houwelingen and van Raaij not only used man-hours to
send detailed monthly reports to homeowners but also demonstrated the use of Indicators for gas
consumption.
7
Providing consumers with a permanent daily check can give greater insight into consumption
for continuous services, like electricity, gas, water, etc. A cheap, cost-effective automated system
can provide frequent feedback and implementing a well executed message presentation system to
convey consumption information will help with energy conservation.
4
Earlham Energy Awareness Project
The Earlham Energy Awareness Project (EEAP) is an incentive program to increase energy awareness of students living in campus housing. By promoting conservation efforts on campus, EEAP
hopes to create a student body conscious of their consumption in hope of decreasing the environmental footprint of the college. EEAP collects the houses utility bills (electricity, gas, and water)
every month. The quantity consumed for each utility is compared to a baseline consumption value
(a three year rolling average for that month). If a house uses less energy than the baseline value,
the difference is recorded. The three year rolling average is a target value for each house —this goal
is the same method used for the homeowners predicted value in the Simple Meter Reading study.
The difference for each utility is displayed online on the EEAP website, so that students can
monitor their conservation efforts. Detailed listings by utility and historical consumption information is available online as well. The website aims to achieve a high level of feedback quality and
message presentation. Further, EEAP provides an interface for students to compare their conservation efforts to each other. This allows students to compete for a higher ranking in percentage
reduction. Displaying this information publicly and allowing it to be easily compared, relates back
to the public posting in the feedback and speeding study.
To motivate student conservation, EEAP will reward the students by returning a percentage
of their conservation efforts in money —66% of their savings. The remaining 33% is returned to
the college. This allows both the college and students to benefit from the project. At the end of
each semester, the savings will be totaled and distributed to the house residents. Therefore, EEAP
hopes to motivate students by rewarding them money for achieving a consumption level thats less
than their target value (the three year rolling average).
The method of feedback presented to the students relates closely to the feedback given to
the “Informed Group” in the the natural gas conservation study. Feedback frequency is a key
item missing in EEAP, which has the capability to display more information in an accessible way.
What if the students had direct, frequent feedback, like the “Indicator Group”? Students living
in campus housing cannot purchase energy efficient hot water heaters, install proper insulation,
etc. However, they can learn to reduce energy use with the utilities they have. As supported
in the studies above, an automated power monitoring system can dramatically increase consumer
awareness, more effectively than through indirect feedback. If students had access to live, frequent
data, then they could focus on decreasing energy consumption. Hopefully, attitudes favorable to
conservation will develop and help to sustain the motivation to the students.
5
5.1
EEAPnode Solution
Develop Baseline System
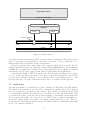
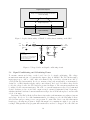
First, I plan to develop a preliminary baseline system using a single board computer (SBC) connected to a power monitoring device called a WattNode. Continental Control Systems offers the
WattNode, which is a true RMS AC watt-hour meter with TTL level pulse output proportional to
kilowatt-hour consumed. Installation of the WattNode requires a direct connection to the circuit
8
Single Board Computer
Digital Input/Output (DIO)
Pulse Output Proportional to kWh Consumption
WattNode
Current
Voltage
Current Transformer
Phase A
120 VAC
LOAD
LINE
Neutral
Figure 4: Baseline System
for voltage and current transformers (CT) to measure current. Continental Control Systems offers
split core (opening) current transformers, which have a removable section, so that they can be
installed without disconnecting the circuit being measured.
Technologic Systems offers compact single board computers (SBC). I chose to use the TS-5500,
which is a standard x86-based PC compatible computer with an AMD Elan520 processor running at
133MHz. It boots a distribution of Linux off of a compact flash (CF) card for a simple development
environment. The TS-5500 is equipped with TTL level digital input/output (DIO) lines.
Connecting the WattNode TTL level output to the TS-5500 (as shown in Figure 4, I’ve written
C-code to monitor the DIO ports on the board. My program uses kernel timers to poll the DIO
ports at discrete intervals, checking to see if it registers a pulse. After making sure not to count
the same pulse twice, the pulse count in incremented. My code is attached in the appendix.
5.2
Build Sensor
The SBC and WattNode combination is expensive. Further, the SBC isn’t being fully utilized.
The WattNode uses hardware to monitor power consumption in real time and provides output in
the form of pulses proportional the power consumed. It is basically converting an analog signal
to a digital signal, which the TS-5500 can read on it’s DIO ports. The same functionality could
be performed in software on the TS-5500, as shown in Figure 5. Alternating current (AC) in the
U.S. is generated at 60 Hz, or 60 cycles per second. The TS-5500 is equipped with multiple 12bit analog-to-digital (A/D) ports, capable of performing 20,000 samples per second. Therefore,
monitoring AC on the SBC is possible in software, allowing the SBC to be fully utilized and saving
money by not using the WattNode.
9
Single Board Computer
Polling at Discrete Intervals to Sample Instantaneous
Current and Voltage
Analog to Digital (A/D)
Signal Conditioning
Current
Voltage
Figure 5: Replace functionality of WattNode with software running on the SBC
F1
R1
AC In
±85V
R2
A/D
±16V Max
R2: 1/4 W 1% 590 !
R3: 1% 1 k! Single-Turn Trimmer Potentiometer
D2
D3
D4
R3
F1: 1/8 A Fuse
R1: 1 W 1% 6 k!
D1
D1-D2: DO-35 500mW 12V 5% Zener Diode
D3-D4: 1N914 Switching Diode
Figure 6: Voltage divider and signal conditioning circuit
5.3
Signal Conditioning and Calculating Power
To measure current and voltage on the board, I need to do signal conditioning. The voltage
measurement must take into account that the input voltage is 120VAC. The TS-5500 has analog
input ranges up to -10V to +10V, with each channel being over-voltage tolerant from -16V to
+16V (Technolgic Systems 2003). In order to measure voltage and current safely, a circuit must be
designed to condition signals enough to safely connect them to the board. I’ve built a voltage divider
to step the voltage down to the TS-5500 levels, pictured in Figure 6. The current measurement can
be assisted by the current transformer. The solid core current transformers offered by Continental
Control Systems, produce 0.333 VAC output at rated current (Continental Control Systems ),
which means that a 30A rated current transformer will produce 0.3VAC when placed on a line with
a load of 30 amps.
In software, the SBC polls the A/D at discrete intervals to take instantaneous readings of current
and voltage. In order to record the maximum number of readings per cycle, the SBC must dedicate
all of it’s time and processing power to my program. To ensure this, I wrote a module that runs in
kernel space, allowing my program to disable interrupts before running in a tight loop to take its
readings. This guarantees my program will remain active and not be swapped off so the SBC can
10
Figure 7: EEAPnode watt-hour calibration using WattsUp? Pro
handle other tasks. My module can then relinquish it’s priority and allow the SBC to perform other
tasks. Average power can then be calculated by dividing over the period (the number of recorded
readings). This information is written into the proc filesystem, which is readable from user space.
5.4
Data Acquisition
In order to make the information presentable, it must be acquired from the SBC. Using kernel
timers, a user program reads the proc file created by the power monitoring kernel module multiple
times a second. It packages the information into a protocol data unit (PDU) and pushes the packet
through a TCP socket. At the other end of the pipe, a server receives the packet and stores it in a
postgres database.
5.5
Calibration
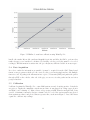
I calibrated against the WattsUp? Pro, a true RMS watt meter and electricity monitor. It includes
an option to display the cumulative watt hours used since it was plugged in. Using a space heater
and light board consisting of 5 light sockets, each powering a 100W incandescent light bulb, I ran
a series of 10 minute tests under various constant loads. I recorded the various watt-hours, plotted
them against my values, and plotted linear regression line, as shown in Figure 7. I used the linear
equation to calibrate my readings.
11
10 Minute Calibration Results
1800
WattsUp?
EEAPnode
1600
1400
Watt-Hours
1200
1000
800
600
400
200
0
0
10
20
30
40
50
Minutes
60
70
80
90
Figure 8: Results of EEAPnode against WattsUp?
5.6
Results
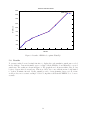
To test my results, I created a simple interface to display the total cumulative watt-hours recorded
in the database. I ran an 80 minute test, recording both the EEAPnode and WattsUp? reported
watt-hours. The results are shown in Figure 8. The graph shows both meters inline early on, but
begin to digress after about an hour. This is probably due to my calibration time being limited
to a short 10 minute interval. Ideally, running a series of tests spanning longer periods of time
would produce more accurate readings. I believe doing this would train the EEAPnode to be more
accurate.
12
Works Cited
Ashworth, William and Charles E. Little. Encyclopedia of Environmental Studies. New edition.
New York, NY: Facts on File, Inc., 2001.
Continental Control Systems. Split Core (Opening) Current Transformers.
Darby, Sarah. “The Effectiveness of Energy Feedback on Energy Consumption: A Review for
Defra of the Literature on Metering, Billing and Direct Displays.” Environmental Change
Institue, University of Oxford (2006).
Kempton, Willett, John M. Darley, and Paul C. Stern. “Psychological Research for the New
Energy Problems.” American Psychologist 47 (October 1992).
Komor, Paul and Andrew Moyad Energy Consumption in the United States. Volume 2 of Encyclopedia of Energy Technology and the Environment. John Wiley and Sons, Inc. 1995.
1131–1141.
Seligman, Clive and John M. Darley. “Feedback as a Means of Decreasing Residential Energy
Consumption.” Journal of Applied Psychology 62 (1977): 363–368.
Smoot, L. Douglas Coal Combustion. Volume 1 of Encyclopedia of Energy Technology and the
Environment. John Wiley and Sons, Inc. 1995. 731–768.
Stern, Paul C. “What Psychology Knows About Energy Conservation.” American Psychologist
47 (October 1981): 1224–1232.
Technolgic Systems. TS-5500 User’s Manual, Oct 2003.
Tillman, David A., Jeffrey Warshauer, and David E. Prinzing Fuel Resources. Volume 2 of
Encyclopedia of Energy Technology and the Environment. John Wiley and Sons, Inc. 1995.
1437–1444.
van Houten, Ron and Paul A. Nau. “A Comparison of the Effects of Posted Feedback and
Increased Police Surveillance on Highway Speeding.” Journal of Applied Behavior Analysis
14 (1981): 261–271.
van Houwelingen, Jeannet H. and W. Fred van Raaij. “The effect of goal-setting and daily
Electronic Feedback on In-Home Energy Use.” Journal of Consumer Research 16 (June 1989):
98–105.
13