1
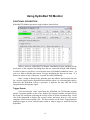
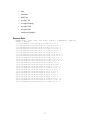
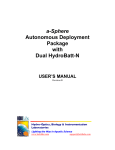
HydroRad Tilt Monitor
Software
USER’S MANUAL
H
Hyyd
drroo--O
Op
pttiiccss,, B
Biioollooggyy &
& IIn
nssttrru
um
meen
nttaattiioon
n
L
a
b
o
r
a
t
o
r
i
e
s
Laboratories
Lighting the Way in Aquatic Science
www.hobilabs.com
[email protected]
Revisions
Initial release August 2008
-2-
Introduction
DESCRIPTION
HydroRad Tilt Monitor is a program that displays and records data from a
tilt/roll/heading sensor built into a HydroRad radiometer system. The Tilt Monitor
program works independently of the RadSoft software that handles optical data from the
HydroRad, but it monitors signals from the HydroRad that allow it to record samples that
are synchronized with RadSoft’s optical data.
COMPUTER REQUIREMENTS
This program will run on any Pentium or equivalent processor, and any edition of
the Windows operating system starting with Windows 2000.
HARDWARE REQUIREMENTS
HydroRad Tilt Monitor requires a HydroRad equipped with a tilt/roll/heading
sensor, and a HOBI-supplied interface box that applies the sensor’s data and
synchronizing signals to an appropriate port on the computer. Typically this interface
box will connect to the computer through USB.
INSTALLATION
The program is supplied as a standalone installer, with a name in the form
“InstallHydroRadTiltMonitorXXX.exe,” where XXX is the version number. Simply run
this program and follow the instructions on the screen.
-3-
Using HydroRad Tilt Monitor
FUNCTIONAL DESCRIPTION
HydroRad Tilt Monitor presents a single window, shown below.
When it starts up, HydroRad Tilt Monitor immediately begins searching all the
serial ports on the computer (including those that are connected through USB adapters),
in order to detect a port that is receiving data from a HydroRad orientation sensor. As
soon as it finds a suitable data stream, it begins displaying the data in real time. If it
detects no sensor on any of the ports, it repeats the search indefinitely.
Once a sensor is detected on a particular port, the software also monitors the port
for a special signal from the HydroRad that indicates when it is collecting light spectra.
Each time the HydroRad collects a spectrum, it indicates the start and end of the
integration time through this signal.
Trigger Events
Upon receiving the “start” signal from the HydroRad, the Tilt Monitor program
assigns a sequence number to the event, displays the sequence number and start time in
the events list, and begins collecting the average values of all the orientation data. At the
end of the integration it displays the average values, and stores them in a file on the
computer, if the user has opened a file. The user can also use the Force Trigger button to
manually trigger an event, with the same results as when a trigger is received from the
HydroRad.
-4-
After these data have been collected in a file, the time tags on each events can be
used to correlate it with HydroRad spectra that are collected separately by RadSoft, the
separate software that interfaces directly to the HydroRad.
ORIENTATION DATA DEFINITIONS
Time: The time displayed in the real-time indicators at the top of the window is the most
recent time at which data were received from the orientation sensor. The sensor normally
produces 10 samples per second, so this time continuously updates as long as the sensor
is powered and connected.
Tilt: the angle, in degrees, by which the HydroRad deviates from vertical orientation. It
is independent of the direction in which the instrument tilts (unlike pitch and roll), and its
value is always greater than or equal to zero.
Heading: Heading indicates the HydroRad’s axial rotation relative to the earth’s
magnetic field.
Pitch and Roll: Pitch and roll are the angles, in degrees, by which the HydroRad
deviates from vertical orientation, with respect to two orthogonal vertical planes. They
are distinguished from the single “tilt” value in that they can be positive or negative, and
in combination they indicate not only the magnitude of tilt, but also its direction.
Normally the magnitude of the tilt, regardless of direction, is the primary parameter of
interest, and that is the value that is reported as “tilt,” described above.
CONTROLS
“Status” indicator
Text and color are used to indicate the status of the orientation sensor data.
“Searching..” (with yellow background) indicates that the program has not yet identified
a suitable sensor and is testing all the ports on the computer to find one. “Ready” (with
green background) indicates that a sensor has been identified and its port is open.
“Integrating” (with red background) indicates that a trigger event is in progress.
“Data” indicator
This small box flashes green when data are received from the orientation sensor.
It will flash continuously when the system is operating normally.
Time, Tilt, Heading, Pitch and Roll indicators
These display the orientation information received from the sensor in real time.
Normally they update ten times per second. If the sensor’s tilt goes outside its nominal
60-degree range, the orientation indicators turn red and say “over” to indicate the data are
not valid.
-5-
“Create Capture File…” / “Close File” Button
Click on this button to create a file into which trigger events will be logged. It
presents a standard Windows “Save As” dialog box through which you can specify the
name and location of the file to create. Once the file has been created, all trigger events
will be recorded in the file until it is closed.
Whenever a file is open, the name of the button changes to Close File, and the
name of the file is display below the button.
Note that creating a file does not save the events that are displayed in the trigger
events list at the time the file is created. Only events received after the creation of the file
are saved in the file. However you can copy text from the trigger events list, using
standard Windows clipboard commands.
“Force Trigger” Button
Clicking this button produces the same result as receipt of a trigger signal from
the HydroRad. Upon the initial click, a new sequence number and start time will appear
in the event list. When the button is released, the end time and average values of the
orientation data will be displayed, and if a capture file is open, saved to the file.
Reset Seq# Button
The program automatically assigns a sequential number to each trigger event.
This button resets the sequence number so that the next trigger event will be counted as
number 1. The sequence number is only ever reset in response to this button, or when the
program is first started. Opening or closing a file does not reset it.
Exit Button
Clicking this button immediately closes the capture file, if any, and terminates the
program.
Trigger Events List
The trigger events list (which is initially blank) contains a line for each time a
trigger is received from the HydroRad, or is initiated by a user clicking the “Force
Trigger” button. Each line contains a sequence number, start time, and end time, and
then averages of the orientation data measured throughout the event time. The last
column, labeled “N,” indicates the number of samples that were averaged for the event.
CAPTURE FILE FORMAT
Event records are stored in capture files as simple comma-separated text. The
program allows you to select a .txt or .csv extension for the file, but the format is the
same in either case. (You can also enter an arbitrary extension when naming the file).
The parameters stored are the same as those displayed in the event list, except that they
include the date:
•
Sequence number
-6-
•
Date
•
Start time
•
End Time
•
Average Tilt
•
Average Heading
•
Average Pitch
•
Average Roll
•
Number of Samples.
Example Data:
Number,Date, Start time, End Time, AvgTilt, AvgHeading, AvgPitch,
AvgRoll, Samples
1,07/18/2008,09:13:07,09:13:07,6,344,5.9,-0.4, 2
2,07/18/2008,09:13:08,09:13:08,10.5,350,8.6,-5.8, 2
3,07/18/2008,09:13:09,09:13:09,8.4,347,-8.3,-0.2, 2
4,07/18/2008,09:13:10,09:13:10,10.5,326,-4.7,8.6, 2
5,07/18/2008,09:13:11,09:13:11,17.1,328,4.7,16.4, 2
6,07/18/2008,09:13:12,09:13:12,15.6,334,15.6,-1.1, 2
7,07/18/2008,09:13:13,09:13:13,18.5,352,11.2,-14.5, 1
8,07/18/2008,09:13:14,09:13:15,18.1,179,-9.6,-15.2, 2
9,07/18/2008,09:13:15,09:13:16,12.2,348,-9.5,-7.6, 2
10,07/18/2008,09:13:17,09:13:17,12.7,346,-8.8,-9.1, 2
11,07/18/2008,09:13:18,09:13:18,8.1,338,-1.8,-7.9, 2
12,07/18/2008,09:13:19,09:13:19,6.2,330,6,-1.1, 2
13,07/18/2008,09:13:21,09:13:21,8.4,331,6.8,-4.9, 1
14,07/18/2008,09:13:22,09:13:22,4.9,341,2.7,-4.1, 2
15,07/18/2008,09:13:23,09:13:23,4.3,353,3.7,2.2, 2
16,07/18/2008,09:13:26,09:13:26,3.8,10,3.8,-0.6, 2
17,07/18/2008,09:13:28,09:13:28,5.6,4,4.2,3.6, 2
18,07/18/2008,09:13:29,09:13:29,6.9,3,5.6,4.1, 2
19,07/18/2008,09:13:30,09:13:30,5.8,0,4.6,3.6, 2
20,07/18/2008,09:13:31,09:13:31,5,355,4.4,2.2, 2
21,07/18/2008,09:13:34,09:13:36,6.9,349,6.5,2.1, 16
22,07/18/2008,09:13:37,09:13:39,6.1,113,4.7,3.9, 16
23,07/18/2008,09:13:40,09:13:40,6.1,349,5.8,1.9, 2
-7-