1
MARTE user manual (English)
CAR Collision Avoidance System (CCAS)
This second example models a complex car collision avoidance system. This system is installed in the car and contains a radar as
well as camera, both of which provide input data to detect incoming collisions.
MARTE concepts:
This example uses the MARTE Library and the concepts of the following MARTE profiles: GCM, GRM, SRM, HLAM, HRM, Time,
Alloc, RSM, VSL, GQAM, SAM.
UML diagrams:
The Class, Sequence, State machine, Activity, and Deployment UML diagrams have been used in this example.
Detailed Description:
The vehicle collision avoidance system, or CCAS for short, allows to detect the position of the vehicle on which the system is installed
on, to other objects such as cars and pedestrians. The CCAS contains two types of detection modules. One is radar based which
sends a wave which when collides with an object is reflected and received by the radar itself. The radar sends thisdata to an obstacle
detection module which carries out a detection algorithm to remove the noise from the incoming signal along with other tasks such as
a correlation algorithm. The result of this data is sent to the controller.
Also a camera based module is present in the car, which also allows to determine the distance of the car from an object by means of
image computation. The camera takes pictures of incoming objects and executes a distance algorithm, if it finds that the result of the
computation means that the object is nearer to the car then the specified default value that means acollision can occur. The result of
this data is also sent to the controller. The controller when receives the data, acts accordingly. In case of an imminent collision, it can
carry out some emergency actions, such as stopping the engine, applying emergency brakes; otherwise if the collision is not
imminent, it can decrease the speed of the car and can apply normal brakes.
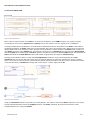
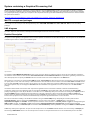
We first illustrate the global structure of the Car Collision Platform Structure as illustrated in Car Collision Platform Structure figure.
Using a deployment diagram, we represent the internal structure of the CCAS. We avoided the usage of MARTE HRM stereotypes
here as the system is basically not traditionally hardware in the sense as it consists of electronic, electric and automotive
components. Thus only GRM stereotypes are sufficient here.
In the figure, the following nodes are present:
ComputingResource Controller,
DeviceResource, ComputingResource IMPCAR+Camera Module. It hastwo stereotypes as it contains a camera and a
micro-controller,
DeviceResource Display,
DeviceResource AirBag,
DeviceResource SpeedRegulator,
DeviceResource BrakeSystem,
DeviceResource EngineControlUnit,
DeviceResource Radar,
18 December 2015
1/19
DeviceResource ObstacleDetectionUnit,
CommunicationMedia CAN.
Figure 14 Car Collision Platform Structure
All the nodes are interconnected via the CAN bus. As seen from the diagram, via the GRM stereotypes, it is possible to specify
several attribute values such as speedfactor and capacity value for the CAN bus. Here, the capacity is set to 1024Mb/sec.
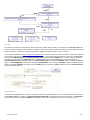
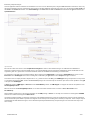
In the figure Radar structure and behavior, we first illustrate the internal block structure and behavior of the Radar module. While in
the deployment diagram, the Radar module ports are not illustrated, this is due to the fact that in UML, different views can represent
different details of the same component. Here in the figure, we first illustrate the external interface of the Radar which consists of an
input InData port and an output OutData port. The input port is stereotypes as a ClientServer port of the type signal ReceiveSignal,
while the OutData port is stereotypedas a FlowPort. All these concepts are present in the MARTE GCM package. The behavior of the
Radar is illustrated via the Radar Behavior state machine which is appropriately stereotyped as TimeProcessing.
Basically, here the Radar remains in a single state receivingSamples and when it receives incoming signals via its input
ClientServer port, it sends the data via its output port to the obstacle detection unit. When the radar does not receive a signal for
about 1 min, it stops its execution and the system halts the obstacle detection procedure. This aspect can be shownvia the transition
to the final state having a TimedEvent stereotype with a value equal to 1 minute, expressed via VSL.
Figure 15 Radar structure and behavior
Finally, the RefreshData activity is expressed via an activity diagram. This activity is owned by the Radar component. In the activity,
the UML CallOperationAction invokes the getSignal operation of the Radar, afterwards, the signal is transmitted via a UML
SendObjectAction to the output port OutData.
18 December 2015
2/19
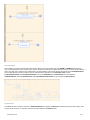
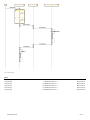
Figure 16 Car Collision Application
We now look at the application part of the CCAS. It should be mentioned here that the CCAS contains several tasks. As seen from
Car Collision Application, the Car Collision Application contains the following tasks with MARTE HLAM stereotypes:
RTUnit Controller Task: the main principle task. The isMain attribute is set to true to specify that this is the main. The behavior of the
main is set to TaskBehavior (which is not specified in the example) that basically acts as a scheduler task. This behavior can be
specified by an activity, interaction, sequence or state machine diagram. The task containsseveral sub tasks such as
ComputeCameraTask, AirBagLaunch etc. Basically these operations showcase the different actions of the controller when it
receives some input. For example, if the IMPCAR+Camera module sends it the information that a collision is about to happen, it
computes some algorithm and takes necessary action, such as launching air bags, applyingemergency brakes. It basically sends
commands to the other tasks such as AirBag Task which carries out the necessary action.
RTUnit Image Processing Task: the task gets images from the camera, calculates image and sends the data to the controller.
RTUnit Radar Task: It acquires data and sends it to the obstacle detection task.
RTUnit Obstacle Detection: it gets data from the radar and removes noise from data and executes some correlation, Hough
transform or any other detection algorithm. It then sends the data back to the controller.
Communication Task: it sends/receives data and commands from the other tasks.
RtUnit Brake: it gets commands and either applies normal or emergency brakes.
RtUnit Engine Commands: it gets commands and executes a number of operations. It can either decrease/increase speed, start/stop
the engine and other operations.
RtUnit Air Bag Task: it launches the air bags when it receives an appropriate command.
RtUnit Display Update: It receives command and then communicates to the display task to update the screen in the car.
PpUnit Display: It writes data to the screen.
18 December 2015
3/19
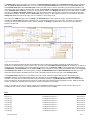
Figure 17 RTOS
The CCAS also contains an RTOS which is implemented using POSIX Threads, which is executed onto the Controller Task. This
RTOS is modeled in the figure RTOS. While it is possible to really go into detail regarding the modeling, we have decided to adapt a
simplified approach. This RTOS modeling is inspired from MARTE examples themselves, and is extended.
As per POSIX specifications (http://en.wikipedia.org/wiki/POSIX), a Process contains a number of Pthreads. Process and Pthreads
can be halted or interrupted by Signals or Events. Each event has a Timer that specifies the duration of that event. The Process is
stereotyped as MemoryPartition and SwSchedulableResource using the MARTE SRMpackage, as it is an address space that
executes one or more threads. A Pthread contains a priority attribute of the type Priority Type. It is also stereotyped as a
SwSchedulableResource. An Event is typed as a NotificationResource and has an eventValue attribute. Similarly the Timer is
typed as a SwTimerResource and contains an attribute timingattribute of the DataType TimeType. Finally a scheduler ispresent
with the appropriate Scheduler stereotype (from the GRM package) and contains a policy attribute of the type SchedPolicyKind
(found in the MARTE library).
Figure 18 RTOS Instantiation
In the RTOS Instantiation figure, we illustrate a specific model of the RTOS by instantiation. Here we illustrate that one operation of
the Controller Task is executed by a ComputeImageDecisionPthread, with appropriate event and timer values. The EntryPoint
stereotype as present in the MARTE SRM package, supplies the operation executed in the context of a software resource.
18 December 2015
4/19
Figure 19 Scenario examples
Subsequently, Scenario examples figure illustrates the different scenario possible using the GQAM and SAM MARTE packages.
Here, as specified earlier in the document, the system contains two methods of collision detection: one by a camera and the other by a
radar. Thus both of the scenarios are modeled here. The two partitions of the activity diagram arestereotyped as SaEndtoEndFlow
and are appropriately named according to the two critical decision operations of the Controller Task, namely:
ComputeObstacleTask and ComputeCameraTask. The events RadarEvent and CameraEvent are stereotyped as
GaWorkloadEvent, while the RadarScenario and CameraDistanceCalculation are stereotyped as GaScenario(s).
Figure 20 Radar scenario
Each MARTE end to end flow consists of a GaWorkloadEvent that triggers a gaScenario, as illustrated in the previous figure. Here,
in figure Radar scenario, we only look at the first scenario related to the Radar module.
18 December 2015
5/19
The Radar Task receives some data, and sends it to the Obstacle detection Task via the Communication Task. Upon receiving the
data, the Obstacle detection Task carries out some computation performsCalculation and transmits it to the Controller Task via
the Communication Task. When Controller Task receives the data, it takes a decision depending upon its internal operations and
the incoming data. If the collision is imminent then it takes either Decision1 or Decision2. This decision is then transmitted to the CAN
via the Communication Task which conveys it to the appropriate modules. The Display Task when receives either decision, updates
its display. The Engine Commands Taskdepending upon the decision either stops the engine or decreases speed along with some
other parallel operations. Similarly, when the Brake Task gets the decision, it either applies emergency or normal brakes. Finally the
AirBag Task either launches the air bag in case of a collision or does nothing at all.
Here, only some SAM stereotypes such as SaStep and SaCommStep have been showcased to give a general meaning. For
example, the SaCommStep stereotype is applied on the communication between some of the tasks. This allows us to specify the
message size of the communication for future analysis. Similarly, the SaStep is applied between some actions to determine the
specific execution time.
Figure 21 Car Collision Platform System
Finally the Car Collision Platform System diagram illustrates the overall resource platform model for the application and the
architecture for determining the analysis context. First, as shown in the Car Collision Platform System, the architecture modules and
application tasks are instantiated. The execution platform resources such as Controller, CAN are given appropriate stereotypes such
as SaExecHost and SaCommHost from the MARTE SAM package, respectively. Respectively, the application tasks such as Display
and Communication Task are also stereotyped accordingly: SchedulableResource and GaCommChannel respectively. Here it
should be mentioned that a schedulable resource needs a scheduler which is present in the form of the Controller Task.
The Controller Task basically acts as a scheduler for the other tasks, performs the global actions and is allocated onto the
Controller. Similarly, the instantiations dy (Display) are allocated also to the Controller in the form of a temporalScheduling
allocation. The other tasks are allocated to their respected hardware modules in a spatialDistribution fashion. The scheduler task
can be considered as the principle task that permits to call the other tasks and permits their scheduled execution. While it is possible
to have secondary sub scheduler tasks, this step has not been carried out in the modeling.
Finally, it is possible to carry out an analysis of this figure in combination with the figure Radar scenario. However this step has
currently not been carried out, but is entirely possible if the need arises for its modelling.
Files
image016.gif
10.3 KB29 September 2011
Etienne Brosse
image017.gif
2.43 KB29 September 2011
Etienne Brosse
image018.gif
2.24 KB29 September 2011
Etienne Brosse
image019.jpg
4.59 KB29 September 2011
Etienne Brosse
image020.jpg
29.5 KB29 September 2011
Etienne Brosse
image021.gif
10.3 KB29 September 2011
Etienne Brosse
image022.jpg
16.6 KB29 September 2011
Etienne Brosse
image023.gif
15.8 KB29 September 2011
Etienne Brosse
image024.jpg
13.6 KB29 September 2011
Etienne Brosse
18 December 2015
6/19
image025.gif
18 December 2015
21.3 KB29 September 2011
Etienne Brosse
7/19
System containing a Graphical Processing Unit
We are now going to illustrate the modeling of a complex application using the MARTE Modelio module. The first example is related to a complete
system containing an application and an execution platform, where a vector multiplication application is executed partly on a host machine and partly
on a graphical processing unit (GPU). This example has been inspired from thenext generation NVIDIA’s Fermi architecture. Details related to
this system can be found at:
http://www.nvidia.com/content/PDF/fermi_white_papers/NVIDIA_Fermi_Compute_Architecture_Whitepaper.pdf
MARTE concepts and packages
This example uses the concepts of the following MARTE profiles: GCM, GRM, SRM, HRM, Time, Alloc, RSM, VSL, NFP, and Clock Handling
packages.
UML diagrams
The Class, Sequence, State machine, and Deployment UML diagrams have been used in this example.
Detailed Description
The system consists globally of an application and an execution platform as indicated in the GPU Allocationfigure. This example shows the distributed
embedded system which is modeled via the MARTE profile.
Figure 8 GPU Allocation
The application VectorMultiplicationExample consists of four main tasks, which are modeled as classes. Hence the main application contains the
four instances of these tasks. The first two tasks VectorGeneratorTask1 and VectorGeneratorTask2 are responsible for generating vectors that are
then subsequently taken as input by the Kernel which then sends the result of the vector multiplication to the Result task.
All the instances of the tasks are stereotyped with GRM stereotype: resourceUsage to determine the resources consumed by a task. For example, we
can specify that for a task, how much memory is allocated, what is its execution time. Here the instances of the tasks task1, task2 and result execute
in 50 ms while the kernel instance executes in 25 ms.Hence a user can easily specify these concepts. Additionally as these tasks are allocated on to
the execution platform, they are stereotyped as allocated, with the kind attribute set to application. Thus we also make use of the MARTE Alloc
package.
It should be mentioned that all the classes which represent the application tasks are themselves modeled, as illustrate in GPU Elementary
Components. All the ports of the application tasks are stereotyped as FlowPort as they indicate flow of data, as specified in the MARTE GCM
package. Depending upon a task, its port direction is set to either out or in. Additionally, allthe ports of the tasks are stereotyped as shaped (based on
the MARTE RSM package) to indicate that the task produces a vector with a dimension of 5000. The first two instances task1 and task2 each
produces vectors of dimension 5000 which are taken as input by the kernel and it also produces a vector of 5000 which is then taken by the result
instance.These properties can be verified in the GPU Elementary Components figure illustrated later on in the document.
We now turn towards the modeling of the hardware architecture using the MARTE HRM package. Regarding the execution platform called
SystemArchitecture, which is stereotyped as HwResource, it consists of three main modules: a Terminal which is connected to a
GraphicalProcessingUnit via a PCI-Bus. The three respective instances of these modules, i.e. terminal, pci-bus and gpu are stereotyped using the
HRM and Alloc concepts. The terminal and gpu arestereotyped as HwComputingResource, HwComponent (for both logical and physical
characteristics of hardware) and Allocated (with its kind sets to executionPlatform), while the pci-bus is stereotyped as HwBus and HwComponent
.
Additionally, similarly to the application, the ports of all the components are set as FlowPort and with direction set to inout. Finally, a UserInput port
with stereotype HwEndPoint allows a user to send input to the terminal. The components themselves are also modeled and present in the GPU
18 December 2015
8/19
Elementary Components figure.
Once the application and the architecture are modeled, we can move on to the allocation phase, using the MARTE allocation mechanisms. Here, only
the high level allocation has been specified, but several views are possible atdifferent granularity levels. In this case, we allocate the task1, task2 and
the result to the terminal with allocate set to timeScheduling via its nature attribute. While the kernel task isallocated to the gpu with allocate set to
spatialDistribution.
Figure 9 GPU Architecture
We now take a look at the structure of the GraphicalProcessingUnit as shown in GPU Architecture figure. As indicated in the NVIDIA fermi
documents, a GPU executes a kernel in parallel across a set of parallel threads, which are organized in thread blocks. These thread blocks are also
organized in grids. So a grid consists of several thread blocks; while one threadblock itself consisting of several threads.
The architecture of the GPU is thus created accordingly. At the highest level a Grid Wrapper is connected to a Global Memory by means of a bus:
Bus-Level 0. This GridWrapper itself contains several grids, as indicated by the grid instance with a shaped stereotype of value 16.
This instance has one output port with a shaped value of 1 or {}; which connects to the Port_1 of GridWrapper having a shaped value of 16 by means
of a connector with stereotype tiler, found in the MARTE RSM package. This connector helps to connect the ports of the various repetitions of the grid
to the port of the GridWrapper.
A Grid itself contains a SMWrapper, a Bus-Level 1 and a SharedMemory module. The SM Wrapper is a wrapper that contains 32 repetitions of the
StreamingMultiprocessor.
When we zoom into the StreamingMultiprocessor, we see that at the lowest hierarchical level, it contains a Core, a Bus-Level 2 and a
PrivateMemory.
All the hardware components are stereotypes accordingly via the HRM package in MARTE. For example, the memories are stereotyped as HwRAM,
while the Core module is stereotyped as HwProcessor.
It should be evident that initially an elementary components of the application/architecture need to be modeled before continuing with the modeling of
the aforementioned aspects. While a separate class diagram can be created just for modeling of the elementary components, in this example, they are
modeled within the GPU Architecture figure, and are illustrated separatelyin GPU Elementary Components figure here in the document only for the
sake of clarity.
18 December 2015
9/19
Figure 10 GPU Elementary Components
We now look at the internal structure of the Terminal module in the Terminal internal structure figure. Using the UML object diagram, we are able to
model the modules of the Terminal which are as follows:
·
HwProcessor Controller (With a NFPConstraint of the MARTE NFP package: saying that the if the processor is being utilized 100 percent,
set its internal clock frequency to 100 MHz otherwise 50 MHz),
·
HwRAM Memory,
·
HwSupport, HwPowerSupply Battery (the two stereotypes are used to show a mixed logical, physical view for the battery as these two
stereotypes have different attributes. While we can do the same for all the other modules, it is just a modelling choice that we have not implemented as
yet),
·
HwBus Bus,
·
HwClock Clock (A global system clock with ClockConstraints),
·
HwI_O UARTController,
·
HwI_O Display.
Figure 11 Terminal internal structure
While it is also possible to add GRM stereotypes here, the HRM stereotypes are sufficient as they contain all the attributes of the GRM package.
Additionally, the application showed earlier can be illustrated here as well to show that the three tasks of the application are actually allocated to the
Controller in the Terminal. However, this step has not beencarried out.
This diagram also contains some platform based tasks (or system drivers) which are allocated to the hardware resources. While several tasks are
18 December 2015
10/19
possible, we have only modeled two for the sake of visibility. The TerminalApplication package here contains two tasks, a UART Task with the
SwSchedulableResource from the MARTE SRM package; and a Schedulerstereotyped Scheduler from the MARTE GRM package. These tasks are
allocated to respective hardware resources, using the allocation concepts.
We now take a look at the Controller State Machine to determine the behavior of the Controller module of the Terminal.
Figure 12 Controller State Machine
As shown in the figure Controller State Machine, the state machine SuperVisingBehaviour-Controller determines the behavior of the Controller
which can be either in Executing, Idle or Sleep states. The TimedProcessing stereotype should be applied to the state machine so that it can refer
the ideal clock. This will allow it to express the associated timing concepts. The initial state is the Executing one which contains a DO activity execute,
itself stereotype as TimedProcessing to determine the time taken for this action/behavior. This is not shown in the figure but we can specify its value
to 15 ms. When the controller does not received data for computation for 20 ms, it goes into the Idle state where it remains for about 5 ms (not carried
out due to Modelio limitations). When the computation is needed to be done, it returns to the Executing state. If however, there is no activity for about
35 ms, then the system goes into Sleep mode where it remains for about 20 ms and if there is no activity, the controller is deactivated. Similarly in Idle
state, if there is noactivity or computation event, then the system goes to Sleep mode.
Finally the overall scenario is described using the UML sequence diagram as shown in Computation Sequence.
Here, initially a User sends the data to the Terminal so start the execution, once the data is received by the Terminal, it carries out two activities in
parallel, it sends the data to its display to show the Starting Execution message and at the same time, executes task1 and task2. The result of the
first two tasks is sent to the GraphicalProcessingUnit via the PCI-Bus. When the GraphicalProcessingUnit receives the data, it then carries out a
Kernel Computation which is referenced by another sequence diagram. The result of the vector multiplication is then sent back to the Terminal via
the PCI-bus. Once the terminal receives the result, it executes the result task and then displays the result on the screen.
We should be able to apply the TimedConstraints stereotypes on the sequence diagram to determine the timing constraints. For example, we can
specify a constraint that the whole execution from the user sent input to the final prints on screen should not exceed more than 100 ms. Similarly
another constraint can be related to the GraphicalProcessingUnit. The constraint can specify that the whole execution on the GPU, from receiving of
input data to sending of the calculated result should not take more than 15 ms.
18 December 2015
11/19
Figure 13 Computation Sequence
Files
image011.jpg
31.5 KB29 September 2011
Etienne Brosse
image012.jpg
17 KB29 September 2011
Etienne Brosse
image013.gif
16.9 KB29 September 2011
Etienne Brosse
image014.gif
3.47 KB29 September 2011
Etienne Brosse
image015.gif
10.1 KB29 September 2011
Etienne Brosse
image010.jpg
20.9 KB29 September 2011
Etienne Brosse
18 December 2015
12/19
Expert mode
Currently MARTE models can only be specified in Expert mode i.e. all MARTE stereotypes are available without any restriction or constraint (except
those defined in the MARTE specification). All stereotypes (including MARTE stereotypes) must be applied on UML element. Thus a MARTE model
creation always starts by creating one or more UML element(s) and then applied on this(these) UML element(s) one or more MARTE stereotype(s).
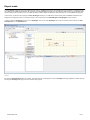
In this section, you will see how to apply the MARTE ClockType stereotype on a UML Class element. At this point, the MARTE module has been
deployed (see Deployment section), a package owning a class respectively named 4StrokeEngine and AngleType has been created.
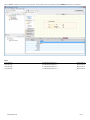
In order to apply the ClockType stereotype on the AngleType class, first of all the AngleType class must be selected, and then click on the Add
stereotype button in the Annotation tab.
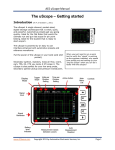
Starting point
By clicking on Add stereotype button the window, exposed in Figure 5, should appear. Thus the ClockType stereotype application could be done by
choosing the ClockType stereotype in the list and then clicking on OK.
18 December 2015
13/19
Figure 5 Stereotype window
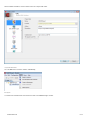
The Figure 6 depicts the result of the ClockType stereotype application on the AngleType Class element.
Figure 6 ClockType application result
18 December 2015
14/19
Most of MARTE stereotype, have one or more properties. These properties may be specified by using the MARTE tab as shows in the Figure 7.
Files
image009.png
68.2 KB30 September 2011
Etienne Brosse
image007.png
26.7 KB30 September 2011
Etienne Brosse
image006.png
61.5 KB30 September 2011
Etienne Brosse
image008.png
70.3 KB30 September 2011
Etienne Brosse
18 December 2015
15/19
The MARTE Designer Guide
-
Installation
MARTE in expert mode
MARTE Library
Examples
- Graphical Processing Unit
- CAR Collision Avoidance System
18 December 2015
16/19
After the Modelio installation, start the modeler and create a simple UML model.
Creating Default UML Model with Modelio
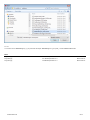
Go to the MDA menu and choose Install a module….
Module Deployment
You will be led to mdastore folder. Proceed to the location of the MARTE Designer module.
18 December 2015
17/19
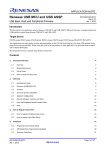
Module Folder
You need to choose MARTEDesigner_x.yy.zz.jmdac and click Open. MARTEDesigner x.yy.zz.jmdac_ contains MARTE UML2 Profile.
Files
image004.png
15.8 KB30 September 2011
Etienne Brosse
image005.png
54.1 KB30 September 2011
Etienne Brosse
image003.png
36.8 KB30 September 2011
Etienne Brosse
18 December 2015
18/19
MARTE Library
The MARTE Library is available here. More informations concerning the Model Components can be found here.
18 December 2015
19/19