1
Analysis of infiltration systems according to
DWA-A 138 (April 2005)
GGU-SEEP
VERSION 9
Last revision:
April 2012
Copyright:
Porf. Dr. Johann Buß
Technical implementation and sales: Civilserve GmbH, Steinfeld
Contents:
1 Preface .................................................................................................................................. 4
2 Licence protection and installation .................................................................................... 4
3 Language selection............................................................................................................... 5
4 Starting the program ........................................................................................................... 5
5 Theoretical principles .......................................................................................................... 6
6 Worked examples................................................................................................................. 8
6.1 Surface infiltration (DWA-A 138, Appendix A.2.1) ....................................................... 8
6.2 Swale infiltration (DWA-A 138, Appendix A.2.2)........................................................ 11
6.3 French drain infiltration (DWA-A 138, Appendix A.2.4 a)........................................... 13
6.4 Pipe infiltration (DWA-A 138, Appendix A.2.4 b)........................................................ 15
6.5 Shaft infiltration - Type A (DWA-A 138, Appendix A.2.5).......................................... 17
6.6 Shaft infiltration - Type B (DWA-A 138, Appendix A.2.5) .......................................... 19
6.7 Swale-French drain infiltration (DWA-A 138, Appendix A.2.3 a)................................ 21
6.8 Swale-pipe infiltration.................................................................................................... 24
6.9 Paving with swale infiltration ........................................................................................ 26
6.10 Paving with French drain infiltration ............................................................................. 29
6.11 Paving with pipe infiltration........................................................................................... 33
6.12 Swale-pipe infiltration (old) ........................................................................................... 37
6.13 Swale-French drain infiltration (old).............................................................................. 37
7 Description of menu items................................................................................................. 38
7.1 File menu........................................................................................................................ 38
7.1.1 "New" menu item................................................................................................... 38
7.1.2 "Load" menu item.................................................................................................. 38
7.1.3 "Save" menu item .................................................................................................. 38
7.1.4 "Save as" menu item .............................................................................................. 38
7.1.5 "Printer preferences" menu item............................................................................ 38
7.1.6 "Print and export" menu item ................................................................................ 39
7.1.7 "Batch print" menu item ........................................................................................ 41
7.1.8 "Exit" menu item.................................................................................................... 41
7.1.9 "1, 2, 3, 4" menu items........................................................................................... 41
7.2 Edit menu ....................................................................................................................... 42
7.2.1 "Project identification" menu item......................................................................... 42
7.2.2 "Infiltration type" menu item ................................................................................. 42
7.2.3 "System parameters" menu item ............................................................................ 43
7.2.4 "Swale infiltration, Pipe infiltration ..." menu items.............................................. 43
7.2.5 "Draining time" menu item .................................................................................... 43
7.2.6 "Rainfall intensity table" menu item...................................................................... 44
7.2.7 "Construction notes + theory"................................................................................ 46
7.3 System menu .................................................................................................................. 46
7.3.1 "Analyse" menu item ............................................................................................. 46
GGU-SEEP User Manual
Page 2 of 61
April 2012
7.4 Output preferences menu ............................................................................................... 47
7.4.1 "System parameters legend" menu item ................................................................ 47
7.4.2 "Results legend" menu item................................................................................... 48
7.4.3 "System visualisation" menu item ......................................................................... 49
7.4.4 "Simple header data" menu item............................................................................ 50
7.4.5 "Rainfall intensity" menu item............................................................................... 51
7.4.6 "Reset all" menu item ............................................................................................ 51
7.4.7 "Page size and margins" menu item....................................................................... 52
7.4.8 "Move objects" menu item..................................................................................... 52
7.5 Graphics preferences menu ............................................................................................ 53
7.5.1 "Refresh and zoom" menu item ............................................................................. 53
7.5.2 "Zoom info" menu item ......................................................................................... 53
7.5.3 "Legend font selection" menu item........................................................................ 53
7.5.4 "With borders" menu item ..................................................................................... 53
7.5.5 "Pen colour and width" menu item ........................................................................ 54
7.5.6 "Mini-CAD toolbar" menu item ............................................................................ 54
7.5.7 "Toolbar preferences" menu item .......................................................................... 55
7.5.8 "Load graphics preferences" menu item ................................................................ 56
7.5.9 "Save graphics preferences" menu item................................................................. 56
7.6 ? menu ............................................................................................................................ 57
7.6.1 "Copyright" menu item .......................................................................................... 57
7.6.2 "Help" menu item .................................................................................................. 57
7.6.3 "GGU on the web" menu item ............................................................................... 57
7.6.4 "GGU support" menu item..................................................................................... 57
7.6.5 "What's new?" menu item...................................................................................... 57
7.6.6 "Language preferences" menu item ....................................................................... 57
8 Tips and tricks.................................................................................................................... 58
8.1 Keyboard and mouse...................................................................................................... 58
8.2 Function keys ................................................................................................................. 58
8.3 "Copy/print area" icon.................................................................................................... 59
9 Index.................................................................................................................................... 60
GGU-SEEP User Manual
Page 3 of 61
April 2012
1 Preface
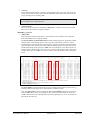
The GGU-SEEP program system allows analysis of systems for the infiltration of precipitation
run-off according to the DWA-A 138 standard (Deutsche Vereinigung für Wasserwirtschaft, Abfall und Abwasser e.V.; Planung, Bau und Betrieb von Anlagen zur Versickerung von Niederschlagswasser, April 2005). Generally, the basic data and results of an analysis are displayed on
the screen. The graphics consist of a total of four elements (also see the "Output preferences"
menu in Section 7.4):
legend containing system data;
system visualisation of the selected infiltration system;
rainfall intensity table;
legend containing the analysis results (only if the system has been analysed).
These four elements can be resized and repositioned to suit your requirements. In addition, usercreated graphic elements can be added using the integrated Mini-CAD module. Stamp fields (e.g.
company logos) can be added in the same manner. The default visualisation format is A4. The
sheet format can be modified (e.g. A3) if required.
Data input is in accordance with conventional WINDOWS operations and can therefore be learned
almost entirely without the use of a manual. Graphic output supports the true-type fonts supplied
with WINDOWS, so that excellent layout is guaranteed. Colour output and any graphics (e.g. files
in formats BMP, JPG, PSP, TIF, etc.) are supported. DXF files can also be imported by means of
the integrated Mini-CAD module (see the "Mini-CAD" manual).
The program has been thoroughly tested. No faults have been found. Nevertheless, liability for
completeness and correctness of the program and the manual, and for any damage resulting from
incompleteness or incorrectness, cannot be accepted.
2 Licence protection and installation
In order to guarantee a high degree of quality, a hardware-based copy protection system is used
for the GGU-SEEP program.
The GGU software protected by the CodeMeter copy protection system is only available in
conjunction with the CodeMeter stick copy protection component (hardware for connection to the
PC, "CM stick"). Because of the way the system is configured, the protected software can only be
operated with the corresponding CM stick. This creates a fixed link between the software licence
and the CM stick copy protection hardware; the licence as such is thus represented by the CM
stick. The correct Runtime Kit for the CodeMeter stick must be installed on your PC.
Upon start-up and during running, the GGU-SEEP program checks that a CM stick is connected.
If it has been removed, the program can no longer be executed.
For installation of GGU software and the CodeMeter software please refer to the information in
the Installation notes for GGU Software International, which are supplied with the program.
GGU-SEEP User Manual
Page 4 of 61
April 2012
3 Language selection
GGU-SEEP is a bilingual program. The program always starts with the language setting
applicable when it was last ended.
The language preferences can be changed at any time in the "?" menu, using the menu item
"Spracheinstellung" (for German) or "Language preferences" (for English).
4 Starting the program
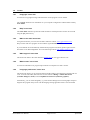
After starting the program, you will see two menus at the top of the window:
File
?
After clicking on the "File" menu, a previously calculated system can be loaded by means of the
"Load" menu item, or a new one created using "New".
The program allows simple input procedures by moving directly to the option box after "New" is
clicked; this box can also be reached by pointing to the "Edit/Infiltration type" menu item. Exit
the option box by clicking the required type of infiltration; the initial input screen opens. Six menus are visible in the menu bar:
File
Edit
System
Output preferences
Graphics preferences
?
After clicking one of these menus, the so-called menu items roll down, allowing access to all
program functions.
The program works on the principle of What you see is what you get. This means that the screen
presentation represents, overall, what you will see on your printer. In the last consequence, this
would mean that the screen presentation would have to be refreshed after every alteration you
make. For reasons of efficiency and as this can take several seconds for complex screen contents,
the GGU-SEEP screen is not refreshed after every alteration.
If you would like to refresh the screen contents, press either [F2] or [Esc]. The [Esc] key
additionally sets the screen visualisation back to your current zoom, which has the default value
1.0, corresponding to an A4 format sheet.
GGU-SEEP User Manual
Page 5 of 61
April 2012
5 Theoretical principles
The program can be used to analyse a variety of infiltration systems:
Surface infiltration
Swale infiltration
Pipe infiltration
French drain infiltration
Shaft infiltration (a variety of shaft types are available)
Swale-pipe infiltration
Swale-French drain infiltration
Paving (surface infiltration) with swale
Paving (surface infiltration) with French drain
Paving (surface infiltration) with pipe
A rainfall event frequency of n = 0.2/a (= once in 5 years) is described as a generally adopted
value for decentralised infiltration systems in the DWA-A 138 standard. For centralised infiltration systems a frequency of n = 0.1/a (= once in 10 years) should generally be adopted. The program therefore allows the frequency to be defined, allowing different events to be investigated.
According to the DWA-A 138 standard, the thickness of the seepage zone, i.e. the distance from
the base of the infiltration system to the highest groundwater level, should be at least 1 m. This is
necessary in order to guarantee a sufficiently long seepage path, e.g. to facilitate time-dependent
purification processes. For surface and swale infiltration a seepage zone of < 1 m may be acceptable in substantiated, exceptional cases (see DWA-A 138). Despite this, the distance can be freely
defined in the program.
According to DWA-A 138, the permeability of the in-situ soil should be between 1 · 10-3 m/s and
1 · 10-6 m/s. This demand is made in order to ensure a sufficiently small draining time following a
rainfall event, among other things. The program nevertheless accepts permeabilities < 1 · 10-6 m/s
(but issues an appropriate warning).
According to the old standard the distance to neighbouring cellars should not be less than 6 m.
The permissible distances are regulated in more detail in the new standard (see Chapter 3.2.2,
DWA-A 138, April 2005). Regardless of this, the program queries for the distance of 6 m and
issues a warning message where necessary. However, this has no impact on the analysis results.
The program also computes the system's emptying time or the draining time for certain infiltration
types following a rainfall event. The same relationships are employed as assumed by the DWA-A
138 standard for filling. However, both half of the permeability (as in the DWA-A 138 standard to
take the lower permeability in the unsaturated zone into consideration) and the full permeability
value (once full, the system is generally saturated) may be adopted for analysis.
GGU-SEEP User Manual
Page 6 of 61
April 2012
In the 1990 edition of the standard analysis is performed using Reinhold's time coefficient
method. More recent investigations by the German meteorological office (Deutscher Wetterdienst)
have shown that the rainfall intensities after Reinhold can differ considerably from local rain characteristics. In the DWA-A 138 (April 2005) the tables in the KOSTRA Atlas ("Starkniederschlagshöhen für Deutschland - KOSTRA" (Storm rainfall levels for Germany), available from the German meteorological office) or, if applicable, location-specific precipitation-storm rainfall evaluations according to ATV-A 121 (available from local authorities) are used to determine rainfall
intensities. These tables contain precipitation levels and rainfall intensities for various rainfall
durations and recurrence intervals (frequencies).
The GGU-SEEP program makes its computations using the location-specific rainfall intensities
(table), but also allows analysis using Reinhold's rainfall series', e.g. for use in draft design. The
program also determines the decisive rainfall duration after Reinhold. This time-value function
after Reinhold only applies to rainfall durations ≤ 150 minutes. A warning is issued if greater
values are determined in the course of analysis. Because the systems are slightly larger for rainfall
durations > 150 minutes, the rainfall duration is not reduced for any of the systems, with the exception of shaft infiltration. However, it should still be noted that for rainfall durations > 150
minutes a more detailed consideration is required (e.g. via the rainfall intensity tables in the
KOSTRA Atlas).
If the rainfall intensity calculations are performed using the tables in the KOSTRA Atlas, the location-specific tables must be obtained. By default the program contains the tables for the south
Hannover region, which are also included in the new standard. If you use the 'KOSTRA-DWD
2000' program published by the Institut für technisch-wissenschaftliche Hydrologie
(www.itwh.de), the KOSTRA data for the required location within Germany can be imported into
GGU-SEEP via a file generated by the program or via the Windows clipboard.
The new standard recommends adopting a surcharge factor between 1.1 and 1.2 to determine the
required storage volume, in order to avoid under-designing, depending on the measure of risk
involved. The surcharge factor is entered in the same dialog box used for selecting the type of
infiltration.
Use of the program will be demonstrated below using worked examples. These examples are provided as files and can be opened using the "File/Load" menu item.
GGU-SEEP User Manual
Page 7 of 61
April 2012
6 Worked examples
6.1
Surface infiltration (DWA-A 138, Appendix A.2.1)
The theoretical principles are contained in the standard (Chapters 3.2.3 and 3.3.1, DWA-A 138,
April 2005).
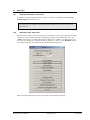
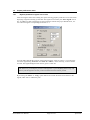
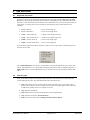
The procedure is demonstrated using the example from the standard (Appendix A.2.1). Go to the
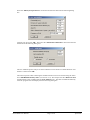
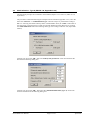
menu item "File/New" or "Edit/Infiltration type". You will see the following dialog box. Because analysis is performed according to DWA-A 138 using the rainfall intensity tables in the
KOSTRA Atlas, the "Table" radio button is activated.
Exit the dialog box by clicking the "Surface infiltration" button.
GGU-SEEP User Manual
Page 8 of 61
April 2012
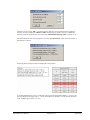
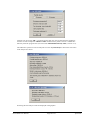
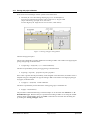
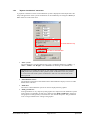
Select the "Edit/System parameters" menu item and enter the data from the following dialog
box:
Confirm your input with "OK". Then select the "Edit/Surface infiltration" menu item and enter
the data from the following dialog box:
The new standard requires analysis of surface infiltration to be based on a rainfall duration of 10
minutes. Confirm with "OK".
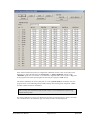
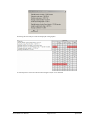
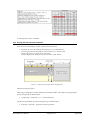
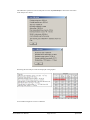
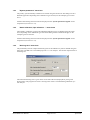
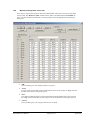
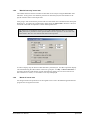
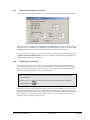
The location-specific table containing the rainfall intensities can now be entered using the menu
item "Edit/Rainfall intensity table" (see Section 7.2.6). The example uses the "Hannover-Süd"
rainfall intensity table, included with the GGU-SEEP delivery. The data is loaded automatically
when the program starts and displayed in the following dialog box:
GGU-SEEP User Manual
Page 9 of 61
April 2012
If the surface infiltration needs to be computed for a different location, enter the new data in the
dialog box or import the data using the "Import file" or "Import clipboard" buttons in the
"KOSTRA" group box (see Section 7.2.6). Entered or imported tables can be saved as ".drg" files
at the program level and be opened again for later analyses using the "Load" button.
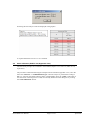
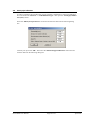
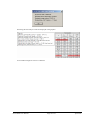
The surface infiltration can now be analysed. Go to the "System/Analyse" menu item. First, the
program shows a note indicating which rainfall intensity table is being used. If required, a different table could be entered or loaded here.
This warning note should not be deactivated in order to avoid mistaken use of the wrong
rainfall intensity table.
For surface infiltration a note is also displayed concerning the surcharge factor, which is not taken
into consideration for this infiltration type. The analysis results are then displayed:
GGU-SEEP User Manual
Page 10 of 61
April 2012
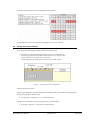
Following this the analysis results are displayed in the graphics.
A required infiltration area of 73.3 m² is obtained.
6.2
Swale infiltration (DWA-A 138, Appendix A.2.2)
The theoretical principles are contained in the standard (Chapters 3.2.3 and 3.3.2, DWA-A 138,
April 2005).
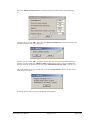
The procedure is demonstrated using the example from the standard (Appendix A.2.2). Go to the
menu item "File/New" or "Edit/Infiltration type". Because analysis is performed according to
DWA-A 138 using the rainfall intensity tables in the KOSTRA Atlas, the "Table" radio button is
activated. Enter a surcharge factor of 1.2, if not already defined. Exit the dialog box by clicking
the "Swale infiltration" button.
GGU-SEEP User Manual
Page 11 of 61
April 2012
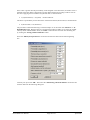
Select the "Edit/System parameters" menu item and enter the data from the following dialog
box:
Confirm your input with "OK". Then select the "Edit/Swale infiltration" menu item and enter the
available infiltration area in the dialog box:
Confirm your input with "OK". A location-specific table can now be entered with its rainfall intensities. For this example the "Hannover-Süd" rainfall intensity table is used. It is loaded automatically when the program starts (see menu item "Edit/Rainfall intensity table", Section 7.2.6).
The swale infiltration can now be analysed. Go to the "System/Analyse" menu item. The results
of the analysis are shown:
Following this the analysis results are displayed in the graphics.
GGU-SEEP User Manual
Page 12 of 61
April 2012
A required swale depth of 0.17 m is obtained. In this respect it may be interesting to note that
swale design using the table data (KOSTRA Atlas) for Gliesmarode, in Braunschweig, gives a
swale depth of 0.27 m. The distance between Hannover-Süd and Braunschweig-Gliesmarode is
barely 60 km. A swale depth greater by a factor of 1.59 is required nevertheless.
6.3
French drain infiltration (DWA-A 138, Appendix A.2.4 a)
The theoretical principles are contained in the standard (Chapters 3.2.3 and 3.3.4, DWA-A 138,
April 2005).
The procedure is demonstrated using Example a) in Appendix A.2.4. Go to the menu item "File/New" or "Edit/Infiltration type". Because analysis is performed according to DWA-A 138
using the rainfall intensity tables in the KOSTRA Atlas, the "Table" radio button is activated.
Enter a surcharge factor of 1.2, if not already defined. Exit the dialog box by clicking the "French
drain infiltration" button.
Select the "Edit/System parameters" menu item and enter the data from the following dialog
box:
Confirm your input with "OK". Then select the "Edit/French drain infiltration" menu item and
enter the data from the following dialog box:
GGU-SEEP User Manual
Page 13 of 61
April 2012
Confirm your input with "OK". A location-specific table can now be entered with its rainfall intensities. For this example the "Hannover-Süd" rainfall intensity table is used. It is loaded automatically when the program starts (see menu item "Edit/Rainfall intensity table", Section 7.2.6).
The French drain infiltration can now be analysed. Go to the "System/Analyse" menu item. The
results of the analysis are shown:
Following this the analysis results are displayed in the graphics.
A required French drain length of 35.48 m is obtained.
GGU-SEEP User Manual
Page 14 of 61
April 2012
6.4
Pipe infiltration (DWA-A 138, Appendix A.2.4 b)
The theoretical principles are contained in the standard (Chapters 3.2.3 and 3.3.4, DWA-A 138,
April 2005).
The procedure is demonstrated using Example b) in Appendix A.2.4. Go to the menu item "File/New" or "Edit/Infiltration type". Because analysis is performed according to DWA-A 138
using the rainfall intensity tables in the KOSTRA Atlas, the "Table" radio button is activated.
Enter a surcharge factor of 1.2, if not already defined. Exit the dialog box by clicking the "Pipe
infiltration" button.
Select the "Edit/System parameters" menu item and enter the data from the following dialog
box:
Confirm your input with "OK". Then select the "Edit/Pipe infiltration" menu item and enter the
data from the following dialog box:
GGU-SEEP User Manual
Page 15 of 61
April 2012
In Example b) (DWA-A 138, Appendix A.2.4) the water supply to, and distribution in, the French
drain is by means of two ND 300 pipes. In the GGU-SEEP program an equivalent area or a diameter dnew is entered for the "clear dimension of the pipe", corresponding to the area of the two
pipes.
A A1 A2 2
d new
4
2
2 d
4
2
d2
and
4
Anew
d new 2 d 2
2
d new 2
4
d new 2 d
Thus, for the example:
dnew = 1.41 · 0.3 m = 0.423.
Confirm your input with "OK". A location-specific table can now be entered with its rainfall intensities. For this example the "Hannover-Süd" rainfall intensity table is used. It is loaded automatically when the program starts (see menu item "Edit/Rainfall intensity table", Section 7.2.6).
The pipe infiltration can now be analysed. Go to the "System/Analyse" menu item. The results of
the analysis are shown:
Following this the analysis results are displayed in the graphics.
A required French drain length of 33.11 m is obtained.
GGU-SEEP User Manual
Page 16 of 61
April 2012
6.5
Shaft infiltration - Type A (DWA-A 138, Appendix A.2.5)
The theoretical principles are contained in the standard (Chapters 3.2.3 and 3.3.5, DWA-A 138,
April 2005).
The procedure is demonstrated using the example from the standard (Appendix A.2.5). Go to the
menu item "File/New" or "Edit/Infiltration type". Because analysis is performed according to
DWA-A 138 using the rainfall intensity tables in the KOSTRA Atlas, the "Table" radio button is
activated. Enter a surcharge factor of 1.2, if not already defined. Exit the dialog box by clicking
the "Shaft infiltration" button and selecting shaft type A according to DWA-A 138 (April 2005
edition).
Confirm your input with "OK". Select the "Edit/System parameters" menu item and enter the
data from the following dialog box:
Confirm your input with "OK". Then select the "Edit/Shaft infiltration (Type A)" menu item
and enter the data from the following dialog box:
GGU-SEEP User Manual
Page 17 of 61
April 2012
Confirm your input with "OK". A location-specific table can now be entered with its rainfall intensities. For this example the "Hannover-Süd" rainfall intensity table is used. It is loaded automatically when the program starts (see menu item "Edit/Rainfall intensity table", Section 7.2.6).
The shaft infiltration can now be analysed. Go to the "System/Analyse" menu item. The results of
the analysis are shown:
Following this the analysis results are displayed in the graphics.
A required shaft depth of 3.84 m is obtained as the sum of the impounding depth z (= 2.34 m), the
frost-free depth of the supply pipe (= 1.0 m) and the thickness of the filter (= 0.5 m).
GGU-SEEP User Manual
Page 18 of 61
April 2012
6.6
Shaft infiltration - Type B (DWA-A 138, Appendix A.2.5)
The theoretical principles are contained in the standard (Chapters 3.2.3 and 3.3.5, DWA-A 138,
April 2005).
The procedure is demonstrated using the example from the standard (Appendix A.2.5). Go to the
menu item "File/New" or "Edit/Infiltration type". Because analysis is performed according to
DWA-A 138 using the rainfall intensity tables in the KOSTRA Atlas, the "Table" radio button is
activated. Enter a surcharge factor of 1.2, if not already defined. Exit the dialog box by clicking
the "Shaft infiltration" button and selecting shaft type B according to DWA-A 138 (April 2005
edition).
Confirm your input with "OK". Select the "Edit/System parameters" menu item and enter the
data from the following dialog box:
Confirm your input with "OK". Then select the "Edit/Shaft infiltration (Type B)" menu item and
enter the data from the following dialog box:
GGU-SEEP User Manual
Page 19 of 61
April 2012
Confirm your input with "OK". A location-specific table can now be entered with its rainfall intensities. For this example the "Hannover-Süd" rainfall intensity table is used. It is loaded automatically when the program starts (see menu item "Edit/Rainfall intensity table", Section 7.2.6).
The shaft infiltration can now be analysed. Go to the "System/Analyse" menu item. The results of
the analysis are shown:
Following this the analysis results are displayed in the graphics.
A required shaft depth of 4.34 m is obtained as the sum of the impounding depth z (= 2.34 m), the
frost-free depth of the supply pipe (= 1.0 m), the thickness of the filter (= 0.5 m) and the thickness
of the sand/fine-gravel layer (= 0.5 m).
GGU-SEEP User Manual
Page 20 of 61
April 2012
6.7
Swale-French drain infiltration (DWA-A 138, Appendix A.2.3 a)
The theoretical principles are contained in the standard (Chapters 3.2.3 and 3.3.3, DWA-A 138,
April 2005).
The procedure is demonstrated using Example a) in the standard (Appendix A.2.3). Go to the
menu item "File/New" or "Edit/Infiltration type". Because analysis is performed according to
DWA-A 138 using the rainfall intensity tables in the KOSTRA Atlas, the "Table" radio button is
activated. Enter a surcharge factor of 1.2, if not already defined. Exit the dialog box by clicking
the "Swale-French drain infiltration (new)" button.
Select the "Edit/System parameters" menu item and enter the data from the following dialog
box:
Confirm your input with "OK". Then select the "Edit/Swale-French drain infiltration" menu
item and enter the data from the following dialog box:
GGU-SEEP User Manual
Page 21 of 61
April 2012
Confirm your input with "OK". A location-specific table can now be entered with its rainfall intensities. For this example the "Hannover-Süd" rainfall intensity table is used. It is loaded automatically when the program starts (see menu item "Edit/Rainfall intensity table", Section 7.2.6).
The swale-French drain infiltration can now be analysed. Go to the "System/Analyse" menu item.
A note is shown first:
Select the "Accept" button here to completely copy the example in the new standard. Normally,
"Correct" should be selected in order to adapt the selected swale area to the in-situ conditions.
After pressing "Accept" the results of the analysis are shown:
GGU-SEEP User Manual
Page 22 of 61
April 2012
Following this the analysis results are displayed in the graphics.
A swale depth of 0.24 m and a French drain length of 92,91 m are obtained.
GGU-SEEP User Manual
Page 23 of 61
April 2012
6.8
Swale-pipe infiltration
In order to emphasise the procedure the previous example is modified to a swale-pipe infiltration.
Go to the menu item "File/New" or "Edit/Infiltration type". Then press the "Swale-pipe infiltration (new)" button.
Select the "Edit/System parameters" menu item and enter the data from the following dialog
box:
Confirm your input with "OK". Then select the "Edit/Swale-pipe infiltration" menu item and
enter the data from the following dialog box:
GGU-SEEP User Manual
Page 24 of 61
April 2012
Confirm your input with "OK". A location-specific table can now be entered with its rainfall intensities. For this example the "Hannover-Süd" rainfall intensity table is used. It is loaded automatically when the program starts (see menu item "Edit/Rainfall intensity table", Section 7.2.6).
The swale-pipe infiltration can now be analysed. Go to the "System/Analyse" menu item. The
results of the analysis are shown:
GGU-SEEP User Manual
Page 25 of 61
April 2012
Following this the analysis results are displayed in the graphics.
A swale depth of 0.26 m and a French drain length of 61.73 m are obtained.
6.9
Paving with swale infiltration
Notes on the structural design of these systems can be taken from:
Merkblatt für wasserdurchlässige Befestigungen von Verkehrsflächen,
Forschungsgesellschaft für Straßen- und Verkehrswesen, Ausgabe 1998
(Impervious Paving of Traffic Areas, Fact Sheet
German Highways & Traffic Research Association, 1998 edition)
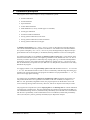
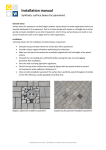
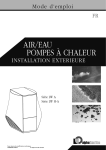
Figure 1 "Paving with swale" designations
The basic design principle is:
The paving is designed as a surface infiltration according to DWA. The surface area supplying the
paving A(u)(paving) is obtained from:
A(u)(paving) = A(u)(total) · (1.0 – runoff coefficient)
The decisive permeability for the paving kf(paving) is obtained from:
kf(paving) = kf(joints) · proportion of joints[%]/100.0
GGU-SEEP User Manual
Page 26 of 61
April 2012
If this value is greater than the permeability of the subgrade or the subsurface, the smaller value is
adopted. The swale is designed as a swale infiltration according to DWA. The surface area supplying the swale A(u)(swale) is obtained from:
A(u)(swale) = A(u)(total) · runoff coefficient
The decisive permeability for the swale kf(swale) is obtained from:
kf(swale) = kf(subsurface)
The procedure is demonstrated using a worked example. Go to the menu item "File/New" or "Edit/Infiltration type". Because analysis is performed according to DWA-A 138 using the rainfall
intensity tables in the KOSTRA Atlas, the "Table" radio button is activated. Exit the dialog box
by clicking the "Paving with swale" button.
Select the "Edit/System parameters" menu item and enter the data from the following dialog
box:
Confirm your input with "OK". Then select the "Edit/Paving with swale" menu item and enter
the data from the following dialog box:
GGU-SEEP User Manual
Page 27 of 61
April 2012
Confirm your input with "OK". A location-specific table can now be entered with its rainfall intensities. For this example the "Hannover-Süd" rainfall intensity table is used. It is loaded automatically when the program starts (see menu item "Edit/Rainfall intensity table", Section 7.2.6).
The infiltration system can now be analysed. Go to the "System/Analyse" menu item. The results
of the analysis are shown:
Following this the analysis results are displayed in the graphics.
GGU-SEEP User Manual
Page 28 of 61
April 2012
A swale depth of 0.40 m is obtained.
6.10 Paving with French drain infiltration
Notes on the structural design of these systems can be taken from:
Merkblatt für wasserdurchlässige Befestigungen von Verkehrsflächen,
Forschungsgesellschaft für Straßen- und Verkehrswesen, Ausgabe 1998
(Impervious Paving of Traffic Areas, Fact Sheet
German Highways & Traffic Research Association, 1998 edition)
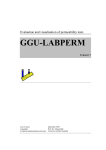
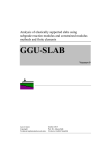
Figure 2 "Paving with French drain" designations
The basic design principle is:
The paving is designed as a surface infiltration according to DWA. The surface area supplying the
paving A(u)(paving) is obtained from:
A(u)(paving) = A(u)(total) · (1.0 – runoff coefficient).
The decisive permeability for the paving kf(paving) is obtained from:
kf(paving) = kf(joints) · proportion of joints [%]/100.0.
GGU-SEEP User Manual
Page 29 of 61
April 2012
If this value is greater than the permeability of the subgrade or the subsurface, the smaller value is
adopted. The French drain is designed as a French drain infiltration according to DWA. The surface area supplying the French drain A(u)(French drain) is obtained from:
A(u)(French drain) = A(u)(total) · runoff coefficient.
The decisive permeability for the subsurface of the French drain kf(French drain) is obtained from:
kf(French drain) = kf(subsurface).
The procedure is demonstrated using a worked example. Go to the menu item "File/New" or "Edit/Infiltration type". Because analysis is performed according to DWA-A 138 using the rainfall
intensity tables in the KOSTRA Atlas, the "Table" radio button is activated. Exit the dialog box
by clicking the "Paving with French drain" button.
Select the "Edit/System parameters" menu item and enter the data from the following dialog
box:
Confirm your input with "OK". Then select the "Edit/Paving with French drain" menu item and
enter the data from the following dialog box:
GGU-SEEP User Manual
Page 30 of 61
April 2012
Confirm your input with "OK". A location-specific table can now be entered with its rainfall intensities. For this example the "Hannover-Süd" rainfall intensity table is used. It is loaded automatically when the program starts (see menu item "Edit/Rainfall intensity table", Section 7.2.6).
The infiltration system can now be analysed. Go to the "System/Analyse" menu item. The results
of the analysis are shown:
GGU-SEEP User Manual
Page 31 of 61
April 2012
Following this the analysis results are displayed in the graphics.
A French drain length of 53.84 m is obtained.
GGU-SEEP User Manual
Page 32 of 61
April 2012
6.11 Paving with pipe infiltration
Notes on the structural design of these systems can be taken from:
Merkblatt für wasserdurchlässige Befestigungen von Verkehrsflächen,
Forschungsgesellschaft für Straßen- und Verkehrswesen, Ausgabe 1998
(Impervious Paving of Traffic Areas, Fact Sheet
German Highways & Traffic Research Association, 1998 edition)
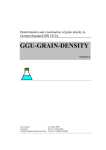
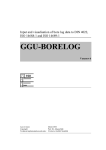
Figure 3 "Paving with pipe" designations
The basic design principle is:
The paving is designed as a surface infiltration according to DWA. The surface area supplying the
paving A(u)(paving) is obtained from:
A(u)(paving) = A(u)(total) · (1.0 – runoff coefficient).
The decisive permeability for the paving kf(paving) is obtained from:
kf(paving) = kf(joints) · proportion of joints [%]/100.0.
If this value is greater than the permeability of the subgrade or the subsurface, the smaller value is
adopted. The pipe is designed as an pipe according to DWA. The surface area supplying the pipe
A(u)(pipe) is obtained from:
A(u)(pipe) = A(u)(total) · runoff coefficient.
The decisive permeability for the subsurface of the pipe kf(pipe) is obtained from:
kf(pipe) = kf(subsurface).
The procedure is demonstrated using a worked example. Go to the menu item "File/New" or "Edit/Infiltration type". Because analysis is performed according to DWA-A 138 using the rainfall
intensity tables in the KOSTRA Atlas, the "Table" radio button is activated. Exit the dialog box
by clicking the "Paving with pipe" button.
GGU-SEEP User Manual
Page 33 of 61
April 2012
Select the "Edit/System parameters" menu item and enter the data from the following dialog
box:
Confirm your input with "OK". Then select the "Edit/Paving with pipe" menu item and enter the
data from the following dialog box:
GGU-SEEP User Manual
Page 34 of 61
April 2012
Confirm your input with "OK". A location-specific table can now be entered with its rainfall intensities. For this example the "Hannover-Süd" rainfall intensity table is used. It is loaded automatically when the program starts (see menu item "Edit/Rainfall intensity table", Section 7.2.6).
GGU-SEEP User Manual
Page 35 of 61
April 2012
The infiltration system can now be analysed. Go to the "System/Analyse" menu item. The results
of the analysis are shown:
Following this the analysis results are displayed in the graphics.
A French drain length of 51.58 m is obtained.
GGU-SEEP User Manual
Page 36 of 61
April 2012
6.12 Swale-pipe infiltration (old)
This infiltration type is only supported in order to retain the availability of older records. Design is
only possible using Reinhold's rainfall series'. Analyses should therefore no longer be carried out
using this type of infiltration!
Details of design and theoretical principles can be taken from the menu item "Edit/Construction
notes + theory".
6.13 Swale-French drain infiltration (old)
This infiltration type is only supported in order to retain the availability of older records. Design is
only possible using Reinhold's rainfall series'. Analyses should therefore no longer be carried out
using this type of infiltration!
Details of design and theoretical principles can be taken from the menu item "Edit/Construction
notes + theory".
GGU-SEEP User Manual
Page 37 of 61
April 2012
7 Description of menu items
7.1
7.1.1
File menu
"New" menu item
A new system design can be entered and analysed. After going to this menu item the option box
opens to allow selection of the required type of infiltration (see menu item "Edit/Infiltration
type", Section 7.2.2).
7.1.2
"Load" menu item
You can load a file with system data, which was created and saved at a previous session, and then
edit the system.
7.1.3
"Save" menu item
You can save data entered or edited during program use to a file, in order to have them available at
a later date, or to archive them. The data is saved without prompting with the name of the current
file.
7.1.4
"Save as" menu item
You can save data entered during program use to an existing file or to a new file, i.e. using a new
file name. For reasons of clarity, it makes sense to use ".vrs" as file suffix, as this is the suffix
used in the file requester box for the menu item "File/Load". If you choose not to enter an
extension when saving, ".vrs" will be used automatically.
7.1.5
"Printer preferences" menu item
You can edit printer preferences (e.g. swap between portrait and landscape) or change the printer
in accordance with WINDOWS conventions.
GGU-SEEP User Manual
Page 38 of 61
April 2012
7.1.6
"Print and export" menu item
You can select your output format in a dialog box. You have the following possibilities:
"Printer"
allows graphic output of the current screen contents. to the WINDOWS standard printer or
to any other printer selected using the menu item "File/Printer preferences". But you may
also select a different printer in the following dialog box by pressing the "'Printer
prefs./change printer" button.
In the upper part of the dialog box, the maximum dimensions which the printer can accept
are given. Below this, the dimensions of the image to be printed are given. If the image is
larger than the output format of the printer, the image will be printed to several pages (in
the above example, 4). In order to facilitate better re-connection of the images, the
possibility of entering an overlap for each page, in x and y direction, is given.
Alternatively, you also have the possibility of selecting a smaller zoom factor, ensuring
output to one page ("Fit to page" button). Following this, you can enlarge to the original
format on a copying machine, to ensure true scaling. Furthermore, you may enter the
number of copies to be printed.
"DXF file"
allows output of the graphics to a DXF file. DXF is a common file format for transferring
graphics between a variety of applications.
"GGUCAD file"
allows output of the graphics to a file, in order to enable further processing with the
GGUCAD program. Compared to output as a DXF file this has the advantage that no loss
of colour quality occurs during export.
GGU-SEEP User Manual
Page 39 of 61
April 2012
"Clipboard"
The graphics are copied to the WINDOWS clipboard. From there, they can be imported
into other WINDOWS programs for further processing, e.g. into a word processor. In order
to import into any other WINDOWS program you must generally use the "Edit/Paste"
function of the respective application.
"Metafile"
allows output of the graphics to a file in order to be further processed with third party
software. Output is in the standardised EMF format (Enhanced Metafile format). Use of the
Metafile format guarantees the best possible quality when transferring graphics.
If you select the "Copy/print area" tool
from the toolbar, you can copy parts of
the graphics to the clipboard or save them to an EMF file. Alternatively you can send
the marked area directly to your printer (see "Tips and tricks", Section 8.3).
Using the "Mini-CAD" program module you can also import EMF files generated using other GGU applications into your graphics.
"MiniCAD"
allows export of the graphics to a file in order to enable importing to different GGU applications with the Mini-CAD module.
"GGUMiniCAD"
allows export of the graphics to a file in order to enable processing in the GGUMiniCAD
program.
"Cancel"
Printing is cancelled.
GGU-SEEP User Manual
Page 40 of 61
April 2012
7.1.7
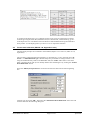
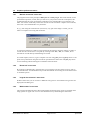
"Batch print" menu item
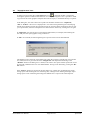
If you would like to print several appendices at once, select this menu item. You will see the
following dialog box:
Create a list of files for printing using "Add" and selecting the desired files. The number of files is
displayed in the dialog box header. Using "Delete" you can mark and delete selected individual
files from the list. After selecting the "Delete all" button, you can compile a new list. Selection of
the desired printer and printer preferences is achieved by pressing the "Printer" button.
You then start printing by using the "Print" button. In the dialog box which then appears you can
select further preferences for printer output such as, e.g., the number of copies. These preferences
will be applied to all files in the list.
7.1.8
"Exit" menu item
After a confirmation prompt, you can quit the program.
7.1.9
"1, 2, 3, 4" menu items
The "1, 2, 3, 4" menu items show the last four files worked on. By selecting one of these menu
items the listed file will be loaded. If you have saved files in any other folder than the program
folder, you can save yourself the occasionally onerous rummaging through various sub-folders.
GGU-SEEP User Manual
Page 41 of 61
April 2012
7.2
7.2.1
Edit menu
"Project identification" menu item
A description typifying the system can be entered; it will then be included in the "System parameters legend" (see Section 7.4.1).
The infiltration type adopted is entered automatically and does not need to be entered via
this menu item.
7.2.2
"Infiltration type" menu item
This menu item is used to select the required type of infiltration. The system is designed according
to DWA-A 138 (April 2005), using the rainfall intensity tables from the KOSTRA Atlas. The
"Table" radio button is activated in the following dialog box; in addition, a surcharge factor can
be entered. According to the standard, this may be between 1.1 and 1.2. If the "Reinhold" button
is activated, design uses the old method with the Reinhold's rainfall series'.
After selecting an infiltration type the screen graphics are refreshed accordingly.
GGU-SEEP User Manual
Page 42 of 61
April 2012
7.2.3
"System parameters" menu item
The primary system boundary conditions are entered using this menu item. The dialog box has a
different appearance depending on the infiltration type selected, see the examples given in Section 6.
All data entered using this menu item are displayed in the "System parameters legend" on the
output sheet (see Section 7.4.1).
7.2.4
"Swale infiltration, Pipe infiltration ..." menu items
The boundary conditions typifying the individual infiltration types are defined using this menu
item. Depending on the infiltration type selected the dialog box has a different design, see the
examples given in Section 6.
All data entered using this menu item are displayed in the "System parameters legend" on the
output sheet (see Section 7.4.1).
7.2.5
"Draining time" menu item
The permeability used to compute the draining time of the infiltration system is defined using this
menu item. The DWA-A 138 standard proposes 0.5 · k for analysis. Activate the required value in
the dialog box.
The maximum draining time is given in the lower half of the box (displayed for paving with
French drain). The program will issue a warning if this value is exceeded during infiltration system analysis.
GGU-SEEP User Manual
Page 43 of 61
April 2012
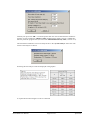
7.2.6
"Rainfall intensity table" menu item
If the analysis is performed using the data from the KOSTRA Atlas tables, location-specific data
must be used. The "Hannover-Süd" rainfall intensity table is included with the GGU-SEEP delivery. The data is loaded automatically when the program starts and displayed in the following
dialog box:
"OK"
Closes the dialog box. The changes made are accepted.
"Load"
Any previously entered and saved rainfall intensity tables can be opened as ".drg" files and
the data used to analyse the planning zone.
"Save"
User-define rainfall intensities or those imported from the KOSTRA Atlas can be saved in
the ".drg" format and the data for the respective site thus utilised for subsequent analyses.
"Cancel"
Closes the dialog box. Any changes made are not accepted.
GGU-SEEP User Manual
Page 44 of 61
April 2012
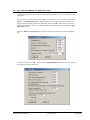
"Convert"
If the rainfall intensity data is available in [mm] instead of [litres/(second · ha)], enter the
values into the table in [mm]. Then click the "Convert" button and confirm this in the following message box by clicking "Yes".
However, only do this if the data has been entered in [mm] and then only once, otherwise the data will be rendered useless.
"Convert back"
The "Convert back" button is intended for emergencies. It allows erroneously converted
data to be reconverted to its original condition.
"KOSTRA" group box
"Import file"
If the required rainfall intensity table is not available as a file, the data can be imported
from the KOSTRA Atlas using this button.
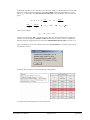
The printed edition of the KOSTRA Atlas includes a DOS program for generating rainfall
intensity tables. If the DOS program is started, you are asked for the values for various
rainfall durations and frequencies for the respective location, which must be picked off the
maps provided. After entering the required data the DOS program is automatically closed
and the determined values stored in a "table" file. Open the file in a text editor and save it
with the name of the location as a text file (*.txt), otherwise the program will overwrite the
old data. If the open the "table" file using an editor it will look similar to that in the figure
below.
The GGU-SEEP program automatically uses the rainfall intensities RN in [litres/(sec·ha)]
(marked columns in the figure above) generated by the DOS program.
Click the "Import file" button to transfer the data to GGU-SEEP and open the previously
created "table" file or the corresponding text file. Enter the location name for which the
rainfall intensities have been determined in the following dialog box, if it is not already imported from the TXT file.
GGU-SEEP User Manual
Page 45 of 61
April 2012
.
After confirmation using "OK" the location name is used in the "Rainfall intensity table"
dialog box.
In order to allow reuse of the KOSTRA data once imported, save them using the location
name via the "Save" button (see above).
"Import clipboard"
If you use the KOSTRA-DWD 2000 (digital database) program in order to determine the
rainfall intensities for the required location, enter the result from the KOSTRA-DWD 2000
program via "Send to clipboard". Then open any text editor and paste the generated rainfall intensity table from the clipboard. It is best to save the file as a text file using the location name.
"Info"
The discussed KOSTRA data import types are described here.
7.2.7
"Construction notes + theory"
Explanations of designs taken from the DWA-A 138 standard are displayed depending on the
selected type of infiltration. You are referred to the DWA-A 138 for some infiltration types.
7.3
7.3.1
System menu
"Analyse" menu item
This menu item starts the analysis of the infiltration system. Alternatively, press the [F5] function
key or click the calculator in the tool bar. First, the input data are checked. A warning message is
produced if errors are identified.
Once the analysis is complete information on the analysis is displayed, as shown in the following
box.
After confirming the input with "OK", the analysed system is displayed on the screen. In addition,
the principle result data are displayed in a legend on the screen.
GGU-SEEP User Manual
Page 46 of 61
April 2012
7.4
7.4.1
Output preferences menu
"System parameters legend" menu item
After selecting this menu item a dialog box opens allowing graphics preferences to be selected for
displaying a legend containing system data. The legend is activated by the "Show legend" check
box. In addition to data in the dialog box the legend also contains the project identification, if it
was entered using the corresponding menu item 7.2.1.
You can define and edit the position of the legend using the values "x" and "y". You control the
size of the legend using "Font size" and "Max. no. of lines"; where necessary, several columns
are used. The legend background can also be given a colour fill.
The fastest way to modify the position of the legend is to press the [F11] function key and
then to pull the legend to the new position with the left mouse button pressed.
By activating the "Short" or "Long" option buttons the current file name can be shown in the
legend, either with or without the path.
GGU-SEEP User Manual
Page 47 of 61
April 2012
7.4.2
"Results legend" menu item
Once the system has been analysed the results can be displayed in a legend on the output sheet. If
the "Show legend" check box is activated in the dialog box below, the shape and appearance of
the result graphics can be individually defined.
A text can be specified under "Heading:", at the top of the dialog box; this will be entered in the
legend.
You can define and edit the position of the legend using the values "x" and "y". You control the
size of the legend using "Font size" and "Max. no. of lines"; where necessary, several columns
are used. The legend background can also be given a colour fill.
The fastest way to modify the position of the legend is to press the [F11] function key and
then to pull the legend to the new position with the left mouse button pressed.
The "With draining time" check box activates display of this value in the legend.
GGU-SEEP User Manual
Page 48 of 61
April 2012
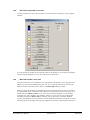
7.4.3
"System visualisation" menu item
A graphical visualisation of the current infiltration system is displayed on the output sheet. The
shape and appearance of this system visualisation can be modified by activating the "Show system" check box in this menu item.
For shaft infiltration only
For swale or shaft infiltration
"Show system"
The Visualisation is activated and uses the x and y coordinates defined in "x value:", "y
value:", "Width:" and "Height:". The "Font size" for labelling is also defined here.
The fastest way to modify the position or size of the system visualisation is to press the
[F11] function key and then to either pull the system visualisation to the new position
or to move the sides of the system visualisation to their new size with the left mouse
button pressed.
"Shaft thickness factor"
The graphical visualisation of the shaft wall for shaft infiltration employs a factor to make
details of the wall clear.
"With inlet"
The inlet to a shaft infiltration system can also be displayed in the graphics.
"With groundwater"
If the groundwater is very deep the system graphics are compressed. The infiltration system
itself is barely recognisable. In such cases, deactivate the "With groundwater" check box.
The graphics are then generally restricted to the zone around the system. The groundwater
level no longer influences the scaling of the graphics.
GGU-SEEP User Manual
Page 49 of 61
April 2012
"With water"
The water-filled system can be visualised for swale and shaft infiltration. Activate the
"With water" check box to enable this option.
"Background colour"
The remaining background of the system visualisation can be given a colour fill.
7.4.4
"Simple header data" menu item
The graphics can be modified to suit requirements using the Mini-CAD system integrated in the
program. Among other things it is possible to create a user-designed company header, which can
also include a company logo, etc. (see Section 7.5.6). If this appears to be too much work this
menu item allows a simplified type of header data to be used.
Activate the "Show header data" check box and enter the required text. The position on the output sheet is defined by "x [mm]:" and "y [mm]:". If required, a coloured background can be defined using the "Background colour" button.
GGU-SEEP User Manual
Page 50 of 61
April 2012
7.4.5
"Rainfall intensity" menu item
The rainfall intensities must be available as table data for an analysis using the KOSTRA Atlas
table data. As long as the user-defined system has not been analysed, the selected table is displayed with all its data on the output sheet.
After going to this menu item the position and size of the table can be modified in the subsequent
dialog box or, if required, be switched off by deactivating the "Show table" check box. The font
sizes used in the table are adjusted to suit the defined preferences.
The fastest way to modify the position or size of the rainfall intensity table is to press the
[F11] function key and then to either pull the table to the new position or to move the sides
of the table to their new size with the left mouse button pressed.
In order to display only the decisive table data after system analysis, the data required for display
can be defined using the radio buttons in the lower group box. If "Only 7 values in the table" is
selected it should be noted that the program automatically display one row above and one row
below the decisive values, i.e. more than 7 rows may be displayed.
7.4.6
"Reset all" menu item
All changes made in the preferences for the legends can be reset to the defaults applied when the
program starts using this menu item.
GGU-SEEP User Manual
Page 51 of 61
April 2012
7.4.7
"Page size and margins" menu item
The program uses A4 format as default. You can edit the page format in the following dialog box.
Enter the values to be adopted for "Page height" and "Page width". The program automatically
draws thin borders around the page, which are required when using paper rolls on a plotter. "Page
margin" defines the position of a thickly drawn frame as a distance to these borders.
In order to achieve 1:1 output on an A4 printer the borders must be switched off (see menu item
"Graphics preferences/With borders", Section 7.5.4) and the page height and page margins be
adapted to the printable area of the printer.
7.4.8
"Move objects" menu item
When you go to this item you can move the various legends and diagrams with the aid of the
mouse. Move the mouse over the object to be moved. When you are located above a moveable
object the mouse pointer appears in the shape of a cross. You can now press and hold the left
mouse button and drag the object to the required position.
After going to this menu item only one object at a time can be moved using the mouse or
its size be altered.
In order to move or edit several objects, this function can be more quickly activated by
pressing [F11] or the
icon.
The size of an object can also be altered using this menu item or the [F11] key. If you move over
the frame of a changeable object after activating this function the mouse assumed the shape of a
double-headed arrow. Hold the left mouse button and move the frame until the object has reached
the required size. To retain the ratio of the sides, pull at one corner only. If on one side only is
pulled the object will become higher or wider.
GGU-SEEP User Manual
Page 52 of 61
April 2012
7.5
7.5.1
Graphics preferences menu
"Refresh and zoom" menu item
The program works on the principle of What you see is what you get. This means that the screen
presentation represents, overall, what you will see on your printer. In the last consequence, this
would mean that the screen presentation would have to be refreshed after every alteration you
make. For reasons of efficiency and as this can take several seconds for complex screen contents,
the screen is not refreshed after every alteration.
If, e.g., after using the zoom function (see below), only part of the image is visible, you can
achieve a complete view using this menu item.
A zoom factor between 0.4 and 8.0 can be entered in the input box. By then clicking on "Use" to
exit the box the current factor is accepted. By clicking on the "0.4", "0.6", etc. buttons, the selected factor is used directly and the dialog box closed.
It is much simpler, however, to get a complete overview using [Esc]. Pressing [Esc] allows a complete screen presentation using the zoom factor specified in this menu item. The [F2] key allows
screen refreshing without altering the coordinates and zoom factor.
7.5.2
"Zoom info" menu item
By clicking two diametrically opposed points you can enlarge a section of the screen in order to
view details better. An information box provides information on activating the zoom function and
on available options.
7.5.3
"Legend font selection" menu item
With this menu item you can switch to a different true-type font. All available true-type fonts are
displayed in the dialog box.
7.5.4
"With borders" menu item
The program automatically draws thin cutting borders around the page, which are required when
using a plotter on paper rolls. You can switch off the lines by deactivating this menu item.
GGU-SEEP User Manual
Page 53 of 61
April 2012
7.5.5
"Pen colour and width" menu item
In order to enhance the clarity of the graphics you can edit the pen settings for various graphic
elements.
You can edit the pen widths for the elements shown in the dialog box; by clicking on the button
with the element designation you can also edit the pen or fill colours.
7.5.6
"Mini-CAD toolbar" menu item
Using this menu item you can add free text to the graphics and add lines, circles, polygons and
images (e.g. files in formats BMP, JPG, PSP, TIF, etc.). A pop-up menu opens, the icons and
functions used are described in more detail in the Mini-CAD manual provided.
Objects created with the Mini-CAD module are based on the page format (in mm). This makes
you independent of the coordinate system and keeps you in the same position on the page. You
should select the "Header toolbar" if you wish to place general information on the drawing
(company logo, report numbers, plan numbers, stamp etc.). Once you have saved the header
information to disk (see Mini-CAD user manual), you can load it into completely different
systems (with different system coordinates). The saved header information will appear in exactly
the same position on the page, which greatly simplifies the creation of general page information.
GGU-SEEP User Manual
Page 54 of 61
April 2012
7.5.7
"Toolbar preferences" menu item
After starting the program a horizontal toolbar for the menu items appears below the program
menu bar. If you would rather work with a popup window with several columns, you can specify
your preferences using this menu item. The smart icons can also be switched off.
At the bottom of the program window you find a status bar with further information. You can also
activate or switch off the status bar here. The preferences will be saved in the "GGU-SEEP.alg"
file (see menu item "Graphics preferences/Save graphics preferences") and will be active at the
next time the program is started.
By clicking on the tools (smart icons) for the menu items you can directly reach most of the
program functions. The meaning of the smart icons appears as a text box if you hover with the
mouse pointer over the tools. Some of the tool functions cannot be activated from the normal
menu items.
"Zoom out"
If you have previously zoomed in, this tool returns to a full screen display.
"Zoom (-)"/"Zoom (+)"
With the zoom functions you can zoom in or out of parts of the image, by clicking the left mouse
button.
"Next infiltration type"
This tool allows you to jump to the next infiltration type without using the menu.
"Copy/print area"
Use this tool to copy only parts of the graphics in order to paste them, e.g. to a report. You will see
information on this function and can then mark an area, which is copied to the clipboard or can be
saved in a file. Alternatively you can send the marked area directly to your printer (see "Tips and
tricks", Section 8.3).
"Colour on/off"
If you prefer to do without colour in the system visualisation, e.g. to create a black and white
printout, use this on/off switch.
"Undo move object"
If you have previously moved a legend ([F11] or used "Output preferences/Move objects"), you
can undo the last movement with this tool.
'Restore move object'
If you have previously undone a movement, you can restore with this tool.
GGU-SEEP User Manual
Page 55 of 61
April 2012
7.5.8
"Load graphics preferences" menu item
You can reload a graphics preferences file into the program, which was saved using the
"Graphics preferences/Save graphics preferences" menu item. Only the corresponding data will
be refreshed.
7.5.9
"Save graphics preferences" menu item
Some of the preferences you made with the menu items of the "Graphics preferences" menu can
be saved to a file. If you select "GGU-SEEP.alg" as file name, and save the file on the same level
as the program, the data will be automatically loaded the next time the program is started and need
not be entered again.
If you do not go to "File/New" upon starting the program, but open a previously saved file
instead, the preferences used at the time of saving are shown. If subsequent changes in the
general preferences are to be used for existing files, these preferences must be imported using the menu item "Graphics preferences/Load graphics preferences".
GGU-SEEP User Manual
Page 56 of 61
April 2012
7.6
7.6.1
? menu
"Copyright" menu item
You will see a copyright message and information on the program version number.
The "System" button shows information on your computer configuration and the folders used by
GGU-SEEP.
7.6.2
"Help" menu item
The GGU-SEEP manual is opened as a PDF document. The help function can also be accessed
using the [F1] function key.
7.6.3
"GGU on the web" menu item
Using this menu item you can access the GGU Software website: www.ggu-software.com.
Keep in touch with new program versions and the regular download offers.
If you would like to be automatically notified about program innovations, please register for the
Newsletter in our Knowledge Base. Go to the following website: http://kbase.civilserve.com.
7.6.4
"GGU support" menu item
This menu item takes to the GGU-Software Support area at www.ggu-software.com.
7.6.5
"What's new?" menu item
You will see information on program improvements in comparison to older versions.
7.6.6
"Language preferences" menu item
This menu item allows you to switch the menus and the graphics from German to English and vice
versa. To work in German, deactivate the two check boxes "Dialoge + Menüs übersetzen
(translate dialogues, menus)" und "Graphiktexte übersetzen (translate graphics)".
Alternatively, you can work bilingually, e.g. with German dialog boxes but with graphic output in
English. The program always starts with the language setting applicable when it was last ended.
GGU-SEEP User Manual
Page 57 of 61
April 2012
8 Tips and tricks
8.1
Keyboard and mouse
You can scroll the screen with the keyboard using the cursor keys and the [Page up] and [Page
down] keys. By clicking and pulling with the mouse, with [Ctrl] pressed, you activate the zoom
function, i.e. the selected section will fill the screen. Furthermore you can use the mouse wheel to
zoom in/out or scrolling the screen presentation. The following mouse wheel functions are
available:
Mouse wheel up
= move screen image up
Mouse wheel down
= move screen image down
[Ctrl] + mouse wheel up
= enlarge screen image (zoom in)
[Ctrl] + mouse wheel down
= shrink screen image (zoom out)
[Shift] + mouse wheel up
= move screen image right
[Shift] + mouse wheel down
= move screen image left
If you click the right mouse button anywhere on the screen a context menu containing the principal menu items opens.
The "Swale infiltration" entry always corresponds to the selected infiltration type (surface infiltration, shaft infiltration, etc.). By double-clicking the left mouse button on legends, diagrams or
Mini-CAD objects, you will immediately move to the editor for the selected object and can then
edit it.
8.2
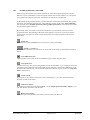
Function keys
Some of the function keys are assigned program functions. The allocations are noted after the
corresponding menu items. The individual function key allocations are:
[Esc] refreshes the screen contents and sets the screen back to the given format. This is
useful if, for example, you have used the zoom function to display parts of the screen and
would like to quickly return to a complete overview.
[F1] opens the manual file.
[F2] refreshes the screen without altering the current magnification.
[F5] opens the menu item "System/Analyse".
[F11] activates the menu item "Output preferences/Move objects".
GGU-SEEP User Manual
Page 58 of 61
April 2012
8.3
"Copy/print area" icon
A dialog box opens when the "Copy/print area" icon
in the menu toolbar is clicked, describing the options available for this function. For example, using this icon it is possible to either
copy areas of the screen graphics and paste them into the report, or send them directly to a printer.
In the dialog box, first select where the copied area should be transferred to: "Clipboard",
"File" or "Printer". The cursor is displayed as a cross after leaving the dialog box and, keeping
the left mouse button pressed, the required area may be enclosed. If the marked area does not suit
your requirements, abort the subsequent boxes and restart the function by clicking the icon again.
If "Clipboard" was selected, move to the MS Word document (for example) after marking the
area and paste the copied graphics using "Edit/Paste".
If "File" was selected, the following dialog box opens once the area has been defined:
The default location of the file is the folder from which the program is started and, if several files
are created, the file is given the file name "Image0.emf" with sequential numbering. If the
"Rename" button in the dialog box is clicked, a file selector box opens and the copied area can be
saved under a different name in a user-defined folder. Saving can be aborted by pressing the "Delete" button.
If the "Printer" button was pressed in the first dialog box, a dialog box for defining the printer
settings opens after marking the area. Following this, a dialog box for defining the image output
settings opens. After confirming the settings the defined area is output to the selected printer.
GGU-SEEP User Manual
Page 59 of 61
April 2012
9 Index
C
L
Clipboard .......................................................... 39
CodeMeter stick.................................................. 4
Colour, switch on/off........................................ 54
Colour/pens, define for graphical elements ...... 53
Company letterhead, add via Mini-CAD.......... 53
Context menu, open.......................................... 57
Copy/print area ..................................... 39, 54, 58
Cutting borders, switch on/off .......................... 52
Language preferences ................................... 5, 56
Legend, move with mouse................................ 51
Licence protection .............................................. 4
D
Description of record, enter ........................ 41, 46
Distance to groundwater..................................... 6
Draining time, analysis....................................... 6
Draining time, preferences for analysis ............ 42
Draining time, show in legend.......................... 47
DWA .................................................................. 4
DXF file, export................................................ 38
DXF file, import ................................................. 4
M
Manual, open as PDF file ................................. 56
Metafile, export ................................................ 39
Mini-CAD file, export ...................................... 39
Mini-CAD, use ................................................. 53
Mouse click functions....................................... 57
Mouse wheel functions ..................................... 57
O
Objects, move with mouse................................ 51
Output sheet, alter position/size of
individual elements using mouse ................. 51
Output sheet, reset all elements to defaults....... 50
E
P
EMF format ...................................................... 39
Emptying time, compute..................................... 6
Page format, define........................................... 51
Page margins, define......................................... 51
Page section, copy/print.................................... 54
Page section,copy/print..................................... 58
Paving design.................................................... 25
Pen preferences................................................. 53
Permeability........................................................ 6
Preferences, program ........................................ 55
Print, graphics................................................... 38
Print, section ......................................... 39, 54, 58
Print, several files ............................................. 40
Printer preferences...................................... 37, 38
Program, load/save preferences ........................ 55
Program, show improvements .......................... 56
Program, show information .............................. 56
Project data, add via Mini-CAD ....................... 53
Project description, display......................... 41, 46
Proportion of joints........................................... 25
F
File, display name in legend ............................. 46
File, load/save................................................... 37
Font, select........................................................ 52
Frequency, rainfall event .................................... 6
Function keys ................................................... 57
G
General page informations, add via
Mini-CAD .................................................... 53
German meteorological office ............................ 7
GGUCAD file, export....................................... 38
GGUMiniCAD file, export............................... 39
Graphics, add via Mini-CAD............................ 53
R
H
Header data, enter............................................. 49
I
Infiltration type, display in legend.................... 41
Infiltration type, select...................................... 41
Installation .......................................................... 4
K
Knowledge Base, access................................... 56
KOSTRA-Atlas .................................................. 7
KOSTRA-DWD ............................................... 45
GGU-SEEP User Manual
Rainfall duration, after Reinhold ........................ 7
Rainfall duration, using surface infiltration ........ 9
Rainfall intensity table, display as legend ........ 50
Rainfall intensity table, edit.............................. 43
Rainfall intensity table, import as
KOSTRA data .............................................. 44
Rainfall intensity table, influence on
design result ................................................. 13
Rainfall intensity table, units ............................ 44
Reinhold's rainfall series', activate.................... 41
Reinhold's rainfall series', application ................ 7
Runoff coefficient............................................. 25
Page 60 of 61
April 2012
S
Scroll the screen ............................................... 57
Seepage zone ...................................................... 6
Smart icons, for menu items ............................. 54
Status bar main program, activate .................... 54
Supplying area A(u) ......................................... 25
Surcharge factor, enter...................................... 41
Surcharge factor, for storage volume
determination ................................................. 7
System, analyse ................................................ 45
System, show information ................................ 56
Translation, activate ......................................... 56
True-type font................................................... 52
V
Version number, display in a message box....... 56
W
Water supply, using 2 pipes.............................. 16
What you see is what you get ........................... 52
Z
T
Toolbar, edit for menu items ............................ 54
GGU-SEEP User Manual
Zoom factor, define for full-screen display ...... 52
Zoom function, activate ........................ 52, 54, 57
Page 61 of 61
April 2012