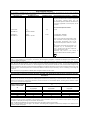
1
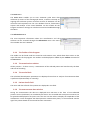
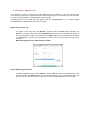
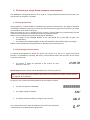
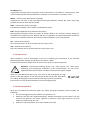
 Medexpert Arteriograph™ Medexpert Arteriograph Software™ Copyright © 2011 Medexpert Ltd., Budapest, Hungary. All rights reserved. Under the copyright laws, this manual cannot be reproduced in any form without prior written permission of Medexpert Ltd. Every effort has been made to ensure that the information in this manual is accurate. Succeeding models and manuals are subject to change without notice. Medexpert is not responsible for printing or clerical errors. This Manual is produced on the assumption that the operator is an experienced user of the Windows 2000 / XP / Vista / 7 Operating Systems. If the operator is not familiar with Windows operations, please refer to the online Help of Windows or the Windows User Manual. Arteriograph is an unregistered trademark of TensioMed Ltd. Other company and product names mentioned herein may be trademarks of their respective companies. Head office and service: Medexpert Ltd. Törrökkö u. 5‐7. 1037 Budapest, HUNGARY Hungary Phone: +36 1 250 4490 Fax: +36 1 250 3795 Web: www.medexpert.hu E‐mail: [email protected] Contents
1
Introduction................................................................................................................................. 7
1.1
1.2
1.3
1.4
1.5
2
The Medexpert Arteriograph device ..................................................................................... 9
2.1
2.2
2.3
2.4
2.5
3
Preface ................................................................................................................................................. 7
Contents of the manual....................................................................................................................... 7
General information............................................................................................................................ 7
Guarantee............................................................................................................................................ 7
Warnings and precautions .................................................................................................................. 8
The device at a glance ......................................................................................................................... 9
The accessories of the Device ........................................................................................................... 10
Installing the Device .......................................................................................................................... 10
Operation instructions ...................................................................................................................... 11
System (Bluetooth communication) setup....................................................................................... 11
The software.............................................................................................................................. 12
3.1
Medexpert Arteriograph Software installation and setup .............................................................. 12
3.1.1
Preliminary information about the software .............................................................................. 12
3.1.2
Minimum system requirements................................................................................................... 12
3.1.3
Software Installation .................................................................................................................... 13
3.1.4
The hardware key ......................................................................................................................... 15
3.2
The software at a glance ................................................................................................................... 15
3.2.1
The Menu of the Program ............................................................................................................ 16
3.2.2
The Toolbar of the Program ......................................................................................................... 17
3.2.3
The examinations window ........................................................................................................... 17
3.2.4
The results block........................................................................................................................... 17
3.2.5
Patient details field....................................................................................................................... 17
3.2.6
The measurement data window .................................................................................................. 17
3.3
First step – Register a user ................................................................................................................ 18
4
Performing a single blood pressure measurement ........................................................ 19
4.1
4.2
4.3
5
Patient preparation........................................................................................................................... 19
Performing the measurement .......................................................................................................... 19
Acoustic signals ................................................................................................................................. 20
Performing pulse wave recording and analysis .............................................................. 21
5.1
Hemodynamic parameters measured by the Arteriograph............................................................. 21
5.2
System setup ..................................................................................................................................... 22
5.3
Patient preparation........................................................................................................................... 22
5.4
Performing the measurement .......................................................................................................... 24
5.4.1
Device and measurement setup .................................................................................................. 24
5.4.2
Select a patient ............................................................................................................................. 26
5.4.2.1
How to select an existing patient ....................................................................................... 26
5.4.2.1.1 How to modify a patient’s data ..................................................................................... 26
5.4.2.1.2 How to search for a patient ........................................................................................... 26
5.4.2.2
How to enter a new patient’s data..................................................................................... 27
5.4.3
Medical Examination with Medexpert Arteriograph .................................................................. 28
5.4.4
Quality control of the measurement ........................................................................................... 30
5.4.4.1
Quality control index: the SD PWVao................................................................................. 30
5.4.4.2
Quality control by visual inspection ................................................................................... 30
5.4.5
How to analyse the data .............................................................................................................. 33
5.4.5.1
Tools for visual inspection .................................................................................................. 36
5.4.5.2
Oscillation amplitudes during blood pressure measurement ........................................... 37
5.4.5.3
Vascular age assessment .................................................................................................... 38
5.4.6
The measurement Report ............................................................................................................ 38
5.4.6.1
Edit the Report .................................................................................................................... 39
5.4.6.2
Print the Report .................................................................................................................. 40
5.4.6.3
How to send a Report in PDF format.................................................................................. 43
5.4.7
Export the measurement data ..................................................................................................... 43
5.4.8
Backup and restore the database ................................................................................................ 45
5.4.8.1
Backup data......................................................................................................................... 45
5.4.8.2
Restore data ........................................................................................................................ 46
5.4.8.3
Import previous database................................................................................................... 46
6
7
Troubleshooting....................................................................................................................... 47
Technical Specification.......................................................................................................... 49
7.1
Electromagnetic compatibility .......................................................................................................... 50
1. Introduction
1.1 Preface Thank you for choosing Medexpert Arteriograph™. This state‐of‐the‐art device and method enables recording and analysing arterial pulse waves in an exceptionally easy, reliable and accurate way. With this entirely new implementation of oscillometric method a complete arterial function evaluation can be achieved. 1.2 Contents of the manual This manual helps you in setting up and starting to use the Medexpert Arteriograph TL2 device as well as installing and setting up the Medexpert Arteriograph Software up to versions 3.0.0.0. Attention! Before first use, please read and understand this document carefully. 1.3 General information •
•
•
•
When active, the Device does not cause any electromagnetic disturbance and its immunity to environmental effects is also sufficient. The measurement data are downloaded into the PC through wireless Bluetooth communication. The electromagnetic compatibility between the Device and the PC is guaranteed (see Section 7.1 for details). To ensure the optimal performance and precise operation the Device should be maintained at the manufacturer’s service every second year. The cuff and the Device itself can be cleaned with a wet cloth by making sure that no liquid enter into the Device. The manufacturer’s products must be handled, stored, packaged, protected and shipped in compliance with the general quality requirements. Attention! Federal Law restricts this device to use by or on the order of a physician, or other licensed practitioner (US only). 1.4 Guarantee Medexpert Ltd. offers a two‐year guarantee period for the Device. Any repair within or beyond the guarantee period will be performed by Medexpert Ltd. at the company’s site as indicated above. 1.5 Warnings and precautions ! Caution! Patient safety The device has an integrated safety mechanism, which prevents the cuff pressure to exceed 300 mmHg. If however the inflation continues above this value or the pressurization lasts too long, unplug the tube of the cuff from the device and remove the cuff from the subject. Do not use the device on an arm, which is being injected with intravenous injection. Do not use on neonates. Device use Only use with cuffs supplied by Medexpert Ltd. Use of cuffs supplied by a third party can lead to erroneous measurement results. Confirm blood pressure measurement with auscultation when erroneous results are suspected. Do not use a microwave device (e.g. mobile phone) near the unit during measurement. Do not use the device when it is exposed to mechanical vibration (e.g. in vehicles). Prevent the device to be exposed to direct sunlight, to get in contact with liquid or from excessive mechanical impact. Do not disassemble the device. 2. The Medexpert Arteriograph device
This section will give an introduction on the device along with installation information and operation instructions. 2.1 The device at a glance Figure 1 shows the front view of the device: 1. The name of the Device 2. Air connector 3. LCD 4. Push button for entering two commands to control the Device, as per Section 2.4 5. Symbols standing for the above two commands 1
4 2 3 5
Figure 1 Figure 2 shows the device label. The meanings of the symbols are the following: 6. Name of the Device 7. Name of the Manufacturer 8. Range of ambient operating temperature 9. Manufacturing serial number 10. Applicable nominal range of supply voltage with the batteries 11. Year of manufacturing 12. Safety classification of electric shock protection (Classification: Patient side: BF) 13. Warning on the importance of reading this User Manual thoroughly 14. Certification mark as a guarantee of the Device’s conformity with EU requirements 15. Type ID of the Device 7
6
8
15
9
14
13
Figure 2
12
11
10
2.2 The accessories of the Device Arteriograph has the following accessories: • 4 pcs. AA size alkaline batteries • Three D‐ring cuffs of different sizes (see below) • Medexpert Arteriograph Software installation CD • A tape measure for measuring the jugulum – symphysis distance • Bluetooth adapter kit (Bluetooth adapter, Driver CD, Operation manual) • A protective pouch for the device • A User’s Manual The cuff sizes are, as follows: Cuff type Bladder dimensions Sleeve dimensions Arm circumference range 01 34 × 8 cm 62 × 9 cm 34 ‐ 43 cm 02 26 × 8 cm 52 × 9 cm 26 ‐ 33 cm 03 18 x 6 cm 38 x 7 cm 18 ‐ 25 cm 2.3 Installing the Device Arteriograph is a battery operated device. • Insert 4 durable alkaline AA batteries into the Device with taking care of the right polarity (see Figure 3) • Or insert 4 AA sized rechargeable Ni‐MH or NiCd batteries as per the above instruction. (Please note that new batteries must be pre‐charged.) o For problem‐free operation minimum 1,500 mAh chargeable Ni‐MH or NiCd batteries are recommended. Figure 3
Note: The clock circuits of the Device are fed by integrated NiCd HA 35 battery cells, therefore the operation of the clock is independent from the AA battery supply. Attention! If you do not intend to use the Device for a longer period of time, remove the batteries and store them in a dry and cool place out of little children’s reach. Do not expose them to intense heat because it may cause a short circuit. Regarding both rechargeable and alkaline batteries, the policies of use and waste collection as governed by detailed environmental and labour safety requirements are to be considered. Once the batteries are inserted in the Device, the following checks are performed automatically: • Voltage control of the batteries. The measured value appears on the LCD for a few seconds. The supply voltage is sufficient if the measured value is between 6.0 V and 5.4 V for alkaline batteries and between 4.8 V and 4.6 V for rechargeable batteries. • If the voltage drops below 4.4V, the batteries must be replaced. A warning symbol of low battery appears on the LCD. • The Device is ready for operation if the current PC time appears on the LCD. 5.6V
LOw Batt
D 09-39
2.4 Operation instructions There is a single push button available for operating the Device (Section 2.1). The patient can use the only push button for issuing a total of two commands. 1. By pressing the button shortly manual blood pressure measuring will start. Note! In this case the Device performs blood pressure measurement without any arterial function (e.g. PWVao, Aix) evaluation. 2. The Device can be turned off by pressing the button twice. In OFF state the device cannot be operated either manually or by PC. To turn it on the button must be pressed twice again. OFF
2.5 System (Bluetooth communication) setup In case your PC does not have a built‐in Bluetooth (at least v2.0), install the supplied Bluetooth communication adapter by reading and following the instructions of the enclosed Bluetooth operation manual. If necessary, ask for the help of your system administrator. After successful installation a Bluetooth icon appears in the system tray of the PC indicating an active Bluetooth service. For connecting Arteriograph to the PC see Section 5.2. Data transmission can only be initialized with the Arteriograph Software. 3. The software
3.1 Medexpert Arteriograph Software installation and setup 3.1.1 Preliminary information about the software The Medexpert Arteriograph Software (Arteriograph SW) is a Windows‐based software. The common Windows mouse operations are to be used in the program (left single‐click, double click, drag, etc.). Button and command names ending in … indicate that a dialog window will open upon clicking on those items. Arteriograph SW allows you to perform arterial function measurement, to print and share the measurement report and to modify the measurement settings. 3.1.2 Minimum system requirements •
•
•
Pentium IV PC, 256MB memory, 2GB available HDD capacity, CDROM, 1024*768 resolution, Windows 2000 operating system with Service Pack 4, Windows XP with Service Pack 2, Windows Vista or Windows 7 installed, Active Bluetooth v2.0 port. Although the Program can start in a less powerful environment, in that case we cannot take responsibility for its fast and reliable operation. 3.1.3 Software Installation For installing the Arteriograph SW on the computer the user must have administrator privileges. After the installation is completed, please visit our website (www.medexpert.hu) for the latest software upgrades. Installation instructions for those can also be found on our site. Step 1 Insert the CD into the CD tray of your PC. The installation procedure will start automatically. In case it does not, start the installation by double‐clicking the setup.exe file on the disc with use of a file manager program. Should a security warning pop up, simply press Run to start the installation Step 2 To start the Setup Wizard, choose a preferred language for installation and click OK. Step 3 The wizard starts with a welcome screen. Please close all the other running Windows applications and click Next. Step 4 Select the components to be installed from the drop‐down list. The type of installation can either be Full or Upgrade. When the preferred component is selected, click Next. Step 5 The following screen offers you to create an icon on the desktop. This task can be deselected. Click Next to start the installation process. Step 6 The status of the automatic installation procedure can be tracked on a progress bar. If you want to interrupt it, click Cancel. This procedure also includes the driver installation of the hardware key (see Section 3.1.4). Step 7 When the automatic installation procedure is finished the following screen appears. Click Finish to exit the Wizard and start the Arteriograph Software. 3.1.4 The hardware key For copy protection purposes, the software is supplied with a hardware key. Before starting the software and during its run the hardware key must be plugged in a USB port of your computer. As the software installation wizard installs the driver of the hardware key automatically, the hardware key is ready for use. Note: Without the hardware key the software will not start, and an error message will appear. Attention! Do not remove the hardware key while the software is running, as it causes the software to freeze out. 3.2 The software at a glance To start the Program double‐click the Arteriograph icon on your desktop, or use the Windows Start Menu to navigate to the program in the Program Files. A splash screen appears along with a login dialog window. When started for the first time, simply press OK and the Program logs in the user with the default “ARTERIOGRAM” login name. On every login after that, however, the user name must be specified. The program window appears with the following components. (For a better understanding the picture below shows the program window after a completed measurement.) 1. Menu bar 2. Toolbar 3. Examinations window 4. Results field 5. Patient details field 6. Data window 3.2.1 The Menu of the Program The menu bar of the software can be found under the title bar and contains the menu items through which all the major functions of the program can be accessed. The File Menu The basic functions of Arteriograph SW can be accessed through the File menu. You can enter new patients, open, edit or delete existing
database records, save the result of an analysis; furthermore edit, print
and send medical reports, as well as log out and exit. The View Menu The View Menu enables you to choose to display the pulse waves recorded or the maximum amplitudes of the oscillatory signals at each
cuff pressure step (deflated stepwise with 10 mmHg) during blood
pressure measurement. Furthermore you can set the scale both
horizontally and vertically, hide the Toolbar, and get information about
the currently studied patient. The Tools Menu The Tools Menu enables you to start automatic pulse wave data
collection by means of the Arteriograph Device, as well as interrupt an
ongoing data collection process. Previous versions of databases can be
converted and imported into the new database format; furthermore
exports and backups of the actual database can be created. All the
Program and Device settings can also be accessed and modified through
this Menu. The Information Menu The most important information about the manufacturer and the
software can be accessed through the Information menu. The menu also includes this User’s Manual. 3.2.2 The Toolbar of the Program The toolbar can be found under the menu bar and contains icons, which allow direct access to the major functions of the program. The Toolbar can be displayed or hidden by the Toolbar command of the View Menu. 3.2.3 The examinations window All the previous – if there are any – examinations of the selected patient are listed here by the date and time of recording. 3.2.4 The results block The calculated hemodynamic parameters are displayed here when an analysis of measurement data is performed (automatically or manually). 3.2.5 Patient details field The name and date of birth of the patient are displayed in this field. 3.2.6 The measurement data window During the measurement the data are displayed here real‐time in the form of non‐calibrated pressure curves (oscillations) as recorded by the device. The recorded and saved pressure waves can be opened and displayed at any later time. The User can also select to display the amplitudes of the oscillometric curves throughout the blood pressure measurement phase, or the estimated vascular age of the patient based on the arterial function assessment. 3.3 First step – Register a user If the program is used by several users with different groups of patients, it may be necessary that users can access their own respective patients’ data only after login. To this end a new user will have to register in the database by specifying the name and login. Arteriograph SW can be used with the default login of “ARTERIOGRAM”; it is, however highly recommended to create and use your own user login. Registration of a new user To register a new user, open the Options… window under the Tools menu and select the Users tab. To enter a new user click on Add New and then enter the first and family names of the user and specify a login name (user ID). Click Add to register the new user in the database or click Cancel to interrupt the registration. The new user can log in with the login name specified. Note! The registered users’ data cannot be edited. How to delete registered users To delete registered users, select Options… under Tools and click on the Users tab in the pop‐up window. The Delete button can be used for deleting a pre‐selected item from the users list. In case the list contains only one user, the Delete function will not be available. 4. Performing a single blood pressure measurement
The Medexpert Arteriograph device can be used as a simple automatic blood pressure meter. (For this function no computer is needed.) 4.1 Patient preparation Sitting position is recommended for standard blood pressure measurement. The patient should be comfortably seated with the legs uncrossed and the back and arm supported. The cuff on the upper arm should be at the level of the heart. Allow the patient to sit in a relaxed state for at least 5 minutes before the measurement. Ensure optimal room temperature and eliminate excessive background noise. Choose a cuff of appropriate size by considering the followings: • The length of the inflatable bladder of the cuff should be at least 80% of upper arm circumference. • The width of the inflatable bladder of the cuff should be at least 40% of upper arm length. (Please read and follow the latest guidelines on blood pressure measurement.) 4.2 Performing the measurement To operate Arteriograph first install the device (see Section 2.3). There is a single push button (Section 2.1) available for operating the Device. The measured values and the status of the Device are shown on the LCD. • The Device is ready for operation if the current PC time appears on the LCD. By pressing the button shortly manual blood pressure measuring will start. Note: In this case the Device performs blood pressure measurement without arterial function (e.g. PWVao, Aix) evaluation. D 09-39
By doing so, the current time will disappear from the display and then: • The LCD test pattern is displayed, • The supply voltage is checked •
The Device calibrates itself by setting the zero pressure The measurement starts with the inflation of the cuff. This procedure is indicated by an arrowhead pointing upwards. 5.6V
CAL 0
87
During deflation an arrowhead pointing downwards indicates the procedure. When measurement is completed, the Device displays the systolic and diastolic values, and then the heart rate. The measuring process can be disrupted any time by a single press on the button. The text “OFF” will appear and remain visible for about 5 seconds on the display. Thereafter the time is displayed again, which indicates the ready‐to‐operate status for another manual or programmed measurement. 69
128/96
PUL 68
4.3 Acoustic signals When the Device is active, a gentle acoustic signal is emitted when its button is pressed down. OFF
5. Performing pulse wave recording and analysis
Pulse wave registration can only be initialized by Arteriograph SW that is running on a PC with wireless Bluetooth data transmission link to the Device (in this case the button of the device should not be used)! The oscillatory signals recorded during the whole measuring process are displayed real‐time on the PC screen. 5.1 Hemodynamic parameters measured by the Arteriograph The following hemodynamic parameters are computed during the measurement: Sys – Brachial systolic blood pressure (mmHg) Dia – Brachial diastolic blood pressure (mmHg) HR – Heart Rate (beat/min) MAP – Mean Arterial Pressure (mmHg) As calculated from the brachial systolic and diastolic blood pressure. MAP = diastolic blood pressure + (systolic – diastolic blood pressure)/3 PP – Brachial Pulse Pressure (mmHg) PP is the difference between the systolic and diastolic blood pressure in mmHg. ABI – Ankle – Brachial Index (Dimensionless index) The ratio of the ankle systolic blood pressure and brachial systolic blood pressure values. Aix brachial – brachial augmentation index (%) Augmentation index = The difference between the amplitudes of the late (backward) systolic wave (P2) and the early (forward) systolic wave (P1) over the pulse pressure (PP) and multiplied with 100 Aix = (P2‐P1)/PP*100 Aix aortic – central augmentation index (%) Calculated on the basis of a very strong (R>0.9) linear relationship between the brachial and central augmentation index. ED – Ejection Duration of the left ventricle (ms) It is the period of the mechanical systole, i.e. the time‐span between the opening and closing of the aortic valves. RT – Return time (ms) The RT is the time of the pulse wave travelling from the aortic root to the bifurcation and back. PWVao – aortic pulse wave velocity (m/s) The velocity of the pulse wave in the aorta. This is calculated from the travelled distance (measured as the suprasternal notch – pubic bone distance) of the pulse wave in the aorta divided by the measured transit time (RT/2). SD PWVao (m/s) A parameter informing about the quality of the measurement. The PWVao is calculated from each pulse recorded and the standard deviation is featured. For more details, see Section 5.4.4.1. SBPao – central systolic blood pressure (mmHg) Calculated on the basis of the physiological relationship between diastolic BP, mean arterial BP, peripheral and central Aix and central SBP. PPao – central pulse pressure (mmHg) The difference between aortic systolic and diastolic BP values. DRA ‐ Diastolic Reflection Area (Dimensionless index) DRA provides information about the quality of diastolic filling in the coronary arteries, taking into consideration the duration of the diastole and the area between the expected (theoretical) diastolic pressure curve without reflection and the truly measured diastolic curve with reflection. SAI – Systolic Area Index (%) SAI is the systolic part of the area under the entire pulse curve. DAI – Diastolic Area Index (%) DAI is the diastolic part of the area under the entire pulse curve. 5.2 System setup After installation, connect Arteriograph to the PC by following the instructions of the enclosed Bluetooth Operation manual. The passkey of the device is 0000. The device should not be farther than 10 metres from the PC for optimal operation. !
Attention! Transmission‐inhibiting objects (e.g. metal objects) can cause signal weakening and consequently malfunction in the communication. The use of the supplied protective pouch does not affect the transmission signal strength. When an active Bluetooth device (e.g. a PC) tries to add Arteriograph the sign shown on the right appears on the LCD. No actual data transmission takes place yet. Adding Arteriograph is only possible by entering its passkey (see above). Data transfer can only be initiated with use of the Arteriograph SW. Bluelink
5.3 Patient preparation Wrap the cuff around the dominant upper arm. When doing this procedure, please consider the followings: • Use the cuff suggested by the software (see Section 5.4.2) • Make sure that the cuff is tightened properly, without causing harm to the patient. The cuff should fit the patient’s arm evenly. Tightness is sufficient if your finger cannot or can only hardly be inserted under the cuff. • Make sure that the patient’s skin is not pinched by the cuff. Note: If the cuff is too loose or big, the SW does not provide measurement results and gives an error message (“Small amplitudes!”). The cuff should not contact the patient’s chest during the measurement because the respiratory movements may cause pressure alterations and artefacts in the cuff.
According to the guidelines for measuring arterial function routinely the supine position is recommended for measurements. In case the examination is performed while the patient is seated, indicate this fact in the “Comment” field of the SW when the patient’s data are entered. • Place the cuff in a way that the hose is in anterior position. • To avoid the irritation of the skin a long‐sleeved shirt made of some thin material can be worn under the cuff. • Connect the hose of the cuff to the air connector of the Device. For this, push the plug on the hose into the air connector of the device and twist the plug slightly until it securely clicks. Make sure that the cuff is properly attached by checking the tightness of the connection. • Measure the suprasternal notch – pubic bone distance (Jug‐Sy) with use of the supplied tape measure. Note: The suprasternal notch (jugulum) – pubic bone (symphysis) distance should be measured in a straight line. Measuring on the body surface can lead to overestimation (e.g. in case of obese patients). •
Ensure optimal measuring conditions: o Speaking, muscle movements, especially the movement of arm muscles must be avoided as these activities significantly increase the measuring time, may result in measurement failure or may reduce the precision rate thereof. Muscle movements (tremor) distort the form of the measured pulse wave and render its evaluation impossible. o Within 3 hours before the examination the patient should not consume a greater amount of food, drink coffee or smoke. Additionally within 10 hours before the examination alcohol consumption should be avoided. o The patient should not sleep during the measuring phase. o At least a ten‐minute period of physical and mental rest is required before the examination. o Any circumstance (e.g. noise, phone ringing, persons’ movement in the examining room) that may disturb the patient’s calm must be avoided. o Should “White Coat Effect” be detected the measurement must be repeated several times with a few minutes’ intervals or the examination should be repeated in another time. 5.4 Performing the measurement To start the Program double‐click the Arteriograph icon on the desktop or use the Windows Start Menu to navigate to the program. Log in to the software with the previously specified user name (see Section 3.3). (When started for the first time, the Program logs in the user with the default “ARTERIOGRAM” login name. On every login after that, however, the user name must be specified.) In case a wrong or non‐existent user name is given, the Program will offer the default name. 5.4.1 Device and measurement setup Before starting the measurement changing or checking setup parameters may be needed. For setting up the Device select Options… under the Tools menu. In the pop‐up window the following parameters can be set in the System tab: • Initial inflation pressure is the value Arteriograph inflates the cuff to when starting a blood pressure measurement. This can be set as a fixed or a relative value. In this latter case the Device adds 50 mmHg to the mean arterial pressure (MAP) value measured previously and inflates the cuff to this pressure. The relative value is the default setting. • Offset of systolic pressure level determines the value which is added to the measured systolic pressure in order to obtain the suprasystolic pressure step where the Device will record pulse wave data. 35mmHg is the default setting, which means that data will be collected at a pressure level of the measured systolic value + 35mmHg. For diagnostic examinations this value should not be set lower than 35 mmHg. • Offset of diastolic pressure level determines the value which is added to the measured diastolic pressure in order to obtain the pressure step where the Device will record diastolic pulse wave data (volume curve). Zero (0) is the default setting, which means that data will be •
•
•
•
•
collected at the pressure step corresponding to the measured diastolic value. Diagnostic examinations should not deviate from this value. Data transfer time at dia and sys pressure level determines the time‐span (in seconds) of pulse wave data collection at the above‐specified pressure levels. The default value is 8 sec. Diagnostic examinations may deviate from this value in the 7‐10 sec range. Data interface: GDT; The GDT interface enables data transfer between medical devices and general practice IT systems according to the standard produced by the German Quality Assurance Software (QMS). A practice software system that supports GDT is required for the communication. For setting up the GDT interface, please read and follow the GDT interface manual located on the Arteriograph installation CD. Calculation of Ankle Brachial Index; if selected, Ankle‐Brachial Index is calculated. For this the ankle systolic blood pressure has to be measured before the pulse wave recording (see Section 5.4.3). Communication port; A default communication port number can be defined here. This way the user can avoid the more time consuming process of automatic port search. The proper port number can be checked under Control Panel ‐> Bluetooth devices. If this field is left blank, the software performs an automatic port search when starting the measurement. This process may take up to one minute. User defined parameter; One new parameter can be added to the patient’s data‐set through this function. Enter the name of the parameter into the input field (the parameter will be displayed in the Patient details field on the print‐out, see 5.4.6.2) and press Set. Note: A new parameter can be added to a patient’s data only once and cannot be modified or deleted later. The new parameter wil automatically be added to all the patients in the database. After setting it into either a new patient’s data or an existing patient’s data, the patient characteristics will feature this newly specified parameter, as well. Non‐Device‐specific settings: • Program language; the language of the Arteriograph SW can be selected. The change only takes place upon the next SW start. • Date format; one of the following date formats can be selected: Year‐month‐day, day‐
month‐year, and month‐day‐year. Default settings can be restored by clicking on Default Settings. The settings must be downloaded into the Device to take effect. For this use the Downloading into the Device button. The download of the settings to the Device can be tracked on the screen. The text “CONNECT” will be displayed on the LCD of the Device while communication is in progress. Successful data download will be confirmed on the PC. CONNECT
Note: The downloaded settings cannot be cancelled. They can be overwritten through re‐
programming. 5.4.2 Select a patient 5.4.2.1
How to select an existing patient After logging in to the program use the Open command in the File menu or click on the Open button (see on the left) on the toolbar for displaying the list of the patients that belong to the user logged in. Find and select the patient you are interested in (by double‐clicking on the row which contains the patient’s details or by highlighting the row with a single click and then click on OK). The selected patient’s full name and date of birth are displayed in the Patient Details block under the Toolbar. In addition, the patient’s previous examinations will also appear in a list, if there are any. 5.4.2.1.1 How to modify a patient’s data Select the patient (as described above) whose data you wish to modify (by a single click in the Patients’ List) and press Edit. Click on OK to save the modified data. 5.4.2.1.2 How to search for a patient In case there is a great number of patients, a particular patient can be found by using the search function of the software. For a quick search click anywhere in the patient list and type in the initials of the family name of the given patient. The quick search is not case sensitive. An advanced search can be done by name or date of birth with use of the “Search for” function. Select “Name”, “Date of Birth” or “ID” and type in the name, date or ID you want to find into the “Search for” field. This function is case sensitive. When searching by name, the search is made in both the first and last names and even a part of the name can be searched for not necessarily including the initial of the name. 5.4.2.2
How to enter a new patient’s data If you want to enter a new patient into the database, select the New patient command in the File menu or click on the New patient button (see on the left) on the Toolbar. For entering a new patient only the date of birth, the height, the patient’s jugulum – symphysis (JUG‐SY) distance and the upper arm circumference are required to be filled out. The jugulum – symphysis distance and the upper arm circumference can be measured by means of the tape measure provided as an accessory (see Section 5.3). The former data is necessary for calculating the pulse wave velocity while the latter one is needed for calculating the proper cuff size. After filling out the arm circumference field the suggested cuff type and its size will automatically appear next to it. Note: To achieve good measurement quality always use the cuff suggested by the software. The cholesterol unit can be selected from a drop‐down list (mmol/l or mg/dl). The Comment field is advised to be filled out with important information on the measuring conditions (e.g. the measuring position, pregnancy). Fill out the Risk profile field with information on the known cardiovascular risk factors, such as family history, duration and frequency of smoking, etc. 5.4.3 Medical Examination with Medexpert Arteriograph To start a single measurement select PW read under Tools or press the START button on the toolbar. To start a scheduled sequence of measurements click the Repeated Measurements… button on the toolbar. In the dialog window the length of the test and the measurement frequency can be set. To start the measurements, click Start. The measurement process can be interrupted by pressing the Stop button. When starting a measurement a confirmation window will pop up with some important measurement information. If the listed data are correct, press Yes to start the measurement process. If these data need to be modified, press No and edit the patient’s characteristics (see Section 5.4.2.1.1) The measurement process starts with the SW connecting to the Arteriograph device. The scanning of the active ports and the communication process can be tracked on the monitor. While this communication is in progress, “CONNECT” (See Section 5.4.1) will appear on the LCD of the Device. After a short time measurement will start automatically by performing a blood pressure measurement in the first phase. During measurement the recorded pulse wave curves can be tracked on the screen. In the second phase the pulse wave recording for pulse waveform analysis is performed. • First the Device will inflate back to the diastolic pressure level and register the pulse waves for a previously determined duration (8 sec by default). • Second, the Device inflates further to the suprasystolic pressure level (by default to the measured systolic value + 35mmHg) occluding the brachial artery completely in this way and registers the pulse waves for a previously determined duration (8 sec by default). (The time and pressure offset values can be modified through the system settings function in the above‐described manner. See Section 5.4.1) During the measurement there is a real‐time data transfer enabling the user to see the recorded oscillatory waves on the screen. At the end of the examination the Device transmits the blood pressure values to the PC, as well. The SW displays the followings: systolic and diastolic blood pressure values, heart rate, MAP, pulse pressure, and the entire registered pulse wave curve. If you want to interrupt the measurement use the Abort command. An Abort button appears automatically next to the PW button when starting a measurement, and the same command can be found under the Tools menu. Please note that this function only disrupts the data collection procedure of the software and does not affect the operation of the Device. To interrupt a measurement on the device the push button of the Medexpert Arteriograph must also be pressed once. If the Calculation of Ankle – Brachial Index was selected (See Section 5.4.1) a dialog window appears after the suprasystolic pulse wave recording phase is completed. Enter the formerly measured ankle systolic blood pressure here and press OK. The calculated value will appear under the blood pressure values in the Results field (see Section 3.2). If calculation of ABI is not needed or the ankle blood pressure could not be measured, press Cancel. Measurement of the ankle blood pressure is advised to be performed preceding the pulse wave recording. For measuring systolic blood pressure on the ankle, use of Doppler technique is suggested. However, if it is not available blood pressure measurement can also be performed on the ankle with Medexpert Arteriograph, using the simple blood pressure measurement function (see Section 4). In the latter case please use the appropriate cuff size (the same rules apply as for arm cuffs, see Section 4.1). After the measurement is completed the automatically calculated blood pressure and arterial function data appear in the Results field (see Section 3.2), while the recorded pulse wave curves are displayed in the Data window (see Section 3.2). Every examination is saved automatically. An already saved examination can be deleted by selecting the row, which contains its date and time in the Examinations list and then pressing the Delete button on the keyboard. 5.4.4 Quality control of the measurement Conditions (movement, arrhythmia, respiration, etc.) disturbing the measuring process may distort the shape of the recorded pulse wave, which may result in false hemodynamic parameter values. After the measurement is completed its quality should be checked to decide whether the result of the subsequent analysis can be accepted. 5.4.4.1
Quality control index: the SD PWVao SD PWVao (see Section 5.1) is the standard deviation of the PWVao values calculated from the pulse waves that could be analysed by the algorithm of the software. This variable shows how much the PWVao data of each analysed pulse curve differ, therefore reflects on the identity of the recorded pulse wave forms. Large deviation of the measured data shows some disturbance in the measurement. Normal SD If the SD PWVao is greater than or equal to 0 and less than or equal to 1.0 m/s, the measurement is considered to be of good quality. High SD If the SD PWVao (SD) is greater than 1.0 m/s, the measurement is considered to be of unacceptable quality and the results of the current analysis should be rejected. The SD appears in red colour in the Results field to warn the User on the quality problem. For advanced users the use of manual evaluation (see Section 5.4.5) can help to find a good quality sequence in the suprasystolic measurement phase. If manual evaluation is still not acceptable, the measurement should be repeated. No SD If the automatic analysis calculated arterial function data but no SD PWVao, then only one evaluable pulse curve could be found in the suprasystolic measurement sequence. The SD appears in red colour in the Results field to warn the User on the quality problem. The results of the analysis should be rejected and the measurement should be repeated. 5.4.4.2
Quality control by visual inspection Although the SD PWVao performs considerably well in detecting erroneous measurements, further visual inspection can help categorizing the type of the error. Consequently it can be avoided when repeating the measurement. By visual inspection disturbances can also be detected in measurements that were categorized to be of good quality by the SD PWVao parameter. Improper cuff size or tightness In this case no early and late systolic wave can be differentiated on the pulse wave form. Due to the larger cuff size or the looser fit, the cuff system loses its sensitivity to pick up higher frequency components of the oscillatory waves. This often leads to recording small amplitudes, which case is always indicated by the software with a warning message. How to recognize: no reflected component can be seen on the wave. How to avoid: use a smaller cuff or tighten the cuff according to the instructions (see Section 5.3). Arrhythmia The oscillatory measurement method is highly affected by arrhythmia. In such cases the beat‐to‐
beat variance of the pulse wave forms renders the analysis inaccurate. How to recognize: the heart beats do not show regularity. How to avoid: this condition cannot be affected by the examiner. Manual evaluation (see Section 5.4.5) can help to find a regular sequence in the suprasystolic measurement phase. Tremor or mechanical vibration Tremor introduces an unwanted high frequency noise into the measurement. This often leads to unrecognizable and not evaluable waveforms. How to recognize: the measurement is noisy, a sawtooth‐like signal is superimposed to the pulse waves. How to avoid: tremor cannot be affected by the examiner. Make sure, however that the patient is isolated from external mechanical vibration (e.g. do not place the patient’s arm onto a vibrating machine, like a PC). Movement artefacts Movement artefacts distort the waveforms and lead either to not analysable measurements or to results with inflated variation. How to recognize: the baseline of the recording undulates or some pulse waves noticeably differ from the others. How to avoid: emphatically ask the patient not to move. Manual evaluation (see Section 5.4.5) can help to find a regular sequence in the suprasystolic measurement phase. 5.4.5 How to analyse the data Select a patient and an examination thereof you intend to analyse. You have two evaluation options available: automatic and manual. The former is fast and convenient. Automatic evaluation will take place immediately after a patient’s examination is selected. The same can be achieved by clicking first on Automatic analysis S35 (for suprasystolic data) and then on button D (for diastolic data) after the results have been displayed. Most of the hemodynamic parameters described above (Section 5.1) will appear in the results window, under the list of examinations. During the automatic analysis the algorithm will analyse pulse waves of several heartbeats and calculate the mean of the results as well as the standard deviation of the PWVao (SD PWVao). However if there is only one evaluable pulse wave, no SD PWVao can be calculated. For manual evaluation you have to go to the end of the whole measurement sequence by using the horizontal scroll bar at the bottom of the graphic area. (The pulse wave curves recorded at the suprasystolic pressure step are located at the end of the measurement sequence.) You can use the mouse for selecting arbitrarily any (or several) pulse wave recorded at the diastolic and suprasystolic pressure steps. Curves can be selected even from those recorded in the blood pressure measuring phase, but only that were recorded above the measured systole or in a ±10 mmHg range of the measured diastole. To select a series of pulse waves (or a single one) highlight (hold down the left mouse button while moving the mouse) those from the beginning to the end of the sequence. Only pulses (i.e. heart cycles) that are highlighted in their entirety are included in the analysis (see the picture below). • When several pulse waves are selected for manual analysis the results are displayed in the same way as in a normal automatic analysis. •
In case a pulse wave of only a single heartbeat is highlighted – of either those that were registered at the suprasystolic or those registered at the diastolic pressure level – it will appear in a separate window displayed on the millimetre net. (Please note that in this case SD PWVao cannot be calculated.) The said separate window can have two kinds of content: o The one highlighted pulse wave at the suprasystolic pressure step is represented by a green curve. There are four markers shown on the curve, the meaning of those can be found below. o
When selecting only one pulse wave at the pressure step corresponding to the diastolic value several curves appear in the window: the original pulse wave (represented by a red curve), the systolic component (green) and the diastolic wave component (black). The curve shows two markers indicating – from left to right – the locations of the peak of the systolic wave and the start of the diastolic wave. With use of the tools in the separate window the single pulse wave can further be examined. The curve can be enlarged and reduced in size within pre‐set limits; see the relevant value of this in the upper left‐hand corner of the window. Furthermore, you can examine the curves from point to point by means of a cursor that can be activated. The window can be closed separately. Characteristic points of the pulse wave curve are marked in this window. Blank blue circles represent the first and reflected wave peaks and the ejection duration (Dicrotic notch), respectively. Filled red dot represents the calculated return time. The return time is calculated as the time difference between specific characteristic points of the curve, therefore it does not necessarily fall to a characteristic point itself. Note: Results of the evaluation are not saved automatically. For saving the results into the database the Save results… command should be used. This allows the examiner to save the results of only those measurements that are of good enough quality to be exported later. The findings of the evaluation can be saved into the database by selecting Save results… in the File menu or by clicking the Save results… button on the toolbar. Any previous result will be overwritten. This even allows saving results different from the ones calculated by the automatic evaluation. When an examination is opened it appears with the formerly saved arterial stiffness results. If no result is saved, the software displays the results of the automatic evaluation. However, in this latter case no values will be exported with the Export command (see Section 5.4.7). 5.4.5.1
Tools for visual inspection X axis step / Horizontal axis The scale of the horizontal, time axis of the pulse wave curve as displayed on the millimetre net can be set from 10 ms/cm to 1,600 ms/cm in the pre‐defined steps. This function can be accessed directly from the toolbar (X axis step) or by selecting a value under Horizontal axis in the View menu. Y axis compression / Vertical axis compression Here the vertical, amplitude axis of the pulse wave curve, as displayed on the millimetre net, can be set. The set value indicates the vertical compression rate of the curve. In case the set value is 1, the curve will be displayed in full size. This function can be accessed directly from the toolbar (Y axis step) or by selecting a value under Vertical axis compression in the View menu. Baseline shift The pulse wave curve on the millimetre net can be moved upwards or downwards relative to the zero line. The original position can be restored by clicking on the Reset button. View pressure curve To display the actual cuff pressure values, press the View pressure curve button on the toolbar. When it is on, the baseline cuff pressure can be seen during the whole measurement on the millimetre net. Cursor Use the Cursor function for reading the co‐ordinates of the oscillatory signal (pulse waves) and the value of the baseline cuff pressure (if the View pressure curve function is on). When the button is on the control tools appear. With use of these the cursor can be moved in small or big steps. Note: The Cursor feature is only available at the default X axis step of 200 ms/cm. Note: The oscillatory signals are not calibrated and therefore should not be considered to represent true pressure values. The above mentioned functions are illustrated in the picture below. 5.4.5.2
Oscillation amplitudes during blood pressure measurement By clicking on the Amps – pressure values tab of the measurement window the maximum amplitudes of the oscillations recorded during the blood pressure measuring phase appear. The same function can be accessed by selecting the Amps – pressure values option under View menu. By using this feature the quality of blood pressure measurement can be evaluated visually. 5.4.5.3
Vascular age assessment By clicking on the Vascular age assessment tab of the measurement window the estimated vascular age of the measured patient can be displayed. The same function can be accessed by selecting the Vascular age assessment command under View menu. This tab shows the Age – PWVao relationship with smoothed reference percentile curves. Note: Percentile is a value below which a certain percentage of the known measurements fall; e.g. the 75th percentile is the value below which 75% of the observations can be found. Age‐
specific percentile curves show certain percentiles in different ages. Note: The reference curves were derived from a healthy central ‐ European population including approx. 10 000 subjects. The current measurement is indicated with a coloured dot in the graph, with the colour depending on which range the measured PWVao value falls. The ranges are as follows: • Normal – green colour. The measured value is lower than or equal to the 50th percentile for that specific age group. • Elevated – yellow colour. The measured value is higher than the 50th percentile but lower than or equal to the 90th percentile for that specific age group. • High – red colour. The measured value is higher than the 90th percentile for that specific age group. 5.4.6 The measurement Report The Report is a printed summary of the measurement results. It includes patient details, all the calculated hemodynamic parameters, characteristic pressure curves and vascular age assessment. The following functions are only enabled if an examination of a patient has been selected. 5.4.6.1
Edit the Report To edit the Report, press the Edit report… button on the toolbar or select the Edit report command under the File menu. In the report window you can enter your medical advice / treatment suggestion, which can be saved by clicking on Save. The current date can be inserted to the report by using the Insert date button. The edited Report will appear on the third page of the print‐out. Note: The report is assigned to a specific examination, and can be modified later. For other measurements of the patient this medical advice will not be saved or displayed. To display institutional data on the printed Report, select Options under Tools. In the dialog box choose the Printed Report tab where you can specify the following: • Doctor’s identification data • Department details • Operator’s name Department details along with the doctor’s name and registration number will appear in the footer of the printed Report. These data are user specific and therefore will appear on the report of every patient of the user. The Operator’s name will appear in the Study data section of the printed report. It is measurement specific, therefore can be modified for each measurement. By default the Operator’s name is the login name of the User. The Operator’s name for the default user (ARTERIOGRAM) cannot be modified. 5.4.6.2
Print the Report You can print out a Report by choosing Print preview and print under the File menu or clicking the Print preview and print button on the toolbar. A Print options dialog window appears where printer selection and printer settings can be made and other common print options can be set. Click OK to continue. The print preview screen appears: With use of the toolbar on this screen the following functions can be accessed: Zoom tool The print preview page can be zoomed to fit the screen height (Zoom to fit), to fit the screen width (Zoom to width) and to the original size (100%). Navigation tool This tool can be used to navigate to the First page, Previous page, Next page or to the Last page of the medical report. Search tool With use of these tools a search can be performed by page number (Go to page) or by a keyword (Search for text). Copy tool The current page of the report can be copied to clipboard with this tool. Print tool A printer can be selected an set up with use of the first icon. The page can be printed with the previously determined settings by clicking on the second icon. Load / Save tool The Report can also be saved in a file by clicking on Save report. The destination directory and the name of the saved file can be selected in a pop‐up dialog window. The report can be saved as: • .qrp file: This procedure generates a QuickReport file (.qrp), which can be viewed only in the Medexpert SW. • .pdf file: This creates an Adobe Acrobat file, which can be opened without the use of the Medexpert SW. This feature is equivalent to the Send PDF Report function (see Section 5.4.6.3) The patient’s previously saved Reports can be selected and displayed by clicking on Load Report in the Print preview dialog box. Close The Print preview screen can be closed by using this button. The Report printed out by the Arteriograph Software will contain the following: Page 1: • Patient details. The data specified when entering the patient’s data are shown here including a user‐defined parameter and its value provided it is set (Section 5.4.1). The space for missing or undefined data will remain blank. • Risk profile. The previously entered risk profile (see Section 5.4.2.2) appears here. • Medication. The list of medications entered previously (see Section 5.4.2.2) appears here. • Measurement data. This part contains the date and time of the examination, the name of the operator, and the mandatory patient data. • Suprasystolic record. Peripheral and central hemodynamic parameters are listed here, excluding pulse wave velocity. The calculated Ankle‐Brachial Index (ABI) is also represented here, if this option was selected (see Section 5.4.1). A characteristic pulse wave is shown with the points of the Return Time (RTS35) and Dicrotic notch (Ejection Duration; ED) indicated on it. The return time does not necessarily fall to a characteristic point on the curve (see Section 5.4.5). • Diastolic record. This part contains the parameters resulting from the analysis of the pulse wave curves recorded at the diastolic pressure step. There are also two graphs showing a section of the pulse wave curves and a single curve (the last wave if several waves are selected for analysis). The DRA, SAI, and DAI parameters can be defined only if an ED value is available from the previous phase (Suprasystolic record). • Footer: - Institutional and operator data on the left‐hand side, if set (Section 5.4.6.1). - Manufacturer’s data complemented with the version number of the SW on the right‐
hand side. Page 2: • Suprasystolic record. The first part of this page contains the quality control of the measurement. A section of pulse wave curves recorded on the suprasystolic pressure step are shown in a graph to enable visual control over the quality of the waveforms. The value of SD PWVao is also represented here. • Pulse Wave Velocity measurement. This part highlights the measured aortic pulse wave velocity and return time values. • PWV – Arterial Age Assessment. The current measurement is placed in an age – PWVao graph with smoothed reference percentile curves (see Section 5.4.5.3). The point of the measurement is coloured according to the ranges in the graph legend. The estimated arterial age of the patient is also given here in decades except for pooling over the vascular age of 60. A more precise estimation of the patient’s arterial age can be seen on the SD PWVao parameter graph, which is a simplified visualization of the reference percentile values for the patient’s age. It shows the patient’s position relative to the reference population. The measured value is indicated in the graph, also showing the estimated arterial age at the top. Page 3 (optional): • Medical Report. Printed only if the Edit report function was used (see Section 5.4.6.1). This page includes only the patient details and the edited medical report. Note: The Report is always printed out in A4 size. It will contain only as much information as was entered previously or was calculated in the course of the analyses, which also means that a Report can be printed out with only the patient’s data appearing. Note: Cut‐off (critical) values for the different parameters can be found in the available scientific literature addressing vascular age and arterial function.
5.4.6.3
How to send a Report in PDF format You can convert the above detailed Report to PDF format by Send PDF Report under the File menu and simply e‐mail it. After the command is selected, the program converts the Report to PDF format automatically. The generated .pdf file can be saved to a selected destination with the following file name: Tcrep_fullname_date_time.pdf, where fullname is the name of the patient and date and time are the date and time of the examination in the pre‐set date and time format (e.g. TCrep_TestElisabeth_26032007_07_43.pdf). As a next step the default e‐mail client – if there is any – is loaded automatically with the generated .pdf file attached to a new letter. 5.4.7 Export the measurement data Formerly saved measurement results (see Section 5.4.5) can be exported into a formatted text file by choosing Export data under the Tools menu or clicking the Export data… button on the toolbar. Step 1 Select a User whose patients’ measurement you would like to export by clicking the checkbox next to it. The Select all option is a quick way to select all the listed users. All the registered users are listed in this window. Selection is confirmed by clicking on the arrow. Step 2 Select the patients whose measurements you would like to export by clicking on its row. All the patients belonging to the selected user are listed here in alphabetical order of the family name. In case there is a great number of patients, a particular patient can be found by using the built‐in search function. For a quick search click anywhere in the patient list and type in the initials of the family name of the given patient. The built‐in search is not case sensitive. Multiply selection can be done in the common Windows way (using Ctrl or Shift while clicking). The Select all option is a quick way to select all the listed subjects. Selection is confirmed by clicking on the arrow. Step 3 Step 4 Step 5 By setting a time range here, only those measurements that were performed in the specified range will be exported. By selecting Export all measurements, every measurement of the formerly selected patients will be exported. Click Export to start the process. The status of the export process is shown by a progress bar. In case of a large database the process can take several minutes. When the export is completed a message window will pop up confirming on the successful save. The save destination of the completed text file can be selected. The exported file is a tab delimited text file, which can easily be opened or imported in common spreadsheet applications (e.g. Microsoft Excel) or statistical packages (e.g. SPSS, SAS). Note: The exported text file contains each measurement in a different row. Several measurements for one patient are listed under each other. If the result were not saved for a given measurement the exported text file will only contain the patient characteristics and the blood pressure measurement data in that row. 5.4.8 Backup and restore the database To protect your measurements against accidental data loss, the database should regularly be backed up. For this use the Backup command under Tools menu. The Backup and restore dialog window appears, where you can set whether to make or to restore a database. The destination directory can also be selected. 5.4.8.1
Backup data In the Backup field select Create to start the backup process. Also select the destination directory for the backup file. In case there is a previously saved backup file in the selected database, a confirmation window pops up for overwriting the file. If you don’t want to overwrite it, press No and rename the previous backup file or choose another destination directory. If you approve overwriting, simply click on Yes. An information window appears if the backup is successfully completed. 5.4.8.2
Restore data In the Backup field select Restore to start the restoration process. Also select the destination directory for the backup file. A confirmation window pops up for approving the restoration. Simply press No to cancel the process. To start the restoration, click on Yes. An information window appears when the restoration is successfully completed. 5.4.8.3
Import previous database If you have a previous version of Arteriograph database on your computer the Convert previous database and import data command under Tools menu helps to convert the measurements into the new database format. Select the patient list (.pat) file in the Regisztratumok folder under the previous installation directory (by default: C:\TensioClinic\Regisztratumok) and click Open to start the import procedure. Note: Only a database in the original installation folder can be imported. Note: For a large database the conversion can take several minutes. The status of the procedure is shown by a progress bar. Successful conversion is confirmed by a pop‐up window. 6. Troubleshooting
Problem Possible causes Communication adapter is not connected No communication What to do Plug in the adapter and follow the instructions of Section 2.5. Go to Control Panel/Bluetooth The device is not recognized by the Devices and check whether the PC device is present. If not, follow the instructions of Section 5.2. No or low batteries in the device Replace the batteries. The device was turned off Turn on the device by pressing its button twice. Loose cuff Tighten the cuff. Arrhythmia The method cannot reliably assess arterial function parameters in arrhythmic patients. Tremor If possible, try to terminate tremor. No print preview No printer have been installed to the PC. Install a printer or use the built‐in virtual printer of Windows. The PDF report cannot be opened Adobe Reader is not installed to the PC. Download and install the latest version of Adobe Reader. Database import cannot be completed Not the proper database was opened or the database was damaged. Import the database by following the instructions of Section 5.4.8.3. Cannot send e‐mail successfully No e‐mail client is installed to the PC. Install an e‐mail client and set it to be the default one. No arterial function parameters are displayed Error messages Error codes, as shown on the LCD, and their explanation are specified below. It should be noted that errors can occur due to patient movement causing artefacts in the reading. In case the Device cannot measure blood pressure (e.g. due to motion), measuring will be disrupted. Example: The codes of the error flags indicated by the Device shall mean the following: 1 “measuring time exceeded” 3 “low battery” 31 “cuff missing” The Device could not measure the patient’s blood pressure within the pre‐set time. Measuring was disrupted because of low battery. The cuff is not connected to the Device. 32 “cuff clogged” 33 “air leakage” 34 “the cuff is not on the arm” 35 “measuring disrupted” 90‐99 “Device error” 100 “Faulty measuring result” 101 “motion” 102 “no pulse detected” 110 “Faulty measuring result” 111 112 113 “Faulty measuring result” 115 “Faulty measuring result” The rubber hose of the cuff is blocked or something is choking the hose. The cuff (or the Device) leaks. While connected to the Device, the cuff is not put on the patient. For some reason (e.g. the user presses the button) measuring is disrupted. Blood pressure measuring failed for some Device error or the battery is low. The calculated results cannot be considered as a real blood pressure value or the patient is having arrhythmia. The measuring conditions, e.g. the patient’s movement, interfere with the process of measuring. For some reason the Device does not detect the cardiac pulses. The signals are insufficient for blood pressure calculation. (Artefacts, arrhythmia.) The calculated results cannot be considered as a real blood pressure value. (The most likely reason is noisy measurement signals.) The pulse rate cannot be calculated or cannot be considered as a real value. 7. Technical Specification
Power supply: Four AA long‐life alkaline batteries or rechargeable batteries Protection against electric shock: Internal supply by batteries Grade of protection against electric shock: BF type on patient’s side Display: Liquid Crystal Display (LCD) Data storage: EEPROM Data transmission: Radio, Bluetooth PC Interface: Bluetooth Communication Adapter PC system requirements: Windows XP with Service Pack 2 or newer OS installed Ambient temperature: 10 – 40 °C Dimensions: 116 x 94 x 47mm Weight (incl. batteries): 250g Blood pressure measuring method: Oscillometric Sampling frequency: 200Hz Blood pressure measuring limits: 30 – 280mmHg Static accuracy: ± 3mmHg or ±2% of the measured value (Stability: 2 years) Measuring accuracy: Systolic: 91 (91%) out of 99 comparative checks fall within 5 mmHg, For 33 patients out of 33, 2 of 3 comparative checks fall within 5 mmHg, 0 of 33 patients did not have a value within 5 mmHg after 3 measurements. Diastolic: 97 (98%) out of 99 comparative checks fall within 5 mmHg, For 33 patients/33, 2 of 3 comparative checks within 5 mmHg, 0 of 33 patients did not have a value within 5 mmHg after 3 measurements. Average deviation from auscultatory measurements (Korotkov sounds): (systolic/diastolic): 0.4/‐0.3 mmHg Standard deviation (systolic/diastolic): 2.7/2.3 mmHg Pressure sensor: Piezo‐resistive Inflation: Automatic motor‐driven pump Safety: Maximum cuff pressure: 280mmHg Deflation: Automatic, stepwise 7.1 Electromagnetic compatibility Electromagnetic emissions The TL2 device is intended for use in the electromagnetic environment specified below. The customer or the user of the TL2 device should assure that it is used in such an environment. Compliance Electromagnetic environment ‐ guidance RF emissions CISPR 11 Emissions test Group 1 RF emissions CISPR 11 Harmonic emissions IEC 61000‐3‐2 Voltage fluctuations / flicker emissions IEC 61000‐3‐3 Class B The TL2 device uses RF energy only for its internal function. Therefore, its RF emissions are very low and are not likely to cause any interference in nearby electronic equipment. The TL2 device is suitable for use in all establishments, including domestic establishments and those directly connected to the public low‐voltage power supply network that supplies buildings used for domestic purposes. Not applicable Not applicable Electromagnetic immunity
The TL2 device is intended for use in the electromagnetic environment specified below The customer or the user of the TL2 device should assure that it is used in such an environment. Immunity test IEC 60601 test level Electrostatic discharge (ESD) IEC 61000‐4‐2 ± 6 kV contact ± 8 kV air Electrical fast transient/burst IEC 61000‐4‐4 Surge IEC 61000‐4‐5 Voltage dips, short interruptions and voltage variations on power supply input lines IEC 61000‐4‐11 ± 2 kV for power supply lines ± 1 kV for input/output lines ± 1 kV line(s) to line(s) ± 2 kV line(s) to earth <5% UT (>95% dip in UT) for 0,5 cycle 40% UT (60% dip in UT) for 5 cycles 70% UT (30% dip in UT) for 25 cycles <5% UT (>95% dip in UT) for 5 s 3 A/m Power frequency (50/60 Hz) magnetic field IEC 61000‐4‐8 ± 6 kV contact ± 8 kV air NOTE: UT is the AC mains voltage prior to application of the test level. Electromagnetic environment ‐ guidance Compliance level Not applicable Floors should be wood, concrete or ceramic tile. If floors are covered with synthetic material, the relative humidity should be at least 30 %. Not applicable Not applicable 3 A/m If image distortion occurs, it may be necessary to position the TL2 device further from sources of power frequency magnetic fields or to install magnetic shielding. The power frequency magnetic field should be measured in the intended installation location to assure that it is sufficiently low. Electromagnetic immunity The TL2 device is intended for use in the electromagnetic environment specified below. The customer or the user of the TL2 device should assure that it is used in such an environment. Immunity test IEC 60601 test level Conducted RF IEC 61000‐4‐6 3 Veff 150 kHz – 80 MHz 3 V/m 80 MHz – 2,5 GHz Radiated RF IEC 61000‐4‐3 Compliance level
Electromagnetic environment — guidance Portable and mobile RF communications equipment should be used no closer to any part of the TL2 device, including cables, than the recommended separation distance calculated from the equation applicable to the frequency of the transmitter. Recommended separation distance d=1,2√P d=1,2√P 80 MHz – 800 MHz d=2,3√P 800 MHz – 2,5 GHz where P is the maximum output power rating of the transmitter in watts (W) according to the transmitter manufacturer and d is the recommended separation distance in metres (m). Field strengths from fixed RF transmitters, as determined by an electromagnetic site a
survey, should be less than the compliance b level in each frequency range.
Interference may occur in the vicinity of equipment marked with the following symbol: 3 V 3 V/m NOTE 1 At 80 MHz and 800 MHz, the higher frequency range applies. NOTE 2 These guidelines do not apply in all situations. Electromagnetic propagation is affected by absorption and reflection from structures, objects and people. a
Field strengths from fixed transmitters, such as base stations for radio (cellular/cordless) telephones and land mobile radios, amateur radio, AM and FM radio broadcast and TV broadcast cannot be predicted theoretically with accuracy. To assess the electromagnetic environment due to fixed RF transmitters, an electromagnetic site survey should be considered. If the measured field strength in the location in which the TL2 device is used exceeds the applicable RF compliance level above, the TL2 device should be observed to verify normal operation. If abnormal performance is observed, additional measures may be necessary, such as re‐orienting or relocating the TL2 device. b
Over the frequency range 150 kHz to 80 MHz, field strengths should be less than 3 V/m. Recommended separation distances between portable and mobile RF communications equipment and the TL2 device The TL2 device is intended for use in an electromagnetic environment in which radiated RF disturbances are controlled. The customer or the user of the TL2 device can help prevent electromagnetic interference by maintaining a minimum distance between portable and mobile RF communications equipment (transmitters) and the TL2 device as recommended below, according to the maximum output power of the communications equipment. Rated maximum output power of transmitter W Separation distance according to frequency of transmitter m 150 kHz – 80 MHz 80 MHz – 800 MHz 800 MHz – 2,5 GHz d=[3,5/3]√P d=[3,5/3]√P d=[7/3]√P 0,01 0,12 0,12 0,23 0,1 0,38 0,38 0,73 1 1,2 1,2 2,3 10 3,8 3,8 7,3 100 12 12 23 For transmitters rated at a maximum output power not listed above, the recommended separation distance d in metres (m) can be estimated using the equation applicable to the frequency of the transmitter, where P is the maximum output power rating of the transmitter in watts (W) according to the transmitter manufacturer. NOTE 1 At 80 MHz and 800 MHz, the separation distance for the higher frequency range applies. NOTE 2 These guidelines may not apply in all situations. Electromagnetic propagation is affected by absorption and reflection from structures, objects and people. Notes
Notes
Notes