1
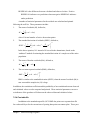
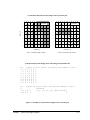
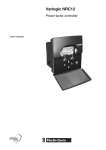
DPRGXODUGPXOWLVSHFLHVWUDQVSRUWVLPXODWRU 8VHU¶V*XLGH %\&KXQPLDR=KHQJ LQDVVRFLDWLRQZLWK 663DSDGRSXORV$VVRFLDWHV,QF 7$%/(2)&217(176 1 Introduction 2 System Requirements and Installation 2.1 Executable Programs and System Requirements ...................................................................... 2-1 2.2 Installation and Setup .................................................................................................................. 2-1 3 Enhanced Basic Transport Package 3.1 Automatic Restart Option............................................................................................................ 3-1 3.2 Cell-by-Cell Mass ......................................................................................................................... 3-3 4 Enhanced Reaction Package 4.1 Monod Kinetics............................................................................................................................. 4-1 4.2 Instantaneous Aerobic and Anaerobic Biodegradation ............................................................ 4-2 4.3 First-Order Parent-Daughter Chain Reactions ......................................................................... 4-5 5 Input Instructions 5.1 Basic Transport Package ............................................................................................................. 5-1 5.2 Reaction Package.......................................................................................................................... 5-2 5.3 A Note on the GCG Solver Package............................................................................................ 5-5 6 New Benchmark Problems 6.1 Monod Kinetics............................................................................................................................. 6-1 6.2 Instantaneous Aerobic Biodegradation ...................................................................................... 6-2 6.3 First-order Parent-Daughter Chain Reactions .......................................................................... 6-4 7 Post-Processing Programs 7.1 PostMT3D|MODFLOW (PM)..................................................................................................... 7-1 7.2 Head|ConcentrationCOMPARE (HCCOMP) ........................................................................... 7-1 7.3 Flow|MassBUDGET (FMBUDGET) .......................................................................................... 7-9 References Attachment MT3DMS Documentation and User’s Guide i ,QWURGXFWLRQ MT3D99 is a new version of the modular three-dimensional contaminant transport model, MT3D96, distributed by S.S. Papadopulos & Associates, Inc. since 1996. MT3D99 builds on the strengths of the new public-domain MT3DMS code (Zheng and Wang, 1998), and includes significant new enhancements to expand the functionality of the MT3D96 and MT3DMS codes. The key features of MT3D99 include: • Implicit Solver The iterative solver is based on generalized conjugate gradient methods with the highly efficient Lanczos/ORTHOMIN acceleration scheme and enables the user to solve a wide array of problems using much less computer time. • TVD Solution Scheme MT3D99 combines three major classes of transport solution techniques in a single code, namely, the standard finite-difference method; the particle tracking based EulerianLagrangian methods; and the third-order finite-volume TVD (total-variation-diminishing) method. The new TVD method for solving the advection term is mass conservative and minimizes numerical dispersion and artificial oscillation. • Dual-Porosity Option The optional dual-porosity (dual-domain) advection-diffusion mass transfer model provides a more effective approach than the standard single-porosity advection-dispersion model for simulating solute transport in fractured media or extremely heterogeneous porous media. • Nonequilibrium Sorption and Monod Kinetics The nonequilibrium sorption model enables the user to examine the role of sorption in solute transport and remediation processes without the restrictive local-equilibrium assumption. In addition to the first-order kinetics, MT3D99 supports zero-order and mixed-order Monod kinetic reactions. Chapter 1 Introduction 1-1 • Multispecies Reactions MT3D99 includes an enhanced reaction package to handle BIOPLUME-type aerobic and anaerobic reactions between hydrocarbon contaminants and any user-specified electron acceptors, and parent-daughter chain reactions for inorganic or organic compounds. This enables MT3D99 to analyze natural attenuation and bioremediation without using a thirdparty add-on reaction package. The multispecies reactions are fully integrated with the MT3D99 transport solution schemes, including the implicit solver. • Automatic Restart Option MT3D99 supports a new automatic restart option to greatly facilitate the continuation run from a previous simulation. • Complete Mass Budgets MT3D99 computes and saves cell-by-cell mass budgets. This enables the user to compile a detailed mass budget for any subregion of the model grid. • Postprocessing Programs MT3D99 includes several useful and flexible postprocessing programs: PostMT3D|MODFLOW for creating 2D or 3D data files for any graphic and visualization software package including Surfer© and Tecplot©; HCComp for computing residuals and summary statistics between observed and model-calculated heads and concentrations; and Flow|MassBUDGET for calculating detailed groundwater flow and solute mass budgets in any user-specified subregion of the model grid. Note that this manual is only intended to serve as a supplement to the MT3DMS Documentation and User’s Guide (Zheng and Wang, 1998) to provide information specific to the new features implemented in MT3D99. For details on the theoretical, numerical and application aspects of MT3DMS, refer to Zheng and Wang (1998), which is included as an attachment of this report. Chapter 1 Introduction 1-2 6\VWHP5HTXLUHPHQWV DQG,QVWDOODWLRQ 2.1 EXECUTABLE PROGRAMS AND SYSTEM REQUIREMENTS The executable programs were compiled with the Lahey LF90 FORTRAN 90 compiler Version 4.0 to run on PCs with a 80486 or higher CPU in 32-bit protected mode using extended memory. The compiled programs use the dynamic array allocation feature of FORTRAN 90 and will allocate the exact amount of memory that is required for a particular problem at run-time. If the memory required by the problem exceeds the total amount of physical memory that is available, a message “NOT ENOUGH MEMORY” will be printed and the execution aborted. The executable programs run under Microsoft DOS or Windows v3.x/95/NT in the DOS compatibility box. 2.2 INSTALLATION AND SETUP To install for the first time, create a subdirectory on the hard drive with a name such as MT3D99 and then copy all the files in the \Bin subdirectory of the distribution CD-ROM to the new subdirectory. Make sure to modify the AUTOEXEC.BAT file to place the MT3D99 subdirectory on the PATH statement. File LF90.EER contains the Lahey compiler's run-time error messages. When a run-time error occurs, the executable program will first search the current working directory and then all directories specified in the PATH statement to locate file LF90.EER before it can print out the error message. For more information, refer to the README.DOC files included with the distribution CD-ROM. Chapter 2 System Requirements and Installation 2-1 (QKDQFHG%DVLF 7UDQVSRUW3DFNDJH 3.1 AUTOMATIC RESTART OPTION In the previous versions of MT3D including MT3DMS, the procedure to restart a previous simulation run is not straightforward, particularly if a transient flow field is involved. A new option has been added to MT3D99 to make it much easier to restart a previous run. The new restart option involves two changes in the Basic Transport (BTN) Package. First, MT3D99 saves all the information needed for a restart run, including time counters, global mass budgets and concentrations of all species in a default binary file named MT3D.RES. MT3D99 updates this file at the same user-specified frequency as it writes to the unformatted concentration files. Next, to restart a run, activate the restart option by setting the 10th element of the transport option array, i.e., TRNOP(10), to T (True) in the BTN input file (see Figure 3.1). MT3D99 will then prompt the user for the name of the restart file, or the MT3D.RES file saved in the previous run. Once the restart file is read in, MT3D99 starts the new simulation using the concentrations saved in the restart file as the initial condition, and automatically resets the time counters and global mass budgets to continue from the time recorded in the restart file. If the flow field is transient, MT3D99 automatically skips those time steps of the flow solution that are prior to the restart time. Thus, there is no need to modify the flow model input files. Similarly, if there are multiple stress periods of sinks/sources defined for the transport simulation, MT3D99 will automatically read and discard the input data for those stress periods that are prior to the restart time. Note that if it is desirable to save the restart file from a previous run, it should be copied and renamed because each time MT3D99 is run, the default restart information file (MT3D.RES) will be overwritten. Chapter 3 Enhanced Basic Package 3-1 (RE S) Res ta rt O p Res e Add rved f or -on Pac ka 2 tion ges (DS P) Sin k an Mix d ing Sourc e (SS M) Che (RC mical R T) eac tion Gen Gra eralize d dien t (G Conju gate CG ) Dis pers ion on ( AD V) Ad v ecti 1 TRNOP Element Number 3 4 5 6 7 8 9 10 Sample TRNOP Input Record TRNOP T T T F T F F F F T Element Number 1 2 3 4 5 6 7 8 9 10 Note: 1. 2. 3. 4. 5. 6-9. 10 The Advection Option is used; an input file is needed for the Advection (ADV) Package; The Dispersion Option is used; an input file is needed for the Dispersion (DSP) Package; The Sink & Source Option is used; an input file is needed for the Sink & Source Mixing (SSM) Package; The Chemical Reaction Option is not used; an input file is not needed for the Chemical Reaction (RCT) Package; The Generalized Conjugate Gradient Solver is used; an input file is needed for the Generalized Conjugate Gradient (GCG) Package; Reserved for future add-on packages; The Restart Option newly implemented in MT3D99 is used. Figure 3.1 Specification of the transport components, solver and restart option to be included using the logical TRNOP array. The TRNOP array is entered in the input file to the Basic Transport Package. Chapter 3 Enhanced Basic Package 3-2 3.2 CELL-BY-CELL MASS The cell-by-cell mass output option, first introduced in MT3D96, is maintained in MT3D99. A utility program, FMBudget, has been added and included with MT3D99 to postprocess this file (see Chapter 7). The content and structure of the unformatted cell-by-cell mass file, one for each species, are shown below: MT3Dnnn.CCM (unformatted): For each transport step saved: Record 1: KPER,TIME2,TEXT1,NCOL,NROW,NLAY Record 2: (((DMASS(J, I, K), J=1,NCOL), I=1,NROW), K=1,NLAY) If sorption or dual-domain mass transfer is simulated: Record 1: KPER,TIME2,TEXT2,NCOL,NROW,NLAY Record 2: (((SMASS(J, I, K), J=1,NCOL), I=1,NROW), K=1,NLAY) where KPER is the stress period at which the mass is saved; TIME2 is the total elapsed time at which the mass is saved; TEXT1 is a character string (character*16) set equal to “SOLUTE MASS”; TEXT2 is a character string (character*16) set equal to “SORBED MASS”; NCOL is the total number of columns; NROW is the total number of rows; NLAY is the total number of layers; DMASS is the calculated solute mass in each cell, unit M; SMASS is the calculated sorbed (immobile) mass in each cell, unit M. The CCM file is saved by setting the SAVCCM option to T (True) in the BTN input file. The frequency of output to this file is the same as that to the unformatted concentration file (MT3Dnnn.UCN). Chapter 3 Enhanced Basic Package 3-3 (QKDQFHG5HDFWLRQ 3DFNDJH 4.1 MONOD KINETICS In MT3DMS, only first-order kinetics is included for modeling radioactive decay or biodegradation. Showing only the dissolved phase, the first-order kinetics is expressed as, ∂C = L(C ) − λC ∂t (4.1) where L(C) represents the operator for all non-reaction terms including advection, dispersion, fluid sinks/sources; and λ is the first-order rate coefficient (T-1). A more general approach for modeling biodegradation is Monod kinetics (Monod, 1949), u = u max C Ks + C (4.2) where u is the specific growth rate of the bacterium, T-1; u max is the maximum specific growth rate, T-1; C represents the substrate concentration, ML-3; and K s is a constant that represents the substrate concentration at which the rate of growth is half the maximum rate, ML-3 (Alexander, 1994). The Monod kinetics approaches a first-order or zero-order reaction, depending on the value of the half-saturation constant K s relative to the concentrations in the aquifer. If K s >> C , equation (4.2) can be simplified as, u ≈ u max C Ks Chapter 4 Enhanced Reaction Package (4.3) 4-1 which is equivalent to the first-order kinetics with the first-order rate coefficient of umax K s . If K s << C , equation (4.2) becomes a zero-order kinetics, i.e., u ≈ umax (4.4) Relating the Monod growth function to the decrease of an organic compound, the change in the substrate concentration can be written as follows (Rifai et al., 1997), ∂C C = L(C ) − M t u max ∂t Ks + C (4.5) where M t is the total microbial concentration, ML-3. The total microbial concentration is difficult to estimate, and dependent on availability of many chemical and biological factors. In MT3D99, M t , u max , and K s are implemented as input parameters and are assumed to be constant over time. In addition, the Monod kinetics is implemented only for the dissolved phase of an organic compound. Both explicit and implicit formulations are used for numerical solution. 4.2 INSTANTANEOUS AEROBIC AND ANAEROBIC BIODEGRADATION Following the approach of Borden and Bedient (1986) and Rifai et al. (1989 and 1997), an instantaneous reaction model is implemented in MT3D99 to simulate the biodegradation of common hydrocarbon contaminants, including benzene, touluene, ethylbenzene, and xylene (BTEX). The general expression for this type of instantaneous reactions can be written as: C 1 (t + 1) = C 1 (t ) − C 2 (t ) F12 − C 3 (t ) F13 L − C k (t ) F1n C 2 (t + 1) = C 2 (t ) − C 1 (t )⋅ F12 C 3 (t + 1) = C 3 (t ) − C 1 (t )⋅ F13 (4.6) ... C k (t + 1) = C k (t ) − C 1 (t )⋅ F1k where C 1 is the concentration of the base species 1 which reacts sequentially with one or more species represented by concentrations C 2 through C k ; and F1k is the stoichiometric Chapter 4 Enhanced Reaction Package 4-2 ratio for the reaction between species 1 and k, i.e., one mass unit of the base species reacts with F1k mass units of species k. The instantaneous reaction model of equation (4.6) is implemented in MT3D99 sequentially in an explicit formulation, i.e., the base species 1 first reacts with species 2, C 1 (t + 1) = C 1 (t ) − C 2 (t ) F12 C 2 (t + 1) = C 2 (t ) − C 1 (t )⋅ F12 (4.7a) subject to constraints: C 1 (t + 1) = 0 C 2 (t + 1) = 0 if C 2 (t ) > C 1 (t )⋅ F12 if C 1 (t ) > C 2 (t ) F12 (4.7b) If the base species 1 is completely consumed by species 2, then all subsequent reactions involving species 3, 4, …, k are terminated. Otherwise, what is left of the base species reacts with species 3, i.e., C 1* (t + 1) = C 1* (t ) − C 3 (t ) F13 C 3 (t + 1) = C 3 (t ) − C 1* (t )⋅ F13 (4.8a) subject to constraints: C 1* (t + 1) = 0 C 3 (t + 1) = 0 if C 3 (t ) > C 1* (t )⋅ F13 if C 1* (t ) > C 3 (t ) F13 (4.8b) where C 1* is the modified concentration of the base species due to the previous reaction with species 2. The procedure is repeated until either the base species is completely depleted or no more reactants are left. The reaction model as defined in equation (4.6) can be used to approximate the reactions between BETX (electron donors) and various electron acceptors such as oxygen, nitrate, manganese, ferric iron, sulfate, and carbon dioxide. For example, the general formulation of (4.6) can be replaced by the following equations to model aerobic biodegradation of hydrocarbon: H (t + 1) = H (t ) − O(t ) FHO O(t + 1) = O(t ) − H (t )⋅ FHO Chapter 4 Enhanced Reaction Package (4.9) 4-3 where H and O are concentrations of hydrocarbon and oxygen, respectively; FHO is the stoichiometric ratio for the reaction between hydrocarbon and oxygen. FHO is approximately equal to 3.1, i.e., one gram of hydrocarbon reacts with 3.1 grams of oxygen (see Table 4.1). For a six-species system involving hydrocarbon, oxygen, nitrate, ferric iron, sulfate, and carbon dioxide, as considered in the Bioplume III code (Rifai et al., 1997), the general formulation of (4.6) can be replaced by: H (t + 1) = H (t ) − O (t ) FHO − N (t ) FHN − Fe(t ) FHFe − S (t ) FHS − C (t ) FHC O (t + 1) = O (t ) − H (t )⋅ FHO N (t + 1) = N (t ) − H (t )⋅ FHN (4.10) Fe(t + 1) = Fe(t ) − H (t )⋅ FHFe S (t + 1) = S (t ) − H (t )⋅ FHS C (t + 1) = C (t ) − H (t )⋅ FHC where N, Fe, S, and C are concentrations of nitrate, ferric iron, sulfate, and carbon dioxide, respectively, and FHN , FHFe , FHS , and FHN are stoichiometric ratios for reactions between hydrocarbon and electron acceptors, i.e., nitrate, ferric iron, sulfate, and carbon dioxide, respectively (see Table 4.1). While it is conceptually simple and computationally straightforward, the instantaneous reaction model represents a great simplification of complex, biologically mediated reactions occurring in natural systems. Therefore, this type of modeling approach should be considered as a screening-level approximation. Table 4.1 Stoichiometric ratios for reactions between BTEX and common electron acceptors (after Rifai et al., 1997). Average1 Average2 3.17 3.14 3.15 4.91 4.91 4.86 4.88 10.75 10.89 10.89 10.78 10.82 21.48 21.85 22.13 22.13 21.90 22.20 Sulfate 4.62 4.70 4.76 4.76 4.71 4.73 Carbon Dioxide 2.12 2.15 2.18 2.18 2.17 2.17 B T E X Oxygen 3.08 3.13 3.17 Nitrate 4.77 4.85 Manganese 10.57 Iron Note: Average1=arithmetic average; Average2=mass weighted average Chapter 4 Enhanced Reaction Package 4-4 4.3 FIRST-ORDER PARENT-DAUGHTER CHAIN REACTIONS MT3D99 incorporates a first-order parent-daughter chain reactions as follows, showing only the dissolved phase: ∂C 1 = L(C 1 ) − λ1C 1 ∂t ∂C 2 = L(C 2 ) − λ2 C 2 + Y1 / 2 λ1C 1 ∂t ... (4.11) ∂C k = L(C k ) − λk C k + Yk −1 / k λk −1C k −1 ∂t where L(C) represents the operator for the non-reaction terms including advection, dispersion, fluid sinks/sources; λk is the first-order reaction coefficient for species k and Yk −1 / k the yield coefficient between species k-1 and k, which can be computed from the stoichiometric relationship between the two species. The first-order sequential kinetic reaction model as defined in equation (4.11) can be used to model radioactive chain reaction and biodegradation of chlorinated solvents. For example, the transformation of perchloroethene (PCE) → trichloroethene (TCE) → dichloroethene (DCE) → vinyl chloride (VC) may be expressed as, ∂C PCE = L(C PCE ) − λPCE C PCE ∂t ∂C TCE = L(C TCE ) − λTCE C TCE + YPCE / TCE λPCE C PCE ∂t ∂C DCE = L(C DCE ) − λDCE C DCE + YTCE / DCE λTCE C TCE ∂t ∂C VC = L(C VC ) − λVC C VC + YDCE /VC λDCE C DCE ∂t (4.12) where C PCE is the concentration for PCE; λPCE is the first-order reaction coefficient for PCE and YPCE / TCE is the yield coefficient for transformation from PCE to TCE. The same conventions are used for species TCE, DCE, and VC. Based on laboratory and field-scale results, Wiedemeier et al. (1997) present representative first-order biodegradation rates for chlorinated solvents ranging from 0.00068 Chapter 4 Enhanced Reaction Package 4-5 to 0.54 day-1 for PCE, 0.0001 to 0.021 day-1 for TCE, 0.00016 to 0.026 day-1 for DCE and 0.0003 to 0.012 day-1 for VC. Clement (1997) lists the yield coefficients YPCE / TCE =0.79, YTCE / DCE =0.74, and YDCE / VC =0.64. The first-order sequential kinetic reaction is implemented in MT3D99 for both dissolved and sorbed phases using either explicit and implicit schemes. For explicit schemes, a stability criterion associated with each reaction is calculated and the maximum transport stepsize allowed is determined. For implicit schemes, the iterative solver is used to solve the reaction terms with no stepsize limitation. Chapter 4 Enhanced Reaction Package 4-6 ,QSXW,QVWUXFWLRQV 5.1 BASIC TRANSPORT PACKAGE This section describes the changes in the input instructions for the enhanced basic transport package. Note that the enhanced basic transport package is backward compatible with the original BTN package as implemented in MT3D96 and MT3DMS. Thus, the BTN input file prepared for other versions of MT3D can also be read and used directly by MT3D99. Also note that the bold typeface indicates the new features implemented in MT3D99, while the underlined are the new features first introduced in MT3DMS. A5 Record: TRNOP(10) (ADV DSP SSM RCT GCG XXX XXX XXX XXX RES) Format: 10L2 • TRNOP are logical flags for major transport and solution options. TRNOP(1) to (5) corresponds to Advection, Dispersion, Sink & Source Mixing, Chemical Reaction, and Generalized Conjugate Gradient Solver packages, respectively. TRNOP(10) is the flag for the restart option. If any of these options is used, enter its corresponding TRNOP element as T, otherwise as F. TRNOP(6) to (9) are reserved for add-on packages. A15 Record: IFMTCN, IFMTNP, IFMTRF, IFMTDP, SAVUCN, SAVCCM Format: 4I10, 2L10 • SAVCCM is a logical flag indicating whether the cell-by-cell mass for both dissolved and sorbed (immobile) phases should be saved in a default unformatted (binary) file named MT3Dnnn.CCM, where nnn is the species index number. SAVCCM=T, the cell-by-cell mass of each species will be saved in the default file MT3Dnnn.CCM. SAVCCM=F, the cell-by-cell mass is not saved. Chapter 5 Input Instructions 5-1 5.2 REACTION PACKAGE This section describes input instructions for the enhanced chemical reaction package implemented in MT3D99. Note that the enhanced reaction package is backward compatible with the original chemical reaction package as implemented in MT3D96 and MT3DMS. Thus, the reaction input file prepared for MT3D96 and MT3DMS can also be read and used directly by MT3D99. Note that the bold typeface indicates the new features implemented in MT3D99, while the underlined are the new features first introduced in MT3DMS. FOR EACH SIMULATION: E1 Record: ISOTHM, IREACT, IRCTOP, IGETSC Format: 4I10 • ISOTHM is a flag indicating which type of sorption (or dual-domain mass transfer) is simulated: ISOTHM =0, no sorption is simulated; =1, Linear isotherm (equilibrium-controlled); =2, Freundlich isotherm (equilibrium-controlled); =3, Langmuir isotherm (equilibrium-controlled); =4, First-order kinetic sorption (nonequilibrium); =5, First-order kinetic dual-domain mass transfer. • IREACT is a flag indicating which type of kinetic reaction is simulated: IREACT =0, no kinetic reaction is simulated; =1, first-order irreversible reaction; =2, Monod kinetics; =3, first-order parent-daughter chain reactions; and =-1, instantaneous reaction among species. • IRCTOP is an integer flag indicating how reaction variables are entered: IRCTOP ≥2, all reaction variables are specified as 3D arrays on a cellby-cell basis. <2, all reaction variables are specified as a 1D array with each value in the array corresponding to a single layer. This option is mainly for retaining compatibility with the previous versions of MT3D. Chapter 5 Input Instructions 5-2 • IGETSC is an integer flag indicating whether the initial concentration for the sorbed or immobile phase of all species should be read when nonequilibrium sorption (ISOTHM=4), dual-porosity mass transfer (ISOTHM=5) is simulated. IGETSC=0, the initial concentration for the sorbed or immobile phase is not read (default); it is assumed to be in equilibrium with the dissolved concentration (ISOTHM=4), or zero (for ISOTHM=5). >0 the initial concentration for the sorbed or immobile phase of all species will be read. (Enter E2 if ISOTHM>0) E2 Array: RHOB(NCOL,NROW) (one array for each layer) Reader: RARRAY • RHOB is the bulk density of the aquifer medium (unit: ML-3) if ISOTHM=1, 2, 3, and 4. RHOB is interpreted as the “immobile” porosity, i.e., the ratio of disconnected pore spaces filled with immobile fluids over the bulk volume of the aquifer medium, if the simulation is intended to represent a dual-domain system, i.e., if ISOTHM=5. (Enter E2A for each species if IGETSC>0) E2A Array: SRCONC(NCOL,NROW) (one array for each layer) Reader: RARRAY • SRCONC is the user-specified initial concentration for the sorbed or immobile phase. For ISOTHM=1, 2, 3, or 4, SRCONC is the initial concentration for the sorbed phase of a particular species (unit: MM-1); For ISOTHM=5, SRCONC is the initial concentration for the immobile phase if (unit: ML-3). (Enter E3 for each species if ISOTHM>0) E3 Array: SP1(NCOL,NROW) (one array for each layer) Reader: RARRAY • SP1 is the first sorption parameter. The use of SP1 depends on the type of sorption selected (i.e., the value of ISOTHM). Chapter 5 Input Instructions 5-3 For linear (ISOTHM=1) and nonequilibrium sorption (ISOTHM=4), SP1 is the distribution coefficient (Kd) (unit: L3M-1). For Freundlich sorption (ISOTHM=2), SP1 is the Freundlich sorption equilibrium constant (Kf) (unit depends on the Freundlich exponent a). For Langmuir sorption (ISOTHM=3), SP1 is the Langmuir sorption equilibrium constant (Kl) (unit: L3M-1 ). For dual-domain mass transfer (ISOTHM=5), SP1 is not used, but still must be specified. (Enter E4 for each species if ISOTHM>0) E4 Array: SP2(NCOL,NROW) (one array for each layer) Reader: RARRAY • SP2 is the second sorption parameter. The use of SP2 depends on the type of sorption selected (i.e., the value of ISOTHM). For linear sorption (ISOTHM=1), SP2 is not used, but still must be specified. For Freundlich sorption (ISOTHM=2), SP2 is the Freundlich exponent (a). For Langmuir sorption (ISOTHM=3), SP2 is the total concentration of the sorption sites available ( S ) (unit: MM-1). For nonequilibrium sorption or dual-domain mass transfer (ISOTHM=4 or 5), SP2 is the first-order kinetic mass transfer coefficient (unit: T-1). (Enter E5 for each species if IREACT>0) E5 Array: RC1(NCOL, NROW) (one array for each layer) Reader: RARRAY • RC1 is the first kinetic reaction parameter. The use of RC1 depends on the type of kinetic reaction selected (i.e., the value of IREACT): For IREACT=1, RC1 is the first-order rate coefficient for the dissolved (or mobile) phase (unit: T-1); For IREACT=2 (Monod kinetics), RC1 is the product of total microbial concentration, M t (unit: ML-3) and the maximum specific growth rate of the bacterium, µ max (unit: T-1). Chapter 5 Input Instructions 5-4 (Enter E6 for each species if IREACT>0) E6 Array: RC2(NCOL, NROW) (one array for each layer) Reader: RARRAY • RC2 is the second kinetic reaction parameter. The use of RC2 depends on the type of kinetic reaction selected (i.e., the value of IREACT): For IREACT=1, RC2 is the first-order rate coefficient for the sorbed (or immobile) phase (unit: T-1). For IREACT=2 (Monod kinetics), RC2 is the half-saturation constant, K s (unit: ML-3). (Enter E7 if IREACT=-1 or 3) E7 Array: STOICH(NCOMP-1) (one array for all species) Format: RARRAY • STOICH is the stoichiometric ratio or yield coefficient (dimensionless) for multispecies reactions. For IREACT= -1 (instantaneous reactions), the first value in the array is for the reaction between species 1 and species 2; the second value for the reaction between species 1 and species 3; and so on. For IREACT=3 (first-order chain reactions), the first value in the array is for the reaction between species 1 and species 2; the second value for the reaction between species 2 and species 3; and so on. 5.3 A NOTE ON THE GCG SOLVER PACKAGE If the GCG solver package is used for implicit solution of the Monod kinetics or the first-order chain reactions, the maximum number of the outer iterations (MXITER) in the input file to the GCG package should be set to greater than one. This is because these reactions involve nonlinear terms that need to be updated during iterations. Chapter 5 Input Instructions 5-5 1HZ%HQFKPDUN 3UREOHPV 6.1 MONOD KINETICS The example problem considered in this section is similar to that described in Section 7.1 of the MT3DMS manual. It involves one-dimensional transport from a constant source in a uniform flow field. The model grid consists of 101 columns, 1 row and 1 layer and the model parameters used in the simulation are listed below: Cell width along rows (∆x ) Cell width along columns Layer thickness (∆z) = 10 m (∆y ) = 1 m =1m Longitudinal dispersivity (α L ) = 10 m Groundwater seepage velocity Porosity (θ)= 0.25 Simulation time (t ) (v ) = 0.24 m/day = 2000 days In the flow model, the first and last columns are constant-head boundaries. Arbitrary head values are used to establish the required uniform hydraulic gradient. In the transport model, the first column is a constant-concentration boundary with a concentration value of 1.0 mg/L. The last column is sufficiently far away from the source to approximate a semiinfinite one-dimensional flow domain. Three simulations are run using different parameters for the Monod kinetics as follows: Case 1: M t µ max = 2 mg/L d-1, K s = 1000 mg/L; Case 2: M t µ max = 2 × 10 −3 mg/L d-1 , K s = 1 mg/L; and Case 3: M t µ max = 2 × 10 −3 mg/L d-1, K s = 0.001 mg/L. Note that these reaction parameters are intended for demonstration purposes only and have no Chapter 6 New Benchmark Problems 6-1 particular physical relevance. For Case 1, the Monod kinetics should approach a first-order reaction since K s is three orders greater than the maximum concentration in the aquifer. Indeed, the calculated concentration profile with the Monod kinetics is nearly identical to the analytical solution for the same transport problem but assuming a first-order reaction with the rate coefficient λ = M t µ max K s = 2 × 10 −3 day-1. Case 2, with K s in the same order as the aquifer concentrations, shows the mixed-order characteristics of the Monod kinetics. In Case 3, the Monod kinetics approaches a zero-order reaction, i.e., ∂C ∂t = - M t µ max , since K s is negligible compared to the concentrations in the aquifer. 1 First-order (analytical) Monod (Case 1) 0.8 Monod (Case 2) Monod (Case 3) C/Co 0.6 0.4 0.2 0 0 100 200 300 400 500 Distance (m) Figure 6.1. Calculated concentrations for one-dimensional transport from a constant source in a uniform flow field. The solid line indicates the analytical solution assuming first-order kinetics while the symbols represent the numerical solutions assuming Monod kinetics with different coefficients. Chapter 6 New Benchmark Problems 6-2 6.2 INSTANTANEOUS AEROBIC BIODEGRADATION The example problem considered in this section is similar to that described in Section 7.3 of the MT3DMS manual involving two-dimensional transport from a continuous point source in a uniform flow field. The model grid consists of 46 columns, 31 rows and 1 layer and is aligned with the flow direction along the x axis (see Figure 6.2). The flow model is surrounded by constant-head boundaries on the east and west borders and no-flow boundaries on the north and south borders. The head values at the constant-head boundaries are arbitrarily chosen to establish the required hydraulic gradient. One injection well is located at column 11 and row 16. The injection rate is sufficiently small so that the flow field remains approximately uniform. The model parameters used in the simulation are listed below: Cell width along rows (∆x ) Cell width along columns Layer thickness (∆z) = 10 m (∆y ) = 10 m = 10 m Groundwater seepage velocity (v ) = 1/3 m/day Porosity (θ) = 0.3 Longitudinal dispersivity = 10 m Ratio of transverse to longitudinal dispersivity = 0.3 Volumetric injection rate = 1 m3/day Simulation time (t ) = 730 days (2 years) Assume that the injected water contains hydrocarbon (species 1) with a constant concentration of 1000 ppm. Further assume that the background concentration of oxygen (species 2) in the aquifer is 9 ppm. The background oxygen concentration is modeled by setting the initial concentration of species 2 to 9 ppm in all model cells and by assigning 9 ppm to the species 2 concentration of the inflow from the constant-head boundary. Hydrocarbon and oxygen are assumed to react instantaneously; the stoichiometric ratio for the reaction is approximately 3.0. The calculated concentrations for hydrocarbon and oxygen at the end of the two-year simulation period are shown in Figure 6.2. The maximum concentration of hydrocarbon is approximately 50 ppm at the injection point (Figure 6.2a). The oxygen plume is depleted Chapter 6 New Benchmark Problems 6-3 where the concentration of hydrocarbon is above zero (Figure 6.2b). For this example, the TVD scheme is chosen for solving the advection term while all other terms are solved by the explicit finite-difference option. The mass balance discrepancies for both species are less than 10-4 %. The calculated hydrocarbon and oxygen plumes are nearly identical to those calculated using BIOPLUME II (Rifai et al., 1987) and RT3D (Clement, 1997). It should be pointed out although only two species are demonstrated in this example, MT3D99 can handle as many species as needed. (a) Hydrocarbon 50 Concentration (ppm) 40 30 20 10 400 0 300 300 250 200 200 150 YA xis (m 100 ) 100 ( xis XA m) 50 0 0 (b) Oxygen 50 Concentration (ppm) 40 30 20 10 400 0 300 300 250 200 200 150 YA xis (m 100 ) 100 ( xis A X m) 50 0 0 Figure 6.2. Calculated distributions of hydrocarbon and oxygen assuming instantaneous reaction. The hydrocarbon is assumed to be continuously injected from a point source into the aquifer with a background oxygen concentration of 9 ppm. Chapter 6 New Benchmark Problems 6-4 6.3 FIRST-ORDER PARENT-DAUGHTER CHAIN REACTIONS The example problem considered in this section involves one-dimensional transport of three species in a uniform flow field undergoing first-order sequential transformation. The equations for the reactive transport problem are as follows: ∂C 1 ∂ 2C 1 ∂C 1 =D − v − λ1C 1 2 ∂t ∂x ∂x 2 2 2 ∂C ∂ C ∂C 2 =D −v − λ2C 2 + Y1 / 2 λ1C 1 2 ∂t ∂x ∂x 3 2 3 ∂C ∂ C ∂C 3 =D − v − λ3C 3 + Y2 / 3λ2C 2 ∂t ∂x 2 ∂x R (6.1) where superscripts 1, 2 and 3 indicate species 1, 2, and 3, respectively. The model parameters used in this example are identical to those used in Clement (1997) and are listed below: Cell width along rows (∆x ) Cell width along columns Layer thickness (∆z) = 0.5 cm (∆y ) = 1 cm = 1 cm Longitudinal dispersivity (α L ) = 1.8 cm Groundwater seepage velocity (v ) = 0.1 cm/hr (λ ) = 0.05 hr First-order reaction rate for species 2 (λ ) = 0.03 hr First-order reaction rate for species 3 (λ ) = 0.02 hr First-order reaction rate for species 1 Retardation factor for species 1 1 -1 2 -1 3 -1 (R ) = 2 (Y1/ 2 ) = 1 Stoichiometric ratio for reaction between species 2 and 3 (Y2 / 3 ) = 1 Stoichiometric ratio for reaction between species 1 and 2 Simulation time (t ) = 200 hours In the flow model, the first and last columns are constant-head boundaries. Arbitrary head values are used to establish the required uniform velocity. In the transport model, the first column is a constant-concentration boundary for all species with the concentration values equal to 1.0 mg/L for species 1 and zero for species 2 and 3. The last column is sufficiently far away from the source to approximate a semi-infinite one-dimensional flow domain. The initial concentrations for all species are assumed to be zero. Chapter 6 New Benchmark Problems 6-5 Figure 6.3 shows the calculated concentration distributions for all three species at the end of the 200-hour simulation period. The calculated values agree closely with the analytical solutions of Lunn et al. (1996). It can be seen that as species 1 is transported from the source, its mass lost to decay becomes the source for species 2, some of which is, in turn, transformed into species 3. The fully implicit finite-difference scheme is used for the solution with a transport stepsize multiplier of 1.1. 1 Numerical (Species 1) 0.8 Numerical (Species 2) Numerical (Species 3) Analytical Solutions C/Co 0.6 0.4 0.2 0 0 5 10 15 20 25 30 35 40 Distance (cm) Figure 6.3. Comparison of calculated concentrations of three species in a uniform flow field undergoing first-order sequential transformation, with the analytical solutions of Lunn et al. (1996). Chapter 6 New Benchmark Problems 6-6 3RVW3URFHVVLQJ 3URJUDPV This chapter contains user’s guides for several post-processing programs intended for use in conjunction with MODFLOW and MT3D, including PostMT3D|MODFLOW, Head|ConcentrationCOMPARE and Flow|MassBUDGET. 7.1 PostMT3D|MODFLOW (PM) PM can be used to extract the calculated concentrations from the unformatted concentration files saved by MT3D99 and other versions of MT3D within a user-specified window along a model layer or cross section (2D) or within a user-specified volume (3D) at any desired time interval. The concentrations within the specified window or volume are saved in such formats that they can be used by any commercially available graphical package such as Golden Software’s Surfer© and Amtec Engineering’s Tecplot© to generate 2D/3D contour maps and other types of graphics. Note that that PM works equally well with the unformatted head/drawdown file saved by MODFLOW. For instructions on how to use PM, refer to Appendix D of the MT3DMS Documentation and User’s Guide. 7.2 Head|ConcentrationCOMPARE (HCCOMP) HCCOMP calculates the differences (or residuals) and associated summary statistics between observed and calculated heads/drawdowns from MODFLOW or calculated concentrations from MT3D at observation points for use during model calibration. The operation and input/output structures of HCCOMP are documented in this section. HCCOMP operates on the unformatted head/drawdown file generated by MODFLOW or the unformatted concentration file generated by MT3D. Therefore, before using HCCOMP, MODFLOW or MT3D must have been run and an unformatted head, Chapter 7 Post-Processing Programs 7-1 drawdown or concentration file saved. The unformatted file may contain records for only one or multiple time periods. To save the unformatted head or drawdown file in MODFLOW, specify the desired time steps and stress periods through the Output Control options. With MT3D, the user can specify the exact times at which the results should be saved through the input file to the BTN package. Note that HCCOMP will work properly only if heads, drawdowns or concentrations are saved for every model layer even though MODFLOW permits the user to save heads or drawdowns for selected model layers only. 7.2.1 Input/Output (I/O) options file (HCCOMP.INI) When HCCOMP is executed, it first searches the current directory to find a file named HCCOMP.INI which contains default input/output options. If HCCOMP.INI is not found, the program will prompt the user to enter the name of the I/O options file. The structure and content of the HCCOMP.INI file are shown below (the bold-faced letters indicate the keywords that should not be modified): &HCCOMP_IO_OPTIONS FN_ModelConfiguration=’mt3d.cnf’ FN_Computed=’mt3d001.ucn’ FN_Observed=’HCCOMP.dat’ FN_Output=’HCCOMP.out’ XMIN_Grid=0 YMIN_Grid=0 ROTATE_Grid=0 Jstart_Include=0 Jend_Include=0 Istart_Include=0 Iend_Include=0 Interpolation=.F. &END where FN_ModelConfiguration is the name of the model configuration file. It is automatically created after MT3D is run if the SAVUCN option is set. For more information on this file, refer to the documentation for PM; FN_Computed is the name of the unformatted head/drawdown file saved by MODFLOW or unformatted concentration file saved by MT3D; Chapter 7 Post-Processing Programs 7-2 FN_Observed is the name of a text file containing information on the observation points (see Section 7.2.2); FN_Output is the name of the output file containing HCCOMP calculation results (see Section 7.2.3); XMIN_Grid is the x coordinate of the lower, left corner of the model mesh in the global coordinate system (see Figure 7.1); YMIN_Grid is the y coordinate of the lower, left corner of the model mesh in the global coordinate system (see Figure 7.1); ROTATE_Grid is the angle of the model mesh rotated counterclockwise in degrees from the x axis of the global coordinate system (see Figure 7.1); Jstart_Include is the starting column (J) number of a window within which data points are to be included for use during model calibration (see Figure 7.2). By default, Jstart_Include=0, is equivalent to Jstart_Include=1; Jend_Include is the ending column (J) number of the data point inclusion window (see Figure 7.2). By default, Jend_Include=0, is equivalent to Jend_Include=NCOL (NCOL is the total number of columns); Istart_Include is the starting row (I) number of the data point inclusion window (see Figure 7.2). By default, Istart_Include=0, is equivalent to Istart_Include=1; Iend_Include is the ending row (I) number of the data point inclusion window (see Figure 7.2). By default, Iend_Include=0, is equivalent to Iend_Include=NROW (NROW is the total number of rows); Interpolation is a logical flag indicating whether interpolation is used to obtain the model-calculated value at the observation point if it does not coincide with a nodal point. If the flag is set to F, the value at the observation point is set equal to the nodal value of the cell where the observation point is located. If it is set to T, bilinear interpolation is used to obtain the value at the observation point from neighboring nodal points in the same layer. No vertical interpolation is done. A default HCCOMP.INI file is included in the directory where the HCCOMP program is located. Copy this file to your working directory and make changes to the default file names and options as necessary for your particular simulation. Chapter 7 Post-Processing Programs 7-3 y Columns 1 2 3 4 5 1 Observation Point (x,y) 2 Rows 3 4 5 x (a) XMIN_Grid=0, YMIN_Grid=0, ROTATE_Grid=0 3 4 Observation Point (x,y) xm 1 2 1 ym 2 Co l um ns 5 y 4 3 Ro w s α 5 a b x (b) XMIN_Grid=a, YMIN_Grid=b, ROTATE_Grid=α Figure 7.1. Definition of the global (x-y) and local coordinate (xm-ym) systems. Chapter 7 Post-Processing Programs 7-4 y Columns 1 2 3 4 5 1 2 Rows 3 4 5 x (a) All observation data points are used by HCComp if no data inclusion window is defined. y Columns 1 2 3 4 5 1 2 Istart_Include=2 Rows 3 4 Iend_Include=4 5 Jst art _In clu de Je n d_ Inc =2 x lud e= 4 (b) Only observation data points inside the data inclusion window are used by HCComp . Figure 7.2. Definition of the data point inclusion window for HCComp. Chapter 7 Post-Processing Programs 7-5 7.2.2 Observation data file The observation data file contains well identification names, observation well locations and observed values of head, drawdown or concentration. These data should be arranged in the following order: For each observation time interval: NW, KPER, KSTP, TOTIM WELLID(1), X(1), Y(1), LAYER(1), OBS(1) WELLID(2), X(2), Y(2), LAYER(2), OBS(2) ...... WELLID(NW-1), X(NW-1), Y(NW-1), LAYER(NW-1), OBS(NW-1) WELLID(NW), X(NW), Y(NW), LAYER(NW), OBS(NW) where NW is the total number of observation points (wells), an integer; KPER and KSTP are the stress period and time step numbers for the calculated heads or drawdowns with which the observed heads or drawdowns are compared, integers; TOTIM is the total elapsed time for the calculated concentrations with which the observed concentrations are compared; WELLID is the well identification name, a character variable; X and Y are the x and y coordinates of the observation point in the global coordinate system; LAYER is the index of the model layer where the observation well is located, an integer; and OBS is the observed value of head, drawdown or concentration. These data are entered using free format. As a result, WELLID, a character variable, should be entered with single quotation as in ‘OW-EPA3’. To separate input variables within each input record, use either blank space or comma. An example of the observation data file is as follows: 13, 1, 1, 0 ’Well 170’ ’Well 170’ ’Well 391’ ’Well 391’ ’Well 140’ 543478.9 543478.9 542304.1 542304.1 541261.6 Chapter 7 Post-Processing Programs 5044505.0 5044505.0 5043993.0 5043993.0 5044101.0 5 7 4 7 5 33.1 18.5 .0 3.2 .0 7-6 ’Well 140’ ’Well 903’ ’Well 903’ ’Well 907’ ’Well 907’ ’Well 135’ ’Well 132’ ’Well 165’ 541261.6 542237.7 542237.7 542868.1 542868.1 541528.6 542315.6 543315.1 5044101.0 5043639.0 5043639.0 5043631.0 5043631.0 5044917.0 5044703.0 5044225.0 7 4 7 5 7 7 7 7 2.0 .0 3.0 .0 3.8 2.0 8.2 5.8 For flow simulation, the observed heads or drawdowns are compared with the calculated values at a specific stress period (KPER) and time step (KSTP) (both set to one for steady-state simulation), because with MODFLOW the user can only save the heads or drawdowns at the end of time steps within each stress period. The discretization of time steps is controlled internally in MODFLOW based on the number of time steps and the time step multiplier specified by the user. With MT3D the user can specify the exact times at which the concentrations should be saved, thus, the observed concentrations can be compared with the calculated values at exactly the same time. 7.2.3 Standard output file HCCOMP creates a standard output file which lists all information for each observation point, in the following order: WELLID, X, Y, XM, YM, COL, ROW, LAYER, OBS, CAL, RESIDUAL where XM and YM are the transformed x and y coordinates of the observation point in the local model coordinate system, whose origin is at the lower, left corner of the model mesh and whose x and y axes are along a model row and column (see Figure 7.1). If XMIN_Grid, YMIN_Grid and ROTATE_Grid are input as zeroes, XM and YM are equal to X and Y input by the user; COL and ROW are column (J) and row (I) indices of the model cell where the observation point is located, as determined by the HCCOMP program. It is imperative that the user check these COL and ROW indices to ensure the correct transformation is performed from (X, Y) to (J, I); CAL is the model-calculated value at the observation point. If no interpolation is used, CAL is set equal to the nodal value at cell (J, I, LAYER). Otherwise, CAL is interpolated from four neighboring nodal points; and Chapter 7 Post-Processing Programs 7-7 RESIDUAL is the difference between calculated and observed values. Positive RESIDUAL indicates over-prediction whereas negative RESIDUAL indicates under-prediction. A number of statistical parameters for the residuals are calculated and printed following the well list. These parameters include: 1. The mean of residuals (M), defined as, M = 1 N N ∑ (cal i =1 i − obsi ) where N is total number of active observation points. 2. The standard derivation of residuals (SDEV), defined as, N 1 N SDEV = M 2 ( cali − obsi ) 2 − ∑ N −1 N − 1 i =1 1/ 2 In the above equation, N-1 instead of N is used in the denominator, based on the “unbiased” method of estimating the standard derivation of a sample out of the entire population. 3. The mean of absolute residuals (MA), defined as, M= 4. 1 N N ∑ cal i =1 i − obsi The root mean squared residuals (RMS), defined as, 1 RMS = N (cali − obsi ) ∑ i =1 N 1/ 2 2 RMS is similar to the standard derivation (SDEV) when the mean of residuals (M) is near zero and the sample size (N) is large. In addition, the correlation coefficient and the probability of un-correlation between observed and calculated values are also computed and printed. These statistical parameters can serve as indicators of the goodness-of-fit between the observed data and calculated values. 7.2.4 Post data file In addition to the standard output file, HCCOMP also prints out a separate data file for each model layer for the convenience of posting data points on contour plots. These post Chapter 7 Post-Processing Programs 7-8 data files have the default file names: RESIDLxx.DAT where xx is the layer index. In each post data file there are ten columns, arranged in the following order: KPER, TOTIM, X, Y, XM, YM, OBS, CAL, RESIDUAL,WELLID where KPER is the number of the stress period and TOTIM is the total elapsed time at which heads, drawdowns or concentrations being compared are saved. 7.3 Flow|MassBUDGET (FMBUDGET) FMBUDGET calculates total flows across and within arbitrarily defined flow budget zones (or subregions) in any model layer, based on the unformatted flow-transport link file saved by LinkMT3D package added to MODFLOW. It also calculates total masses (both dissolved and sorbed) in any user-specified subregions in any model layer, based on the unformatted cell-by-cell mass file saved by MT3D99. FMBUDGET is useful in many routine tasks, such as providing a layer-by-layer summary of flow and mass budgets or calculating total groundwater flow into or out of a structure such as a landfill represented by a group of model cells. In addition to the unformatted flow-transport link file or the cell-by-cell mass file, FMBUDGET requires a user-specified budget-zone definition file. For output, FMBUDGET saves detailed summaries of flow and mass budgets for every zone at each time period saved in the unformatted file. 7.3.1 Unformatted flow-transport link file The unformatted flow-transport link file is saved by the LinkMT3D package added to MODFLOW. The flow-transport link file contains detailed cell-by-cell flow terms and must already exist before MT3D can be run. The flow-transport link file is similar to the cell-bycell flow file created by MODFLOW. Note that FMBUDGET only works with a flowtransport link file saved by Version 2 or later of the LinkMT3D package. 7.3.2 Unformatted cell-by-cell mass file The unformatted cell-by-cell mass file is saved after MT3D99 is run if the SAVCCM option is set. The cell-by-cell mass is saved at the user-specified times and also at the end of each flow model time step. If sorption or dual-domain mass transfer is simulated, both Chapter 7 Post-Processing Programs 7-9 dissolved and sorbed (immobile) masses are saved. Otherwise, only dissolved mass is solved. For more information on the content and structure of this file, refer to Chapter 3. 7.3.3 Budget zone definition file The budget zone definition file contains the location of the budget zones specified by the user. It consists of a three-dimensional integer array (IBZ) with one value for each model cell. No negative zone numbers are acceptable. Use zero for background where no zone is defined. Number the zones starting from 1 and increase consecutively. A zone can be as small as a cell and as large as an entire model. The three-dimensional IBZ array is input as a series of two-dimensional arrays, each of which represents a model layer, staring from Layers 1 to NLAY (total number of layers). For each model layer, the user must first specify an integer input code, IPCODE, of either 101 or 103, followed by zone numbers for the layer. How zone numbers are input depends on the value of IPCODE: If IPCODE = 101, the zone numbers are read using the block format, which consists of a record specifying the number of blocks, NBLOCK, followed by NBLOCK records of input values specifying the first row (I1), the last row (I2), the first column (J1), the last column (J2) of each block as well as the zone number (IBZ value) to be assigned to the cells within the block, as shown below and also in Figure 7.3. If two or more blocks overlap one another, the subsequent blocks overwrite the proceeding ones. If IPCODE = 103, the zone numbers are read using the free format. Values are separated either by a space or by a comma, as shown below and also in Figure 7.3. The input must start at Row 1, sweeping from the first column on the left to the last column on the right. After Row 1 is completed, proceed to Row 2, and so on, until the final row is reached. One row of input values can occupy as many lines as necessary. Also note that the free-format input permits the use of a repeat count in the form, n*d where n is an unsigned-nonzero integer constant, and the input n*d causes n consecutive values of d to be entered. Chapter 7 Post-Processing Programs 7-10 Example of the budget zone definition file: 103 1 1 1 1 1 1 4 5 5 5 5 5 4 5 5 5 5 5 4 5 5 5 5 5 4 5 5 5 5 5 4 5 5 5 5 5 4 5 5 5 5 5 4 5 5 5 5 5 4 5 5 5 5 5 4 5 5 5 5 5 4 5 5 5 5 5 4 5 5 5 5 5 4 5 5 5 5 5 4 5 5 5 5 5 3 3 3 3 3 3 103 0 0 0 0 0 0 0 0 0 0 0 0 0 0 0 0 0 0 0 0 0 0 0 0 0 0 0 0 0 0 0 0 0 0 0 0 0 0 0 0 0 0 0 0 0 0 0 0 0 0 0 0 0 1 0 0 0 0 0 1 0 0 0 0 0 1 0 0 0 0 0 0 0 0 0 0 0 0 0 0 0 0 0 0 0 0 0 0 0 0 101 1 *NBLOCK 1 15 1 23 0 *\LAYER 1 1 1 1 1 1 1 5 5 5 5 5 5 5 5 5 5 5 5 5 5 5 5 5 5 5 5 5 5 5 5 5 5 5 5 5 5 5 5 5 5 5 5 5 5 5 5 5 5 5 5 5 5 5 5 5 5 5 5 5 5 5 5 5 5 5 5 5 5 5 5 5 5 5 5 5 5 5 5 5 5 5 5 5 5 3 3 3 3 3 3 *\LAYER 2 0 0 0 0 0 0 0 0 0 0 0 0 0 0 0 0 0 0 0 1 1 1 1 1 0 1 1 1 1 1 1 1 1 1 1 0 1 1 1 1 0 0 1 1 1 1 0 0 1 1 1 1 0 0 1 1 1 1 0 0 1 1 0 0 0 0 0 0 0 0 0 0 0 0 0 0 0 0 0 0 0 0 0 0 0 0 0 0 0 0 *\LAYER 3 1 5 5 5 5 5 5 5 5 5 5 5 5 5 3 1 5 5 5 5 5 5 5 5 5 5 5 5 5 3 1 5 5 5 5 5 5 5 5 5 5 5 5 5 3 1 5 5 5 5 5 5 5 5 5 5 5 5 5 3 1 5 5 5 5 5 5 5 5 5 5 5 5 5 3 1 5 5 5 5 5 5 5 5 5 5 5 5 5 3 1 5 5 5 5 5 5 5 5 5 5 5 5 5 3 1 5 5 5 5 5 5 5 5 5 5 5 5 5 3 1 5 5 5 5 5 5 5 5 5 5 5 5 5 3 1 5 5 5 5 5 5 5 5 5 5 5 5 5 3 1 2 2 2 2 2 2 2 2 2 2 2 2 2 3 0 0 0 0 0 0 0 0 0 0 0 0 0 0 0 0 0 0 0 0 0 0 0 0 0 0 0 0 0 0 0 0 0 0 0 0 0 0 0 0 0 0 0 0 0 0 0 0 0 0 0 0 0 0 0 0 0 0 0 0 0 0 0 0 0 0 0 0 0 0 0 0 0 0 0 0 0 0 0 0 0 0 0 0 0 0 0 0 0 0 0 0 0 0 0 0 0 0 0 0 0 0 0 0 0 0 0 0 0 0 0 0 0 0 0 0 0 0 0 0 0 0 0 0 0 0 0 0 0 0 0 0 0 0 0 0 0 0 0 0 0 0 0 0 0 0 0 0 0 0 0 0 0 0 0 0 0 0 0 0 0 0 0 0 0 *\I1, I2, J1, J2, IBZ In this example, the model consists 3 layers, 23 columns and 15 rows. In the first layer, there are five zones defined using the free format, with zones 1 to 4 representing the north, east, south and west borders of the model, respectively, and zone 5 the model interior. By defining the zoneation in this fashion, it is convenient to calculate how much flow into or out of the model borders. In the second layer, there are only one zone. Zone 1 could represent a mine pit or landfill. In layer 3, All zone values are set to zero using the block format, thus, no subregional flow or mass budget computation will be done in that layer. Chapter 7 Post-Processing Programs 7-11 (a) Schematic illustration of three budget zones in a model grid. Rows (I) 1 LAYER 1 1 2 2 3 3 4 4 5 5 6 6 7 7 8 8 1 2 3 4 5 6 7 Columns (J) Layer 1 consists of three zones 8 LAYER 2 1 2 3 4 5 6 7 8 Columns (J) Layer 2 consists of two zones (b) Representation of the budget zones in the budget zone definition file. 103 1 1 1 1 2 2 2 2 1 1 1 1 2 2 2 2 101 !IPCode for free format, followed by Zone Numbers; layer 1 1 1 1 1 2 2 2 2 1 1 1 1 2 2 2 2 3 3 3 2 2 2 2 2 3 3 3 2 2 2 2 2 3 3 3 3 3 3 3 3 3 3 3 3 3 3 3 3 !iPCode for block format, followed Zone Numbers; layer 2 2 1 8 1 8 3 4 2 5 1 3 !nblock !i1, i2, j1, j2, iBZ; block 1 2 Figure 7.3. Example for specification of budget zones in a model grid. Chapter 7 Post-Processing Programs 7-12 7.3.4 Output file FMBUDGET prints out flow or mass budgets for every zone defined in the zone definition file at every time period saved in the unformatted flow-transport link file or cellby-cell mass file. If a single zone is defined across several layers, the budget is computed and printed layer-by-layer. Note that the groundwater flow budgets are presented in flow rates (dimension: L3T1 ), not in total flow volumes. The unit for flow rates used by FMBUDGET is the same as that used in MODFLOW. The conventions for IN and OUT used by FMBUDGET are also the same as those in MODFLOW. That is, in terms of flows across zone side boundaries, IN means into the target budget zone from other zones whereas OUT means out of the target budget zone to other zones. In terms of vertical flows, IN from TOP means downward flow into the target layer from the layer immediately above whereas OUT to TOP means upward flow from the target layer to the layer above. On the other hand, IN from BOTTOM means upward to the target layer from the layer immediately beneath it whereas OUT to BOTTOM means downward flow from the target layer to the layer beneath. In terms of storage, various sink/source terms, IN means sources with flow entering the target budget zone whereas OUT means sinks with water leaving the target budget zone. The terms TOTAL IN, TOTAL OUT and ABSOLUTE DISCREPANCY are sums of all inflows, all outflows and actual discrepancy between them (not percentage). For transport mass budgets, only total dissolved and/or sorbed (immobile) masses in each budget zone are computed and printed. Note that if an inconsistent unit such as ppm has been used for concentration, the mass calculated by MT3D and hence FMBUDGET based on the inconsistent concentration unit must be converted if the absolute mass magnitude is important. The mass is calculated in MT3D as product of volumetric flow rate times concentration multiplied by time stepsize. Chapter 7 Post-Processing Programs 7-13 5HIHUHQFHV Alexander, M, 1994, Biodegradation and Bioremediation, Academic Press, San Diego, Calif., pp.302. Borden, R.C., and P.B. Bedient, 1984, Transport of dissolved hydrocarbons influenced by oxygen-limited biodegradation, 1, theoretical development, Water Resour. Res., 13, 1973-1982. Clement, T.P., 1997, RT3D, A Modular Computer Code for Simulating Reactive Multispecies Transport in 3-Dimensional Groundwater Aquifers, PNNL-SA-28967, Pacific Northwest National Laboratory, Richland, Washington. Lunn, M., R.J. Lunn, and R. Mackay, 1996, Determining analytical solution multiple species contaminant transport with sorption and decay, Journal of Hydrology, 195-210. Monod, J., Annu. Rev. Microbiol., vol. 3, p.371-394. Widdowson, M.A., and D.W. Waddill, 1997, SEAM3D, A Numerical Model for ThreeDimensional Solute Transport and Sequential Electron Acceptor-Based Bioremediation in Groundwater, Draft Report to the Army Corps of Engineers Waterways Experiment Station, Vicksburg, Mississippi. Rifai, H.S., P.B. Bedient, R.C. Borden, and F.J. Haasbeek, 1987, BIOPLUME II Computer Model of Two-Dimensional Contaminant Transport under the Influence of Oxygen Limited Biodegradation in Ground Water, Version 1 User’s Manual, Rice University, Texas. Rifai, H.S., C.J. Newell, J.R. Gonzales, S. Dendrou, L. Kennedy, and J. Wilson, 1997, BIOPLUME III, Natural Attenuation Decision Support System, Version 1 User’s Manual, Air Force Center for Environmental Excellence, Brooks AFB, San Antonio, Texas. Wiedemeier, T.H., M.A. Swanson, D.E. Moutoux, E.K. Gordon, J.T. Wilson, B.H. Wilson, D.H. Kampbell, J. Hansen, and P. Haas, 1997, Technical Protocol for Evaluating References 8-1 Natural Attenuation of Chlorinated Solvents in Groundwater, Air Force Center for Environmental Excellence, Brooks AFB, San Antonio, Texas. Zheng, C., 1990, MT3D, A Modular Three-Dimensional Transport Model for Simulation of Advection, Dispersion and Chemical Reactions of Contaminants in Groundwater Systems, Report to the U.S. Environmental Protection Agency, Robert S. Kerr Environmental Research Laboratory, Ada, Oklahoma. Zheng, C., 1996, MT3D96 User’s Guide and Input Instructions, S.S. Papadopulos & Associates, Inc., Bethesda, Maryland. Zheng, C., and P.P. Wang, 1998, MT3DMS, A Modular Three-Dimensional Multispecies Contaminant Transport, Documentation and User’s Guide, Technical Publication, U.S. Army Corps of Engineers Waterways Experiment Station, Vicksburg, Mississippi. References 8-2