1
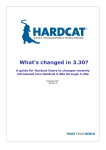
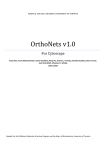
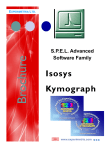
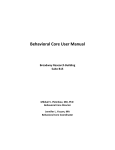
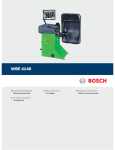
Lexicon Phenotypic Analysis
User Manual
Basic Research Version – May 2007
Copyright 2007 Lexicon Pharmaceuticals Incorporated – All Rights Reserved
Lexicon Phenotypic Analysis Sofware Documentation
Trademarks
Lexicon Phenotypic Analysis Software and Database, OmniBank, Lexicon Pharmaceuticals, Lexicon Pharmaceuticals are
trademarks of Lexicon Pharmaceuticals Inc. and may be registered in the United States or in other jurisdictions including
internationally. Other product names, logos, designs, titles, words or phrases mentioned within this publication may be
trademarks, servicemarks, or tradenames of Lexicon Pharmaceuticals Incorporated (“Lexicon”) or other entities and may
be registered in certain jurisdictions including internationally.
This document may contain links or references to third-party web sites or publications that are not under the control of
Lexicon Pharmaceuticals, Inc. and Lexicon is not responsible for the content of any such link or reference. If you access a
third-party Web site mentioned in this guide, then you do so at your own risk. Lexicon provides these links only as a
convenience, and the inclusion of the link does not imply that Lexicon endorses or accepts any responsibility for the
content on those third-party sites.
Lexicon Disclaimer
LEXICON PHARMACEUTICALS, INC MAKES NO WARRANTIES, EITHER EXPRESS OR IMPLIED, REGARDING THE
ENCLOSED COMPUTER SOFTWARE PACKAGE, ITS MERCHANTABILITY OR ITS FITNESS FOR ANY PARTICULAR
PURPOSE. THE EXCLUSION OF IMPLIED WARRANTIES IS NOT PERMITTED BY SOME STATES. THE ABOVE
EXCLUSION MAY NOT APPLY TO YOU. THIS WARRANTY PROVIDES YOU WITH SPECIFIC LEGAL RIGHTS.
THERE MAY BE OTHER RIGHTS THAT YOU MAY HAVE WHICH VARY FROM STATE TO STATE.
Copyright © 2007 Lexicon Pharmaceuticals, Inc. All rights reserved. This manual may not be copied,
photocopied, reproduced, translated, or converted to any electronic or machine-readable form in whole or in part
without the prior written approval of Lexicon Pharmaceuticals, Inc.
Lexicon Pharmaceuticals Incorporated
8800 Technology Forest Place
The Woodlands, TX 77381-1160
USA
http://www.lexpharma.com/
Copyright 2007 Lexicon Pharmaceuticals Incorporated. All Rights Reserved.
Lexicon Phenotypic Analysis Software Documentation
Introduction
These web pages have been generated by Lexicon Phenotypic Analysis Software and Database,
an online analytical and decision-support system that catalogs the in-vivo characterization of all
genes that are knocked out using either gene targeting or gene trapping technologies. This
software is a module in a much broader package that includes the Lexicon Mouse Production
Software, the Lexicon Phenotypic Data Collector Software and the Lexicon Phenotypic Data
Validator Software.
The Lexicon Mouse Production Software is primarily a workflow system used to manage the
generation and breeding of knockout mice. It is responsible for producing, gathering, and
recording all relevant mouse and colony information and tracks all mice by allele through each
phase of a project lifecycle. The Lexicon Mouse Production Software generates numerous
reports, calendars and queues for managing the process of producing all required mice for later
phenotypic analysis. It is also used to ensure that all participants in colony management know
when an action needs to occur and when data is ready to be collected for a particular set of mice
using the Lexicon Phenotypic Data Collector Software.
The Lexicon Phenotypic Data Collector Software is used to upload physiological or medical data
collected for each of the analyzed mice bred and genotyped through the Lexicon Animal
Production Software.
The Lexicon Phenotypic Data Validator Software is used to perform various data validation
checks and guide the manual review of phenotypic data before it is verified and migrated to the
Lexicon Phenotypic Analysis Database where it can be analyzed and reviewed by research
scientists. This software also provides tools for annotating and summarizing the phenotypic
observations of mouse gene knockouts compared to wild-type controls and historical background
data.
The Lexicon Phenotypic Analysis Software is used by research scientists to assess the
phenotypic information and validated data associated with large scale analysis of knockout mice.
Using a convenient web interface, users can assess and search a wide range of phenotypic
information for each gene knockout project, including raw data, calculated graphs with annotated
summaries, and statistical analysis for each of the major therapeutic areas, also referred to as
“Therapeutic Sections” in this document.
This document provides users with a means of becoming familiar with this basic research version
of the Lexicon Phenotypic Analysis Software and learning how to use all of its features in order to
assess and retrieve phenotypic information and data from gene knockout projects.
Copyright 2007 Lexicon Pharmaceuticals Incorporated. All Rights Reserved.
Lexicon Phenotypic Analysis Software Documentation
Terminology used in this manual
Several defined terms are used throughout the Lexicon Phenotypic Analysis Software and
deserve particular attention to understand how they are referenced in this document and the
associated software.
Lexicon Phenotypic Analysis Project
Throughout the Lexicon Phenotypic Analysis Software, each genetic mutation for every target
gene is presented as a single ‘Project’ and there are many ways of accessing and retrieving data
for the mouse knockout projects that may be of greatest interest to research scientists.
The same gene can be mutated using several different strategies (Gene Trapping, Null Allele,
Point Mutations, Conditional, etc…). In such cases, there are several Lexicon Phenotypic
Analysis Projects available for each type of mutation generating potentially different alleles within
the same gene.
Throughout these pages, a Lexicon Phenotypic Analysis Project is assigned a unique identifier
consisting of a ‘LEXKO’ prefix and a 3 or 4-digit number (ex: LEXKO-443).
Gene Mutation Strategies
Gene Targeting by Homologous Recombination
Gene Targeting by Homologous Recombination affords deliberate and precise manipulation of
genomic sequence in the mouse and is the process used to replace a specific gene sequence
with a mutant exogenous sequence such as a positive selection cassette and marker gene.
When this procedure is performed in mouse embryonic stem (ES) cells, mice with the
corresponding mutation can be produced. A typical targeting vector contains a selectable marker
flanked by regions of homology to the gene of interest and is introduced into ES cells by
electroporation. Once in the cell, the vector aligns with the corresponding genomic sequence
and the corresponding region of the gene is replaced by the selectable marker creating the
desired mutation through an homologous recombination event.
ES cells that have incorporated the targeting vector can be enriched under selection. The
surviving stem cell clones are then subjected to further characterization to ensure that the
desired homologous recombination event has occurred. These types of events are engineered
to completely ablate the function of the gene and result in a null mutation.
Targeting vectors usually contain a reporter gene, typically LacZ, which may be used to
determine the temporal and spatial expression patterns of the gene targeted.
Gene Trapping
Gene Trapping provides a high-throughput approach for producing insertional mutations in
genes. When gene trapping is performed in mouse embryonic stem cells, these cells can
subsequently be used to produce mutant mice. Gene Trapping vectors are delivered to
embryonic stem cells by infection with an engineered retrovirus. Upon entry into the cell, the
Copyright 2007 Lexicon Pharmaceuticals Incorporated. All Rights Reserved.
Lexicon Phenotypic Analysis Software Documentation
vector randomly inserts into the genomic DNA, inserting into and mutating genes. The vectors
are designed so that insertion events occurring in transcriptionally active areas result in the
expression of a selectable marker gene, thereby enriching for recovery of insertion events within
genes.
Subsequent selection allows the growth of stem cell colonies from clones containing a single
gene trap insertion event. The gene trap event not only mutates the gene, but it also marks the
gene by virtue of insertion of unique genetic elements, making it possible to identify the sequence
of the mutated gene using a variety of PCR-based techniques.
Conditional Mutation
Conditional Mutations make use of site-specific recombinases (e.g. Cre) that delete genomic
sequence between their recognition sites (e.g. LoxP). To produce a conditional mutation, a
region of a gene is flanked by LoxP sites using homologous recombination in ES cells. The LoxP
sites along with a selectable marker are positioned in non-coding regions of the gene and by
design, should not themselves affect expression of the gene. By crossing these mice with a line
of mice that expresses Cre-recombinase in a specific tissue and/or at a specific time, one can
generate temporal or tissue-specific mutations as the gene will only be deleted where and when
the recombinase is expressed.
Mouse Label
A Mouse Label is a unique identifier for an animal that is constructed from a single capital letter
indicating the mouse gender and a unique serial number for this mouse within this project. For
example, a Mouse Label noted M-100 within a Lexicon Phenotypic Analysis Project refers to the
100th mouse, a male (M), bred within this project.
Mouse Genotype
Each animal carries a mandatory Mouse Genotype designation as hom (homozygous), het
(heterozygous) or wt (wild-type) for each mutation.
Phenotypic analysis is generally performed by comparing assay values in a Lexicon Phenotypic
Analysis Project between genetically matched cohorts of mice. The Lexicon Phenotypic Analysis
Software allows for determining a gene-specific knockout phenotype by comparing the data
distributions from homozygous or heterozygous animals to their wild-type littermates. In addition,
comparisons can be made to the distribution of all historical wild-type values for a particular
assay as described later in this document.
Therapeutic Section
In order to classify experiments that are performed on mice, the data from particular Assays are
organized into different Therapeutic Sections. Each of these sections will contain a list of specific
Assays so that results can be easily and consistently retrieved throughout the software for each
Lexicon Phenotypic Analysis Project. The software comes pre-configured with the following
standard Therapeutic Sections:
•
•
•
•
•
Blood Chemistry Tests
Cardiology Assays
Diagnostics Assays
Gene Expression Data
Immunology Assays
Copyright 2007 Lexicon Pharmaceuticals Incorporated. All Rights Reserved.
Lexicon Phenotypic Analysis Software Documentation
•
•
•
•
•
Neurology Assays
Oncology Assays
Ophthalmology Assays
Pathology Reports
Metabolism Assays
Assays
Data collected for a particular project are organized by Assay. An Assay is interpreted as a
means of collecting data from a particular instrument or through a web form that a researcher has
populated through Lexicon Phenotypic Data Collector Software. The Lexicon Phenotypic
Analysis Software currently supports the collection and visualization of data from more than 70
different analytical procedures or instruments.
Displays of gender specific graphs or data transformations are often necessary in order to
interpret the raw data and the software is pre-configured to perform these operations natively.
For example, Open Field Tests may initially generate trace information over a fixed period of time
and the software automatically transforms such data into different outputs such as Total
Distance, or Center vs. Total Distance Ratio.
Assay Values
In most cases, a single Assay can produce multiple pieces of information (or datapoints) in one
experiment. For example, a typical Hematology Test will produce as many as 20 different Assay
Values (such as Red Blood Cell Count, White Blood Cell Count, Glucose Level, etc…). The
software automatically graphs such values independently, yet retains the original raw data
information structure. Such Assay Values can also be independently analyzed based on specific
built-in criteria. For instance, gender may be an important variable in certain experiments, hence
the software will provide combined data graphs as well as separate graphs from male and female
data.
Datasets
The notion of Datasets is one of the most important and powerful features of the Lexicon
Phenotypic Analysis Software. Datasets are generated from different scientific or experimental
protocols and they are used to keep such data in different bins for proper interpretation.
If two different scientific protocols were used for the same assay, combining the results could
impact their scientific interpretation. For example, if some mice are subjected to a high fat diet
before a Blood Chemistry test is performed, the results should not be combined with results from
mice subjected to a normal chow diet. In this particular case, two datasets are created: one for
the High Fat Diet Protocol and one for the Chow Diet Protocol.
Different Datasets are used when experimental conditions change for a particular assay over
time (changing environmental conditions, such as water, equipment, etc…). In such cases, and
since data variations may prevent different projects from being compared against one another, it
is often beneficial to create a new dataset that will be used to store the newly created data.
Different Datasets are also used when animals are subjected to (or challenged with) specific
drugs or agents prior to being analyzed through the available phenotypic Assays.
Throughout these pages, a single Dataset is being used and is named “Results”.
Copyright 2007 Lexicon Pharmaceuticals Incorporated. All Rights Reserved.
Lexicon Phenotypic Analysis Software Documentation
Wild-Type Historical Data (Wild-Type Ranges)
An additional reason Datasets are created for each protocol is that the software can produce
Wild-Type Historical data (or ranges) by combining wild-type Assay Values for many projects
studied under the same experimental protocol. This allows computational analysis using large
wild-type control populations for statistical analysis.
The version of the Lexicon Phenotypic Analysis Software used to generate these pages was
configured to only provide overall historical wild-type ranges for each assay/dataset/graph
combination. These ranges have been generated from thousands of wild-type datapoints from
projects having already been fully phenotyped by Lexicon Pharmaceuticals.
On each graph, the data for the different genotype
distributions (wt, het and hom) will be displayed along
with a representative set of historical wild-type values
from other projects whose data was previously
collected under the same experimental conditions (i.e.
Dataset).
The overall historical range of values for all previously
collected data points from wild-type animals is
displayed as a green shaded background with two
tones of green representing the range for one standard
deviation around the mean in light green color (1) and
two standard deviations in darker green color (2).
Additional information provided for all available graph
types is available in more detail later in this document.
Figure 1: Wild-type Historical Ranges
Copyright 2007 Lexicon Pharmaceuticals Incorporated. All Rights Reserved.
Lexicon Phenotypic Analysis Software Documentation
Graphs & Calculated Data
Available Graphs in Lexicon Phenotypic Analysis Software
The Lexicon Phenotypic Analysis Software provides an easy way to compare data from different
sets of animals based on their genotype. The graphs are represented either as dot plots, bar
graphs, or line graphs. On each of the graphs throughout the software, colors define the group of
animals of a particular genotype for a particular mutation; green for wild-type animals, blue for
heterozygous animals and red for homozygous animals. Note that the colors for the different
genotype groups are the same in all graphs.
Below are a few examples of such graphs as they are displayed throughout the software.
Dot Plots
This is a typical dot-plot graph showing data for a Blood
Chemistry Test performed on 16 animals; 4 wt (+/+) in
green, 4 het (-/+) in blue, and 8 hom (-/-) in red as shown
in the line starting with RS(n) above the graph.
The RS(#) line above the graph indicates either the mean
or the median value for each group of animals. In this
example, the mean values are 21, 22 and 22 for wt, het,
and hom distributions, respectively.
The light green background indicates the Wild-Type
Range for all collected wild-type range values.
By clicking on any graph throughout the software, an extra
window will open showing all available statistics that were
computed for this particular Dataset. Most of the standard
statistical methods have been used and are made
available to the user for each genotype group.
Figure 2: Dot Plot Graphs
Figure 3: Available Statistical Indicators for all Graphs
Copyright 2007 Lexicon Pharmaceuticals Incorporated. All Rights Reserved.
Lexicon Phenotypic Analysis Software Documentation
Also note that throughout the software, there are
blue bars at the top and bottom of each graph.
These bars represent the “usual values” for a
typical assay. Such ranges are used to ensure
consistency in the drawing of graphs from project to
project for the same assay.
In some cases where outliers are present outside
of this range (test failure, extreme values, etc…),
the graph will display the outlier(s) and scale the
graph accordingly. In effect, the blue bars will now
be displayed in the middle of the figure to indicate
which value(s) seems to be outside the “normal
range”. Figure 4 illustrates an example of such an
occurrence.
Figure 4: Scaling of graphs
Bar Graphs
This type of graph (bar graph) is used to show the
proportion of animals that show either a Normal (filled
color) or Abnormal (unfilled color) test result.
In this example, Urinalysis is performed to test the level of
Nitrites in the Urine for all animals.
In this case, 3 out of 3 wild-type animals, 1 out of 1
heterozygous animal and 3 out of 5 homozygous animals
show normal Nitrite values and 2 out of 5 homozygous
animals show abnormal Nitrite values.
Such a representation is useful to report on the proportion
of animals in each distribution whose results match a
specific condition.
Figure 5: Bar Graphs
Copyright 2007 Lexicon Pharmaceuticals Incorporated. All Rights Reserved.
Lexicon Phenotypic Analysis Software Documentation
Line Graphs
This figure shows a typical line graph where
datapoints were collected over a period of time.
Such displays can be useful in addition to a
dot-plot graph for each interval to show a trend
in the data. Habituation or learning can be an
important factor to consider when assessing
the existence of a behavioral phenotype.
The top of the figure shows the number of
datapoints that are represented for each
interval measurement and with which an
average value is computed and displayed on
the graph for each distribution (wt, het and
hom).
Figure 6: Line Graphs
Again, the green shaded background
represents the ranges for all wild-type values
from previously collected Lexicon Phenotypic
Analysis Projects for this Assay.
Copyright 2007 Lexicon Pharmaceuticals Incorporated. All Rights Reserved.
Lexicon Phenotypic Analysis Software Documentation
Lexicon Phenotypic Analysis
Project Visualization
Project Tree View
The Project Tree View initially shows all available gene information for a selected Lexicon
Phenotypic Analysis Project, with a navigation tree to the left. In this tree, the first three links are
the Gene Summary and the Genetics Report for this project. The tree also lists all available
Therapeutic Sections, which include subfolders for all specific assays that were run for this
project. The figure below shows the Project Tree View interface:
Figure 7: Project Tree View Page
By clicking on the Blood Chemistry Therapeutic Section, one of the listed Assays in this section
is named “Blood Chemistry” and contains a specific Dataset named “Results” that provides a
Data Page for this set of data. The next picture describes a typical Project Tree View page if the
user clicks on the “Results” Dataset link for the LEXKO-011 Lexicon Phenotypic Analysis Project.
Copyright 2007 Lexicon Pharmaceuticals Incorporated. All Rights Reserved.
Lexicon Phenotypic Analysis Software Documentation
Figure 8: Project Tree View Navigation
Access to all available data for an Assay
All data available for an Assay will be displayed on the data page along with:
•
•
•
a description of the Assay and protocol used (when relevant)
all graphs in different conditions (when necessary)
a link to a .csv file with all raw data for animals analyzed through this assay.
In some cases, additional calculated data tables are available providing the scientist with
additional data analyses used to assess a phenotype more efficiently or practically than when
using the raw data.
The figures below show the contents of a data page for the DEXA Assay.
Copyright 2007 Lexicon Pharmaceuticals Incorporated. All Rights Reserved.
Lexicon Phenotypic Analysis Software Documentation
Figure 9: Description of the DEXA Assay
Figure 10: DEXA Assay Graphs
Copyright 2007 Lexicon Pharmaceuticals Incorporated. All Rights Reserved.
Lexicon Phenotypic Analysis Software Documentation
Figure 11: An Example of Calculated Data Results
Figure 12: Another Example of Calculated Data Results
Copyright 2007 Lexicon Pharmaceuticals Incorporated. All Rights Reserved.
Lexicon Phenotypic Analysis Software Documentation
Figure 13: DEXA Raw Data Table
Note that by clicking on the spreadsheet icon when viewing a raw data table, you can export and
open all available raw data directly in Microsoft Excel, or save it to disk.
Other Available Data Types
Data is also available as images, depending on the Assay. Clicking on image thumbnails will
often provide a specific image, along with an annotated example. The figure below shows a
fundus photography picture and its annotated control picture.
Figure 14: Fundus Photography Picture & Annotated Control
Copyright 2007 Lexicon Pharmaceuticals Incorporated. All Rights Reserved.
Lexicon Phenotypic Analysis Software Documentation
The CATScan page is rich in graphics and additionally provides the option to visualize a movie of
the whole mouse CATScan. Such movie can be saved on disk or be viewed using Windows
Media Player plug-in.
Figure 15: CATScan Data Mouse Report
An annotated mouse CATScan reference movie is also available:
Figure 16: Annotated Reference CATScan Movie
Copyright 2007 Lexicon Pharmaceuticals Incorporated. All Rights Reserved.
Lexicon Phenotypic Analysis Software Documentation
Project Summary Page
The Project Summary Page consists of six main sections:
1. Curated gene summary
2. Phenotypic Summary
3. Curated Mouse Gene Sequence Information
4. Curated Human Gene Sequence Information
5. Mutation Information
6. Vector Graphic
From the Project View Page Tree, clicking on the Gene Summary link will display a page as shown in the
figure below:
Figure 17: Gene Summary Page
Copyright 2007 Lexicon Pharmaceuticals Incorporated. All Rights Reserved.
Lexicon Phenotypic Analysis Software Documentation
Gene Summary
Figure 18: Curated Gene Summary Information
The Gene Summary section contains a curated description of each mutated gene in the database. Most
of the information is collected automatically, then reviewed and curated independently by scientists. This
section contains information such as:
1. Gene classification by functional category and cell location.
2. Description of the mouse gene as well as known human orthologs.
3. Short summary of known or putative biology of the target with relevant literature and database
citations when available.
Phenotypic Summary
This section gives an overall description of the relevant phenotypic observed for the gene-specific
mutation.
Copyright 2007 Lexicon Pharmaceuticals Incorporated. All Rights Reserved.
Lexicon Phenotypic Analysis Software Documentation
Mouse Gene Sequence Information
Figure 19: Mouse Gene Sequence Information
This section provides a link to public sequence records for the mutated mouse gene along with the
gene’s description. Also included is a link to NCBI or the SwissProt database for the mouse protein
sequence with its definition, and finally a link to the Entrez Gene record is displayed.
Human Gene Sequence Information
Figure 20: Human Gene Sequence Information
This section provides a link to public sequence records for the human gene ortholog to the mutated
mouse gene along with the human gene’s description. Also included is a link to NCBI or the SwissProt
database for the human protein sequence with its definition, and finally a link to the Entrez Gene record
is displayed.
Gene Mutation Information
Figure 21: Mutation Information
The Mutation Type and a short description of the mutation strategy are described in this section
of the Gene Summary Page.
Copyright 2007 Lexicon Pharmaceuticals Incorporated. All Rights Reserved.
Lexicon Phenotypic Analysis Software Documentation
Vector Graphic
The vector graphic displays detail regarding the retroviral vector used to generate a knockout
mouse via retroviral insertion mutagenesis. This section is not displayed for knockout lines
generated by homologous recombination.
Copyright 2007 Lexicon Pharmaceuticals Incorporated. All Rights Reserved.
Lexicon Phenotypic Analysis Software Documentation
Genetics Analysis Report
The Genetics Analysis Report summarizes the genotype distributions and statistics for wild type,
heterozygous and homozygous animals in each Lexicon Phenotypic Analysis Project. This
information is used to infer embryonic lethality or reduced viability.
Figure 22: Genetics Analysis Report
A link to a PDF file detailing the Genotyping Strategy is also available. The figure below shows an
example of the contents of such a file.
Figure 23: Genotyping Strategy Available Information
Copyright 2007 Lexicon Pharmaceuticals Incorporated. All Rights Reserved.
Lexicon Phenotypic Analysis Software Documentation
Phenotypic Assays & Data
As described previously, 10 Therapeutics Sections are used to classify all the Assays available
for a Lexicon Phenotypic Analysis Project (i.e. mutated gene).
Blood Chemistry Therapeutic Section
Data may be available for the following Assays in this section:
•
•
•
•
•
•
Blood Chemistry (graphs, data)
HGBA1C (graphs, data)
Insulin Assay (graphs, data)
Glucose Tolerance (graphs, data)
Oral Glucose Tolerance (graphs, data)
Urinalysis (graphs, data)
Cardiology Therapeutic Section
Data may be available for the following Assays in this section:
•
•
Blood Pressure (graphs, data)
Heart Rate (graphs, data)
Diagnostics Therapeutic Section
Data may be available for the following Assays in this section:
•
•
•
Fertility (data)
Length (graphs, data)
Weight (graphs, data)
Expression Therapeutic Section
Data may be available for the following Assays in this section:
•
•
•
•
Contig Map (images)
QC Expression (images)
QC Images (images, sequences)
WT Panel (images)
Copyright 2007 Lexicon Pharmaceuticals Incorporated. All Rights Reserved.
Lexicon Phenotypic Analysis Software Documentation
Immunology Therapeutic Section
Data may be available for the following Assays in this section:
•
•
•
•
•
•
Acute Phase Response (graphs, data)
FACS Analysis (graphs, data)
Ovalbumin Challenge (graphs, data)
Peritoneal Inflammation Assay (data)
Serum Immunoglobulin Assay (graphs, data)
sICAM-1 Assay (graphs, data)
Metabolism Therapeutic Section
Data may be available for the following Assays in this section:
•
•
•
•
CATScan (images, movies)
DEXA (graphs, data)
MicroCT (images, graphs, data)
X-ray (images)
Neurology Therapeutic Section
Data may be available for the following Assays in this section:
•
•
•
•
•
•
•
•
•
•
•
•
•
Basal Body Temperature (graphs, data)
Circadian Rhythms (graphs, data)
Functional Operational Battery (data)
Formalin Assay (graphs, data)
Hot Plate (graphs, data)
Inverted Screen Assay (data)
Open Field Test (graphs, data)
Repulse Inhibition Assay (graphs, data)
Rotarod (graphs, data)
Stress-Induced Hyperthermia (graphs, data)
Tail Suspension (graphs, data)
Trace Aversive Conditioning (graphs, data)
Trace Conditioning (graphs, data)
Oncology Therapeutic Section
Data may be available for the following Assays in this section:
•
Skin Proliferation Assay (graphs, data)
Copyright 2007 Lexicon Pharmaceuticals Incorporated. All Rights Reserved.
Lexicon Phenotypic Analysis Software Documentation
Ophthalmology Therapeutic Section
Data may be available for the following Assays in this section:
•
•
Fundus Photography (images, graphs, data)
Angiogram Photography (images)
Pathology Therapeutic Section
Data may be available for the following Assays in this section:
•
•
•
Gross Observations (data)
Organ Tissue Weight (data)
Microscopic Analysis (pictures, data)
Minimum System Requirements
•
•
•
For Microsoft Windows™: An Intel Pentium® 133Mhz or equivalent processor running
Windows 95 or higher (including Windows 2000 or XP); 32MB of RAM (64MB
recommended); a color monitor capable of 800x600 resolution (1024x768
recommended); Microsoft Internet Explorer 6.0 or later version / Firefox 1.0.6 or later
version
For the Macintosh®: A Power Macintosh (G3 or higher recommended) running Mac OS
X 10.3 or later; 32MB or RAM (64MB recommended); a color monitor capable of
800x600 resolution (1024x768 recommended); Safari Browser Version 1.2 or later.
Windows-Media Player Plug-in can be obtained from Microsoft’s web site.
Additional Required Software for Users
No additional software is required for users to access the Lexicon Phenotypic Analysis Software
other than a web browser as listed above.
Copyright 2007 Lexicon Pharmaceuticals Incorporated. All Rights Reserved.