1
Urban Subwatershed Restoration Manual Series
111
Unified Subwatershed
and Site
Reconnaissance:
A User’s
Manual
Version 2.0
Februar
y 2005
ebruary
Manual 11
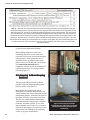
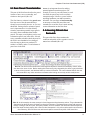
Photo Acknowledgments
Figure 11f:
Figure 15:
Figure 17:
Figure 18:
Figure 21:
Roger Bannerman
City of Memphis
Regional Water Quality Control Board, Region 3
Unites States Department of Energy
City of Memphis
Urban Subwatershed Restoration Manual No. 11
UNIFIED SUBWATERSHED
AND SITE RECONNAISSANCE:
A USER’S MANUAL
Version 2.0
Prepared by:
Tiffany Wright, Chris Swann, Karen Cappiella, and Tom Schueler
Center for Watershed Protection
8390 Main Street, 2nd Floor
Ellicott City, MD 21043
www.cwp.org
www.stormwatercenter.net
Prepared for:
Office of Water Management
U.S. Environmental Protection Agency
Washington, D.C.
February 2005
Copyright ©2005 by the Center for Watershed Protection.
Material may be quoted provided credit is given.
Printed in the United States of America on recycled paper.
Foreword
Foreword
This manual distills our experience in evaluating
the restoration potential of urban
subwatersheds that we have acquired in dozens
of rapid restoration assessments over the past
decade. We have assembled a basic assessment
approach into a single package, known as the
Unified Subwatershed and Site Reconnaissance,
or USSR. Over the past two years, we have
continuously sought to refine, test and expand
this assessment approach in our watershed
practice, and it has undergone at least four
major revisions. We expected that it would be
further adjusted over time; therefore, we are
pleased to release this manual in Version 2.0, in
response to user feedback and new resources.
Thanks also to our external reviewers, who
included participants at our inaugural
Watershed Restoration Institute, as well as
local watershed organizations, such as the
Gwynns Falls Watershed Association, South
River Federation, and others. Special thanks to
the Chesapeake Bay Trust and the National
Fish and Wildlife Foundation for providing
community watershed grants that allowed us to
keep on testing the USSR in a variety of urban
watershed conditions.
The Center staff team that contributed to the
development of the USSR included Ted
Brown, Anne Kitchell, Tiffany Wright, Chris
Swann, Karen Cappiella, Jennifer Zielinski,
Stephanie Sprinkle, and Tom Schueler.
Special thanks are extended to Heather Holland
and Lauren Lasher for able assistance in
editing, proofing, and otherwise helping to
produce this manual. This manual was
produced under a cooperative agreement with
U.S. EPA Office of Water CP-82981501, and
we are grateful to our EPA project officer,
Robert Goo, for his patience, insights, and
flexibility during the two years it took to
produce this manual series.
Sincerely,
Tiffany Wright
Center for Watershed Protection
Urban Subwatershed Restoration Manual 11
i
Foreword
ii
Urban Subwatershed Restoration Manual 11
Foreword
About the R
estoration Manual Series
Restoration
This is the last in a series of 11 manuals that
provides detailed guidance on how to repair
urban watersheds. The entire series of manuals
was written by the Center for Watershed
Protection to organize the enormous amount of
information needed to restore small urban
watersheds into a format that can easily be
accessed by watershed groups, municipal staff,
environmental consultants and other users. The
contents of the manuals are organized as
follows.
Manual 1: An Integrated
Approach to Restore
Small Urban W
atersheds
Watersheds
The first manual introduces the basic concepts
and techniques of urban watershed restoration,
and sets forth the overall framework we use to
evaluate subwatershed restoration potential.
The manual emphasizes how past
subwatershed alterations must be understood in
order to set realistic expectations for future
restoration. Toward this end, the manual
presents a simple subwatershed classification
system to define expected stream impacts and
restoration potential. Next, the manual defines
seven broad groups of restoration practices,
and describes where to look in the
subwatershed to implement them. The manual
concludes by presenting a condensed summary
of a planning approach to craft effective
subwatershed restoration plans.
Manual 2: Methods to
Develop Restoration Plans
for Small Urban
W atersheds
The second manual contains detailed guidance
on how to put together an effective plan to
restore urban subwatersheds. The manual
Urban Subwatershed Restoration Manual 11
outlines a practical, step-by-step approach to
develop, adopt and implement a subwatershed
plan in your community. Within each step, the
manual describes 32 different desktop analysis,
field assessment, and stakeholder involvement
methods used to make critical restoration
management decisions.
The next seven manuals provide specific
guidance on how to identify, design, and
construct the seven major groups of watershed
restoration practices. Each of these “practice”
manuals describes the range of techniques used
to implement each practice, and provides
detailed guidance on subwatershed assessment
methods to find, evaluate and rank candidate
sites. In addition, each manual provides
extensive references and links to other useful
resources and websites to design better
restoration practices. The seven manuals are
organized as follows:
Manual 3: Storm W
ater
Water
Retrofit Practices
The third manual focuses on storm water
retrofit practices that can capture and treat
storm water runoff before it is delivered to the
stream. The manual describes both off-site
storage and on-site retrofit techniques that can
be used to remove storm water pollutants,
minimize channel erosion, and help restore
stream hydrology. The manual then presents
guidance on how to assess retrofit potential at
the subwatershed level, including methods to
conduct a retrofit inventory, assess candidate
sites, screen for priority projects, and evaluate
their expected cumulative benefit. The manual
concludes by offering tips on retrofit design,
permitting, construction, and maintenance
considerations in a series of 17 retrofit profile
sheets.
iii
Foreword
Manual 4: Urban Stream
Repair Practices
Manual 6: Discharge
Prevention Practices
The fourth manual concentrates on practices
used to enhance the appearance, stability,
structure, or function of urban streams. The
manual offers guidance on three broad
approaches to urban stream repair – stream
cleanups, simple repairs, and more sophisticated
comprehensive repair applications. The manual
emphasizes the powerful and relentless forces
at work in urban streams, which must always
be carefully evaluated in design. Next, the
manual presents guidance on how to set
appropriate restoration goals for your stream,
and how to choose the best combination of
stream repair practices to meet them.
The sixth manual covers practices used to
prevent the entry of sewage and other pollutant
discharges into the stream from pipes and spills.
The manual describes a variety of techniques to
find, fix and prevent these discharges that can
be caused by illicit sewage connections, illicit
business connections, failing sewage lines, or
industrial/transport spills. The manual also
briefly presents desktop and field methods to
assess the severity of illicit discharge problems
in your subwatershed. Lastly, the manual
profiles different “forensic” methods to detect
and fix illicit discharges. Manual 6 is also
known as the Illicit Discharge Detection and
Elimination Guidance Manual: a guidance
manual for program development and
technical assessment, and is referenced as
Brown et al., 2004, throughout this manual.
The manual also outlines methods to assess
stream repair potential at the subwatershed
level, including basic stream reach analysis,
more detailed project investigations, and priority
screenings. The manual concludes by offering
practical advice to help design, permit,
construct and maintain stream repair practices
in a series of more than 30 profile sheets.
Manual 5: Riparian
Management Practices
The fifth manual examines practices to restore
the quality of forests and wetlands within the
remaining stream corridor and/or flood plain. It
begins by describing site preparation techniques
that may be needed to make a site suitable for
planting, and then profiles four planting
techniques for the riparian zone, based on its
intended management use. The manual
presents several methods to assess riparian
restoration potential at the subwatershed level,
including basic stream corridor analysis,
detailed site investigations, and screening
factors to choose priority reforestation projects.
The manual concludes by reviewing effective
site preparation and planting techniques in a
series of eight riparian management profile
sheets.
iv
Manual 7: W
atershed
Watershed
Forestr y PPractices
ractices
The seventh manual reviews subwatershed
practices that can improve the quality of upland
pervious areas, which include techniques to
reclaim land, revegetate upland areas, and
restore natural area remnants. When broadly
applied, these techniques can improve the
capacity of these lands to absorb rainfall and
sustain healthy plant growth and cover. This
brief manual also outlines methods to assess the
potential for these techniques at both the site
and subwatershed scale.
Manual 8: PPollution
ollution Source
Control Practices
Pollution source control practices reduce or
prevent pollution from residential neighborhoods
or storm water hotspots. Thus, the topic of the
eighth manual is a wide range of stewardship
and pollution prevention practices that can be
employed in subwatersheds. The manual
presents several methods to assess
subwatershed pollution sources in order to
develop and target education and/or
enforcement efforts that can prevent or reduce
Urban Subwatershed Restoration Manual 11
Foreword
polluting behaviors and operations. The manual
outlines more than 100 different “carrot” and
“stick” options that can be used for this
purpose. Lastly, the manual presents profile
sheets that describe 21 specific stewardship
practices for residential neighborhoods, and 15
pollution prevention techniques for control of
storm water hotspots.
Manual 9: Municipal
Practices and Programs
The ninth manual focuses on municipal
programs that can directly support
subwatershed restoration efforts. The five
broad areas include improved street and storm
drain maintenance practices, development/
redevelopment standards, stewardship of public
land, delivery of municipal stewardship
services, and watershed education and
enforcement. This last “practice” manual
presents guidance on how municipalities can
use these five programs to promote
subwatershed restoration goals. The manual
also contains a series of profile sheets that
recommends specific techniques to implement
effective municipal programs.
The series concludes with two user manuals
that explain how to perform field assessments
to discover subwatershed restoration potential
in the stream corridor and upland areas.
stream corridor. The tenth manual is a user’s
guide that describes how to perform the USA,
and interpret the data collected to determine the
stream corridor restoration potential for your
subwatershed.
Manual 11: The Unified
Subwatershed and Site
Reconnaissance (USSR): A
User ’s Manual
The last manual examines pollution sources and
restoration potential within upland areas of
urban subwatersheds. The manual provides
detailed guidance on how to perform each of its
four components: the Neighborhood Source
Assessment (NSA), Hotspot Site Investigation
(HSI), Pervious Area Assessment (PAA) and
the analysis of Streets and Storm Drains
(SSD). Together, these rapid surveys help
identify upland restoration projects and source
control to consider when devising subwatershed
restoration plans.
Individual manuals in the series are scheduled
for completion by 2006, and can be downloaded
or delivered in hard copy for a nominal charge.
Be sure to check the Center website,
www.cwp.org, to find out when each manual
will be available and how it can be accessed.
Manual 10: The Unified
Stream Assessment (USA):
A User
’s Manual
User’s
The Unified Stream Assessment (USA) is a
rapid technique to locate and evaluate problems
and restoration opportunities within the urban
Urban Subwatershed Restoration Manual 11
v
Foreword
vi
Urban Subwatershed Restoration Manual 11
Table of Contents
Table of Contents
Foreword ...................................................................................................................................... i
About the Restoration Manual Series ......................................................................................... iii
Table of Contents .......................................................................................................................vii
Introduction ................................................................................................................................ xi
Chapter 1: The Basics of the Unified Subwatershed and Site R
econnaissance ...................... 1
Reconnaissance
1.1
1.2
1.3
1.4
1.5
Four Assessment Components of the USSR ................................................................ 2
How the USSR Helps Identify Pollution Sources and Restoration Opportunities ........... 2
Basic Steps to Conduct a USSR Survey ...................................................................... 3
Where and When Data Fits Into the Subwatershed Planning Process? ....................... 3
How to Organize and Interpret USSR Data ................................................................. 5
Chapter 2: PPreparation
reparation Needed to Conduct the USSR ........................................................... 7
2.1
2.2
2.3
2.4
What Do I Need to Get Started? ............................................................................... 7
Desktop Analysis to Support a USSR Survey ................................................................ 9
Site and Neighborhood Delineation/Mapping to Support the USSR ......................... 10
Budgeting and Scoping a USSR Survey .................................................................... 11
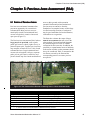
Chapter 3: Neighborhood Source Assessment (NSA) ............................................................. 13
3.1
3.2
3.3
3.4
3.5
3.6
3.7
3.8
Basics of Neighborhoods ........................................................................................ 13
Introduction to the NSA ........................................................................................... 14
Characterizing the Neighborhood .......................................................................... 17
Assessing Yard and Lawn Conditions ....................................................................... 19
Assessing Driveways, Sidewalks, and Curbs ............................................................. 23
Assessing How Rooftop Runoff is Managed ............................................................. 24
Assessing Common Areas ....................................................................................... 25
Recommended Actions and Neighborhood Indexes .............................................. 27
Chapter 4
4:: Hotspot Site Investigation (HSI) .......................................................................
.......................................................................31
4.1 Basics of Hotspots ................................................................................................... 31
4.2 Introduction to the HSI ............................................................................................ 34
4.3 Characterizing the Site ........................................................................................... 36
4.4 Assessing Vehicle Operations .................................................................................. 36
4.5 Assessing Outdoor Material Storage ....................................................................... 38
4.6 Assessing Waste Management Practices ................................................................ 40
4.7 Assessing the Physical Plant .................................................................................... 41
4.8 Assessing Turf/Landscaping Practices ...................................................................... 42
4.9 Evaluating Private Storm Water Infrastructure .......................................................... 44
4.10 Designating Storm Water Hotspot Status ................................................................. 45
Urban Subwatershed Restoration Manual 11
vii
Table of Contents
Chapter 5: Per
vious Area Assessment (P
A A) ......................................................................
ervious
(PA
......................................................................49
5.1 Basics of Pervious Areas .......................................................................................... 49
5.2 Introduction to the PAA ........................................................................................... 50
5.3 Basic Parcel Characterization ................................................................................ 51
5.4 Assessing Natural Area Remnants ............................................................................ 51
5.5 Assessing Open Pervious Areas ............................................................................... 54
5.6 Initial Management Recommendations .................................................................. 56
Chapter 6: Streets and Storm Drains (SSD) ............................................................................. 59
6.1 Basics of Streets and Storm Drains .......................................................................... 59
6.2 Introduction to the SSD ........................................................................................... 59
6.3 Basic Characterization ........................................................................................... 60
6.4 Street Conditions .................................................................................................... 60
6.5 Storm Drain Inlets and Catch Basins ........................................................................ 63
6.6 Non-Residential Parking Lots ................................................................................... 64
6.7 Recommended Municipal Practices ....................................................................... 65
Chapter 7: Interpreting USSR Data to Develop Better Subwatershed R
estoration Plans ........ 67
Restoration
7.1
7.2
7.3
7.4
7.5
7.6
7.7
7.8
Introduction ............................................................................................................ 67
Basic Data Management and Quality Control ...................................................... 67
Simple Subwatershed Project Counts ...................................................................... 68
Mapping USSR Data ................................................................................................ 68
Deriving Subwatershed and Neighborhood Metrics ................................................ 69
Screening Across Neighborhoods and Subwatersheds ............................................ 71
Source Control Plans .............................................................................................. 72
Additional Subwatershed Project Investigations ...................................................... 72
Appendix A: USSR Field Sheets .................................................................................................A-1
Appendix B: Storm Water Hotspots and Potential Discharge Generators ................................. B-1
Appendix C: Hotspot Field Identification Sheet .......................................................................C-1
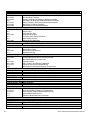
List of TTables
ables
Table 1.
Table 2.
Table 3.
Table 4.
Table 5.
Table 6.
Table 7.
Table 8.
Table 9.
Table 10.
Table 11.
Table 12.
Table 13.
Table 14.
Table 15.
Table 16.
viii
How the USSR Helps in Subwatershed Restoration ..................................................... 3
Seven Steps of the USSR ............................................................................................ 4
Steps in Subwatershed Restoration Where USSR Data Is Explicitly Used ..................... 4
Selection Criteria for USSR Site Assessment ............................................................... 7
USSR Field Equipment Needs .................................................................................... 9
Data Requirements for USSR Field Work .................................................................... 9
Mapping Data for USSR Field Work ......................................................................... 10
Generic USSR Budget for Hypothetical Subwatershed ............................................ 11
Key Behaviors Within Residential Source Areas ...................................................... 13
NSA Factors Assessed and Corresponding Techniques ........................................... 15
Selecting a Grid Scale ............................................................................................ 22
Turf Management Indicators ................................................................................... 22
Pollution Indicators ................................................................................................. 28
Benchmarks Used to Establish Pollution Severity Index ............................................ 29
Benchmarks Used to Establish Restoration Opportunity Index ................................. 30
Potential Pollutants From “Hotspot” Businesses and Activities ................................. 31
Urban Subwatershed Restoration Manual 11
Table of Contents
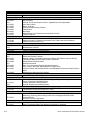
Table 17.
Table 18.
Table 19.
Table 20.
Table 21.
Table 22.
Table 23.
Table 24.
Table 25.
Table 26.
Table 27.
Table 28.
Table 29.
Common Hotspot Operations ................................................................................. 32
HSI Assessment Factors and Possible Restoration Recommendations ..................... 34
Hotspot Land Uses and Letter Designation .............................................................. 36
Hotspot Designation Criteria ................................................................................... 46
Follow-Up Actions for Hotspots and Manuals Where More Information
Can Be Found ......................................................................................................... 47
Possible Pollution Indicator Questions ..................................................................... 47
PAA Factors and Possible Restoration Recommendations ....................................... 49
SSD Assessment Factors and Possible Restoration Recommendations .................... 60
Benchmarks Used to Select SSD Pollution Prevention Strategies .............................. 66
USSR Subwatershed Metrics Data ............................................................................ 71
Example of USSR Data Being Used to Compare Across Subwatersheds ................... 71
Example of USSR Data Being Used to Compare Across Neighborhoods .................. 71
Follow-up Investigations Triggered by USSR Metrics ................................................. 73
List of Figures
Figure 1.
Figure 2.
Figure 3.
Figure 4.
Figure 5.
Figure 6.
Figure 7.
Figure 8.
Figure 9.
Figure 10.
Figure 11.
Figure 12.
Figure 13.
Figure 14.
Figure 15.
Figure 16.
Figure 17.
Figure 18.
Figure 19.
Figure 20.
Figure 21.
Figure 22.
Figure 23.
Figure 24.
Figure 25.
Figure 26.
Figure 27.
Figure 28.
Figure 29.
Figure 30.
Figure 31.
Figure 32.
Figure 33.
Figure 34.
Figure 35.
Figure 36.
Figure 37.
Four USSR Assessment Field Forms ............................................................................. 2
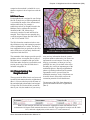
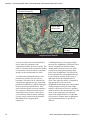
Sample Subwatershed Residential Reconnaissance Map ......................................... 8
Aerial Photo Showing Delineated Neighborhoods in Maidens Choice
Subwatershed in Baltimore, MD .............................................................................. 16
Street Map of Partially Delineated Maidens Choice Subwatershed ........................ 17
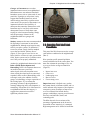
Sanitary Sewer Manhole Cover Popped Open for Inspection ................................ 19
A Typical Lot Demonstrating Yard and Lawn Cover Types ....................................... 20
Example of Bayscaping .......................................................................................... 21
Tree Drip Line .......................................................................................................... 21
Sample Sketch and Ground Cover Calculation and Square Counting Method ...... 22
Sidewalk-Lined Street with Trees............................................................................... 24
Common Driveway, Sidewalk and Curb Conditions ................................................ 24
Different Ways Downspouts Discharge Rooftop Runoff ............................................ 26
Stenciled Storm Drain Inlet ...................................................................................... 26
Overgrown Dry Pond and a Well-Maintained One .................................................. 27
Six Common Operations Found at a Hotspot ........................................................... 33
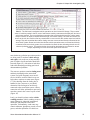
Leak During Vehicle Repair ...................................................................................... 37
Uncovered Fueling Island ........................................................................................ 37
Stain from Uncovered Fueling Area Leading to Storm Drain .................................... 38
Dedicated Truck Wash Site With Runoff Controls ..................................................... 38
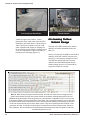
Three Loading Dock Observations ........................................................................... 39
Poor Outdoor Storage at a Garden Center ............................................................. 39
Outdoor Storage Area Connected to Storm Drain System ...................................... 39
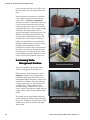
Two Examples of Secondary Containment .............................................................. 40
Improperly Labeled and Stored Restaurant Storage Containers ............................. 40
Dumpster with Open Lid and Stain Showing Evidence of Leakage to Storm Drain ... 41
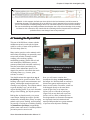
Directly Connected Downspout; Indirectly Connected Downspout ........................ 42
Poorly-Managed Construction Site .......................................................................... 43
Landscaped Parking Lot Island ................................................................................ 43
Non-Target Irrigation Runoff at a Retail Garden Center ........................................... 44
Four Storm Water Treatment Practices Used in Hotspot Areas ................................. 45
Storm Drain Inlet Clogged with Organic Matter and Litter ....................................... 45
Sample Completed Field Form for an Individual Hotspot Site ................................. 46
Two Pervious Area Parcels Commonly Seen in Urban Subwatersheds ...................... 49
Evidence of Beaver Activity ..................................................................................... 52
Trash and Dumping in Two Pervious Areas ................................................................ 53
Indicators that Changes in Municipal Street Maintenance May Be Needed .......... 59
Cul-de-Sac With a Landscaped Island..................................................................... 62
Urban Subwatershed Restoration Manual 11
ix
Table of Contents
Figure 38. Examples of a Curb and Gutter System Going to Storm Drain ............................... 62
Figure 39. Varying Degrees of Trash and Debris Accumulation in Curb and
Gutter and Storm Drain Inlets ................................................................................. 63
Figure 40. Catch Basin Illustration ........................................................................................... 64
Figure 41. USSR Subwatershed Map Showing Pervious Area Cleanup and
Reforestation Project Sites ..................................................................................... 69
Figure 42. Stream Bank Erosion Identified in USA Survey and
Targeting Neighborhood for Retrofit ....................................................................... 70
List of Acronyms and Abbreviations
The following list describes the many acronyms and abbreviations used in the manual to
described the methods, practices, models used to restore small urban watersheds.
GIS:
GPS:
HOA:
HSI:
NPDES:
NSA:
PAA:
RCRA:
SARA:
SCP:
SIC:
SSD:
USGS:
USSR:
x
Geographic Information System
Global Positioning System
Homeowner’s Association
Hotspot Site Investigation
National Pollutant Discharge Elimination System
Neighborhood Source Assessment
Pervious Area Assessment
Resource Conservation and Recovery Act of 1976
Superfund Amendments and Reauthorization Act
Source Control Plan
Standard Industrial Classification
Streets and Storm Drains
United States Geological Survey
Unified Subwatershed and Site Reconnaissance
Urban Subwatershed Restoration Manual 11
Introduction
Introduction
This manual presents the Unified
Subwatershed and Site Reconnaissance
(USSR), a rapid field method to evaluate
potential pollution sources and find restoration
opportunities in subwatersheds. This manual is
organized into seven chapters.
Chapter 1: The Basics of the
Unified Subwatershed and Site
Reconnaissance
This chapter introduces the basics of the
USSR. It describes the four assessment
components and explains how each component
helps identify upland pollution sources and/or
restoration opportunities. Next, it provides
step-by-step guidance on how to conduct a
USSR, and explains how the data acquired fits
into the overall subwatershed plan. The chapter
concludes by introducing methods to organize
and interpret data to develop certain
subwatershed metrics that rank restoration
opportunities and pollution sources.
Chapter 2: PPreparation
reparation Needed
to Conduct the USSR
This chapter outlines the basic mapping,
equipment, field forms, and staffing needed to
perform a USSR. Next, the chapter introduces
desktop analysis steps required to delineate
neighborhoods, identify sites to visit, and
recruit stakeholders. Chapter 2 concludes by
offering staffing and cost estimates to scope
and budget a USSR.
Urban Subwatershed Restoration Manual 11
Chapter 3: Neighborhood
Source Assessment (NSA)
Every subwatershed has many neighborhoods,
which can be significant sources of pollution
and offer many restoration opportunities.
Chapter 3 introduces the basics of the
neighborhood in the context of the USSR, and
introduces the four lawn and yard behaviors
assessed during the NSA. It also provides
detailed guidance on completing the NSA form
in the field. The chapter concludes with tips on
organizing and analyzing NSA data to rank
priority restoration opportunities and determine
pollution severity at the neighborhood scale.
Chapter 4: Hotspot Site
Investigation (HSI)
Hotspots are specific operations in a
subwatershed that may generate high storm
water pollution. This chapter introduces the
basics of hotspots and the six areas common to
each hotspot that are assessed during the HSI.
It also provides specific guidance on
completing the HSI field form, and concludes
by ranking the severity of hotspot sites and
recommending pollution prevention practices
that may be warranted.
Chapter 5: PPer
er
vious Area
ervious
Assessment (P
A A)
(PA
Natural area remnants and large parcels of
open land are found in every subwatershed,
and they represent opportunities for
reforestation and restoration. This chapter
introduces the basics of pervious areas and
introduces the PAA field form. It also offers
guidance on how to complete the PAA in the
field and make specific management
recommendations for reforestation and
restoration.
xi
Introduction
Chapter 6: Streets and Storm
Drains (SSD)
This chapter presents the basics of urban
streets and storm drains, and introduces the
SSD form used to assess subwatershed
maintenance practices, and parking lot
retrofits. The chapter concludes with detailed
guidance on completing the SSD form and
making specific recommendations on better
municipal practices.
Appendices
Copies of USSR field forms are provided in
Appendix A. Appendix B offers specific
information on land uses, associated Standard
Industrial Classification codes, and NPDES
regulatory status. Appendix C presents a “cheat
sheet” that can be taken into the field when
conducting the USSR to help identify hotspots.
Chapter 7: Interpreting USSR
Data to Develop Better
Subwatershed R
estoration Plans
Restoration
The final chapter discusses seven methods
used to translate USSR data into effective
upland restoration projects, including data
management, mapping, quality control,
subwatershed metrics, and source control
analysis. The chapter ends by offering
information on more detailed follow-up
investigations needed to assess the feasibility
and design of restoration practices.
xii
Urban Subwatershed Restoration Manual 11
Chapter 1: The Basics of the Unified Subwatershed and Site Reconnaissance
Chapter 1: The Basics of the Unified
Subwatershed and Site R
econnaissance
Reconnaissance
Urban subwatershed restoration has
traditionally focused on the stream corridor,
with less attention paid to upland areas where
neighborhoods and businesses are located.
However, these upland areas are important in
subwatershed restoration, since they contribute
storm water pollutants to the stream corridor.
The Unified Subwatershed and Site
Reconnaissance (USSR) is designed to assess
these upland areas for behaviors that can
potentially influence water quality and to
identify promising restoration project
opportunities.
The USSR is a rapid field survey to evaluate
potential pollution sources and restoration
opportunities within urban subwatersheds. It
was developed to help watershed groups,
municipal staff, and consultants quickly assess
subwatershed restoration potential. The USSR
is quick and inexpensive, applies over a wide
range of urban conditions, and has four major
assessment components:
Neighborhood Source Assessment (NSA)
that profiles pollution source areas,
stewardship behaviors, and residential
restoration opportunities within individual
neighborhoods.
Hotspot Site Investigation (HSI) that ranks
the potential severity of each commercial,
industrial, municipal or transport-related
hotspot found within a subwatershed.
Pervious Area Assessment (PAA) that
evaluates the potential to reforest turf areas
or restore natural area remnants at all open
parcels within a subwatershed.
Streets and Storm Drains (SSD) that
measures the average pollutant
accumulation in the streets, curbs, and
catch basins of a subwatershed, and
investigates the on-site retrofit potential
for parking lots.
Urban Subwatershed Restoration Manual 11
The concept behind the USSR is to provide a
quick but thorough characterization of all
upland areas to identify major source areas that
are contributing pollutants to the stream and
control them through source controls, pervious
area management, and improved municipal
maintenance.
The USSR is a “windshield survey” that
requires you to drive down every street in a
subwatershed to locate possible restoration
sites and assess their restoration potential, and
determine specific pollution sources and
hotspots. The USSR can be a powerful tool for
shaping your initial subwatershed restoration
strategy and locating upland restoration
projects that deserve further investigation.
This user’s manual provides extensive
guidance on how to conduct each assessment,
including desktop preparation, field analysis,
and data management and interpretation.
Together, the four USSR assessments produce
a wealth of useful data to identify and locate
potential restoration practices in a
subwatershed, including the following:
Lawn Care Education
Pet Waste Management
Natural Landscaping and Reforestation
Storm Water Pond Maintenance
Bufferscaping
Potential for Rooftop Disconnection
On-site Residential Retrofits
Hotspot Permit Enforcement
Targets for Hotspot Pollution Prevention
Parking Lot Retrofits
Illicit Discharge Investigations
Upland Soil Reclamation
Upland Reforestation
Natural Area Restoration
Storm Drain Stenciling
Street Sweeping
Catch Basin Clean-outs
1
Chapter 1: The Basics of the Unified Subwatershed and Site Reconnaissance
The USSR is used to rapidly assemble an initial
inventory of subwatershed restoration practice
sites that merit additional investigation. USSR
data is also commonly aggregated to produce
various subwatershed “metrics” and maps that
are used to devise an initial upland restoration
strategy. The USSR is intended to be flexible.
You are encouraged to customize the
assessment forms to meet your own local
needs, and only use the forms you need.
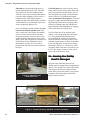
1.1 FFour
our Assessment
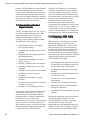
Components of the USSR
The USSR employs four different assessment
components to identify and record potential
pollution sources and subwatershed restoration
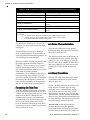
projects (Figure 1). A specific field form is
associated with each component:
Neighborhood Source Assessment (NSA)
Hotspot Source Investigation (HSI)
Pervious Area Assessment (PAA)
Streets and Storm Drains (SSD)
You can use all four field forms, or just the ones
that suit your purposes.
1.2 How the USSR Helps
Identif
y PPollution
ollution Sources
Identify
and Restoration
Opportunities
The USSR helps restoration planning by
identifying potential pollution sources in the
upland areas of the subwatershed that may
adversely affect water quality, and assembling
a comprehensive initial inventory of promising
restoration projects (Table 1). The USSR also
identifies additional stakeholders in each
subwatershed that can be invited to join the
restoration planning process.
The USSR generates a wealth of data that can
help you narrow your focus on those behaviors,
practices, or sites that have the greatest impact
on pollutant load or runoff reduction in the
subwatershed. After analyzing your USSR
data, you will have a better handle on what
restoration practices are appropriate for
specific neighborhoods, hotspots and large
pervious areas. Later chapters describe the
corresponding restoration practices that can
address these problems.
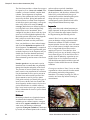
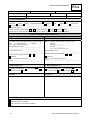
Source: Amber WIdmayer
Figure 1: Four USSR Assessment Field Forms
2
Urban Subwatershed Restoration Manual 11
Chapter 1: The Basics of the Unified Subwatershed and Site Reconnaissance
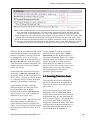
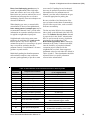
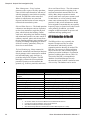
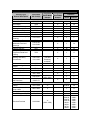
Table 1: How the USSR Helps in Subwatershed Restoration
Neighborhoods
• Evaluates pollutant-producing behaviors in individual neighborhoods and assigns a
pollution severity index for screening purposes
• Rates each neighborhood for overall restoration potential and identifies specific
restoration projects
• Examines the feasibility of on-site storm water retrofits
• Indicates restoration projects that may require more direct municipal assistance for
implementation (tree planting, storm drain stenciling, etc.)
Hotspots
• Creates an inventory of storm water hotspots, including regulated and non-regulated
sites
• Rates the severity of each hotspot with regard to its potential to generate storm
water runoff or illicit discharges
• Suggests appropriate follow-up actions for each hotspot, including referral for
immediate enforcement
• Examines the feasibility of on-site storm water retrofits
Pervious Areas
• Evaluates the current condition of natural area remnants and their potential
management needs
• Determines the reforestation potential of large pervious areas
Streets and Storm Drains
• Estimates the severity of pollutant accumulation on roads and within storm drain
systems
• Assesses large parking areas for storm water retrofit potential
• Rates the feasibility of four municipal maintenance strategies
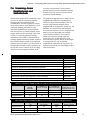
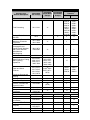
1.3 Basic Steps to Conduct a
USSR Survey
The USSR is performed in three phases: a
desktop analysis, the actual field survey, and a
post-field data analysis. The desktop analysis is
needed before going out into the field and often
consumes the most time, simply because a lot
of data and mapping must be compiled. Table 2
summarizes the seven basic steps of the USSR.
1.4 Where and When Data FFits
its
Into the Subwatershed
Planning PProcess?
rocess?
The USSR is extremely helpful in many of the
steps of subwatershed restoration plan
development. For example, USSR data are
frequently used to identify additional field
investigations to craft the subwatershed
restoration strategy, and can also help identify
additional stakeholders to involve in the planning
Urban Subwatershed Restoration Manual 11
process. The USSR data also help derive input
variables to estimate the potential effectiveness
of restoration projects in reducing pollutant
loads. In addition, USSR data can be used to
screen restoration potential both in individual
subwatersheds and across all the
subwatersheds located within a watershed.
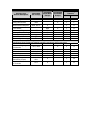
Table 3 describes the steps in the subwatershed
planning process where USSR data is explicitly
used.
The USSR is normally combined with its
counterpart, the Unified Stream Assessment
(USA), which documents conditions and
restoration opportunities within the stream
corridor. Together, the surveys provide a
comprehensive picture of the restoration
potential in a subwatershed and insight into the
relationship between upland areas and the
stream corridor. This information can help
compare restoration potential across
subwatersheds and prioritize restoration
projects with the greatest overall benefit to
stream health.
3
Chapter 1: The Basics of the Unified Subwatershed and Site Reconnaissance
Post-Field
Field
Pre-Field
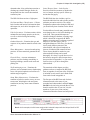
Table 2: Seven Steps of the USSR
Step 1:
Gather required
information
NPDES permittees
Existing neighborhood maps
Municipal maintenance schedule for roads
Census data
List of HOA and contact information
Current development projects
Mapping data and aerial photographs
Step 2:
Generate field maps
Delineate subwatersheds
Delineate residential neighborhoods
Review environmental databases for regulated hotspots
Perform business permit review for additional hotspots
Put together emergency contact list
Step 3:
Conduct the USSR
Drive all roads
Evaluate residential neighborhoods (NSA form)
Survey all hotspot locations (HSI form)
Complete PAA form for all pervious area sites
Complete SSD form at select storm drains
Take photos and GPS readings
Step 4:
Verify data/maps
Rectify differences between pre-fieldwork maps and field
notes
Identify additional data to be collected
Step 5:
Data entry
Enter data from field forms into a spreadsheet or GIS.
This involves downloading GPS unit and digital cameras
(or getting film developed), and recording details on field
maps
Step 6:
Produce list and map of
candidate sites for each
subwatershed
Step 7:
Compile data for all
subwatersheds into a
single table
Screen retrofit, restoration, and pollution prevention
projects to identify sites where further investigation is
needed
Develop subwatershed metrics to develop initial
restoration strategy
Table 3: Steps In Subwatershed Restoration Where
USSR Data Is Explicitly Used
Name
Comparative Subwatershed Analysis
Detailed Subwatershed Analysis
Stakeholder Identification and Recruitment
Initial Subwatershed Restoration Strategy
Candidate Project Investigations
Input to Subwatershed Treatment Analysis
More information on the subwatershed planning process is provided in Manual 2.
4
Urban Subwatershed Restoration Manual 11
Chapter 1: The Basics of the Unified Subwatershed and Site Reconnaissance
1.5 How to Organize and
Interpret USSR Data
The USSR gathers a large amount of data to
prepare an initial restoration strategy for each
subwatershed. This data must be organized in a
way that is easily transferable to stakeholders,
funders, and other municipal agencies. USSR
outputs can be useful to explain the current
subwatershed condition, identify projects that
may alleviate any problems, and identify
residents in each subwatershed that should be
involved in the subwatershed planning process.
For example, USSR data can be condensed into
subwatershed metrics that describe the
following:
Fraction of the subwatershed with on-site
retrofit potential
Fraction of the subwatershed where turf is
intensively managed
Number of neighborhoods where pollution
prevention education can be targeted
Number of storm water treatment practices
and maintenance needs
Density of storm water hotspots and
associated land uses
Urban Subwatershed Restoration Manual 11
Fraction of the subwatershed with upland
reforestation potential
Location of natural area remnants that
merit greater protection or restoration
Fraction of streets and storm drains that
can be effectively treated with maintenance
practices
USSR data can also be portrayed on maps, and
analyzed by spreadsheets. Based on these
analyses, you can select the upland restoration
strategies that make the most sense for your
subwatershed, and identify the specific project
locations that require additional field and
desktop investigation. The most common
desktop investigation is the Source Control Plan
(SCP), which is used to define the focus,
targets, methods and scope for residential and/
or business source control programs in the
subwatershed. The SCP recommends specific
outreach, education and municipal assistance
tools to control the major pollution source(s) in
your subwatershed. Chapter 7 discusses the
many different ways USSR data can be
incorporated into your subwatershed restoration
plan.
5
Chapter 1: The Basics of the Unified Subwatershed and Site Reconnaissance
6
Urban Subwatershed Restoration Manual 11
Chapter 2: Preparation Needed to Conduct the USSR
Chapter 2: PPreparation
reparation Needed to
Conduct the USSR
2.1 What Do I Need to Get
Star
ted?
Started?
The USSR requires minimal field equipment,
mapping, and staff effort, although access to
Geographic Information Systems (GIS) data
layers can greatly enhance the efficiency of the
survey. Timing is important to consider when
scheduling USSR fieldwork. Two scheduling
decisions need to be made: the season, and the
day of the week that will provide the most
useful USSR data. In general, the USSR is
most useful in spring, summer, or fall. Winter
surveys are not recommended, especially for
NSA and PAA components. The day of the
week is important due to its influence on the
NSA and HSI components. While weekends
are probably best to accurately characterize
residential behaviors such as car washing, lawn
care, and car maintenance, weekday surveys of
hotspots are more likely to discover discharges
from storm water hotspots.
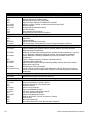
Maps
Good maps are essential for the USSR. Easy
desktop analysis is needed to screen the
individual neighborhoods, parcels, and
hotspots to be investigated. These sites should
be identified and delineated based on
predetermined selection criteria to keep the
number of sites to a manageable level. Some
selection criteria rely on a minimum site area
requirement to ensure that restoration is
feasible. Table 4 shows some examples of
selection criteria used to identify sites.
Basic USSR field maps consist of the
following:
A minimum 1": 2000’ scale (e.g., scale of a
7.5 minute USGS quadrangle sheet) street
map and/or aerial photograph. Street maps
offer the advantage of simplicity,
availability, and well-labeled road
networks and urban landmarks, but fall
short on land use details that recent aerial
photographs provide.
The location of all known NPDES
industrial storm water, SARA 312, and
RCRA permittees, as well as storm water
treatment practices.
All publicly-owned pervious areas greater
than two acres, and all privately-owned
pervious areas greater than five acres.
Boundaries of all neighborhoods and major
commercial, industrial and institutional
parcels.
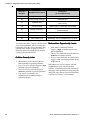
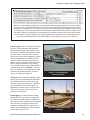
Table 4: Selection Criteria for USSR Site Assessment
USSR
Field Form
Land Use
Selection Criteria
NSA
Residential
Visit all neighborhoods and sample a subset of individual
homes
HSI
Commercial
Industrial
Institutional
Municipal
Transport - Related
Visit all regulated hotspots and priority non-regulated
hotspots
PAA
Pervious Areas
SSD
Streets and Storm
Water Conveyance
Visit all publicly-owned pervious areas > 2 acres and all
privately-owned pervious areas > 5 acres
Evaluate road and storm drain conditions at random, preselected points
Evaluate all parking lots > 2 acres
Urban Subwatershed Restoration Manual 11
7
Chapter 2: Preparation Needed to Conduct the USSR
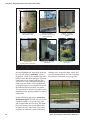
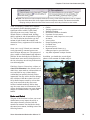
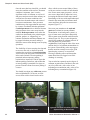
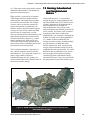
To prevent cluttering maps with too much
detail, you should generate two base maps:
one that delineates pervious areas and
neighborhoods, and a second one that shows
the locations of potential storm water
hotspots. Subwatershed reconnaissance maps
are then developed that show the locations of
sites, neighborhoods, parcels, and hotspots to
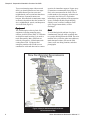
visit in the field (Figure 2).
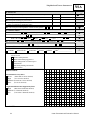
Equipment
The USSR requires relatively little field
equipment, including measuring tapes,
cameras, and field forms (Table 5). GPS units
are helpful to mark locations if you need to
track data spatially. Many GPS units are
relatively inexpensive, with adequate units
costing about $150. Cell phones and
emergency numbers allow field crews to
communicate with each other and to contact
agencies for immediate response. Pepper spray
is sometimes recommended if stray dogs are
likely to be encountered in the field. A list of
contact numbers for emergency assistance can
be pasted to the field crew’s clip board to
immediately report problems to the appropriate
agency. Examples include illegal dumping,
sanitary sewer overflows, hazardous waste
spills, clogged storm drains, or illicit
discharges.
Staff
To avoid the logistical problem of trying to
simultaneously navigate while recording data,
two people should perform the USSR. One crew
member drives, while the other notes addresses,
marks hotspot locations, fills out the field
forms, scouts out dining locations, and takes
photographs.
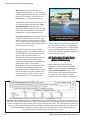
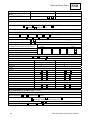
Figure 2: Sample Subwatershed Residential
Reconnaissance Map
8
Urban Subwatershed Restoration Manual 11
Chapter 2: Preparation Needed to Conduct the USSR
2.2 Desktop Analysis to Suppor
Supportt
a USSR Sur
vey
Survey
possess useful data. The lack of complete data,
however, should not prevent you from getting
started.
Before you go out to the field, a desktop
analysis is needed to acquire current mapping
and subwatershed data. These data are then
transferred to a working reconnaissance map to
make field site visits more efficient and help
organize post-field data analysis.
Many local agencies also have GIS mapping
data layers or paper maps that can be used to
create USSR field maps. Table 7 lists layers
that are both required and helpful to generate
USSR field maps. Although aerial photos are
listed as optional, they are extremely helpful,
and every effort should be made to acquire
them. Aerial photos make fieldwork easier and
enable easier computation of variables, such as
lot size and pervious area locations.
Local agencies often possess most of the data
needed for the desktop analysis, although it is
often housed in many different departments.
These data need to be compiled and
consolidated before fieldwork begins. Table 6
lists some of the local agencies that may
Table 5: USSR Field Equipment Needs
Equipment/Data
Aerial photos
Basic street map
Camera
Safety items: cell phone, pepper spray, first aid kit
Emergency contact numbers
Field Forms, clipboard, pencils
Flashlight
GPS unit
Screwdriver
HOA data
Authorization letter from local government
Measuring tape
Pry bar
Sediment measuring rod
NSA
X
X
X
X
X
X
HSI
X
X
X
X
X
X
X
X
X
X
PAA
X
X
X
X
X
X
X
X
X
SSD
X
X
X
X
X
X
X
X
X
X
X
X
X
X
X
Table 6: Data Requirements for USSR Fieldwork
•
Industrial storm water NPDES permittees (State or County Environmental Office)
•
Prior restoration activities (Environmental Office, Department of Parks, Department
of Public Works)
•
Existing neighborhood maps (Office of Planning)
•
Municipal maintenance schedule for roads (Department of Public Works)
•
Census data (Office of Planning or Community Development)
•
List of Homeowner’s Associations and contact information (Office of Planning)
•
Current development projects and permits (Office of Planning, Zoning)
•
Wetland forest projects (State wetland inventory maps)
Urban Subwatershed Restoration Manual 11
9
Chapter 2: Preparation Needed to Conduct the USSR
Table 7: Mapping Data for USSR Fieldwork
Useful
•
Aerial photos
•
Utilities (sewer, storm drain system)
•
Soils
Roads
•
Storm water treatment facilities
Topography
•
Point sources (storm water treatment plants, NPDES
Tax maps with parcels
permittees)
Vegetative cover
•
Buildings/parking lots
•
State wetland inventory map
Required
•
•
•
•
2.3 Site and Neighborhood
Delineation/Mapping to
Suppor
Supportt the USSR
storm water agency, state environmental
agencies, or the regional EPA office. The EPA
also has several national databases to retrieve
data on industrial and municipal dischargers.
The next step involves delineating
subwatersheds and individual neighborhoods,
and locating known hotspots and open parcels.
This step is essential to help plan your time and
routes in the field.
Efforts should also be made to identify
potential non-regulated hotspots during the
desktop analysis. Many communities have
extensive business databases that are organized
by Standard Industrial Classification (SIC)
codes. By comparing each database to a list of
likely hotspots, you can generate a list of
potential hotspots, along with contact
information and the actual address. Appendix
B presents a simple method to perform
potential hotspot screening. Keep in mind that
these databases are not always accurate or
inclusive, so expect to find additional hotspots
while driving the subwatershed.
Subwatershed Delineation
The boundaries of the watershed and its
component subwatersheds should be delineated
first. Subwatersheds generally have a drainage
area of 10 square miles or less and include
streams ranging from first to third order. In
practice, you will need to exercise some
discretion in drawing actual subwatershed
boundaries. Manual 2 provides practical
techniques to help delineate subwatersheds.
Neighborhood Delineation
Subwatersheds should be further subdivided
into individual neighborhood units that will be
examined during the NSA. Delineation of
neighborhood units is somewhat subjective,
and several options exist to define them. The
easiest option is to use existing subdivisions
that have already been mapped. Other options
include delineating neighborhood units based
on similar lot size, similar age of development,
or the boundaries of existing homeowner or
community associations.
Hotspot Site Identification
Existing business and permitting databases
should be screened to locate regulated hotspots
and determine when they were last inspected.
These databases may be housed in the local
10
Per vious Area Site Identification
Possible sites for pervious area restoration are
usually identified by analyzing aerial
photographs or GIS layers. The choice of the
minimum size for pervious area parcels should
be based on staff, budget, and resources.
Generally, all natural area remnants and other
publicly-owned pervious areas larger than two
acres should be delineated. Privately-owned
pervious areas greater than five acres may also
be delineated.
Parking LLot
ot Site Identification
Aerial photos or detailed maps can be analyzed
to find large parcels of contiguous impervious
cover, such as institutional, municipal, or
commercial parking lots. These parking lots are
often good potential retrofit sites, and are
examined during the Streets and Storm Drain
(SSD) assessment.
Urban Subwatershed Restoration Manual 11
Chapter 2: Preparation Needed to Conduct the USSR
Stak
eholder Identification
Stakeholder
Many communities have databases on
homeowner associations, civic associations,
and other community groups. These should be
analyzed to identify new stakeholders and get
reliable data on neighborhood characteristics
for the NSA. Personal visits during fieldwork
are often a good opportunity to recruit new
stakeholders to the restoration planning
process.
2.4 Budgeting and Scoping a
USSR Sur
vey
Survey
The budget for a full USSR will vary for each
subwatershed, but averages $2,500-$7,400.
The desktop analysis and mapping steps
usually consume the most staff time, so be sure
to budget enough time for these important
steps. Up to a week of staff time may be
needed to perform the desktop analysis. Also
NSA, HSI, PAA, and SSD forms should be
filled out with as much characterization data as
possible before starting fieldwork. The desktop
analysis gives you a better handle on the
number of sites your field crew will need to
visit.
Several factors come into play when budgeting
and scoping a USSR, including the area of the
subwatershed, field crew experience, available
staff, equipment needed, and the number of
sites to visit. The desktop analysis step can
help estimate the total area to be surveyed, so
that you can estimate staff time needed. You
may want to plan for more staff time if a large
number of hotspots or neighborhoods are
expected. At least a week of staff time should
always be allocated to process and interpret
USSR data (e.g., data entry, quality control,
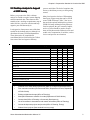
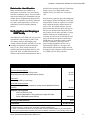
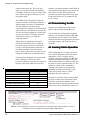
and data evaluation). Table 8 provides a
generic budget breakdown for the cost of
performing the USSR on a 10 square mile
subwatershed. Note that this budget does not
account for using volunteers, which can result
in a USSR cost of as little as $2,500.
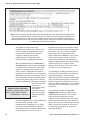
Table 8: Generic USSR Budget for Hypothetical Subwatershed
Salaries
Pre-field desktop analysis
Training volunteers (2 staff, 24 hrs each)
Generating field maps Watershed Planner (40 hrs)
$1,200
$1,000
Field work
Performing USSR (16 staff days)
$3,200
Post-field desktop analysis
Data processing (data entry/evaluation, quality control) Watershed Planner
(40 hrs)
$1,000
Supplies and Equipment
GPS unit ($150 per unit)
Camera (disposables + film processing or digital; $75-300)
Street maps/aerial photos ($25-50)
Printing and Reproduction
Total Costs
$250-500
$500
$7,150 - $7,400
Notes
• Budget assumes a 10 square mile, moderately urbanized subwatershed
• These cost estimates assume an hourly rate of $25. To get accurate estimates for your subwatershed,
enter your expected staff costs (which can be zero for trained volunteers) or your prevailing hourly wage.
Urban Subwatershed Restoration Manual 11
11
Chapter 2: Preparation Needed to Conduct the USSR
12
Urban Subwatershed Restoration Manual 11
Chapter 3: Neighborhood Source Assessment (NSA)
Chapter 3: Neighborhood Source
Assessment (NSA)
3.1 Basics of Neighborhoods
Neighborhoods are an important focus for
subwatershed restoration. Each residential
neighborhood has a distinctive character in
terms of age, lot size, tree cover, drainage,
lawn size, general upkeep, and resident
awareness. In addition, neighborhoods are
rather homogenous when it comes to resident
behaviors, stewardship, and involvement in
restoration efforts. These unique
characteristics directly influence the ability to
widely implement restoration practices, such
as on-site retrofits, neighborhood source
controls, and better stewardship. While some
neighborhood characteristics can be discerned
from maps and aerial photographs, field
assessments are needed to get quantitative data
on pollutant source areas and their restoration
potential.
The neighborhood is the fundamental unit for
residential source control. Residential pollution
sources can only be assessed neighborhood-byneighborhood within a subwatershed. The
residential behaviors that contribute to storm
water quality problems can be systematically
assessed by the Neighborhood Source
Assessment (NSA), which looks at four
specific source areas of the “average”
neighborhood:
Yards and Lawns
Driveways, Sidewalks, and Curbs
Rooftops
Common Areas
Table 9 describes the polluting behaviors
measured by the NSA, and the next section
describes the four neighborhood source areas
where they can occur.
Table 9: Key Behaviors Within Residential Source Areas
Source Area
Yards and Lawns
Driveways, Sidewalks, and Curbs
Rooftops
Common Areas
Urban Subwatershed Restoration Manual 11
Polluting Behavior
Over-Fertilization
Excessive Pesticide Application
Over-Watering
Extensive Turf Cover
Tree Clearing
Improper Yard Waste Disposal
Soil Compaction
Soil Erosion
Failing Septic Systems
Pool Discharges
Car Washwater Flows
Hosing/Leafblowing
Application of Salts and other Deicers
Dumping of Household Hazardous Waste
Dumping of Oil/Antifreeze
Downspout Connections
Added Impervious Cover/Exposed Soils
Pet Waste
Unmaintained Storm Water Practices
Buffer Encroachment
Storm Drain Dumping
13
Chapter 3: Neighborhood Source Assessment (NSA)
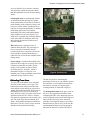
Yards and Lawns - Individual yards account for
about 70% of the turf cover in urban
subwatersheds, and usually the majority of
total pervious cover. Yards tend to be
intensively managed, and can be a potentially
significant source of nutrients, pesticides,
sediment, and runoff.
At least 10 different behaviors in the yard can
have an impact on subwatershed quality (Table
9), including lawn fertilization, pesticide use,
watering, landscaping, and yard waste.
Research has shown a link between these
behaviors and water quality problems in local
streams. Yard behaviors tend to be similar
within a neighborhood, since most individual
lots often have the same area, age, and tree
canopy cover. The NSA quickly profiles the
most prevalent lawn care and landscaping
behaviors in order to target the education,
enforcement, and municipal stewardship
programs needed to change them.
Driveways, Sidewalks, and Curbs – Driveways,
sidewalks, and curbs are endemic to nearly all
neighborhoods, and they often provide a direct
link to the street and storm drain system. As a
result, many behaviors that occur on driveways
and sidewalks can cause pollutants to directly
wash off into the storm drain system. Notable
examples include washing cars, hosing
driveways, and applying deicing compounds
during the winter. These behaviors can
introduce nutrients, oil, organic carbon,
sediment, and chlorides into the storm drain
system.
Rooftops - Residential rooftops are another
focus of the NSA. Rooftop runoff can contain
many pollutants and produce storm water
runoff. The NSA is used to calculate the
proportion of neighborhood rooftops with
downspouts that are directly connected to the
storm drain system. If most downspouts are
directly connected, this presents a potential
restoration opportunity if they are disconnected
by rain barrels and rain gardens. These on-site
residential retrofits can help reduce or delay
storm water runoff delivered to a stream (see
Manual 3). Stream hydrology can be improved
and pollutants can be reduced if a large fraction
of neighborhood rooftops can be disconnected.
14
However, downspout disconnection is not
always feasible in all neighborhoods; small
lots, basements, impermeable soils, and steep
slopes can constrain widespread
implementation.
The NSA also examines whether new
“rooftops” are being built in the neighborhood,
such as additions, decks, outbuildings, and
residential redevelopment. Collectively, these
additions and expansions can sharply increase
neighborhood impervious cover and become a
source of sediment erosion during construction.
If the NSA reveals significant redevelopment
activity in a neighborhood, it may indicate a
need for residential erosion and sediment
control and education.
Many residents also store household hazardous
wastes, such as fertilizers, pesticides, paints,
and oil. The NSA asks whether garages are
present, which provides clues as to where and
how household hazardous wastes are managed.
Common Areas - Newer neighborhoods often
have considerable areas of community open
space in the form of stream buffers, protected
flood plains, storm water management
practices, rights-of-way, and pocket parks.
Common areas are an important focus of the
NSA, even though they are located outside of
the individual home site. Specific behaviors
assessed in common areas include how
residents dispose of pet waste, how storm
water practices are maintained, how buffers
and natural areas are managed, and whether
storm drains are stenciled. It is also helpful to
assess the general upkeep of common areas to
determine whether a homeowner or
neighborhood association is active.
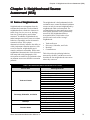
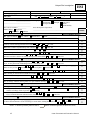
3.2 Introduction to the NSA
Urban neighborhoods have a large number of
potential pollution sources, but also offer many
opportunities to educate residents about
stewardship activities that can improve stream
quality. Table 10 summarizes the neighborhood
factors assessed by the NSA and how they are
linked to specific stewardship or restoration
techniques.
Urban Subwatershed Restoration Manual 11
Chapter 3: Neighborhood Source Assessment (NSA)
The NSA quantifies potential pollution sources
within neighborhoods, and identifies potential
residential restoration projects. To fill out an
NSA field form, you need to drive every street
in the neighborhood and subsample individual
lots, curbs, catch basins, and common areas.
Key outputs from the NSA are an index of the
severity of neighborhood non-point source
pollution and an index of potential
neighborhood restoration opportunities.
The NSA field form is composed of six parts:
Neighborhood Characterization – Compiles
basic information about the neighborhood.
Driveways, Sidewalks, and Curbs – Estimates
pollutant accumulation and evaluates
housekeeping on these impervious areas.
Rooftops – Quantifies how rooftop runoff is
managed on the average residential lot.
Common Areas – Evaluates practices in
common neighborhood areas, such as storm
water ponds, buffers, and flood plains.
Recommended Actions and Initial Assessment –
Makes specific recommendations on key
residential behaviors that could be improved,
and derives an index that rates pollution
severity and restoration opportunities in the
neighborhood as a whole.
Yard and Lawn Conditions – Assesses
vegetative cover and management practices on
the typical lawn.
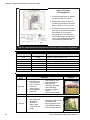
Table 10: NSA Factors Assessed and Corresponding Techniques
Source Area
Yards and
Lawns
Driveways,
Sidewalks, and
Curbs
Rooftops
Common Areas
Neighborhood Factor
Assessed
High management turf
Potential pesticide use
Non-target irrigation
Extensive turf cover
Low forest canopy
Improper yard waste disposal
Soil erosion
Construction activity
Presence of septic systems
Presence of swimming pools
Driveway/curb flows
Driveway conditions
Outdoor car maintenance
Sidewalk zone conditions
Downspout connection
Evidence of pet waste
Presence of storm water ponds
Turf cover in open space
Condition of storm drain inlets
Sidewalk zone
Evidence of dumping
Corresponding Stewardship Technique*
Reduced Ferilizer Use (N-1, N-7)
Reduced pesticide use (N-2)
Xeriscaping (N-3)
Natural landscaping (N-4)
Tree planting (N-5)
Yard waste composting (N-6)
Erosion repair (N-8)
Single lot control (H-9 and N-17)
Septic system clean-outs (N-9)
Safe pool discharge (N-10)
Safe car washing (N-11)
Driveway sweeping (N-12, N-13)
Car fluid recycling (N-15)
Pet waste pick-up (N-18), Streetscaping (RP-10)
Downspout disconnection or treatment (N-16,
OS-15 to OS-17)
Pet waste education/enforcement (N-18)
Storm water maintenance (N-19)
Bufferscaping (N-20), reforestation (F-5)
Storm drain stenciling (N-21)
Streetscaping (SR-5)
Prevention/removal of dumping (RP-10)
*The code in parentheses refers to the appropriate restoration profile sheet in the Restoration Manual Series. Codes are as follows:
•
OS- and SR- sheets can be found in Manual 3: Storm Water Retrofit Practices
•
N- and H- sheets can be found in Manual 8: Pollution Source Control Practices
•
RP- sheets can be found in Manual 9: Municipal Practices and Programs
Urban Subwatershed Restoration Manual 11
15
Chapter 3: Neighborhood Source Assessment (NSA)
Desktop Analysis
The most important desktop analysis is the
delineation of neighborhoods within the
subwatershed. Individual neighborhoods can be
grouped together if they have similar
characteristics. For example, three adjacent
neighborhoods with the same basic lot size,
road widths, setbacks, and house types can be
lumped into a single unit neighborhood. This
should be verified in the field, and adjustments
made to group similar neighborhoods or
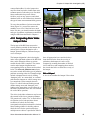
ungroup dissimilar ones. Two methods of
neighborhood delineation are offered here: one
using aerial photographs, and the other using
street maps.
Using aerial photographs. Local planning
departments should be consulted to see if they
have GIS data layers and/or aerial photos to
analyze neighborhoods. If these are not
available, data may be available on websites
such as www.gisdatadepot.com. When GIS
data is available, it can be used to easily
delineate neighborhoods, especially if data
layers include tax maps and parcel boundaries.
If only aerial photos are available, simply print
the photos and use them to delineate
neighborhoods manually using the method
described here.
On the printed photo, highlight or use a marker
to circle each distinct neighborhood and record
its Unique Site ID. Figure 3 shows how an
aerial photo was used to delineate a
neighborhood for an NSA conducted in
Baltimore, MD. Pink circles on the photos
designate discrete neighborhoods, and the
Unique Site ID is recorded and highlighted in
yellow. Major roads were labeled in the office.
The white circle identifies a specific
neighborhood for which a sample NSA form
will be completed.
Using street maps. Street maps often label
major neighborhoods and subdivisions, and
you can use major roads to divide them, as
needed. You will want to check tax maps to
verify that these neighborhoods have similar
lot dimensions (e.g., setbacks, house sizes, lot
sizes, and age). This method requires more
effort since you often need to adjust boundaries
based on field observations. Also, make sure
you have the most recent street map available,
since many neighborhoods are being
continually developed or redeveloped. Figure 4
illustrates a neighborhood using a standard
street map.
Field W
ork
Work
Once neighborhoods are delineated, you can
map out a route through the subwatershed. You
should assess every neighborhood identified on
your map using a “random sample” method. An
NSA form should be completed for at least
three randomly-selected lots in the
neighborhood. Together, the lot samples
represent the average conditions for the
neighborhood as a whole. Randomly selecting
lots from aerial photos or tax maps is ideal, but
if this cannot be done, lots can be randomly
selected in the field. Each NSA form should
include a sketch of the lot with the driveway,
house, sidewalk, landscaping features, and any
forest canopy cover.
Figure 3: Aerial Photo Showing Delineated
Neighborhoods in Maidens Choice Subwatershed in
Baltimore, MD
16
As an alternative, crews can drive the entire
neighborhood and make a composite sketch of
the “average lot” on a single NSA form. The
Urban Subwatershed Restoration Manual 11
Chapter 3: Neighborhood Source Assessment (NSA)
composite sheet method is suitable for crews
that have acquired a lot of experience with the
NSA.
NS
A FField
ield FForms
orms
NSA
Each neighborhood is assigned its own Unique
Site ID. A simple way to label neighborhoods
is to combine the names of the subwatershed
and the subdivision. For example, a
subdivision called City Heights located in the
Maidens Choice subwatershed would be
identified as MC-CH, followed by a
consecutive number for each individual lot
sampled. Thus if three lots are sampled, they
would be assigned Unique Site IDs of MC-CH1, MC-CH-2, and MC-CH-3.
The NSA form also contains an index to rate
the pollution severity and restoration potential
of the neighborhood as a whole. The index is
best computed when you get back to the office
unless field crews are extremely familiar and
experienced with the NSA.
The remainder of this chapter provides specific
guidance on how to complete the six parts of
the NSA form. A snapshot of the part of the
field form under discussion is included in each
section, and a copy of the full field sheet is
included in Appendix A.
3.3 Characterizing the
Neighborhood
The top part of the NSA form is used to record
locational information about the neighborhood
(Box 1). You are asked to provide the name of
the watershed and subwatershed, and assign it
a Unique Site ID. You should also record the
date of your visit, the members of your survey
Figure 4: Street Map of the Partially
Delineated Maidens Choice Subwatershed
team, and any information about the camera
and photo numbers taken at the site. Photos are
important for several reasons. First, they can
help jog your memory of what you saw at a
particular site once you are back in the office.
Secondly, they can be an important part of the
stakeholder process. Showing neighborhood
photos of pollution problems and restoration
opportunities can be a powerful tool for
stakeholder meetings. Lastly, field photos can
be useful when it comes time to assess the
restoration potential of individual homes.
The next part of the NSA form characterizes
general information about the neighborhood
(Box 2).
Box 1: In this example, the field crew assessed a neighborhood within the Maidens Choice
subwatershed of Gwynns Falls watershed known as Court Hill. They assigned it a unique site ID of MCCH-1, and took a digital photo, which was the 13th on the camera roll.
Urban Subwatershed Restoration Manual 11
17
Chapter 3: Neighborhood Source Assessment (NSA)
Box 2: In this example, the field crew profiled the Jamestowne Court Townhouses and Apartments.
They quickly estimated that the complex was about 25 years old, found manholes indicating that it
was serviced by sewer, and observed no garages or basements. Prior desktop analysis did not
indicate that there was an active civic association, and the crew saw no evidence of redevelopment
or construction activity on the premises.
You should record the name of the
neighborhood or subdivision. If there are no
signs to identify the neighborhood, simply
record the street names. If you choose to
complete a composite form for the
neighborhood, record the name of the
intersection at the neighborhood entrance.
Many neighborhoods have a homeowner’s
association (HOA). HOA contact information
is important for several reasons. First, HOAs
will be your primary point of contact if the
NSA reveals any neighborhood restoration
opportunities. Second, HOAs can be important
stakeholders to involve in subsequent steps of
the subwatershed restoration planning process.
Lastly, HOA contacts may be able to quickly
provide neighborhood information to complete
the NSA form, such
as the age of
development. HOA
Sample Lot Size Calculation
and contact
Frontage = 120 feet; Depth = 180 ft
information should
Area = 120ft x 180ft = 21,600ft2
have been acquired
21,600/43,560 = 0.50 acres
during the desktop
analysis.
Check the appropriate box if the neighborhood
has multi-family housing, such as
condominiums or apartments or is a mobile
home park. If the neighborhood consists of
single family homes, record the estimated area
of the average lot (in acres). Lot size is
18
important, since larger lots are linked to more
frequent fertilization and herbicide application
than smaller ones. Also, certain restoration
opportunities such as rain gardens can be
directly influenced by lot size. Lot size can be
derived from tax maps or plats, or directly
measured from GIS parcel data. Multiply lot
frontage (length along the street) and lot depth
(from front to back), to compute square
footage, and divide by 43,560 to convert the
area into acres (see example at left).
Two methods are available to measure lot size
in the field. The first method is to walk the lot
using calibrated paces. A more accurate
method is to physically measure lot dimensions
with a 100-foot measuring tape. Lot depth can
be hard to measure if you don’t have access to
backyards. When measuring the lot, you should
also measure house dimensions, which will be
needed later.
You should also estimate the age of the
neighborhood, which helps explain many
neighborhood characteristics. For example,
storm drain inlet catch basins are more
common in older neighborhoods, while storm
water treatment practices are more common in
newer ones. Age can be estimated by looking at
features such as the architecture of the house,
by analyzing tax maps/plats, or by directly
contacting the HOA.
Urban Subwatershed Restoration Manual 11
Chapter 3: Neighborhood Source Assessment (NSA)
Garages and basements are two other
important features to note in a neighborhood.
Most homeowners use and store household
hazardous wastes, such as paint, used oil, and
pesticides. If garages are not present, it may
suggest that household wastes are stored
outside and are more likely to pollute storm
water runoff. The presence of basements is an
important indicator of the feasibility of
downspout disconnection. Homeowners with
basements may be less likely to disconnect
downspouts because of fears about water
seeping in or the basement flooding. Simply
note the percentage of homes in the
neighborhood that have garages and
basements.
Sanitary sewers are the most common method
for disposing of wastewater in most urban
neighborhoods, although some large lots may
still rely on septic systems. To determine if
sewers are present, simply look for manhole
covers that are labeled “Sanitary Sewer”
(Figure 5). If no signs of sewer service are
found, look for evidence of septic system drain
fields. Septic systems can be a pollution source
area if they are not properly maintained.
Another key neighborhood characteristic is the
Index of Infill, Redevelopment and
Remodeling. Infill is development that occurs
on small lots that were previously
undeveloped, while redevelopment occurs
when existing developed areas are renovated,
expanded, and/or restored. Remodeling refers
to changes, such as the addition of a deck,
garage, or outbuilding, or larger expansions of
the existing house. Try to estimate the
percentage of homes in the neighborhood
currently undergoing infill, redevelopment, or
remodeling. If more than 10% of the homes in
a neighborhood fall into this category, it
suggests that construction could be a
significant pollution source.
Figure 5: Sanitary Sewer Manhole
Popped Open for Inspection
3.4 Assessing YYard
ard and LLawn
awn
Conditions
This part of the NSA form assesses the average
yard and lawn condition for the neighborhood
(Box 3).
Nine questions profile potential pollution
sources and behaviors in the yard or lawn. You
must first estimate the percentage of five lot
cover types for the average residential lot
(Figure 6):
Impervious cover
Grass cover
Landscaping cover
Bare soil cover
Forest canopy cover
Impervious cover is defined as any surface
that cannot absorb or infiltrate rainfall, and is a
useful indicator of the impacts of development
on aquatic systems. Examples of impervious
cover in residential lots include houses,
garages, outbuildings, carports, paved/concrete
driveways and sidewalks, decks, and
swimming pools.
The NSA then asks for an estimate of the
percentage of grass cover on the lot and an
assessment of how intensively it is managed.
High management turf is defined as lawns that
Urban Subwatershed Restoration Manual 11
19
Chapter 3: Neighborhood Source Assessment (NSA)
12
Box 3: In this example, the field crew evaluated yard and lawn conditions in a five-year old suburban
neighborhood consisting of half-acre residential lots. The crew measured cover types at three randomly
selected lots, and reported turf and forest canopy cover at 70% and 20%, respectively. Using the visual
lawn indicators, they rated 60% of the turf as being in the high input category, and the remainder in the
medium input category. They noticed about a dozen backyard swimming pools in the neighborhood, but
found no obvious trash or junk in any yards. The crew leader made a note on the form that lawn care
practices and swimming pool discharges might be a potential pollution source for the neighborhood.
Figure 6: A Typical Lot Demonstrating Yard and Lawn Cover Types
20
Urban Subwatershed Restoration Manual 11
Chapter 3: Neighborhood Source Assessment (NSA)
are over-fertilized, over-watered, or treated
with pesticides, which increases the chance
that these pollutants will run off lawns during
storms.
Landscaped areas are operationally defined
as mulched beds that typically have plants,
small ornamental trees less than six inches in
trunk diameter (such as dogwood, cherry and
pear trees), and/or shrubs. Landscaped areas
represent a restoration opportunity if a natural
landscaping approach is used. Natural
landscaping can reduce runoff and pollutant
inputs compared to turf areas (Figure 7) by
using native vegetation that is already adapted
to the water and soil conditions of the area,
and reducing the amount of fertilizer and
irrigation needed.
Figure 7: Example of Bayscaping
Bare soil presents a potential source of
sediment from the lawn. The percentage of
bare or exposed soil should be directly
recorded on the sheet. Any bare soil areas on
lawns should be replanted immediately to
reduce the risk of erosion and sediment runoff
during storms.
Forest canopy is operationally defined as the
portion of the average lot covered by trees with
a diameter greater than six inches. Forest
canopy cover includes any part of the lot
covered by the tree “drip line,” which is
illustrated in Figure 8. A drip line is an
imaginary area on the ground that encircles the
outermost foliage of the tree above.
Estimating Cover Area
You will need to sketch the lot to accurately
calculate each of the five cover types. The
bottom right corner of the back of the NSA
form contains a grid, and Figure 9 provides a
sample sketch and calculation. The process of
sketching lot cover types to scale has four
steps. In the first step, you set the scale for the
grid based on the lot size. Table 11 can help
you choose the appropriate scale to mark your
grid. The second step assumes that the lot is
square, which makes subsequent calculations
much easier. The five lot cover types are then
sketched on the grid in the third step.
Urban Subwatershed Restoration Manual 11
Figure 8: Tree Drip Line
The last step involves calculating the
percentage of each cover type from the ground.
You can make a visual estimate directly from
the sketch or calculate it using the square
counting method, as illustrated in Figure 9.
The management status of the grass cover on
the lot is very important to determine when
completing the NSA, since high input turf can
result in polluted storm water runoff. High turf
input is defined as lawns where fertilizers,
pesticides, and irrigation appear to be used to
maintain a dense grass cover. You can rate the
turf management status by looking at simple
indicators on the lawn, as shown in Table 12.
21
Chapter 3: Neighborhood Source Assessment (NSA)
Steps in the Square
Counting Method
1. Count the total number of squares
occupied by each cover type
2. Multiply that number by the area
included in each square, as shown
above in Table 10 or on your grid.
3. Divide that number by the area of
the entire lot calculated in Section A
and multiply by 100 to get the
percentage of the lot. Remember
that the percentages of impervious
cover, grass, landscaping and bare
soil calculated should total 100.
Figure 9: Sample Sketch and Ground Cover Calculation and Square Counting Method
Table 11: Selecting a Grid Scale
2
Lot Size (acres)
Lot Size (ft )
Scale and Area of Each Square
1/10
4,356
1 square = 4 feet x 4 feet = 16ft
1/8
1/4
1/3
1/2
1
1.5
5,445
10,890
14,520
21,780
43,560
65,340
1 square = 4.6 feet x 4.6 feet = 21 ft
2
1 square = 6.5 feet x 6.5 feet = 42 ft
1 square = 7.5 feet x 7.5 feet = 56ft2
2
1 square = 9 feet x 9 feet = 81ft
2
1 square = 13 feet x 13 feet = 169 ft
2
1 square = 16 feet x 16 feet = 256ft
2
2
Table 12: Turf Management Indicators
Management
Status
High Input
Indicators
•
•
•
•
•
•
Medium Input
22
•
•
•
•
•
Single shade of green
One grass species
Edging around
driveways, sidewalks,
and landscaping
Permanent irrigation
system
Visible fertilizer pellets
A few indicators from both the high and low categories
•
Low Input
Well-manicured
Lush and dense
Short, evenly cut
Lawn care
company signs
Grass clippings
Weed free
Example
•
Non-manicured
appearance
Build-up of
thatch (small
dead stems and
brush)
•
•
•
Patchy grass with soil/dirt
showing through
Varying height of grass
with dandelions/weeds
Varying shades of green
Urban Subwatershed Restoration Manual 11
Chapter 3: Neighborhood Source Assessment (NSA)
High input turf can be a source of pollutants in
urban neighborhoods. Lawns that are lush,
dense, and consistently green may suggest the
use of fertilizers and/or herbicides, particularly
if they are managed by a lawn care company.
Pollutants from the lawn can be washed into
storm drains if permanent irrigation systems
exist installed or routine lawn watering occurs.
Non-target irrigation occurs when sprinklers,
hoses, or permanent irrigation sprinkler heads
are misdirected over driveways and sidewalks.
Pollutants that have accumulated on
impervious surfaces can wash into the storm
drain system if they receive non-target
irrigation (e.g., fertilizer, oil, sediments, etc.).
Manual 8 includes Profile Sheets that offer tips
on reducing pollutant runoff from highlymanaged lawns.
The last two yard factors to examine are the
presence of swimming pools and junk or
trash. Improperly drained swimming pools can
discharge chlorinated water to streams that
harms aquatic life. As you drive the
neighborhood, estimate the percentage of
homes that have outdoor swimming pools. The
presence of junk or trash in yards is used to
generate an index of neighborhood
housekeeping. The NSA form asks you to
estimate the amount of junk or trash in yards,
and characterize its type, which can be
recorded in the “Notes” box provided. Three
important types of residential junk worth
noting are abandoned cars, building materials,
and household garbage.
3.5 Assessing Driveways,
Sidewalks, and Curbs
This part of the NSA form evaluates pollutant
accumulation in driveways, sidewalks and
curbs in the neighborhood (Box 4).
First, record the percentage of lots in the
neighborhood that have impervious driveways
and describe their basic condition. A clean
driveway may indicate that the homeowner
regularly hoses it down, potentially washing
pollutants to the storm drain, whereas a stained
driveway may suggest that outdoor car
maintenance or leaking vehicles could
contribute pollutants to the stream.
Box 4: In this example, the field crew evaluated the condition of driveways, sidewalks, and curbs
in a city neighborhood that primarily consisted of 1/8 acre detached homes. All homes in the
neighborhood had impervious driveways, and most were dirty and breaking up. Sidewalks were
present on both sides of the street, and they were partially covered by leaves, lawn clippings, and
other kinds of organic matter. The distance from the street to the sidewalk measured six feet, and
the crew observed a considerable amount of dog poop in this zone. The street had curb and
gutters, which contained about an inch of accumulated sediment, organic matter and litter, some of
which appeared to come from the tree canopy overhead. Cars were parked on both sides of the
street, which would make access by street sweepers difficult without parking restrictions. The field
crew noted that the driveways, sidewalk zone, and curbs were a significant pollution source for
this neighborhood.
Urban Subwatershed Restoration Manual 11
23
Chapter 3: Neighborhood Source Assessment (NSA)
Sidewalks are often found along streets in
urban neighborhoods (Figure 10). The NSA
form asks you to note the condition of the
sidewalk, if one is present. Sidewalks that are
covered in lawn clippings or leaves can be a
pollution source if this organic matter is
washed into the storm drain. Ideally, residents
would manually sweep sidewalks, collect the
waste, and properly dispose of it.
Next, you should record the width of the zone
between the sidewalk and the street. This
zone is where pet waste tends to accumulate,
since it is where most residents walk their
dogs. During storms, pet waste can be easily
washed from the sidewalk zone to the storm
drain system, and send bacteria to streams (see
Profile Sheet N-18 in Manual 8 for more
information). Check to see if pet waste is
present in the sidewalk zone, and record it on
the form.
Curb and gutters are used to quickly deliver
storm water from the road to storm drains, and
provide no pollutant removal (Figure 11a). If
curb and gutters are present, you should look
closely at the level of pollutant and organic
matter accumulation in the gutters. Clean and
dry gutters suggest that the municipality may
be performing routine street sweeping, while
flowing or standing water may indicate nontarget irrigation, illicit discharges, or clogging
of the storm drain inlet (Figure 11b).
The NSA form asks for an estimate of the
density of car parking along the curb (Figure
11c). Long-term parking can make street
sweeping difficult, and may be a potential
source of pollution. Note the presence of any
sediment, organic matter, or litter accumulated
in the curb and gutter. Overhead tree canopy,
illustrated in Figure 11a, can also be a source
of organic matter in the street. Look above you
to see if the canopy extends over the curb or
street, and record it on the form.
3.6 Assessing How R
oof
top
Roof
ooftop
Runoff is Managed
Figure 10: Sidewalk-Lined
Street with Trees
a. Curb and Gutter System
This part of the NSA form assesses how
rooftop runoff is managed in the neighborhood
(Box 5). Five questions are asked to determine
if downspouts are directly connected to the
storm drain system, and if there is any realistic
potential to disconnect them or direct this
runoff volume elsewhere.
b. Clogged Storm Drain Inlet
C. Long-Term Car Parking
Figure 11: Common Driveway, Sidewalk, and Curb Conditions
24
Urban Subwatershed Restoration Manual 11
Chapter 3: Neighborhood Source Assessment (NSA)
Box 5: In this example, the field crew investigated rooftop runoff at a 20-year old subdivision with quarter
acre residential lots and basements. The crew visually inspected ten homes and came up with a
composite score for the neighborhood. The crew found that many homeowners had modified their
rooftop drainage over time. Nearly 20% of all downspouts were now directly connected to the curb, while
another 40% were indirectly connected (e.g., discharged to driveways and then to the street). About
40% of the downspouts discharged to lawns over a distance greater than 15 feet. In general, front lawns
were flat and short, and the crew estimated that rain gardens or other on-site retrofit practices could only
be applied to about 20% of the indirectly- or directly-connected downspouts in the neighborhood.
When rain falls on a residential rooftop, runoff
travels through the gutter to downspouts, also
known as roof leaders. From there, runoff can
be discharged one of five ways. The most
undesirable discharge is when downspouts are
directly connected to the storm drain system.
These downspouts continue underground, and
reach the storm drain without any treatment
(Figure 12a and 12b).
Another undesirable discharge occurs when
downspouts are indirectly connected. These
downspouts drain to an impervious surface on
the lot, such as a driveway or sidewalk (Figure
12c), allowing runoff to reach the storm drain
with little or no treatment or infiltration.
A more desirable discharge is when the
downspout drains to the front lawn, where
runoff can infiltrate into the ground.
Downspouts are considered disconnected if
there is at least 15 feet of lawn available for
infiltration to occur (Figure 12d).
An even better situation is when the individual
downspouts discharge to a rain barrel or
cistern. That stores runoff for irrigation later
(Figure 12e). Techniques to disconnect rooftop
runoff are discussed in Profile sheet OS-15 in
Manual 3.
Urban Subwatershed Restoration Manual 11
The best situation is when the downspout is
directed into a rain garden that it is totally
disconnected from the storm drain system. A
rain garden, illustrated in Figure 12f, is a small,
landscaped depression with native plants that
captures and infiltrates rooftop runoff (see
Profile sheet OS-16 in Manual 3). The NSA
asks you to check if the average lot has several
hundred square feet of lawn area available
down gradient from the downspout to
potentially plant a rain garden.
3.7 Assessing Common Areas
This part of the NSA assesses management
practices at common areas in neighborhoods,
such as streets, storm water ponds, and open
spaces (Box 7).
You are asked to make several observations
along streets. First, are storm drain inlets
present? While storm drains can have different
configurations, they are often found along the
curb, as shown in Figure 13. You should check
to see if storm drain inlets are stenciled or
clogged with sediment and debris. Storm drain
stenciling teaches residents that what enters a
storm drain will eventually enter the stream
(see Profile Sheet N-21 in Manual 8).
25
Chapter 3: Neighborhood Source Assessment (NSA)
a
c
b
Directly Connected to
Storm Drain System
Indirectly Connected;
Flowing to Impervious
Surface
Directly Connected;
Flowing Onto Street Through
Underground Pipe
d
e
Disconnected;
Flowing to Pervious Surface
Disconnected; Flowing to
Rain Barrel
f
Source: Roger Bannerman
Disconnected; Flowing to
Rain Garden
Figure 12: Different Ways Downspouts Discharge Rooftop Runoff
In some neighborhoods, storm drain inlets may
have a device called a catch basin, which is
designed to “catch” excess sediment and trash
before it enters the storm drain pipe. If present,
catch basins will be located inside the inlet,
which can be accessed through a manhole. If
catch basins are present in the neighborhood,
you should inspect a few using the Streets and
Storm Drains (SSD) field form. You should
first get permission from the local public works
department before popping manholes to inspect
catch basins.
Newer subdivisions may have a storm water
management pond. The NSA asks you to note
whether the pond is a wet pond or dry pond,
and its approximate area (in acres). Wet ponds
have a permanent pool of water and are more
desirable since they offer better water quality
treatment. In contrast, dry ponds seldom have
26
standing water, except after larger storms, and
provide pollutant removal. If a fence surrounds
the perimeter of the pond, use it as a guide to
Figure 13: Stenciled Storm Drain Inlet
Urban Subwatershed Restoration Manual 11
Chapter 3: Neighborhood Source Assessment (NSA)
Box 7: The field crew in this example investigated how open space was managed in a 10-year old, large
lot subdivision. While driving through the neighborhood, the crew noted that storm drain inlets were
present, and inspected one catch basin, using the SSD form. The storm drain inlets were not stenciled,
but no sediment or pollutant accumulation was observed in the catch basin. Traveling downhill, the crew
found that the storm drains led to a large dry storm water pond. They took two digital photos of the pond
that was overgrown with willows, and noted that it might be worth investigating later as a possible retrofit.
The remaining open space consisted of a few acres of floodplain setbacks and a utility right-of-way, both
of which were regularly mowed, and no dumping or pet waste was observed.
measure the pond area. Be sure to take a few
photos of the pond for your retrofit expert.
Manual 3 provides detailed information on
storm water practices used to retrofit
neighborhoods.
neighborhood should be assessed. Dumping,
mowing, and sheds/buildings are some typical
examples of encroachment. As a rule of thumb,
look for large mowed open areas that might be
potential candidates for reforestation.
Routine maintenance is vital to the proper
function of any storm water pond. Vegetation
can be present in different areas of the pond,
but should not be growing out of control.
Figure 14 compares an overgrown dry pond
that is not functioning as designed with a wellmaintained dry pond. Both of these ponds may
be good candidates for storm water retrofitting.
3.8 R
ecommended Actions and
Recommended
Neighborhood Indexes
Neighborhood open space presents an
opportunity for restoration. Any stream buffers,
floodplains, and open areas in the
After the neighborhood survey is done, you are
asked to compile indices that rank the overall
neighborhood nonpoint pollution severity and
restoration opportunities for the neighborhood.
This section provides guidance on deriving
neighborhood indexes and making initial
recommendations for neighborhood restoration
and stewardship actions.
Figure 14: Overgrown Dry Pond (a) and a Well-Maintained One (b)
Urban Subwatershed Restoration Manual 11
27
Chapter 3: Neighborhood Source Assessment (NSA)
To start, the form asks you to rate the major
pollutants that are potentially being generated
by the neighborhood (Box 8).
To help you make this determination, Table 13
indicates the specific NSA questions linked to
specific pollutant sources. If two or more
questions are answered affirmatively, you
should check the appropriate pollutant index
box. Boxes are also provided to describe any
recommended restoration actions for the
neighborhood.
Pollutant
Nutrients
Oil and Grease
Trash/Litter
Bacteria
Sediment
This part of the NSA also asks you to
recommend specific actions for neighborhood
restoration or retrofits, based on your initial
field observations. Other Restoration Manuals
offer more specific guidance on how to make
neighborhood recommendations.
On-site retrofits are used by homeowners to
reduce storm water runoff generated by their
lots, by disconnecting downspouts. Examples
include rain gardens, rain barrels, and cisterns,
which are described in Manual 3.
Table 13: Pollution Indicators
Reference Questions
Potential Cause
B7 (High level)
Fertilizer
C3
Lawn clippings
C4
Organic matter (Leaves, Lawn Clippings)
C1
Stained driveways
C4
Long-term car parking
B9
Trash in Yards
E3
Dumping
If not present, potential from septic tanks
A (Sewer Service)
C3
Pet waste
E3
Pet waste
B4
Erosion
C2
Driveways that are breaking up
C4
Sediment in curb and gutter
Box 8: In this example, the field crew assessed a townhouse community with a curb and gutter system with
accumulated sediment. The sidewalk was covered with lawn clippings and leaves that appeared to come
from overhead tree canopy. Based on these observations, the field crew determined that the neighborhood
could be a significant source of nutrients and sediment. The field crew also made a several initial
recommendations for the neighborhood. For example, they suggested that the large parking lot had retrofit
potential since portions of it were sloped towards an area that was already landscaped. They also
recommended that the dry storm water pond that was in severe need of maintenance, and that it could
potentially be converted into a wet pond. Finally, the field crew suggested that the landscaping contractor stop
mowing so close to the edge of the stream.
28
Urban Subwatershed Restoration Manual 11
Chapter 3: Neighborhood Source Assessment (NSA)
Better lawn/landscaping practices may be
needed in neighborhoods where high input
lawns and extensive turf cover are prevalent.
Better lawn care practices minimize the use of
chemicals and encourage the use of native
landscaping. Specific lawn care techniques are
discussed in Manual 8.
When dumping, pet waste, or stream buffer
encroachment is observed in neighborhoods,
better management of common space may be
recommended. Manuals 5 and 7 provide more
information on restoration techniques that can
be applied to neighborhood open space.
Neighborhoods with existing storm water
ponds may be candidates for a pond retrofit.
Retrofit options may involve improved
maintenance practices or converting a dry pond
into a wet pond or wetland to increase
pollutant removal. Consult Manual 3 for more
guidance on pond retrofits.
Multi-family parking lots found in apartment
and townhouse complexes may sometimes
present a good opportunity to provide a storm
water retrofit. If parking lots are landscaped,
there may be potential to turn these areas into
bioretention areas for pollutant removal.
Manual 3 provides more information on types
of retrofits appropriate for parking lots.
Be sure to include a brief description of the
types of actions needed when recommending
specific follow-up activities, such as retrofits
and better stewardship.
The last step in the NSA involves computing
index values on the left-hand side of the field
sheet. The Pollution Severity Index, denoted
by open circles in the “Index” column on the
NSA, is used to rate the severity of pollution
generated by the neighborhood. The
Restoration Opportunity Index, denoted by
diamonds in the “Index” column on the NSA,
rates the feasibility of potential residential
restoration projects identified for the
neighborhood as a whole. Some suggested
benchmark values for each index are offered in
Tables 14 and 15. These benchmarks should be
adjusted if there is a specific pollutant of
concern in the subwatershed.
Table 14: Benchmarks Used to Establish Pollution Severity Index
Reference
Question
Part A
Part A
B2
B4
B6
Neighborhood Feature
Septic System Presence
Construction Activity
High Turf Coverage on Lot
Bare Soil Coverage on Lot
Irrigation Evident
B7
B8
B9
C2
C3
C3
High Turf Management
Outdoor Swimming Pools
Junk or Trash
Driveway Condition (Stained)
Sidewalk Condition (Leaf Cover)
Pet Waste
C4
Curb and Gutter Condition
D1
Rooftop Connection
E1
Catch Basin Condition
E3
Open Space Management
Part F
Source of Pollutant
Urban Subwatershed Restoration Manual 11
Benchmark
(% of neighborhood)
Answering “No” to sewer
At least 5%
At least 50%
At least 5%
At least 15%
At least 20%
At least 10%
At least 25%
At least 25%
At least 25%
At least 25%
At least 20% with flowing/standing water
and/or sediment/organic matter
At least 25%
More than three inches of accumulation
At least 40% answering “Yes” to either OR
At least 25% answering “Yes” to both
Any pollutant is selected
29
Chapter 3: Neighborhood Source Assessment (NSA)
Table 15: Benchmarks Used to Establish Restoration Opportunity Index
Reference
Question
Neighborhood Feature
Benchmark
(% of neighborhood)
B3
Landscaping
Less than 25%
B5
Forest Canopy Coverage
Less than 40%
C3
Sidewalk Zone
C4
Curb and Gutter
D1
Rooftop Connection
D5
Rain Garden
More than 25%
E1
Storm Drain Inlets
Less than 10% stenciled
E2
Storm Water Pond
Answering “Yes” to overgrown or to dry pond
To complete the index, compare your NSA field
value to the benchmark, and if it exceeds the
benchmark, check the circle or diamond. Next,
count the total number of checked circles or
diamonds and rate the neighborhood using the
scoring system provided below.
Pollution Severity Index
More than 10 circles checked indicates
severe potential to generate pollutants
Five to 10 circles checked suggests a high
potential to generate pollutants
One to five circles checked suggests a
moderate potential to generate pollutants
If no circles were checked, the
neighborhood has a low potential to
generate pollutants
30
At least 25% with sidewalk zone width of six
feet or more
At least 25% of curb and gutter with trash,
organic matter, or sediment accumulation
More than 25% of connected roofs are feasible
for disconnection
Restoration Opportunity Index
More than five diamonds checked
suggests a high restoration potential for
this neighborhood
Three to five diamonds checked indicates a
moderate restoration potential
If two or fewer diamonds are checked, this
suggests a low restoration potential for this
neighborhood
Both indexes are used to compare and rank
neighborhoods across subwatersheds to
prioritize restoration projects and stewardship
campaigns. More guidance on interpreting and
using NSA index data to screen subwatersheds
is provided in Chapter 7 of this manual.
Urban Subwatershed Restoration Manual 11
Chapter 4: Hotspot Site Investigation (HSI)
Chapter 4: Hotspot Site Investigation (HSI)
4.1 Basics of Hotspots
Storm water “hotspots” are defined as
commercial, industrial, institutional,
municipal, or transport-related operations that
produce higher levels of storm water
pollutants, and/or present a higher potential
risk for spills, leaks or illicit discharges. Table
16 lists potential pollutants that can be
generated from hotspot sites.
There are two basic types of hotspots.
Regulated hotspots are known sources of
pollution and are subject to federal or state
regulations. Unregulated hotspots are
operations suspected to be potential pollution
sources, but which are not currently regulated.
Storm water hotspots can be found in a variety
of land uses, and many different hotspot
operations are usually found in each
subwatershed. Appendix B contains a
classification of potential hotspot operations,
which is based on the Standard Industrial
Classification (SIC) code system.
Commercial hotspots consist of a small
subset of businesses in a subwatershed
associated with specific activities that can
generate higher pollutant loads. Commercial
hotspots typically experience a great deal of
vehicle inputs, generate waste or wash water,
handle fuel or repair vehicles, or store
products outside. While commercial hotspots
are quite diverse, they tend to be clustered
together within a subwatershed. Each kind of
commercial hotspot tends to generate its own
blend of storm water pollutants, which can
include nutrients, hydrocarbons, metals, trash
or pesticides. Each potential commercial
hotspot operation needs to be inspected during
the Hotspot Site Investigation (HSI) to confirm
whether it actually represents a real pollution
source or risk.
Industrial hotspots are always a major focus
of the HSI since they use, generate, handle or
store pollutants that can potentially be washed
away in storm water runoff, spilled, or
inadvertently discharged into the storm drain
system. Many industrial operations are
regulated storm water hotspots under the
Environmental Protection Agency’s NPDES
industrial storm water permit program,
although the individual owner or operator may
be unaware of that fact. Appendix B provides a
list of specific industries subject to NPDES
regulations that is based on SIC codes.
Institutional hotspots include larger,
privately-owned facilities that have extensive
parking, landscaping, or turf cover. In addition,
they may possess vehicle fleets and
maintenance operations. By and large,
institutional hotspots are not regulated. The
most common pollutants generated at
institutional hotspots are nutrients and
pesticides applied to maintain grounds and
landscaping. Large institutional parking lots
produce large volumes of storm water runoff
and associated pollutants, and are natural
targets for storm water retrofitting.
Table 16: Potential Pollutants From “Hotspot” Businesses and Activities
Nutrients (e.g., phosphorus and nitrogen)
Pesticides
Solvents (e.g., paints and paint thinners)
Fuels (e.g., gasoline, diesel, kerosene)
Oil and grease
Toxic chemicals
Sediment
Urban Subwatershed Restoration Manual 11
Road salt
Bacteria
Trace metals (e.g., copper, zinc, lead,
cadmium, aluminum, and chromium)
Polychlorinated Biphenyls
Polycyclic Aromatic Hydrocarbons
Volatile Organic Compounds
31
Chapter 4: Hotspot Site Investigation (HSI)
Municipal hotspots include many local
government operations that handle solid waste,
wastewater, road and vehicle maintenance, and
yard waste. Most of these operations are
defined as regulated hotspots in communities
subject to NPDES municipal separate storm
water system permits. Municipal hotspots must
prepare pollution prevention plans and
implement source control practices that are
essentially the same as for regulated hotspots.
Municipal hotspots can generate the full range
of storm water pollutants, including nutrients,
hydrocarbons, metals, chloride, pesticides,
bacteria, and trash.
Transport-related uses are the last hotspot
category to investigate within a subwatershed.
Many, but not all, transport-related uses are
regulated hotspots. They tend to generate
higher loads of hydrocarbons, metals, and
sediment in storm water runoff, are often
associated with large areas of impervious
cover, and have an extensive private storm
drain system. Transport-related hotspots are
not always present in every subwatershed, but
if they are, they should be thoroughly
investigated.
Table 17 provides a rapid guide to identify
common hotspots. You should become familiar
with the potential hotspot categories before
starting your HSI.
Table 17: Common Hotspot Operations
Commercial
Animal Care Services
Auto Repair
Automobile Parking
Building and Heavy Construction
Building Materials
Campgrounds/RV parks
Car Dealers
Car Washes
Commercial Laundry/Dry Cleaning
Convenience Stores
Food Stores and Food and Beverage
Wholesalers
Equipment Repair
Gasoline Stations
Heavy Construction Equipment Rental and
Leasing
Marinas
Nurseries and garden centers
Oil Change Shops
Restaurants
Swimming Pools
Warehouses
Wholesalers of Chemical and Petroleum
Municipal
Composting Facilities
Landfills and Hazardous Waste Material
Disposal
Local Streets
Maintenance Depots
Municipal Fleet Washing
Public Schools/Golf Courses
Public Works Yards
Steam Electric Plants
Treatment Works
Industrial*
Auto Recyclers and Scrap Yards
Beverages and Brewing
Boat Building and Repair
Chemical Manufacturing
Food Processing
Garbage Truck Washout Activities
Heavy Manufacturing
Leather Tanners
Metal Production, Plating and Engraving
Operations
Paper and Wood Products
Petroleum Storage and Refining
Printing
Institutional
Cemeteries
Churches
Colleges and Universities
Corporate Office Parks
Hospitals
Private Golf Courses
Private Schools
Transport-Related
Airports
Petroleum Bulk Stations or Terminals
Ports
Railroads
Rental Car Lots
Street and Highway Construction
US Postal Service
Trucking Companies and Distribution
Centers
*Please consult Appendix B for a complete list of Industrial SIC Codes
32
Urban Subwatershed Restoration Manual 11
Chapter 4: Hotspot Site Investigation (HSI)
Assessing Individual Storm
Water Hotspots
The site is the fundamental unit to evaluate
potential storm water hotspots. Each hotspot
site has its own unique operations, drainage
system, and potential pollution risk. As a result,
each hotspot must be individually inspected to
identify current practices, spill risks, and storm
water problems. Hotspots do have common
operations and activities that can contribute to
storm water quality problems (Figure 15). The
Hotspot Site Investigation (HSI) evaluates six
common operations at each potential hotspot:
Vehicle Operations
Outdoor Materials
Waste Management
Physical Plant
Turf/Landscaping
Storm Water Infrastructure
Vehicle Operations - Nearly all hotspots devote
some portion of the site to vehicle operations,
which may include maintenance, repair,
recycling, fueling, washing or long-term
parking. Vehicle operations can be a significant
source of trace metals, oil and grease, and
hydrocarbons, and is the first area evaluated
when performing an HSI. Vehicle maintenance
and repair often produces waste oil, fluids and
other hazardous products. The procedures for
handling and safely disposing/recycling of
these products should be assessed at every site.
In addition, any connections between vehicle
fueling or washing operations and the storm
drain system should be thoroughly explored.
Outdoor Materials - Virtually every hotspot
site handles some kind of material, which may
cause storm water problems if not properly
handled or stored. The HSI examines locations
where materials are loaded and unloaded at the
site to see if materials are exposed or spilled
and can enter the storm drain system. It also
looks at materials stored outdoors, and their
possible exposure to rainfall or runoff. Stains on
paved areas are usually a good indicator of
poor outdoor storage practices.
Figure 15: Six Common Operations Found at a Hotspot
Urban Subwatershed Restoration Manual 11
33
Chapter 4: Hotspot Site Investigation (HSI)
Waste Management - Every business
generates waste as part of its daily operations,
some of which can be hazardous, and most of
which is temporarily stored at the site pending
disposal. The HSI looks at the nature and
manner in which wastes are stored and
disposed, and the location of waste storage in
relation to the storm drain system.
Physical Plant Practices - The fourth operation
common to most hotspots consists of practices
used to clean, maintain or repair the physical
plant, which includes the building, outdoor
work areas, and parking lots. Routine cleaning
and maintenance practices can cause runoff of
sediment, nutrients, paints, and solvents from
the site. Sanding, painting, power-washing, and
resealing of buildings and parking lot surfaces
all deserve scrutiny, particularly if they are
done close to storm drains.
Turf and Landscaping - Many commercial,
industrial, institutional, and municipal hotspots
directly manage or hire contractors to maintain
turf and landscaping, apply fertilizers or
pesticides and provide irrigation. The HSI
thoroughly evaluates the current pollution
potential of practices used to maintain the
grounds (e.g., fertilizer, pesticides, and water).
Streets and Storm Drains - The sixth common
hotspot operation worth investigating is the
street and storm drain network that serves the
facility. Many hotspot operations contain
private storm water conveyance structures such
as catch basins, as well as privately-owned
storm water treatment practices. Maintenance
practices for this private infrastructure should
be investigated to ensure that they are regularly
inspected, swept or cleaned out to reduce storm
water pollution. In addition, you should
complete an SSD assessment for private road
conditions and large parking areas.
4.2 Introduction to the HSI
The HSI provides a way to quantify the
impacts of hotspot activities on urban
subwatersheds, and identify possible
restoration practices that may be needed. The
HSI asks you to assess six distinct pollution
sources at each site, and to identify targeted
pollution prevention techniques or restoration
practices to address those sources (Table 18).
The result of the HSI is a comprehensive
database of confirmed hotspots for each
subwatershed, each of which is ranked in terms
of its severity. The database can be used to
Table 18: HSI Assessment Factors and Possible Restoration Recommendations
Hotspot Factor Assessed
Potential, Confirmed or Severe
Hotspot
Vehicle Source Areas
Outdoor Storage Source Areas
Waste Management Source Areas
Physical Plant Operations
Turf/Landscaping Source Areas
Uncontrolled Storm Water Discharge
Suspected Source of Illicit discharge
Observed Spill or Illicit Discharge
Unique Hotspot
Catch Basin Accumulation
Pollution Prevention Activity*
Permit enforcement (D-12)
Vehicle pollution prevention practices (H-1 to H-4)
Storage pollution prevention practices (H-5/6)
Waste pollution prevention practices (H-7/8)
Maintenance pollution prevention practices (H-9 to 11)
Landscaping pollution prevention practices (H-12/13)
Parking lot retrofit (SR-6, OS-7 through 11)
Investigate discharges (M6)
Contain and fix discharges (M6 and H-7)
Special pollution prevention practices (H-14/15)
Catch basin clean-outs (M-9)
*The code in parentheses refers to the appropriate restoration profile sheet in the Restoration Manual Series. Codes are
as follows:
•
OS- and SR- sheets can be found in Manual 3: Storm Water Retrofit Practices
•
H- sheets can be found in Manual 8: Source Control Practices
•
M-9= Manual 9: Municipal Practices and Programs
•
M-6= Illicit Discharge Detection and Elimination Guidance Manual (Brown et al. 2004)
34
Urban Subwatershed Restoration Manual 11
Chapter 4: Hotspot Site Investigation (HSI)
determine what, if any, pollution prevention or
discharge prevention strategies need to be
incorporated into the overall subwatershed
restoration plan.
Initial Hotspot Status - Index Results –
Provides an initial assessment of whether the
site is a hotspot, and any specific follow-up
actions that may apply.
The HSI field form consists of eight parts:
The HSI field form also includes a grid to
sketch the individual site and to locate possible
pollution prevention activities. The sketch
complements photos taken during the HSI, and
you should note photo locations on the sketch.
Site Data and Basic Classification – Collects
basic location and land use information about
the hotspot site, and a brief description of its
operations.
Vehicle Operations – Evaluates routine vehicle
maintenance and storage practices at the site,
as well as vehicle fueling and washing
operations.
Outdoor Materials – Examines the type and
exposure of any outdoor materials stored at the
site.
Waste Management – Assesses housekeeping
practices for waste materials generated at the
site.
Physical Plant – Assesses maintenance
practices used for cleaning, remodeling or
repairing buildings, outdoor work areas and
parking lots.
Turf/Landscaping Areas – Examines the
practices used to maintain lawn or landscaping
areas, with special emphasis on fertilizer use
and non-target irrigation.
Storm Water Infrastructure – Evaluates the
condition of practices used to convey or treat
storm water, including the curb and gutter,
catch basins, and any storm water treatment
practices.
You should have located many potential storm
water hotspot sites to visit before heading out
to the field. These potential hotspots are
identified during the database screening stage,
which is described in Appendix B. While
database screening may reveal many regulated
hotspots, it does not always pick up
unregulated hotspots. Therefore, you should
closely study land use patterns in the
subwatershed, with a special emphasis on
clusters of industrial and commercial land.
These clusters should be marked on your
subwatershed field map, and scouted
thoroughly. It is always a good idea to review
the business categories on the hotspot cheat
sheet provided in Appendix C so you can look
for these sites as you drive through the
subwatershed.
The remainder of this chapter provides
guidance on how to complete the HSI field
form. A snapshot of each part of the field form
is included in each section, and a blank field
form can be found in Appendix A.
The first part of the HSI form asks for basic
information such as the name of your
watershed and subwatershed, and the Unique
Site ID for the site being assessed (Box 9). You
should record the date of your site visit, the
members of your survey team, and any
information about the camera used and picture
Box 9: In this example, the field crew assigned this industrial hotspot with the Unique Site ID of SRIN-2 and recorded.
Urban Subwatershed Restoration Manual 11
35
Chapter 4: Hotspot Site Investigation (HSI)
numbers taken at the site. This is the part
where you record the latitude and longitude
coordinates for the site (if you are using a GPS
unit), and the map grid coordinate (if you are
using paper maps).
You should assign a Unique Site ID for the
hotspot to reference in the hotspot database. A
simple naming convention is recommended.
The first initials give the name of the
subwatershed. For example, in the Smiley Run
subwatershed, the first identifier would be SR.
The next two-letter designation is for the land
use type (see Table 19). Hotspots within the
same land use category are assigned a
sequential number.
Taking photos is important to document
behaviors and pollution sources. Pollution
prevention experts can infer a lot about the
severity of the hotspot and the feasibility of
prevention techniques from well-chosen
photos. Finally, photos are a powerful tool for
subsequent enforcement or education efforts.
Commercial developments such as strip malls
offer a challenge to field crews. Some
businesses within the strip mall may qualify as
hotspots, while many others do not. In this
Table 19: Hotspot Land Uses and Letter Designation
Land Use Type
Site ID Designation
Commercial development
Industrial land
Institutional locations
CO
IN
IL
Municipal sites
Transport related businesses
Miscellaneous (see Manual 8)
MU
TR
MI
situation, you should complete one HSI form for
each potential hotspot business and one for the
entire mall as a whole. Different pollution
prevention or retrofit opportunities may apply
to individual businesses, as compared to the
site as a whole.
4.3 Characterizing the Site
This part of the HSI form provides a basic
profile of the potential hotspot (Box 10).
You are asked to record general information
about the site including its address, SIC code,
and regulatory status, if known. You should
check the box that most appropriately describes
its hotspot category, and briefly describe its
operation.
4.4 Assessing V
ehicle Operations
Vehicle
Nearly all hotspots devote some part of their
site to vehicle operations, which can include
maintenance, repair, recycling, fueling,
washing, or long-term parking. The HSI form
begins by asking three questions on the type
and estimated number of vehicles present, and
the nature of vehicle operations (Box 11). The
number of vehicles can be estimated by
counting actual vehicle or parking spaces,
depending on whether the facility is open.
Check to see which of the six vehicle
operations take place at this site.
The next five questions focus on the potential
for spills or storm water runoff from vehicle
operations, with special emphasis on the
connection between vehicle operations and the
storm drain system. The HSI form asks you to
Box 10: In this example, the site was a commercial oil change and gas station operation, which is
classified as a non-regulated hotspot according to Appendix B.
36
Urban Subwatershed Restoration Manual 11
Chapter 4: Hotspot Site Investigation (HSI)
Box 11: The field crew investigated vehicle operations at Joe’s Instant Oil Change. They counted
about 10 vehicles parked in the lot, most of which were used by customers and employees, but two of
which were wrecked. The crew noted three operations that could make this business a storm water
hotspot: outdoor car repair, wrecked vehicle storage, and outdoor fueling. The crew did not have full
access to the site, but could not find any containment or cover used for the outdoor repair and vehicle
storage. They also noted that the outdoor fueling area was uncovered and directly connected to the
storm drain system. Based on the fact that all three vehicle operations were uncovered and directly
connected to the storm drain system, the crew decided to check the box indicating that site was an
observed pollution source. This meant that the site would be designated as a confirmed or severe
hotspot, depending on scores from other parts of the HSI form.
note whether any pollution prevention practices
are being used for outdoor vehicle storage
and repair, such as the use of tarps and drip
pans. Evidence of spills and leaks should also
be noted (Figure 16), with stains or leaks that
lead to the storm drain providing good visual
documentation of pollution.
The next two questions examine fueling areas
and their relationship to the storm drain
system. Fuel spills frequently occur at selfservice facilities, and fuel island covers can
help reduce exposure to storm water (Figure
17). How drainage from the fueling area is
handled is also a concern, so you should
determine if the fueling areas are directly
connected to the storm drain system. A direct
connection will allow pollutants to more easily
enter the system in the event of a spill or leak
(Figure 18).
Lastly, you should evaluate outdoor vehicle
washing practices. Vehicle washing occurs at
many commercial, industrial, institutional,
municipal, and transport-related fleet
operations. Unfortunately, wash water may
contain sediments, phosphorus, metals, oil and
grease, and other pollutants. If vehicles are
Urban Subwatershed Restoration Manual 11
Figure 16: Leak During Vehicle Repair
Figure 17: Uncovered Fueling Island
37
Chapter 4: Hotspot Site Investigation (HSI)
Figure 18: Stain from Uncovered Fueling
Area Leading to Storm Drain
washed on impervious surfaces, such as
parking lots, dirty wash water can be an illicit
discharge to the storm drain. Look carefully at
where vehicles are washed to see how wash
water is handled and whether it discharges to
the storm drain system. Ideally, washing would
occur at a contained site where wash water is
treated prior to discharge (Figure 19).
Figure 19: Dedicated Truck Wash Site with
Runoff Controls
4.5 Assessing Outdoor
Material Storage
This part of the HSI evaluates how outdoor
materials are stored and handled at the site
(Box 12).
Nearly every hotspot site handles some kind of
material, which can wash off in storm water
runoff if it is not properly managed or stored.
The HSI form specifically looks at where
materials are loaded/unloaded and checks
outdoor storage areas to see if materials are
exposed to rainfall or can spill.
Box 12: While driving through a commercial area, the field crew came across a large lawn and
garden center where products were stored outside on pavement. Although the business was not
identified during the desktop screening phase, the crew elected to complete an HSI form since it was
in a business category found on the hotspot cheat sheet. The crew noted that plants, mulch, and lawn
care products were stored outside with no cover, and that frequent watering and hosing by employees
could also wash materials into the storm drain system. They found staining and discoloration on the
pavement, but after 15 minutes could not figure out how the storm drain system worked. Based on
their inspection, the crew tentatively checked the box indicating that the lawn and garden center was
an observed pollution source.
38
Urban Subwatershed Restoration Manual 11
Chapter 4: Hotspot Site Investigation (HSI)
Figure 20: Three Loading Dock Observations: Uncovered Dock (a), Leakage from
Loading Dock Reaching Storm Drain (b), Covered Dock (c)
Loading and unloading of materials normally
takes place at outside docks or terminals at
most commercial, industrial, institution, and
municipal operations. Materials spilled or
leaked during the loading process can either be
carried away in storm water runoff or be
washed off when the area is cleaned. The HSI
asks you to record whether the loading areas
are covered or uncovered (Figure 20a), and if
loading areas are connected to the storm drain
system (Figure 20b). The ideal situation is a
covered loading dock (Figure 20c).
Many hotspot operations store materials
outside. The risk of storm water pollution is
greatest for operations that store large
quantities of liquids or bulk materials at sites
that are connected to the storm drain system.
The HSI records the type of material stored, its
location on site (Figure 21), and its connection
to the storm drain system. A direct connection
to the storm drain system means that there will
be little opportunity for treatment (Figure 22),
so search for signs of possible discharges from
stored materials to the storm drain system.
Common signs are staining, or discoloration or
obvious leakage. If these signs are present,
outdoor storage areas may require containment
or better storm water treatment.
Next, you are asked to see if covers are used to
protect outdoor storage areas. Covers can be an
effective source control practice for nonhazardous materials, and can be as simple as
plastic sheeting or a tarp, or more elaborate,
such as roofs and canopies. Site layout,
available space, and affordability dictate the
type of cover may be present at a site. If a
Urban Subwatershed Restoration Manual 11
Figure 21: Poor Outdoor Storage at a
Garden Center
Figure 22: Outdoor Storage Area
Connected to Storm Drain System
39
Chapter 4: Hotspot Site Investigation (HSI)
cover is present, check to see if it fully covers
the stored materials and is firmly anchored in
place.
An extra measure of protection is needed for
some outdoor storage areas to prevent and
contain spills. “Secondary containment”
structures are used to contain liquid spills and
to prevent storm water runon from entering
outdoor storage areas (Figure 23). Secondary
containment structures vary in design, ranging
from berms and drum-holding areas, to
specially-designed solvent storage rooms. The
HSI looks at whether stored materials may
need secondary containment structures, and
whether they are already present at the site.
Lastly, you should look at the condition and
labeling of outdoor storage containers. Proper
labeling and well-maintained storage
containers may indicate that accurate material
inventories are being kept and that inspection
of storage areas is an ongoing practice, while
poorly-maintained storage containers can be a
source of storm water pollution (Figure 24).
4.6 Assessing W
aste
Waste
Management PPractices
ractices
Figure 23: Two Examples of
Secondary Containment
This part of the HSI looks at how outside
wastes are managed at the site (Box 13).
Solid wastes are often temporarily stored in
dumpsters, which are an unregulated and
potentially significant pollution source in a
subwatershed. Many dumpsters are uncovered,
which allows rainfall to mix with the wastes,
creating a potent brew we affectionately call
“dumpster juice.” When combined with
inevitable spillage, dumpster juice can be a
source of trash, oil and grease, metals, bacteria,
organic matter, nutrients, and sediments to the
stream.
You should look for poor dumpster practices
such as missing lids, leakage, and overloading
(Figure 25). In addition, you should note where
dumpster juice flows in relation to the storm
drain system.
40
Figure 24: Improperly Labeled and
Stored Restaurant Storage Containers
Urban Subwatershed Restoration Manual 11
Chapter 4: Hotspot Site Investigation (HSI)
Box 13: In this example, the field crew drove behind a fast food restaurant, and discovered an
overflowing dumpster. They elected to fill out an HSI form, since it appeared to be an obvious pollution
source. The dumpster contained garbage, had no lid, and lacked any kind of runoff diversion method.
The crew noted staining and leakage between the dumpster and a drop inlet at the edge of the parking
lot. Based on this connection, they checked the box indicating that the dumpster was an observed
pollution source, even though it was a very small site.
4.7 Assessing the Physical Plant
This part of the HSI form evaluates whether
maintenance practices at the physical plant
could be a source of storm water pollution or
illicit discharge (Box 14).
Many routine practices used to maintain walls
and rooftops of buildings can potentially cause
storm water pollution. Examples include
washing, power washing, sanding,
sandblasting, painting, graffiti removal, and
roof maintenance. Maintenance practices
generate polluted wash water that can directly
enter the storm drain system during dry
weather. Other maintenance practices can
deposit fine particles or chemicals that wash
off during storms (e.g., cleaners, paint,
solvents, or sealers).
You should estimate the approximate age of
the building and its general condition. Older
buildings often require more maintenance and
upkeep, which might mean that repairs and
cleaning occur frequently. The simplest method
to get the building’s age is to look at the
original building permit. If you can’t determine
the age of the building, just skip the question.
Parking lots are found at nearly every storm
water hotspot. Parking lots requires periodic
maintenance, including litter pickup, sweeping,
pothole repair, power washing, steam cleaning,
de-greasing, re-striping or re-surfacing. Parking
lot maintenance operations can potentially
pollute storm water runoff, if sensible pollution
prevention practices are not used.
Urban Subwatershed Restoration Manual 11
Figure 25: Dumpster With Open Lid and
Stain Showing Evidence of Leakage to
Storm Drain
Next, you will want to examine how
downspouts discharge rooftop runoff from
the hotspot site. Rain that lands on rooftops is
directed into gutters and downspouts, also
known as roof leaders. From there, runoff can
be discharged directly to the storm drain
system (Figure 26a), to an impervious
surface, such as a sidewalk or parking lot
(Figure 26b), or may drain onto a pervious
surface, such as a lawn or landscaped area.
Good opportunities to disconnect downspouts
are frequently found at institutional and
municipal hotspots that have greater amounts
of pervious areas adjacent to buildings.
41
Chapter 4: Hotspot Site Investigation (HSI)
Box 14: The field crew in this example inspected a trucking distribution center identified during the
desktop screening phase. The site consisted of a large pre-fabricated warehouse that appeared to be
about ten years old, as well as an adjoining parking lot where truck rigs were parked. The crew noted
that maintenance crews were power washing the building’s exterior during their visit, and observed a
small amount of flow reaching the parking lot. Downspouts from the building discharged directly to the
parking lot, but there were no pervious areas available near the building to disconnect them. The crew
then looked at the parking lot, and noticed a few oil stains. Once again, they had a hard time figuring out
how the storm drain system worked at the site, so they checked “don’t know” and “can’t tell” in the
appropriate boxes.
of pervious areas adjacent to buildings.
Many building construction, repair, and
remodeling operations are too small to be
covered by local or state erosion and sediment
control permits. These operations can be a
significant source of pollution unless good
practices are used. The HSI asks you to assess
any construction materials that are
temporarily stored at the site, and determine if
construction activities are causing sediment
pollution (Figure 27).
4.8 Assessing TTur
ur
f/L
andscaping
urf/L
f/Landscaping
Practices
a
This part of the HSI assesses the pollution
potential of turf and landscape management
practices used at a site (Box 15).
Most hotspot sites contain some turf or
landscaping for aesthetics and buffering. You
should examine both areas to determine current
management practices, particularly in regard to
the inputs of fertilizers, pesticides, and water.
The goal is to establish natural landscaping
areas that utilize the least amount of fertilizers,
pesticides, and water possible. To see if this
approach makes sense for the site, you need to
estimate the percentage of four pervious covers
at the hotspot site. Techniques for estimating
each cover type are described here.
42
b
Figure 26: Directly Connected
Downspout (a); Indirectly Connected
Downspout Draining to Impervious
Surface (b)
Urban Subwatershed Restoration Manual 11
Chapter 4: Hotspot Site Investigation (HSI)
Box 15: In this example, the field crew investigated turf and landscaping practices at a small corporate
office park. The crew estimated that about 10% of the site was devoted to landscaping and about 5% to
mowed and non-irrigated turf. The crew looked closely at the landscaping areas situated in close proximity
to the parking lot. They noticed that the landscaping beds contained permanent sprinkler systems, were
elevated in relation to the parking lot, and appeared to be directly connected to the storm drain system.
Some evidence of organic matter and non-target irrigation flows were observed on the parking lot. As a
result, the crew checked the box that landscaping could be a pollution source at the office park.
Forest canopy cover varies greatly at hotspot
land uses, with institutional and municipal
lands usually having the most forested cover.
Commercial, industrial, and transport-related
sites have little or no forest cover, and trees
that exist are often small, ornamental varieties
used for landscaping or as a buffer between
land uses. When estimating forest canopy at
hotspot sites, only count trees that are greater
than six inches in diameter. Forest canopy
cover should include any part of the site that is
included under the tree “drip line.” The drip
line is an imaginary circle around the tree that
extends to the outermost foliage of the tree
above (see Figure 8 in Chapter 3).
Figure 27: Poorly-Managed
Construction Site
Turf grass refers to intensely managed, singlespecies grass cover maintained at the hotspot
site. Institutional land uses often have large
expanses of turf grass that may be candidates
for reforestation. Areas with turf grass are
important to evaluate at the site because they
often receive intensive input of fertilizers,
pesticides and irrigation.
Landscaping is a common feature at many
hotspot land uses, especially at commercial
sites. While the main purpose is aesthetics or
separation of traffic in parking lots, landscaped
areas can also be designed for storm water
treatment. Landscaped areas typically have
plants, small ornamental trees, and/or shrubs
planted in them (Figure 28).
Urban Subwatershed Restoration Manual 11
Figure 28: Landscaped Parking
Lot Island
43
Chapter 4: Hotspot Site Investigation (HSI)
Bare soil presents a potential source of
sediment runoff pollution. Any bare soil areas
should be replanted immediately to reduce this
potential. Tree plantings are preferred, but
planting grass is an acceptable alternative.
The HSI asks you to rate the management level
of existing turf and landscaped areas. High
input management indicates intensive
pesticide, herbicide, and/or fertilizer use. Table
12 presents some indicators for assessing the
management of turf and landscaped areas.
Non-target irrigation occurs when permanent
irrigation systems are misdirected and send
water to adjacent impervious surfaces (Figure
29). Consequently, pollutants that accumulate
on impervious surfaces can be washed directly
into the storm drain system.
The final two questions focus on whether
landscaping areas are generating storm water
runoff. Field indicators can help answer this
question. The first field indicator is to
determine the elevation of the landscaping in
relation to adjacent land. In many cases,
landscaping is higher than surrounding areas,
which causes water to flow from the
landscaped area. The second indicator is the
proximity between landscaping beds and
impervious surfaces. If landscaping is located
next to an impervious surface, runoff can be
carried away more readily. The third field
indicator to check is whether impervious
Figure 29: Non-Target Irrigation Runoff
at a Retail Garden Center
surfaces drain to the storm drain system. If all
three indicators are positive, the landscaping
area can be a pollution source. You should also
look for staining and discoloration that may
show a direct discharge from the landscaping
to the storm drain system.
4.9 Evaluating PPrivate
rivate Storm
Water Infrastructure
Many hotspot sites contain privately
maintained storm drain inlets and catch
basins, as well as privately owned storm
water treatment practices (Figure 30).
Private storm water infrastructure should be
investigated to ensure they are regularly
inspected, swept, or cleaned to reduce storm
Box 16: In this example, a field crew investigated the storm water infrastructure at the local public works yard.
No storm water treatment practices could be found at the 40-year old facility, and the gutters contained several
inches of sediment and organic matter accumulation, and were rated “filthy.” The crew managed to get access
to one catch basin, and completed SSD form MU-SD-4, which was also rated as dirty. The crew checked the
box indicating that the yard was an observed pollution source, and made a note to check whether the
municipality had a current pollution prevention plan for the yard.
44
Urban Subwatershed Restoration Manual 11
Chapter 4: Hotspot Site Investigation (HSI)
water pollution (Box 16). Also, hotspot sites
may have been required to install storm water
treatment practices when they were first built.
Some communities keep track of these
facilities, and you may want to consult their
database before or after fieldwork to determine
the type of storm water treatment facility present.
To assess the condition of private storm drain
inlets (Figure 31), you need to remove the
manhole cover to see if the inlet has a catch
basin. If it does, you should examine the depth
and type of sediment or pollutant accumulation
using the SSD form described in Chapter 6.
Bioretention Area
Perimeter Sand Filter
Infiltration Trench
Open Channel
4.10 Designating Storm W
ater
Water
Hotspot Status
The last part of the HSI form assesses the
overall pollution potential for the hotspot site
and assigns it a hotspot designation: not a
hotspot, potential hotspot, confirmed hotspot,
or severe hotspot.
The hotspot designation is derived using the
index in the right hand column of the HSI field
form, and it determines follow-up actions
needed after the HSI is complete. The criteria
used to make hotspot designations and
corresponding follow-up actions are described
below. The observed pollution source boxes
are used to record observable types of pollution
problems occurring at the site. Examples might
include a dumpster that is actively leaking
“dumpster juice” to a storm drain, or a stained
path from the dumpster or vehicle storage area
to a storm drain. In the example shown in
Figure 32, vehicle leaks and staining around
outdoor storage areas and “dumpster juice”
leading to the storm drain were all observed, so
the observed pollution source box was checked
for each of these questions.
The circles in the index column are used to rate
the potential of the site to generate pollutants.
The general rule is when “Yes” is checked for a
site question (or for both questions when a
second one is asked), the circle that
corresponds to that question should be checked.
Some further guidance for deciding when to
check the circle for the questions that have
multiple answer choices is provided in Table 20.
Urban Subwatershed Restoration Manual 11
Figure 30: Four Storm Water Treatment
Practices Used in Hotspot Areas
Once all appropriate boxes and circles have
been checked on the form, the severity of
pollution at the hotspot site can be easily
computed by counting the number of checked
circles and boxes and comparing these totals to
the criteria that follow to define the severity of
the hotspot.
Not a Hotspot
A sites is not considered a hotspot if fewer than
Figure 31: Storm Drain Inlet Clogged
With Organic Matter and Litter
45
Chapter 4: Hotspot Site Investigation (HSI)
Figure 32: Sample Completed Field Form for an Individual Hotspot Site
Table 20: Hotspot Designation Criteria
Question
Number
46
Check the circle if……
B3
Any of the listed vehicle activities are present
C2
Wastes are stored on asphalt/concrete or liquid wastes are stored in an area without a berm
D1
Any of the listed waste products are present
D2
Any of the listed dumpster conditions exist
E1
Building condition is stained, dirty or damaged; OR if evidence of poor maintenance practices
exists
E2
Parking lot condition is stained, dirty or breaking up; OR if surface material is paved/concrete
F1
Bare soil is greater than 20% of site
F2
More than 40% of site has medium or high maintenance turf grass
G1
No storm water treatment practice is present
G2
Two or more types of material were rated 3 or higher
Urban Subwatershed Restoration Manual 11
Chapter 4: Hotspot Site Investigation (HSI)
five “potential pollution source” circles are
checked on the HSI form and no “observed
pollution source” boxes are checked. These
sites may have potential for on-site retrofits or
pervious area restoration, but are not a priority
for enforcement follow-up pollution prevention
assessments.
Potential Hotspot
Potential hotspots are designated when current
operations suggest that the site may be a
hotspot but no pollution indicators are
observed. Sites receive this designation when
five to 10 “potential pollution source” circles
are checked but no “observed pollution source”
boxes are checked. Follow-up actions at
potential hotspots involve targeted pollution
prevention, and possible inspections once all
confirmed and severe hotspot sites in the
subwatershed have been corrected.
Confirmed Hotspot
A site is designated as a confirmed hotspot if
10 to 15 “potential pollution source” circles are
checked on the HSI form and/or one “observed
pollution source” box is checked. Several
follow-up actions should be considered for
confirmed hotspots, starting with efforts to see
if the site is subject to NPDES industrial storm
water permit regulations. You may also want to
arrange an on-site inspection, illicit discharge
investigation, or a review of the storm water
pollution prevention plan for the site.
Severe Hotspot Designation
This is the most serious hotspot designation
and is assigned to sites where immediate
enforcement action is needed. A site is
designated as a severe hotspot when 15 or
more “potential pollution source” circles are
filled in on the HSI form, and/or two or more
“observed pollution source” boxes are checked.
Severe hotspots warrant immediate referral for
inspection, enforcement, and/or testing for
illicit discharges.
A list of recommended follow-up actions for
hotspots can be found in Table 21. If you are
interested in managing a particular pollutant in
your subwatershed, you may want to consult
Table 22, which matches HSI question
responses with specific pollutants. You may
choose to use this approach to rank your
hotspots.
The HSI Pollution Severity Index can be
used to determine subwatershed hotspot
density, and establish whether detailed followup investigations are needed. It also allows you
to compare hotspots across subwatersheds to
determine if a particular land use is generating
a disproportionate number of hotspots. If such
a cluster is found, you will certainly want to
target these land uses for education or
compliance programs. Chapter 7 provides
extensive guidance on how to interpret HSI
data to screen subwatershed hotspots to target
education and enforcement efforts.
Table 21: Follow-Up Actions for Hotspots and Manuals
Where More Information Can be Found
Follow-up Action
Urban Subwatershed Restoration Manual
Follow-up on-site inspection
Test for illicit discharge
Onsite non-residential retrofit
Pervious area restoration
Review of storm water pollution prevention plan
Manual 8
Brown et al, 2004
Manual 3
Manual 7
Manual 8
Table
Type of Pollution
Nutrients
Oil and Grease
Trash/Litter
Bacteria
Sediment
Hydrocarbons
22: Possible Pollution Indicator Questions
Indicator Question(s)
B8, C1-C7, D1-D3, F2, F5, G2
B3-B7, C1-C5, E2
D1-D3, G2
C2-C6, D1-D3
E1-E4, F1, G2
B5-B6, E2
Urban Subwatershed Restoration Manual 11
47
Chapter 4: Hotspot Site Investigation (HSI)
48
Urban Subwatershed Restoration Manual 11
Chapter 5: Pervious Area Assessment (PAA)
Chapter 5: PPer
er
vious Area Assessment (P
A A)
ervious
(PA
5.1 Basics of PPer
er
vious Areas
ervious
Pervious areas and natural remnants often
present an opportunity for restoration in
subwatersheds. Most pervious areas are
municipally-owned, but institutional land
owners can also have extensive lawns and
open space (Figure 33).
The Pervious Area Assessment (PAA) looks at
large parcels of open land, such as parks,
public golf courses, schools, rights-of-way, or
protected open space. Together, pervious areas
may comprise as much as five to 10% of total
subwatershed area. Large institutional land
owners such as hospitals, colleges, corporate
parks, private golf courses, cemeteries, and
private schools may also contain underutilized
areas on their grounds with restoration
potential. Both municipal and institutional
pervious areas are attractive from the
standpoint of restoration because of their large
size and ownership. Portions of each parcel
may be good candidates for land reclamation,
reforestation or revegetation.
The PAA also evaluates the status of larger
natural area remnants that still exist in the
subwatershed. Forest and wetland fragments
are potential targets for forest or wetland
restoration for their own sake. In addition, the
possibility to expand natural areas or link them
to the stream corridor or other remnants should
always be considered. Table 23 summarizes the
site factors assessed by the PAA and the
corresponding practices to restore pervious
area parcels.
Figure 33: Two Pervious Area Parcels Commonly Seen in Urban Subwatersheds
Table 23: PAA Factors and Possible Restoration Recommendations
Pervious Area Site Factor
Corresponding Restoration Practice*
Large turf of bare soil cover
Reforestation (F-5 through F-7)
Dumping of trash or rubble
Prevention and removal (SP-1)
Presence of invasive plants
Removal and management (SP-2)
Soil compaction
Soil reclamation (SP-3)
Storm water influence
Storm water management (SP-4)
Degraded natural area remnant
Restoration (F-8)
*The code in parentheses refers to the appropriate restoration profile sheet in the restoration manual series
F- and SP- sheets can be found in Manual 7: Watershed Forestry Practices
•
Urban Subwatershed Restoration Manual 11
49
Chapter 5: Pervious Area Assessment (PAA)
5.2 Introduction to the PPA
AA
The Pervious Area Assessment (PAA)
evaluates factors that influence the feasibility
of upland restoration projects, and is conducted
on all parcels identified during the preliminary
desktop analysis. The minimum area for
selecting parcels is left up to you, based on
your staff and budget capacity. We recommend
assessing all natural area remnants and other
publicly-owned, pervious areas larger than two
acres. Privately-owned pervious areas greater
than five acres can also be assessed.
PreField W
ork
re-F
Work
Pervious area sites are identified using aerial
photos or GIS parcel data, land use data, or tax
maps. The desktop assessment may even be
used to fill out part of the PAA field form. For
example data on parcel area, current
management, ownership, and connection to
other pervious areas can often be derived from
good quality aerial photos and GIS parcel data.
If GIS data are available, your local planning
agency may be able to supply parcel layers that
identify land owners and parcel areas before
you go out to the field. If a GIS parcel layer is
not available, check to see if local agencies
have tax maps or land use maps that can be
helpful to identify PAA sites.
A separate PAA form should be completed for
each pervious parcel with a unique landowner.
For example, if a local government owns two
acres of an eight-acre contiguous forest, and
the remaining six acres are privately owned,
two PAA forms should be completed.
As far as special equipment goes, aerial
photographs and a screwdriver are helpful. You
might also want to consult good field guides on
native tree/shrub species and invasive plant
species, and learn the basics of field
identification.
Field W
ork
Work
The PAA form is divided into three parts. The
parts you fill out depend on the type of parcel
assessed. Part I is used to evaluate natural area
remnants, such as forest parcels and wetland
fragments, while Part II is designed to assess
open pervious areas, such as turf, vacant land
and meadows. Part III is used to sketch the
parcel. Each part of the PAA asks a series of
questions about vegetative characteristics and
current impacts on the parcel.
The header of the PAA form asks for
information on the watershed, subwatershed,
assessment date, team members, and camera
information (Box 17).
You will also need to record the Unique Site
ID, which can be assigned with subwatershed
initials first, “PA” next, and then the unique
identifier. The site ID can be assigned in the
office and noted on the aerial photo and/or
street map before heading into the field. You
should also record the latitude and longitude,
and landmark (LMK) number generated by
your GPS unit.
Box 17: In this example, the crew visited a school in the Ashcake Creek subwatershed that had been
identified from aerial photos during the desktop screening phase. When they arrived at the site they noticed
that it contained both a forest fragment and unutilized open space, so they elected to report each on a
separate PAA form.
50
Urban Subwatershed Restoration Manual 11
Chapter 5: Pervious Area Assessment (PAA)
5.3 Basic PParcel
arcel Characterization
This part of the PAA form describes the parcel
in terms of area, access, ownership, and
relation to other parcels (Box 18).
The first feature to estimate is the parcel area.
Pervious areas of the subwatershed have
already been screened by the two- or five-acre
thresholds. Getting a better estimate of parcel
area is important since it is often directly
related to restoration potential; larger parcels
are usually better candidates than smaller
parcels. Tax maps or aerial photos can be used
to determine parcel area in the office. In both
cases, remember to double-check the parcel in
the field in case boundaries have changed
since the map or photo was produced. If
neither is available, make a visual estimate of
parcel area in the field.
Access is an important factor for ranking
potential upland restoration projects. For
example, if access is poor, and extensive work
is needed, the parcel may not be a realistic
restoration target. Likewise, a parcel with an
unwilling landowner can make restoration
infeasible. You can discover land ownership
on tax maps or from GIS parcel data, and
remember to record the owner’s name and any
contact information on the PAA form.
5.4 Assessing Natural Area
Remnants
This part of the PAA form examines the
condition and quality of the vegetative cover in
natural area remnants (Box 19).
Box 18: The field crew first tackled the forest fragment adjacent to Pearsons Elementary School, which
was about four acres in size. Before starting the forest survey, they dropped by the office to get permission
to be on school grounds, and obtained follow-up contact information. The crew indicated that the site was
not connected to any other natural area remnants after looking more closely at their aerial photos.
Box 19: In this example, the crew surveyed a forest fragment at the elementary school. They estimated the
fragment to be about 20 years old, based on the size of the trees. The fragment was mixed with respect to
canopy coverage, with 20% open, 60% partly shaded, and 20% shaded. The dominant native tree species
were red maple and tulip poplar, with a few red oaks interspersed. Only a few native species were found in
the understory, but multi-flora rose and invasive plants covered nearly 40% of the forest floor.
Urban Subwatershed Restoration Manual 11
51
Chapter 5: Pervious Area Assessment (PAA)
The PAA form provides a column for two types
of vegetative cover: forest and wetland. If the
remnant is a forested wetland, complete both
columns. Forest fragments are important
features of the subwatershed, and are quickly
assessed by the PAA. Spring and summer are
the best seasons to evaluate forest fragments,
as both forest species and canopy coverage are
more easily observed. In terms of canopy
coverage, shaded areas are defined as parcels
receiving little or no direct sunlight. Partly
shaded areas receive intermittent, direct
sunlight for less than six hours each day. Open
areas receive full sunlight throughout the day.
Record the percent of the forest area fragment
that is subject to each of these canopy
conditions, and make sure they total 100%.
Next, you should survey the overhead canopy
and record the dominant tree species of the
forest fragment. The understory is comprised
of small trees, shrubs and vegetation that grow
under the larger trees in the fragment, and you
should also record the dominant understory
species. You may also want to make notes
about estimated age and structure of the forest
remnant.
Invasive species are any non-native species
introduced into a remnant that can potentially
damage the function and quality of the forest.
The presence of invasive plants may require
more extensive site preparation for restoration.
List the dominant invasive species present on
the PAA form, and record the percent of the
forest remnant covered by invasive plants.
Field guides can help you identify the types of
invasive trees, shrubs, and vines found in the
forest fragment. Another resource for invasive
species identification is available online at
http://www.invasivespecies.gov, and provides
links to information on invasive species found
in each state.
and are subject to periodic inundation.
Forested wetlands are dominated by woody
shrubs and trees, and often have saturated soils.
In the field, you should classify the type of
wetland and record the dominant plant species
along with any invasive species. Often,
wetland parcels can be identified in the office
using National Wetland Inventory maps.
Impacts
Many urban forest and wetland remnants are
highly impacted. In this part of the form (Box
20), you evaluate the major impacts found in
the fragment using the following criteria:
Animals: Deer, beaver, rodents, insects, and
geese can damage existing vegetation within
natural area remnants. Evidence of animal
impacts includes a browse line, trees with outer
layers of bark removed, multiple insect nests in
trees, or ragged and chewed leaves on the
majority tree species. Trees that have been
felled by beaver are easy to identify, along with
beaver dams (Figure 34). A deer browse line is
usually when all understory vegetation up to a
height of four or five feet has been removed.
You should become familiar with the types and
impacts of urban wildlife that use the remnant
as habitat.
Clearing/encroachment: Note if trees or other
vegetation have been removed from the natural
area remnant, particularly along property
boundaries. Tree stumps, mowing, tree falls, or
extensive turf areas may indicate clearing or
encroachment.
Wetland
Remaining wetlands are of particular interest
in subwatershed restoration. Three broad
wetland types are defined: aquatic, emergent,
and forested. Aquatic wetlands have shallow
water areas with floating or submerged
vegetation. Emergent wetlands are dominated
by rooted, soft-stemmed plants such as cattails,
52
Figure 34: Evidence of Beaver Activity
Urban Subwatershed Restoration Manual 11
Chapter 5: Pervious Area Assessment (PAA)
Box 20: The field crew in this example continued its survey of the forest fragment to look for impacts.
They noted that about 20% of the fragment had recently been cleared, and observed moderate
dumping activity at the end of the school access road, which they included on their sketch.
Trash and dumping: Natural area remnants
are commonly used as dumping grounds, so
significant trash or rubble is often found,
especially near access roads. Trash may
include old tires, residential trash, building
rubble, appliances and old automobiles (Figure
35). You are asked to describe the type and
amount of trash found in the remnant, and
determine if heavy equipment will be needed to
remove it.
Storm water runoff: Natural area remnants
can be impacted by untreated storm water
runoff from an adjacent area. The presence of
pipes, outfalls, or small channels may indicate a
problem. Do not check this box if sheetflow or
treated storm water runoff is being directed to
the site, unless there are obvious problems such
as erosion and gullies.
Gullies
Varying vegetative cover
Dumping locations
Storm water outfalls or channels
Locations of water sources
All streams, roads, impervious cover, and
structures
Access points
Proposed planting areas
Overhead wires
Invasive species
Important natural features (e.g.,
endangered species, specimen trees
Any other important or unique features
In addition, you should take several digital
photos of each remnant for further analysis.
Hydrologic Impacts: Record any evidence of
water level fluctuation in the wetland, such as
debris lines, water marks or sediment stains on
trees, and look for any evidence that the
wetland has been partially drained, filled or
impounded. You may want to look for drainage
tiles or ditches within the wetland. Also look
for hydraulic impacts caused by culverts that
may occur near roads as they may create
localized wetland conditions. Beaver dams
may also cause water level fluctuations. Each
of these hydrologic impacts can cause dramatic
changes in wetland function, vegetation and
habitat.
Notes and Sk
etch
Sketch
This part of the PAA form is where you record
detailed notes on any impacts observed, or
other unique features associated with the
natural area remnant. You should also sketch
the natural area remnant, including some of the
following features:
Urban Subwatershed Restoration Manual 11
Figure 35: Trash and Dumping in Two
Pervious Areas
53
Chapter 5: Pervious Area Assessment (PAA)
Box 21: The field crew looked at the acre of unutilized open land at the back boundary of the school
property in this example. They didn’t bother to assess the other four acres of ball fields on the school
grounds, since the crew figured they were not suitable for reforestation any time soon. The crew noted
that the unutilized open land parcel had 100% turf and was mowed frequently. The grass itself was
bunchy and sparse, and no organic matter was found at the soil surface.
5.5 Assessing Open PPer
er
vious
ervious
Areas
This part of the PAA form quickly assesses
whether large parcels of open pervious land are
suitable for reforestation or reclamation (Box
21).
The form asks you to assess the condition and
management regime for the current vegetative
cover at the parcel. Most open parcels are
dominated by one or more types of ground
cover, such as turf grass, herbaceous cover,
bare soil, and shrubs. Some parcels may also
have a few trees or impervious cover, as well.
You should quickly estimate the percentage of
each type of cover on the parcel.
If turf grass is present, you will need to record
data about its height, mowing frequency, and
condition. First, record the approximate height
of the turf. If height varies significantly across
the site, record it as a range (e.g., two to 10
inches). Second, you will need to determine the
apparent mowing frequency. Turf height,
evidence of recent mowing (grass clippings,
mow lines, lawnmowers), and current land use
will help you decide which category to select.
A parcel that is frequently mowed is usually
less feasible for restoration than a parcel that is
infrequently mowed.
54
Third, assess and record the turf condition.
Thick, dense turf may indicate good soil quality,
while thin and sparse turf may be evidence of
soil compaction. Soil quality and compaction
are important factors to determine the
restoration potential for the parcel. Grass that
grows in clumps or bunches, with only spotty
coverage across the parcel may also be a sign
of poor soil quality.
Organic matter at the soil surface is directly
related to soil fertility. Low organic matter
means that soil amendments may be needed to
restore the site, which may bump it down on
the priority list. To judge this in the field, look
at the top few inches of soil and record the
extent of organic matter and compaction. If the
soil looks dark, moist, and rich, this usually
means it has high organic matter content. If
depth of organic matter seems to vary across
the site, take a few measurements and record it
as a range (in inches). Another important
factor to assess at the parcel is the presence or
absence of invasive plant species. Using a field
guide or color photos, record the percent of the
site covered by invasive plants, and list major
species that are found.
Urban Subwatershed Restoration Manual 11
Chapter 5: Pervious Area Assessment (PAA)
Box 22: The field crew in this example recorded that both soil compaction and erosion were evident in the
turf area at the back of the school. They could only penetrate the soil a few inches with a screwdriver, and
observed rills and gullies on steeper slopes that had patchy grass cover, which they drew on their sketch.
Impacts
This part of the PAA evaluates possible
impacts that will influence what site preparation
techniques may be needed to restore the parcel
(Box 22).
Poor Vegetative Health: The current
vegetative health is always an important impact
to assess at the parcel. You should look for any
of the following signs:
The degree of site preparation needed before
reforestation or reclamation can have an impact
on restoration project ranking. Five basic site
impacts are provided on the form: soil
compaction, erosion, trash/dumping, poor
vegetative health, and other impacts (e.g.,
storm water runoff). You are asked to visually
determine if more detailed soil or planting
investigations will be needed in subsequent visits.
Mechanical injury to plant parts
Presence of insects or disease
Evidence of mower or string trimmer
damage to trunks of trees and shrubs
Excessive surface rooting
Small, off-color leaves that drop early in
the fall on trees and shrubs
Leaf scorch
Branch tip dieback
Bare patches of soil
Dead plants
Soil Compaction: Look for evidence of
potential soil compaction, which can include
standing water, surface crusting of soil, or
evidence of construction traffic. Take a
screwdriver, to see how easily it can penetrate
the soil. If you can only go down a few inches,
you may have to deal with soil compaction in
your planting design.
Poor vegetative health may be a sign that poor
soil quality or other stressor needs to be
addressed in any future planting design.
Describe symptoms of poor health on the form,
along with any information on the apparent
cause.
Erosion: You should assess the extent of
exposed soil on the parcel, and look for signs,
such as rills and gullies. Steep slopes are also
prone to erosion, so be sure to note these on
your sketch.
Trash and Dumping: Look to see if the parcel
is used as a dumping ground. Significant
accumulations of trash and debris should be
noted, and are often found near access roads.
Describe the type and amount of trash present
on the parcel and note if heavy equipment will
be needed for clean-up.
Urban Subwatershed Restoration Manual 11
Reforestation Constraints
This part of the PAA form asks you to consider
some common constraints that may hinder
reforestation (Box 23).
The major factors that constrain reforestation
are sun exposure, adjacent water, and
infrastructure. The following criteria can help
you evaluate reforestation constraints.
Exposure: Parcels that are fully exposed to sun
and wind may experience poor planting
survival, therefore you should rate the amount
of exposure at the planting site. Full sun is
defined as more than six hours of direct
sunlight each day, whereas partial sun refers to
areas that get direct sunlight for less than six
55
Chapter 5: Pervious Area Assessment (PAA)
Box 23: In this example, the field crew noted that the site received full sunlight and was near a water
source, which would make reforestation easier. They did notice, however, that buildings were nearby,
and they drew this on the sketch.
hours a day, or filtered light throughout the
entire day. A planting site is considered shady
if it gets little or no direct sunlight, or receives
less than six hours of filtered light per day
from the overhead canopy.
Nearby water source: Urban trees usually
require supplemental water to survive the first
few years after planting. Therefore, check to
see if a nearby water source is present and
describe it (e.g., automatic irrigation system,
perennial stream, nearby faucet or hose, or
storm water pond).
Other constraints: Urban reforestation must
always respect adjacent infrastructure, so
check for overhead wires, pavement, buildings
or underground utilities that may constrain
planting. If any of these are present, you should
make notes about the approximate location and
sketch them for future reference.
Notes and Sk
etch
Sketch
The last part of the PAA form is where you can
provide notes on any impacts or unusual
features found at the parcel. When you draw a
rough sketch of the site, be sure to show your
proposed planting area, and include other
features such as the following:
Adjacent streams, roads, impervious cover
and structures
Gullies
Vegetative cover types
Dumping locations
Any storm water outfalls or channels
Location of supplemental water sources
and access points
Proposed planting areas
Overhead wires and potential underground
utilities
Invasive species
5.6 Initial Management
Recommendations
This part of the PAA form asks you to initially
recommend possible restoration actions for the
parcel.
Natural Area R
emnant
Remnant
Three initial recommendations can be made to
restore or conserve a forest or wetland
fragment, and determine what, if any,
additional field surveys are needed (Box 24).
Good candidate for conservation/
protection: Natural area remnant sites are
Box 24: In this example, the field crew determined that 40% of the parcel was covered with invasive
plants, and trash dumping and clearing were evident, but given the good access and public ownership,
they recommended that this site be included as a potential candidate for restoration.
56
Urban Subwatershed Restoration Manual 11
Chapter 5: Pervious Area Assessment (PAA)
good candidates for conservation or protection
if they possess a large parcel area, are adjacent
to other pervious areas, and are publiclyowned. Mature forest sites with shaded canopy,
and few invasive plants and impacts are a good
example. Any parcel that is part of a migratory
corridor or green way, or possesses specimen
trees, or rare, threatened, or endangered
species should always be considered. Sites
meeting these criteria should be referred for
additional wetland and/or forest investigations,
and should be a priority for conservation.
Potential restoration candidate: These
natural area remnants show clear signs of
impacts from adjacent urban areas, but could
potentially be improved if trash, invasive plants,
or storm water are controlled better. The
restoration potential for these sites can only be
determined through additional field surveys.
Poor restoration or conservation candidate:
Natural area remnants are normally considered
poor candidates for restoration if they have one
or more of the following characteristics: poor
access, an unwilling land owner, conflicting
land use, potential soil or water contamination
from past use, dominant invasive species, or
extensive storm water impacts. Unless these
parcels are the only ones that remain in your
subwatershed, they are a low priority for
further investigation.
Reforestation R
ecommendation
Recommendation
Four basic recommendations can be made for
potential reforestation, and the criteria to make
them are described below (Box 25).
Good candidate for natural regeneration:
Parcels are good candidates for natural
regeneration if they have desirable trees to
provide a seed source, few invasive species,
full or partial sun exposure, or existing signs of
natural regeneration. Good regeneration sites
also have good soils, infrequent mowing
regimes, and a potentially willing land owner.
Parcels that meet these criteria are good
candidates for more detailed investigations and
land owner contact.
May be reforested with minimal site
preparation: Good reforestation sites will have
full or partial sun, a nearby water source, easy
access, and few site constraints. In addition,
sites should have little evidence of soil
compaction, invasive plants, and trash/
dumping, and be reforested with minimal site
preparation. Parcels that meet these criteria are
good candidates for more detailed
investigations and land owner contact.
May be reforested with extensive site
preparation: These parcels may be good
candidates for reforestation, but may require
more costly site preparation. Parcels have full
or partial sun and a nearby water source but
suffer from soil compaction, invasive plants,
trash/dumping, or storm water erosion. Heavy
equipment may be needed to remove rubble or
invasive plants, or to amend soils. Depending
on their size and location, these parcels may be
recommended for further investigation.
Poor reforestation or regeneration site:
Parcels are considered poor candidates for
reforestation if they have three or more of the
following characteristics: poor access, an
unwilling land owner, a conflicting land use,
potential soil or water contamination, dominant
invasive species, and extensive storm water or
dumping impacts. These factors can preclude
cost-effective reforestation, and make the
parcel a low priority for further investigation.
Box 25: In this example, the field crew felt the parcel would be a good candidate for reforestation based
on its good access and public ownership, even though some site preparation would be needed to
alleviate soil compaction and the lack of organic matter.
Urban Subwatershed Restoration Manual 11
57
Chapter 5: Pervious Area Assessment (PAA)
58
Urban Subwatershed Restoration Manual 11
Chapter 6: Streets and Storm Drains (SSD)
Chapter 6: Streets and Storm Drains (SSD)
6.1 Basics of Streets and
Storm Drains
Urban streets and storm drains can accumulate
and store urban pollutants. Relatively minor
changes in municipal maintenance procedures
can help remove these pollutant loads in some
subwatersheds. The condition of the local road
and storm drain infrastructure can be quickly
assessed by checking to see if current
maintenance practices could reduce pollutant
accumulation (Figure 36).
6.2 Introduction to the SSD
The Streets and Storm Drains (SSD) form
helps quantify the impacts of subwatershed
maintenance practices on urban streams, and
identify potential pollutant reduction strategies.
The SSD asks you to visually inspect pollutant
accumulation along streets, curb and gutters,
and storm drain inlets, and assesses the retrofit
potential of large parking lots. The SSD also
randomly inspects storm drains to estimate
pollutant accumulation in catch basins, and
evaluate a series of factors to determine the
feasibility of street sweeping as a pollutant
reduction strategy for the subwatershed. The
output from the SSD is an estimate of the
severity of pollutant accumulation within the
road and storm sewer system of the
subwatershed, as well as specific retrofit
opportunities for large parking lots. Table 24
summarizes six pollutant sources assessed by
the SSD, and the corresponding restoration
practices used to reduce pollution from them.
The SSD form consists of five parts:
Location – Collects basic location information
on street names and adjacent land use at the
points sampled in the subwatershed.
Street Condition – Measures the degree of
pollutant accumulation on street surfaces and
curbs, and characterizes street type and
condition, access, and parking issues that
influence the feasibility of street sweeping.
Storm Drain Inlets and Catch Basins –
Characterizes the current condition of the
storm drain infrastructure and the degree of
pollutant accumulation in catch basins, if
present.
Figure 36: Indicators that Changes in Municipal Street Maintenance May Be Needed
Urban Subwatershed Restoration Manual 11
59
Chapter 6: Streets and Storm Drains (SSD)
Table 24: SSD Assessment Factors and Possible Restoration Recommendations
Street or Storm Drain Factor Assessed
Corresponding Restoration Practice*
Pollutant accumulation in road or curbs
Street sweeping (M-9)
Pollutant accumulation in catch basins
Catch basin clean-outs (M-9)
Unlabeled storm drains
Storm drain stenciling (N-21)
Power washing pollution prevention practices
(H-11)
Parking lot retrofit (SR-6, OS-7 to 11)
Road maintenance pollution prevention practices
(M-9)
Parking lot maintenance
Uncontrolled storm water discharge
Ongoing road construction/repair
*The code in parentheses refers to the appropriate restoration profile sheet in the Restoration Manual Series. Codes
are as follows:
•
OS- and SR- sheets can be found in Manual 3: Storm Water Retrofit Practices
•
N- and H- sheets can be found in Manual 8: Pollution Source Control Practices
•
M–9: Manual 9: Municipal Practices and Programs
Non-Residential Parking Lots –Assesses the
condition, size, and retrofit potential of larger
parking lots.
Pollution Reduction Strategies –Makes an
initial recommendation as to the feasibility of
improving municipal maintenance practices, as
well as parking lot retrofit potential.
Before you conduct an SSD, you need to gather
the proper equipment and maps (Table 5 in
Chapter 2). Two key items are a pry bar and a
sediment measuring rod, which are used to
gain access to storm drain manhole covers and
catch basins to measure pollutant
accumulation. The measuring rod should be at
least six feet long and be marked at six-inch
intervals to estimate the amount of sediment in
the bottom of the catch basin. A permission
letter from the local public works department
may also be needed to open up catch basins.
Completing the FField
ield FForm
orm
Each SSD form begins with basic information
on the watershed and subwatershed, as well as
a Unique Site ID assigned to the street or storm
drain assessed (Box 26). Record the date,
members of the field crew, and information
about the camera and picture numbers taken at
the site. Note if it has rained in the last 24
hours to determine if the street or storm drain
system may have been “cleaned” by the runoff
from a recent storm event.
60
6.3 Basic Characterization
This part of the SSD form records general
information about where the streets and storm
drains are located (Box 27).
You should record the name of the street(s) in
the neighborhood, or the location of the large
parking lot. Also, record the type of adjacent
land use, and indicate whether an HSI or NSA
form was completed. If so, make sure to crossreference the Unique Site ID on both field
forms.
6.4 Street Conditions
This part of the SSD form looks at the degree
of pollutant accumulation on street surfaces
and curbs (Box 28).
To start, you need to classify the street or road
being assessed. Four basic types of roads
potentially exist in a subwatershed, ranging
from wide arterials to narrow alleys. Road
classification is important since each type has
different traffic volumes, parking requirements,
and curb access that influence maintenance and
sweeping schedules. The following criteria can
be used to classify four types of roads:
Arterial roads are the largest roads in a
subwatershed, and carry through-traffic
between and across developed areas and from
suburban areas to urban areas. They often have
Urban Subwatershed Restoration Manual 11
Chapter 6: Streets and Storm Drains (SSD)
controlled exits and entrances, and have the
highest design speeds. Arterial roads can have
four to six traffic lanes with large rights-ofway.
Collector roads connect traffic between
arterial and local roads and sometimes offer
direct access to commercial or residential
properties. The design speeds of collector
roads are slightly higher than local roads (2540 miles per hour), and they typically have two
to three traffic/parking lanes with larger rightsof-way.
Local roads are designed to carry local traffic
and provide direct access to residential and
commercial properties. These roads often have
design speeds of 25 miles per hour or less and
have two to four traffic lanes. The width of the
travel lanes and rights-of-way of local roads
are usually narrower than collector or arterial
roads.
Alleys (a.k.a. alleyways) are narrow service
streets providing access to the rear of a lot, and
are typically the narrowest road type allowed
in most communities.
Box 26: The field crew in this example examined streets and storm drains in a residential neighborhood
in the Back Creek subwatershed of Little River. The crew located the neighborhood using map
coordinates, took two photos using a disposable camera, and noted that it had not rained in the last 24
hours.
Box 27: The field crew assessed street and storm drain conditions at the intersection of Cool Spring
Road and Lost Colony Drive, and noted the residential land use on this part of the SSD form. They
inspected two catch basins at the intersection.
Box 28: In this example, the crew classified both neighborhood streets as local, based on their widths
and posted traffic speeds. The pavement surface showed some cracks, and a few cars were parked on
the street. The crew then looked at pollutant accumulation in the gutters, and rated them as having low
levels of sediment and organic matter, and a moderate amount of litter at the time of the survey.
Urban Subwatershed Restoration Manual 11
61
Chapter 6: Streets and Storm Drains (SSD)
Once the street has been classified, you should
assess the condition of the surface. Pavement
condition is important, since it can be
significant source of sediment, as well as oil
and grease and trace metals from ordinary car
wear and tear. Pavement conditions also
provide clues about the nature and extent of
recent street maintenance. Poor pavement
condition may also suggest that the street may
be a source of sediment and other pollutants.
Cracked pavement refers to hairline fractures
in the pavement where water seeps into the
roadbed. Broken pavement occurs when the
surface has deteriorated to the point that gaps,
potholes, patches, or “alligatoring” are
common. Sediments and other pollutants can
be trapped in broken pavement, making it
difficult to remove them during street sweeping
operations.
The feasibility of street sweeping also depends
on access to the curb, so the next question
examines the prevalence of on-street parking.
Access to the curb and gutter, and storm drain
inlets can be limited if on-street parking is
permitted (unless temporary parking
restrictions are imposed). Look for signs that
indicate parking restrictions, and assume that
on-street parking is permitted if no signs are
present. Note the extent of on-street parking if
it occurs.
allow vehicles to turn around. Many of these
cul-de-sacs can have a radius of more than 40
feet. From a storm water perspective, cul-desacs create a huge bulb of impervious cover,
increasing the amount of storm water runoff.
Retrofitting cul-de-sacs with small landscaped
islands in the center that can infiltrate storm
water runoff may help alleviate storm water
impacts (Figure 37).
Next, turn your attention to the curb and
gutter and evaluate its current pollutant
accumulation. A curb and gutter system is a
type of storm water conveyance that quickly
delivers storm water from the road into storm
drains (Figure 38). They are not designed to
provide any treatment or pollutant removal. If
curb and gutters are present in the
neighborhood, look along the sides of the street
and rate the level of pollutant accumulation in
the system. Clean and dry curbs may suggest
that the street has recently been swept, good
housekeeping, or merely a recent storm.
Flowing or standing water could mean that
storm drain inlets are clogged or an illicit
discharge is occurring.
You are asked to separately rate the degree of
sediment, organic matter, and litter in the curb
on a five-point scale, with a value of one
indicating no accumulation, and a value of five
indicating heavy accumulation (Figure 39).
You should investigate any cul-de-sacs present
in the neighborhood. Cul-de-sacs are local
access streets with a closed circular end to
Figure 37: Cul-de-sac With
Landscaped Island
62
Figure 38: Examples of a Curb and Gutter
System Going to Storm Drain
Urban Subwatershed Restoration Manual 11
Chapter 6: Streets and Storm Drains (SSD)
6.5 Storm Drain Inlets and
Catch Basins
This part of the SSD form is where you inspect
the condition and pollutant accumulation of
storm drain inlets and catch basins (Box 29).
Rating of 1
Storm drain inlets are the locations in the
street where storm water runoff enters the
underground storm drain system (see Figure
39). Some inlets are also equipped with a
catch basin to capture and settle sediment,
debris and other pollutants. The ability of
catch basins to consistently remove sediment
and other pollutants requires routine cleanouts to maintain their storage capacity.
Rating of 3
Rating of 5
Figure 39: Varying Degrees of Trash and Debris Accumulation in Curb and Gutter
and Storm Drain Inlets
Box 29: After driving the entire neighborhood, the crew estimated that only 20% of its storm drain
inlets had catch basins, and classified the entire storm water conveyance system as being mixed (both
grass channels and storm drain pipes). The crew successfully popped two manhole covers to get
access to the catch basins, and recorded their GPS coordinates. The first catch basin was dry and
had six inches of sediment and litter accumulation on the bottom. No evidence of oil and grease or
sulfur was recorded. The second catch basin, located only a few hundred feet away, was much
different. It was wet and had a foot of water overlying six inches of sediment and organic matter
deposits. No oil was observed, but the crew detected a sulfur smell. Both catch basins were deemed
accessible for clean-out by vacuum truck.
Urban Subwatershed Restoration Manual 11
63
Chapter 6: Streets and Storm Drains (SSD)
The first question asks you to describe the type
of storm drain conveyance along the road.
Open is defined as a concrete channel or grass
swale, and enclosed means that runoff travels
through underground concrete or metal pipes.
If you have enclosed storm drains, walk down
the road to look for storm drain inlets. Look for
manhole covers over the inlet, where you can
access the catch basin below. You should
inspect several features of catch basins, if they
are present.
First, GPS the latitude, longitude, and LMK for
the inlet, so it can be found later. Next, open
the manhole and use the flashlight and
measuring rod to inspect the catch basin.
Check to see if the catch basin is wet or dry,
and note the depth of accumulation. If possible,
characterize the type of pollutants that are
found (oil and grease, sediment, litter, organic
matter) and note them on the field form.
Sediment depth is measured using the rod, and
should be recorded in inches. Note the top of
the watermark on the measuring rod, and
record its depth in inches. The difference
between the top of the watermark and the top
of the sediment mark will be the water volume
(Figure 40). Visual observations such as oil and
grease sheens or dark staining can be helpful.
Use your nose to see if the catch basin smells
like rotten egg smell. Lastly, check to see if the
inlet is accessible by a vacuum truck (i.e., is
6 feet
High Water mark
2 ft
Next, draw a rough sketch of the dimensions of
the catch basin on the back of the SSD form.
The length and width of the catch basin can be
measured using a measuring tape. The
measuring rod is then used to estimate the
depth of the catch basin. Multiplying all three
dimensions gives you an estimated sump
volume, which should be noted on the sketch.
Other things to note on the sketch include the
location of inlet and outlet pipes, and their
estimated sizes. These measurements are
important when using the Watershed Treatment
Model later in the restoration planning process
to estimate potential pollutant reduction through
clean-outs.
6.6 Non-R
esidential PParking
arking LLots
ots
Non-Residential
This part of the SSD form assesses the retrofit
potential for large parking lots encountered in
the subwatershed, using on-site or adjacent
storage retrofit techniques (Box 30). This part
also asks you to investigation whether enough
space is available to install storage retrofits,
bioretention, swales, trenches, or permeable
pavement at the parking lot. Manual 3 provides
more detailed information on these retrofits.
The first few questions ask you to evaluate the
size and condition of the parking lot. The
approximate area of the parking lot can be
determined prior to the field survey (using GIS
to estimate length and width), or can be
measured in the field using a measuring tape or
calibrated paces. Next, you should rate the
general condition of the parking lot surface,
and check to see if it is served by any kind of
storm water treatment practice. If so, take a
photo, and note it on the sketch.
Water depth
High Sediment mark
1 ft
there enough space for vacuum trucks to
adequately clean out the catch basin).
To rate the retrofit potential of a parking lot,
you should consider the following four factors:
Sediment Depth
Figure 40: Catch Basin Illustration
64
Urban Subwatershed Restoration Manual 11
Chapter 6: Streets and Storm Drains (SSD)
Box 30: The crew investigated a parking lot at an older strip shopping center with an area of about 2.5
acres. The lot had been identified from aerial photographs during the desktop screening phase. The lot
was basically empty, because it was surveyed in the early morning before shops had opened. The field
crew had a good opportunity to inspect the condition of the parking lot, and found a few cracks and
potholes, and rated the pavement condition as medium. The crew traced the storm drain system through
the lot, and could find no evidence of any treatment practice, which was not surprising since it had been
built prior to local storm water regulations. The crew then evaluated the potential to construct an on-site
retrofit to treat storm water. While they did find a few thousand square feet of adjacent unutilized land, it
was located up-gradient from the parking lot and appeared to be crossed by underground utilities.
Consequently, the crew rated the parking lot as having poor on-site retrofit potential.
1. Is there any unutilized land adjacent to or
within the parking lot that might be
suitable for a retrofit?
6.7 R
ecommended Municipal
Recommended
Practices
2. Is this land mostly downgradient of the
parking lot? This is important since runoff
needs to flow downhill into retrofit site to
ensure treatment.
The last part of the SSD form asks you to make
an initial recommendation as to the feasibility
of four pollutant reduction strategies (Box 31).
3. Is the available land at least 10% of the
size of the contributing parking lot area?
The four pollutant reduction strategies for
streets and storm drains are described below.
4. Does it appear that underground sewers,
cables, or other utilities are absent from the
parcel?
If you can answer yes to all four questions, it
usually means the parking lot has excellent
retrofit potential. Answering yes to three
questions indicates good retrofit potential,
while two or fewer yes answers would suggest
that the parking lot has little retrofit potential
and should be dropped from further
consideration. Parking lots with good or
excellent potential can be referred for
subsequent investigations in a Retrofit
Reconnaissance Inventory (RRI).
Urban Subwatershed Restoration Manual 11
Street sweeping can be an effective
maintenance practice, since roads can comprise
as much as 10 to 20% of total impervious cover
in suburban subwatersheds and even more in
highly urban subwatersheds. If pollutant
accumulation is significant along curbs, street
sweeping may be an effective pollutant
reduction strategy, particularly in highly urban
subwatersheds with many streets but few other
retrofit opportunities. Sweeping may not be
feasible, however, if pavement is in poor
condition, or on-street parking is prevalent.
Storm drain stenciling can educate residents
and owners to keep leaf litter, organic matter,
and trash out of the storm drain system, and
may reduce dumping, spills and illicit
discharges. Stenciling is also a direct and local
way to increase subwatershed awareness and
practice neighborhood stewardship.
65
Chapter 6: Streets and Storm Drains (SSD)
Catch basin clean-outs present the last
opportunity to prevent pollutants from entering
the storm drain system. The effectiveness of
this pollutant reduction strategy depends on the
basic design of the storm water conveyance
and the volume of trapped pollutants within the
catch basin. Each catch basin or sump pit tends
to be unique in how quickly it fills up, and
whether the trapped material is liquid, solid or
organic. To this extent, each catch basin
reflects the immediate conditions and
behaviors that occur in the few hundred feet of
the street it serves. If catch basins are present,
they can be cleaned out several times a year
with a vactor truck, and the contents disposed
of properly. Clean-outs have been shown to be
effective in removing trash, sediment,
nutrients, trace metals, organic carbon, and
other pollutants from downstream waters.
Parking lot retrofits refer to a variety of
practices that provide storm water treatment in
parking lots where it previously did not exist or
was not effective. Consult Manual 3 for more
details on the design of parking lot retrofits.
Table 25 offers some suggested benchmark
values to evaluate the feasibility of the four
pollution reduction strategies for the
subwatershed. The benchmark values rate the
feasibility as high, medium, or low based on
the percentage of streets or storm drains that
can be effectively treated in the neighborhood
or subwatershed. You may adjust these
benchmarks if there is a specific pollutant of
concern in the subwatershed.
Feasibility ratings are used to quickly prioritize
which combination of pollutant reduction
strategies warrants future detailed
investigation. For example, a high
accumulation rating may suggest that more
regularly scheduled street sweeping and catch
basin clean-outs could play a role in your
subwatershed restoration strategy. More
guidance on how to interpret SSD data to select
subwatershed pollutant reduction strategies is
provided in the next chapter.
Box 31: The field crew rated the pollutant accumulation along the residential streets as low to medium.
The crew rated the feasibility of both street sweeping and catch basin clean-outs as moderate, given
the low-density (1-2 cars per block) street parking, and access to catch basins for clean-outs. A single
parking lot was assigned a low potential retrofit rating due to the lack of current storm water treatment
and the poor condition of the pavement surface.
Table 25: Benchmarks Used to Select SSD Pollution Prevention Strategies
Pollution Prevention
Strategies
Street Sweeping
Storm Drain Stenciling
Catch Basin Clean-outs
Parking Lot Retrofit
Potential
66
Benchmark Rating
High
Medium
Low
Indicator
Percentage of the streets where curb and
gutter accumulation is rated three or higher
in SSD and access for sweeping is
available or can be controlled
Percentage of storm drains that are not
stenciled
Percentage of catch basins with six inches
of accumulation and are accessible for
cleanout
Acreage of parking lots rated excellent or
good retrofit
>40%
20-40%
<20%
>50%
40-50%
#20%
>50%
40-50%
<40%
#25 acres
5-24 acres
#5 acres
Urban Subwatershed Restoration Manual 11
Chapter 7: Interpreting USSR Data to Develop Better Subwatershed Restoration Plans
Chapter 7: Interpreting USSR Data to Develop
Better Subwatershed R
estoration Plans
Restoration
7.1 Introduction
The USSR generates a wealth of information to
define an initial restoration strategy for upland
areas of your subwatershed. This chapter
presents a series of methods to compile,
organize, and interpret USSR data. Seven
different methods can be used to translate
USSR data into effective upland restoration
projects:
Basic Data Management and Quality
Control
Simple Subwatershed Project Counts
Mapping USSR Data
Devising USSR Metrics
Subwatershed and Neighborhood
Screening
Source Control Plan
Additional Subwatershed Project
Investigations
The choice of which data analysis method(s)
are used depends on your local resources,
restoration goals, and the actual problems and
opportunities discovered during the USSR.
7.2 Basic Data Management
and Quality Control
The USSR produces an enormous amount of
raw data to characterize subwatershed
conditions. It is not uncommon to compile
dozens and even hundreds of individual forms
in a single subwatershed. The real trick is to
devise a system to organize, process and
translate USSR data into simpler outputs and
formats that can guide subwatershed
restoration efforts. The system starts with
effective quality control procedures in the
field.
Urban Subwatershed Restoration Manual 11
At the end of each day, field crews should
regroup at a predetermined location to compare
notes. The crew leader should confirm that all
subwatershed areas have been covered, discuss
initial findings, and deal with any logistical
problems. It is also a good time to check
whether field crews are measuring and
recording data in the same way, and are
consistent in what they are (or are not)
recording. Crew leaders should also review
field forms for accuracy and thoroughness.
Illegible handwriting should be neatened,
details added to notes and sketches, and all
photos and GPS waypoints accurately checked
and cross-referenced. The crew leader should
always organize the forms together in a master
binder for future reference.
Once the crews return from the field, data from
the field forms can be entered into a
spreadsheet or directly into a GIS system.
Spreadsheets are probably the easier method
for sorting and organizing USSR data. You
should start with key parameters such as
neighborhood pollution severity rating, hotspot
density, on-site retrofit potential or pervious
area restoration potential. Spreadsheet data can
also easily be imported into a GIS system for
subsequent mapping. The GIS system can
create its own database table to create
subwatershed or neighborhood maps.
You should be sure to spot-check the quality of
USSR data after it has been entered into the
spreadsheet. One simple quality control
technique is to compare how site location data
aligns with urban landmarks on aerial photos
or maps to catch any mistakes during field
transcription or data entry.
Two databases should be created to analyze
USSR data. The first master database contains
all major NSA, HSI, PAA, and SSD outputs,
while the second database contains more
detailed information on potential storm water
67
Chapter 7: Interpreting USSR Data to Develop Better Subwatershed Restoration Plans
hotspots. The HSI database is needed to make
hotspot data management easier and track
every potential, confirmed and severe hotspot
in the subwatershed. Hotspot data can also be
used to discern whether hotspots are clustered
around specific land uses, and guide follow-up
inspection and enforcement activity.
7.3 Simple Subwatershed
Project Counts
An early screening analysis can save a lot of
time. This analysis counts the major USSR
outputs that appear to have the greatest
subwatershed restoration potential. For
example, you may want to count the number
and distribution of the following:
Neighborhoods with severe nonpoint
source potential ratings
Neighborhoods with high on-site retrofit
potential
Neighborhoods with a large proportion of
high management turf
Neighborhoods with high or low forest
canopy coverage
Potential, confirmed, and severe hotspots
Potential generating land uses for illicit
discharges
7.4 Mapping USSR Data
Maps are always an excellent way to portray
subwatershed data. If your GIS system is
linked to the USSR database, you can create
many different kinds of subwatershed maps
that show the distribution of pollution sources
or restoration projects. What you choose to
map depends entirely on your initial findings,
restoration goals, and GIS capability. Examples
of helpful maps that can guide restoration
efforts include the following:
Basic neighborhood maps (these are great
for showing local stakeholders where they
live in relation to the subwatershed)
Candidate sites for natural area restoration
Neighborhoods with high on-site retrofit
potential
Candidate sites for pervious area
restoration
Neighborhoods with high nonpoint source
severity index scores
Length of streets treatable by regular
sweeping
Clusters of severe or confirmed storm
water hotspots
Fraction of storm drain system treatable by
catch basin clean-outs
Candidate sites for upland reforestation
Candidate sites for parking lot retrofits
At this stage, simply count the number of sites
in each of the major categories, or express
them as a fraction of total subwatershed or
neighborhood area. Examples might include
high input turf as a percent of total
neighborhood area, or pervious area restoration
sites as a percent of total subwatershed area.
Based on these counts, you may discover that a
particular upland restoration strategy may not
be applicable in the subwatershed. For
68
example, if no confirmed or severe hotspots
exist in the subwatershed, business pollution
prevention efforts do not need to be a part of
your initial subwatershed restoration strategy.
On the other hand, your counts may reveal that
there are so many pollution sources or
candidate sites that it makes sense to
immediately pursue more detailed field
investigations or go straight to a Source Control
Plan (sections 7.7 and 7.8). The key point is to
avoid getting lost in the raw data, but focus
instead on the data patterns that can shape the
development of your initial restoration strategy.
Remaining forest and wetland fragments
Parking lot retrofit sites
Neighborhoods with storm drain stenciling
potential
Subwatershed maps that depict the locations of
all potential upland restoration sites are
especially helpful. For example, maps that
overlay project locations over aerial
photographs can show stakeholders and team
members exactly where candidate restoration
sites are located in the subwatershed (Figure
Urban Subwatershed Restoration Manual 11
Chapter 7: Interpreting USSR Data to Develop Better Subwatershed Restoration Plans
41). These maps can also help identify adjacent
stakeholders that should be consulted about
proposed restoration projects.
Where possible, you should try to integrate
USSR outputs with USA outputs to better
understand the relationship between upland
areas and the stream corridor. For example,
you may want to see how the potential for
rooftop disconnection in upland areas can
influence stream corridor restoration projects,
as shown in Figure 42. By combining USSR
and USA data on a single map, you may
discover connections between upland sites with
high pollution potential and stream corridor
areas that reflect these impacts (e.g., suspect
outfalls, dumping sites, bank erosion, etc.).
These maps can powerfully demonstrate the
link between current residential behaviors and
stream quality in the subwatershed.
The key point to remember is that maps are
only a tool of restoration and not a product
unto themselves. Try to map with a purpose in
mind. A large number of cluttered
subwatershed maps may only confuse you,
while a smaller number may stimulate ideas for
the initial restoration strategy.
7.5 Deriving Subwatershed
and Neighborhood
Metrics
“Subwatershed metrics” is a term used to
describe the process of aggregating data from
individual USSR forms to get a clearer picture
of what is happening at the neighborhood or
subwatershed scale. An example of a
subwatershed metric is the percent of the
subwatershed that can potentially be treated by
on-site retrofits. This metric can be estimated
by analyzing NSA forms for individual
neighborhoods. You can start by estimating the
fraction of rooftop area for the neighborhood
(i.e., number of homes multiplied by the
average area of the rooftop), and then multiply
it by the fraction of rooftops that can be
feasibly disconnected. Next, add up the total
acreage of disconnectable rooftops for all the
neighborhoods in the subwatershed. You would
then add to this any additional on-site retrofit
acreage possible from parking lot retrofits
(from the SSD forms) and hotspot retrofits
(from the HSI forms). Lastly, you would divide
the total potential acreage from all three types
Figure 41: USSR Subwatershed Map Showing Pervious Area Cleanup and
Reforestation Project Sites
Urban Subwatershed Restoration Manual 11
69
Chapter 7: Interpreting USSR Data to Develop Better Subwatershed Restoration Plans
Neighborhood with Directly
Connected Downspouts
Stream Bank
Erosion Site
Subwatershed
Boundary
Figure 42: Stream Bank Erosion Identified in USA Survey and Targeted
Neighborhood for Retrofit
of on-site retrofits by the total subwatershed
area to obtain the percentage of the
subwatershed treatable by on-site retrofits. This
metric is extremely useful to determine whether
on-site retrofits will be an effective restoration
strategy for the subwatershed as a whole.
A second useful subwatershed metric is the
potential area available for pervious area
restoration. This metric can be calculated by
comparing the aggregate acreage of good and
potential restoration sites (identified during the
PAA) to the total subwatershed area. If the
metric indicates that pervious area restoration
sites comprise a minuscule fraction of total
subwatershed area, you may want to direct
your restoration efforts elsewhere (although
you may want to consult with subwatershed
stakeholders before dropping them
completely).
70
A third helpful metric is the acreage of high
input turf in a neighborhood. This metric can be
directly computed from the NSA form by
multiplying the fraction of turf cover on the
average lot by the proportion of high input
lawns in the neighborhood. This fraction can
then be multiplied by total neighborhood area
to get a planning estimate of the acreage of
high input turf for the neighborhood as a
whole. Once again, the metric is computed by
aggregating the results from all the
neighborhoods that compose the subwatershed.
The high input turf metric provides insight
about the significance of lawns as a potential
pollution source at the subwatershed level, and
can be used to target lawn care education
efforts at the neighborhood level. Additional
ideas on how to compute other neighborhood
and subwatershed metrics are provided in
Table 26.
Urban Subwatershed Restoration Manual 11
Chapter 7: Interpreting USSR Data to Develop Better Subwatershed Restoration Plans
7.6 Screening Across
Neighborhoods and
Subwatersheds
screening, subwatershed 2 clearly had the
greatest overall restoration potential according
to three of the four metrics and was selected
for priority implementation.
Subwatershed metrics have considerable value
to screen or rank the restoration potential
among groups of neighborhoods and
subwatersheds. The basic approach is simple:
select metrics that are most important to your
watershed planning goals, then see how
individual neighborhoods or subwatersheds
rank in the process. A simple example of how
metrics can be used for screening is provided
in Table 27. In this hypothetical example,
stakeholders selected three subwatersheds to
compare upland restoration potential, based on
four different metrics related to subwatershed
treatment. The four metrics were the percent of
subwatershed area that could be treated by onsite retrofits, source controls, street sweeping,
and pervious area restoration. Based on the
The same basic approach can be used to screen
neighborhoods within in a subwatershed to
effectively target education efforts. Table 28
provides a hypothetical example of how
neighborhood screening works. In this case, the
pollutants of concern for the subwatershed
were nutrients and bacteria. Four neighborhood
metrics were developed that were strongly
related to these pollutants. These metrics
include the proportion of high input turf,
overall turf cover, and the presence of pet
waste and septic systems. Based on this simple
screening process, it was evident that
neighborhood A should be the top priority for
nutrient education since it scored high for three
of the four metrics.
Table 26: USSR Subwatershed Metrics Data
Subwatershed Metrics
Acreage of high input turf in each neighborhood/subwatershed
Percent of the subwatershed that can potentially be treated by on-site retrofits
Percent of subwatershed/neighborhood undergoing redevelopment
Percent of subwatershed with reforestation potential
Percent of subwatershed with neighborhoods that have severe NPS rating
Data Sources
NSA+HSI
NSA+SSD+HSI
NSA
NSA+PAA
NSA
Percentage of hotspots in subwatershed with severe rating
Estimated percentage of catch basins in need of cleaning
Percentage of street curb and gutter in need of cleaning
Total area available for pervious area/natural area restoration
HSI
SSD
SSD+NSA
PAA
Table 27: Example of USSR Data Being Used to Compare Across Subwatersheds
Subwatershed 1
Subwatershed 2
Subwatershed 3
% with On-site
Retrofit
Potential
35
52
24
% Treatable by
Source Controls
% Treatable by
Street Sweeping
54
66
45
6
14
3
Pervious Area
Restoration as % of
Subwatershed Area
8
2
2
Table 28: Example of USSR Data Being Used to Compare Across Neighborhoods
Neighborhood A
Neighborhood B
Neighborhood C
% High Input
Turf
65
10
5
Turf Cover as %
of Lot Area
70
35
35
Urban Subwatershed Restoration Manual 11
Pet Waste
Scores
Yes
No
No
Presence of
Septic Systems
15
12
17
71
Chapter 7: Interpreting USSR Data to Develop Better Subwatershed Restoration Plans
7.7 Source Control Plan
Pollution sources and control opportunities are
different in every subwatershed. Consequently,
a unique pollution source control strategy must
be developed for each subwatershed. An
assessment framework, known as a Source
Control Plan (SCP), has been developed to
define the focus, targets, methods and delivery
of subwatershed source control efforts. The
SCP is a simple desktop analysis of NSA, HSI
and other subwatershed data to develop the
most cost effective strategy to promote better
stewardship and pollution prevention practices.
If a large number of pollution sources are
discovered in your subwatershed, an SCP
should be prepared. The SCP essentially
represents the “design” of a subwatershed
source control program. It outlines the carrots
and sticks to control priority pollution sources,
accompanied by a budget and delivery system
to implement them. The specific methods to
prepare an SCP are presented in Manual 8, but
its four basic steps are summarized below:
Step 1: Compile Subwatershed Source Control
Profile. In the first step, individual NSA and
HSI forms are analyzed to identify key
neighborhood behaviors and hotspot operations
that are generating pollutant(s) of concern.
These pollution sources become the primary
target for subsequent pollution source control.
Step 2: Prioritize Outreach Targets. In the
second step, neighborhood characteristics and
hotspot clusters are analyzed to determine
where source control efforts will be most
effective in the subwatershed. Contact
information for neighborhoods and businesses
are also compiled to determine who should be
targeted for outreach.
meetings, and enhanced delivery of municipal
services, such as lawn care assistance.
Step 4: Develop Budget and Delivery System.
In the last step, a multi-year source control
budget is computed so that source control
practices can be compared with other
restoration practices being considered within
the overall subwatershed restoration plan. A
key budget choice is selecting which partners
will be responsible for delivering the
stewardship or pollution prevention message.
Potential partners include local agencies,
community volunteers, local watershed groups,
private sector allies, and state regulatory
agencies.
7.8 Additional Subwatershed
Project Investigations
Your USSR data analyses should have shed
light on the initial priorities for the most
effective restoration strategies. The next step is
to undertake more detailed follow-up
investigations to assess the feasibility of each
project and begin designing restoration
projects or programs. Many different kinds of
investigations may be needed to create an
inventory of upland restoration projects for the
subwatershed.
Table 29 describes the range of additional
candidate project investigations that may be
triggered by your USSR data analysis. These
are summarized in Manual 2, and an expanded
description of each field or desktop method can
be found in Manuals 3, 6, 7, 8, and 9. You
should carefully choose the ones that are right
for your subwatershed. Good hunting!
Step 3: Choose Effective Carrot and Sticks.
The third step chooses the carrots and sticks
needed to change the major behavior or
practices you have targeted. Since you are
working at the subwatershed scale, most
carrots and sticks involve direct or “retail”
outreach methods. Examples include mailings,
72
Urban Subwatershed Restoration Manual 11
Chapter 7: Interpreting USSR Data to Develop Better Subwatershed Restoration Plans
Table 29: Follow-up Investigations Triggered by USSR Metrics
Restoration
Practices
Neighborhoods
Hotspots
Pervious Area
Streets and
Storm Drains
Follow-up Investigations
Source Control Plan
Residential Behavior Survey
Pipe Discharge Investigation
Municipal Regulation Analysis
Retrofit Reconnaissance Inventory (on-site)
Hotspot Compliance Investigation
Retrofit Reconnaissance Inventory
Source Control Plan
Natural Area Remnant Investigations
Watershed Forestry Inventory
Municipal Operations Analysis
Retrofit Reconnaissance Inventory (on-site)
Urban Subwatershed Restoration Manual 11
Corresponding
Restoration
Manual
Manual 8
Manual 8
Brown et al., 2004
Manual 9
Manual 3
Manual 8
Manual 3
Manual 8
Manual 7
Manual 7
Manual 9
Manual 3
73
Chapter 7: Interpreting USSR Data to Develop Better Subwatershed Restoration Plans
74
Urban Subwatershed Restoration Manual 11
Appendix A: USSR Field Sheets
Appendix A
ield Sheets
A:: USSR FField
Urban Subwatershed Restoration Manual 11
A-1
Appendix A: USSR Field Sheets
A-2
Urban Subwatershed Restoration Manual 11
Neighborhood Source Assessment
WATERSHED:
SUBWATERSHED:
UNIQUE SITE ID:
DATE: ___/___/_____
ASSESSED BY:
CAMERA ID:
NSA
PIC#:
A. NEIGHBORHOOD CHARACTERIZATION
Neighborhood/Subdivision Name: __________________________________________
Neighborhood Area (acres) _______
If unknown, address (or streets) surveyed:
_______________________________________________________________________
Homeowners Association?
Y
N
Unknown If yes, name and contact information: ___________________________
Residential (circle average single family lot size):
___________________________
Single Family Attached (Duplexes, Row Homes) <1/8 1/8 ¼ 1/3 1/3 acre
Multifamily (Apts, Townhomes, Condos)
Single Family Detached
<¼ ¼ ½ 1 >1 acre
Mobile Home Park
Estimated Age of Neighborhood: _____ years Percent of Homes with Garages: _____% With Basements ____% INDEX*
Sewer Service?
Y
N
Index of Infill, Redevelopment, and Remodeling
No Evidence
<5% of units
Record percent observed for each of the following indicators,
depending on applicability and/or site complexity
5-10%
Percentage
>10%
{
{
Comments/Notes
B. YARD AND LAWN CONDITIONS
B1. % of lot with impervious cover
{
{
B2. % of lot with grass cover
B3. % of lot with landscaping (e.g., mulched bed areas)
B4. % of lot with bare soil
*Note: B1 through B4 must total 100%
{
{
B5. % of lot with forest canopy
B6. Evidence of permanent irrigation or “non-target” irrigation
High: ____
B7. Proportion of total neighborhood turf lawns with following
management status:
Med: ____
Low: ____
B8. Outdoor swimming pools?
B9. Junk or trash in yards?
Y
N
Y
N
{
{
Can’t Tell Estimated # ____
Can’t Tell
C. DRIVEWAYS, SIDEWALKS, AND CURBS
C1. % of driveways that are impervious
C2. Driveway Condition
C3. Are sidewalks present?
Spotless
Clean
N/A
Stained
Dirty
{
Breaking up
Y
N If yes, are they on one side of street
or along both sides
Covered with lawn clippings/leaves
Receiving ‘non-target’ irrigation
What is the distance between the sidewalk and street? _____ ft.
Is pet waste present in this area?
Y
N
N/A
C4. Is curb and gutter present?
Y
N If yes, check all that apply:
Clean and Dry
Flowing or standing water
Long-term car parking
Organic matter, leaves, lawn clippings
Trash, litter, or debris
Sediment
Overhead tree canopy
{
{
{
* INDEX: { denotes potential pollution source; denotes a neighborhood restoration opportunity
A-3
Urban Subwatershed Restoration Manual
Neighborhood Source Assessment
NSA
D. ROOFTOPS
{
D1. Downspouts are directly connected to storm drains or sanitary sewer
D2. Downspouts are directed to impervious surface
D3. Downspouts discharge to pervious area
D4. Downspouts discharge to a cistern, rain barrel, etc.
*Note: C1 through C4 should total 100%
D5. Lawn area present downgradient of leader for rain garden?
Y
N
E. COMMON AREAS
E1. Storm drain inlets?
Y
N If yes, are they stenciled?
Catch basins inspected?
Y
Y
N Condition:
Clean
N If yes, include Unique Site ID from SSD sheet: _________________
E2. Storm water pond?
Y
N Is it a
wet pond or
dry pond?
Is it overgrown?
What is the estimated pond area?
<1 acre
about 1 acre
> 1 acre
E3. Open Space?
Y
N If yes, is pet waste present?
Buffers/floodplain present:
Dirty
Y
Y
N dumping?
N If yes, is encroachment evident?
Y
Y
Y
N
N
{
{
N
F. INITIAL NEIGHBORHOOD ASSESSMENT AND RECOMMENDATIONS
Based on field observations, this neighborhood has significant indicators for the following: (check all that apply)
Nutrients
Oil and Grease
Trash/Litter
Bacteria
Sediment
Other ___________________
Recommended Actions
Specific Action
Onsite retrofit potential?
Better lawn/landscaping practice?
Better management of common space?
Pond retrofit?
Multi-family Parking Lot Retrofit?
Other action(s) ___________________________
{
Describe Recommended Actions:
Initial Assessment
NSA Pollution Severity Index
Severe
(More than 10 circles checked)
High
(5 to 10 circles checked)
Moderate (Fewer than 5 circles checked)
None
(No circles checked)
Neighborhood Restoration Opportunity Index
High
(More than 5 diamonds checked)
Moderate (3-5 diamonds checked)
Low
(Fewer than 3 diamonds checked)
NOTES:
A-4
Urban Subwatershed Restoration Manual
Hotspot Site Investigation
WATERSHED:
DATE: ___/___/_____
SUBWATERSHED:
ASSESSED BY:
MAP GRID:
A. SITE DATA AND BASIC CLASSIFICATION
Name and Address: ___________________
°
LAT
UNIQUE SITE ID:
PIC#:
LMK #
'____"
CAMERA ID:
'
°
" LONG
HSI
Category:
Commercial
Industrial Miscellaneous
Institutional
Municipal
Golf Course
Transport-Related
Marina
Animal Facility
Basic Description of Operation:
____________________________________
____________________________________
SIC code (if available): ___________
____________________________________________________________ INDEX*
NPDES Status:
Regulated
Unregulated
Unknown
B. VEHICLE OPERATIONS
N/A (Skip to part C)
Observed Pollution Source?
B1. Types of vehicles:
Fleet vehicles
School buses
B2. Approximate number of vehicles: _______
Other: ____________
B3. Vehicle activities (circle all that apply): Maintained Repaired Recycled Fueled
B4. Are vehicles stored and/or repaired outside?
Y
N
Can’t Tell
Are these vehicles lacking runoff diversion methods?
Y
N
Can’t Tell
B5. Is there evidence of spills/leakage from vehicles?
Y
N
Can’t Tell
B6. Are uncovered outdoor fueling areas present?
Y
N
Can’t Tell
Y
N
N
C4. Is staining or discoloration around the area visible?
Y
Y
N
N
Y
C7. Are storage containers missing labels or in poor condition (rusting)?
Garbage
N
Can’t Tell
Can’t Tell
N
Can’t Tell
Y
N
N/A (Skip to part E)
D1. Type of waste (check all that apply):
Y
Solid Description: _______
Can’t Tell
C6. Are liquid materials stored without secondary containment?
D. WASTE M ANAGEMENT
{
Can’t Tell
Can’t Tell If yes, are they
Liquid
concrete/asphalt
bermed area
C3. Is the storage area directly or indirectly connected to storm drain (circle one)?
C5. Does outdoor storage area lack a cover?
Can’t Tell
Observed Pollution Source?
C1. Are loading/unloading operations present?
Y
N
Can’t Tell
If yes, are they uncovered and draining towards a storm drain inlet?
Y
N
Construction materials
Can’t Tell
Observed Pollution Source?
Hazardous materials
D2. Dumpster condition (check all that apply):
No cover/Lid is open
Damaged/poor condition
evidence of leakage (stains on ground)
Overflowing
D3. Is the dumpster located near a storm drain inlet?
Y
N
Can’t Tell
Y
N
Can’t Tell
If yes, are runoff diversion methods (berms, curbs) lacking?
E. PHYSICAL PLANT
N/A (Skip to part F)
{
{
{
{
{
{
Stored
Can’t Tell
B7. Are fueling areas directly connected to storm drains?
Y
N
B8. Are vehicles washed outdoors?
Y
N
Can’t Tell
Does the area where vehicles are washed discharge to the storm drain?
C. OUTDOOR MATERIALS
N/A (Skip to part D)
C2. Are materials stored outside?
Y
grass/dirt area
Where are they stored?
Washed
Leaking or
A-5
{
{
{
{
{
{
{
{
Observed Pollution Source?
E1. Building: Approximate age: ________ yrs. Condition of surfaces:
Clean
Stained
Dirty
Damaged
Evidence that maintenance results in discharge to storm drains (staining/discoloration)?
Y
N
Don’t know
*Index: { denotes potential pollution source;
{
denotes confirmed polluter (evidence was seen)
Urban Subwatershed Restoration Manual
{
{
Hotspot Site Investigation
E2. Parking Lot: Approximate age _____ yrs. Condition:
Clean
Stained
Dirty
Breaking up
Surface material
Paved/Concrete
Gravel
Permeable
Don’t know
E3. Do downspouts discharge to impervious surface?
Y
N
Don’t know
None visible
Y
N
Don’t know
Are downspouts directly connected to storm drains?
E4. Evidence of poor cleaning practices for construction activities (stains leading to storm drain)?
Y
N
F. TURF/LANDSCAPING AREAS
HSI
{
Can’t Tell
N/A (skip to part G)
Observed Pollution Source?
F1. % of site with: Forest canopy ____% Turf grass _____ % Landscaping ____% Bare Soil ____%
F2. Rate the turf management status:
High
Medium
Low
F3. Evidence of permanent irrigation or “non-target” irrigation
Y
F4. Do landscaped areas drain to the storm drain system?
Y
N
N
Can’t Tell
Can’t Tell
F5. Do landscape plants accumulate organic matter (leaves, grass clippings) on adjacent impervious surface?
G. STORM WATER INFRASTRUCTURE
Y
N
Can’t Tell
{
{
{
{
{
N/A (skip to part H)
G1. Are storm water treatment practices present?
Y
N
Observed Pollution Source?
Unknown If yes, please describe: _________________
G2. Are private storm drains located at the facility?
Y
N
Unknown
Is trash present in gutters leading to storm drains? If so, complete the index below.
Index Rating for Accumulation in Gutters
Clean
Sediment
1
2
3
4
Organic material
1
2
3
4
Litter
1
2
3
4
G3. Catch basin inspection – Record SSD Unique Site ID here: ________ Condition:
Dirty
Not a hotspot (fewer than 5 circles and no boxes checked)
Confirmed hotspot ( 10 to 15 circles and/or 1 box checked)
Follow-up Action:
Refer for immediate enforcement
Suggest follow-up on-site inspection
Test for illicit discharge
Include in future education effort
Check to see if hotspot is an NPDES non-filer
Onsite non-residential retrofit
Pervious area restoration; complete PAA sheet and record
Unique Site ID here: _____________________
Schedule a review of storm water pollution prevention plan
{
{
Filthy
5
5
5
Clean
H. INITIAL HOTSPOT STATUS - INDEX RESULTS
Potential hotspot (5 to 10 circles but no boxes checked)
Severe hotspot (>15 circles and/or 2 or more boxes checked)
Notes:
A-6
{
{
Urban Subwatershed Restoration Manual
Pervious Area Assessment
WATERSHED:
SUBWATERSHED:
DATE: ___/___/_____
ASSESSED BY:
MAP GRID:
LAT
°
UNIQUE SITE ID:
CAMERA ID:
'
" LONG
PAA
°
'
"
PIC #:
LMK #
A. PARCEL DESCRIPTION
Size: ___acre(s) Access to site (check all that apply):
Foot access
Vehicle access
Heavy equipment access
Ownership:
Private
Public Current Management:
School
Park
Right-of-way
Vacant land
Other (please describe) __________________________________________________________________________
Contact Information: ______________________________________________________________________________
Connected to other pervious area?
Y
N If yes, what type?
Forest
Wetland
Other ________________
Estimated size of connected pervious area: ____ acre(s) Record Unique Site ID of connected fragment: ____________
PART I. NATURAL AREA REMNANT
FOREST
WETLAND
B. CURRENT VEGETATIVE COVER
B. CURRENT VEGETATIVE COVER
B1. Percent of forest with the following canopy coverage:
Open _____% Partly shaded _____% Shaded _____%
*Note – these should total 100%
B2. Dominant tree species: _________________________
_______________________________________________
B3. Understory species: ___________________________
_______________________________________________
B4. Are invasive species present?
Y
N
Unknown
If yes, % of forest with invasives: _______
Species: ________________________________________
B1. % of wetland with following vegetative zones:
Aquatic: __________
Emergent: __________
Forested: __________
C. FOREST IMPACTS
C. WETLAND IMPACTS
C1. Observed Impacts (check all that apply):
Animals
Clearing/encroachment
Trash and dumping
Other
Storm water runoff
Animals
C1. Observed Impacts (check all that apply):
Clearing/encroachment
Trash and dumping
Hydrologic impacts
Other
Storm water runoff
D. NOTES
D. NOTES
*Note – these should total 100%
B2. Dominant species: _____________________________
________________________________________________
Y
N
B3. Are invasive species present?
Unknown
If yes, % of wetland with invasives: _______
Species: ________________________________________
E. INITIAL RECOMMENDATION
Good candidate for conservation/protection
Potential restoration candidate
Poor restoration or conservation candidate
A-7
Urban Subwatershed Restoration Manual
Pervious Area Assessment
PAA
PART II. OPEN PERVIOUS AREAS
A. CURRENT VEGETATIVE COVER
A1. Percent of assessed surface with:
Turf _____% Other Herbaceous _____% None (bare soil) _____% Trees _____% Shrubs ____ % Other _____%
(please describe): ______________________________________ *Note – these should total 100%
A2. Turf: Height: _____ inches Apparent Mowing Frequency:
Frequent
Infrequent
No-Mow
Unknown
Thick/Dense
Thin/Sparse
Clumpy/Bunchy
Continuous Cover
Condition (check all that apply):
A3. Thickness of organic matter at surface: _______ inches
A4. Are invasive species present?
Y
N
Unknown If yes, % of site with invasives: _____
Species:_____________________________________________________________________________
B. IMPACTS
B1. Observed Impacts (check all that apply):
Soil Compaction
Erosion
Trash and Dumping
Poor Vegetative Health
Other (describe): ____________________________________
C. REFORESTATION CONSTRAINTS
C1. Sun exposure:
Full sun
Partial sun
Shade
Unknown
C2. Nearby water source?
Y
N
Unknown
C3. Other constraints:
Overhead wires
Underground Utilities
Other (please describe): __________________
Pavement
Buildings
D. NOTES
E. INITIAL RECOMMENDATION
Good candidate for natural regeneration
May be reforested with minimal site preparation
May be reforested with extensive site preparation
Poor reforestation or regeneration site
PART III. SKETCH
A-8
Urban Subwatershed Restoration Manual
Streets and Storm Drains
WATERSHED:
SSD
UNIQUE SITE ID:
CAMERA ID:
DATE: ___/___/_____
SUBWATERSHED:
ASSESSED BY:
MAP GRID
RAIN IN LAST 24 HOURS
Y
N
PIC #
A. LOCATION
A1. Street names or neighborhood surveyed:
______________________________________________________________________
A2. Adjacent land use:
Residential
Commercial
Industrial
Institutional
Municipal
Transport-Related
A3. Corresponding HSI or NSA field sheet? If so, circle HSI or NSA and record its Unique Site ID here _____________
B. STREET CONDITIONS
B1. Road Type:
Arterial
Collector
Local
Alley
Other: _________
B2. Condition of Pavement:
New
Good
Cracked
Broken
B3. Is on-street parking permitted
Y
N If yes, approximate number of cars per block: ________
B4. Are large cul-de-sacs present?
Y
N
B5. Is trash present in curb and gutter? If so,
use the index to the right to record amount.
Sediment
Organic Material
Litter
Clean
1
1
1
Index Rating for Accumulation in Gutters
Filthy
2
3
4
2
3
4
2
3
4
5
5
5
C. STORM DRAIN INLETS AND CATCH BASINS
C1. Type of storm drain conveyance:
open
enclosed
mixed
C2. Percentage of inlets with catch basin storage: ________
N/A
C3. Catch basin #1
Sample 1-2 catch basins per NSA/HSI
°
'
"
Latitude
°
'
"
Longitude
LMK #
Picture #
Wet
Dry
Current Condition
Clear
Obstructed
Condition of Inlet
Y
N
Litter Accumulation
Y
N
Organics Accumulation
Y
N
Sediment Accumulation
__________
ft.
Sediment Depth (in feet)
Water Depth
__________ ft.
Evidence of oil and grease
Y
N
Sulfur smell
Y
N
Accessible to vacuum truck
Y
N
C4. Catch basin #2
°
'
"
°
'
"
Wet
Dry
Clear Obstructed
Y
N
Y
N
Y
N
__________ ft.
__________ ft.
Y
N
Y
N
Y
N
D. NON-RESIDENTIAL PARKING LOT (>2 acres)
D1. Approximate size: _________ acres
D2. Lot Utilization:
Full
About half full
Empty
D3. Overall condition of Pavement:
Smooth (no cracks)
Medium (few cracks)
Rough (many cracks)
Very Rough (numerous cracks and depressions)
D4. Is lot served by a storm water treatment practice?
Y
N If yes, describe: _______________________
D5. On-site retrofit potential:
Excellent
Good
Poor
A-9
Urban Subwatershed Restoration Manual
Streets and Storm Drains
SSD
E. MUNICIPAL POLLUTANT REDUCTION STRATEGIES
E1. Degree of pollutant accumulation in the system:
High
Medium
E2. Rate the feasibility of the following pollution prevention strategies:
Street Sweeping:
High
Moderate
Low
Storm Drain Stenciling:
High
Moderate
Low
Catch Basin Clean-outs:
High
Moderate
Low
Parking Lot Retrofit Potential:
High
Moderate
Low
CATCH BASIN SKETCHES
#1
Low
None
#2
Notes:
A-10
Urban Subwatershed Restoration Manual
Appendix B: Storm Water Hotspots and Potential Discharge Generators
Appendix B: Storm W
ater Hotspots and
Water
Potential Discharge Generators
Urban Subwatershed Restoration Manual 11
B-1
Appendix B: Storm Water Hotspots and Potential Discharge Generators
B-2
Urban Subwatershed Restoration Manual 11
Appendix B: Storm Water Hotspots and Potential Discharge Generators
Overview
Identification of land uses that may impact
water quality in local streams can be a difficult
and time-consuming task. Research suggests
that program managers might wish to
preferentially investigate certain land uses when
looking for the sources of possible pollutant
loads. These land uses are all considered to be
hotspot sites where routine operations can
produce higher levels of storm water pollutants,
and/or present a higher potential risk for spills,
leaks or illicit discharges. The two basic types
of hotspots are regulated hotspots that are
known sources of pollution and are subject to
federal or state regulations, and unregulated
hotspots, which are operations suspected to be
potential pollution sources and are not currently
regulated.
Identifying Potential Generating Sites
The number and type of hotspot sites present in
a subwatershed may vary greatly, and currently
there is no public database available to identify
all the regulated sites in a subwatershed.
Instead, multiple databases need to be queried
to identify generating sites that may be targets
for source control or illicit discharge
investigations. A three-phase approach is useful
for gathering as much information as possible
on suspect sites within a subwatershed that
may qualify for more intensive scrutiny.
Phase 1. Consult Publicly-Available
Databases
The federal government has a number of
databases that may help identify locations for
investigation. The Environmental Protection
Agency (EPA) operates two such databases.
The first is the Enforcement and Compliance
History Online (ECHO) database. With this
system, you can look up facility compliance
history and find facilities based on geographic
location (county level) or zip code (http://
www.epa.gov/echo/index.html). The other
database is Envirofacts (http://www.epa.gov/
enviro/). This website provides access to
multiple EPA databases to provide information
about environmental activities (including RCRA
Urban Subwatershed Restoration Manual 11
and Toxic Release Inventory [TRI] facilities)
that may affect air, water, and land anywhere
in the United States. The website also provides
access to Enviromapper, which will display the
location of regulated facilities.
Several commercial databases can provide
information on regulated industries based on
manufacturing or industrial Standard Industrial
Classification (SIC) codes. These databases
are not free, and have limitations since they are
designed primarily for marketing.
Phase 2. Consult State and Local Agencies
Most states have NPDES permit programs,
and track permit application to some extent.
You can consult state or local regulatory
agencies to obtain lists of industries that have
filed a Notice of Intent (NOI) to obtain storm
water permits, as well as those that have filed
under TRI requirements. Other agencies that
may have information on local generating sites
include fire departments (for hazardous waste),
and sanitation or wastewater treatment
agencies.
Phase 3. Permit Review
The final source for information is a review of
local permits. Most permit databases have SIC
codes as one of the fields. These codes can be
matched against the SIC codes in Table B1,
which list common generating sites under major
land use headings. If a local permit database
does not exist, it may be worthwhile to simply
get the local phone book and do a quick look
for businesses that are similar to those listed in
Table B1.
Compiling the findings from the various
databases will provide an initial list of potential
generating sites for future investigation.
However, research has found that most of
these databases can miss many of the
industries that are subject to regulation (Duke
et al., 1999 and Duke and Shaver, 1999), and
further identification may be necessary. Field
investigation with techniques can assist in
identifying many of these generating sites that
should likely be regulated by communities.
B-3
Appendix B: Storm Water Hotspots and Potential Discharge Generators
Reference Tables
This appendix is designed to assist in identifying
the land uses and associated generating sites in
a subwatershed where routine activities may
result in pollution being discharged to the storm
drain system. There are two tables provided,
each of which is described below.
Table B1 presents a listing of common land
uses that may qualify as a hotspot based on
regular activities or practices. Column one
describes the general industry type. Column
two lists their associated SIC codes, if known.
Column three identifies whether an industry
type is subject to NPDES industrial storm
water permit requirements (designated by
“X”). Facilities where only certain activities or
facilities at the site are subject to regulation are
noted (this pertains mostly to the transportrelated industries). In addition, storm water
permits are required for many “light” industrial
facilities only if material handling equipment or
activities, raw materials, immediate products,
final products, waste materials, by-products, or
industrial machinery are exposed to storm
water. Industries where this applies are noted
with an asterisk.
B-4
If only specific SIC codes within a major group
qualify for this exception, they are noted in
parentheses. Municipal facilities that are
subject to NPDES MS4 permit requirements
are designated by “MS4.” Column four
identifies those businesses that can be
considered an unregulated storm water hotspot
(also designated by “X”). Column five looks at
the illicit discharge potential of each of the
businesses listed. The potential for a business
to produce an illicit discharge is rated as either
high (H) medium (M) or low (L). This rating is
based on the likelihood that it has a direct
connection to the storm drain system (direct),
or that it can produce a transitory discharge
(indirect).
Table B2 provides a list of the SIC Codes that
are regulated by the Industrial Multi Sector
General Permit (MGSP). The list includes the
four-digit SIC codes along with the official
description. This table is provided for those
who wish to know the full description of each
SIC code that is regulated by NPDES industrial
storm water permits.
Urban Subwatershed Restoration Manual 11
Table B1: Common Storm Water Hotspots and their Pollution Potential
Illicit Discharge
Regulated
Unregulated
Industry Type/
Associated
Potential
Storm Water Storm Water
General Description
SIC Code(s)
Hotspot
Hotspot
Direct
Indirect
Commercial
Animal Care Services
0742,0752
X
L
L
7532-7539,
X
M
M
Auto Repair
7549
Automobile Parking
7521
L
M
Building Materials
5211-5251
X
L
L
Campgrounds/RV parks
7033
X
L
M
Car Dealers
5511-5599,
X
M
M
Car Washes
7542
X
L
L
Commercial Laundry/Dry
7211-7219
X
L
L
Cleaning
Convenience Stores
5399
X
L
L
Food Stores and
5141-5149
Wholesale Food and
X
L
M
5411-5499
Beverage
Equipment Repair
7622-7699
X
L
L
Gasoline Stations
5541
X
M
M
Heavy Construction
Equipment Rental and
7353
X
L
H
Leasing
X
Building and Heavy
1521-1542
(For land
X
L
H
Construction
1611-1629
disturbing
activities)
Marinas
4493
X
L
M
Nurseries and garden
5261
X
L
M
centers
Oil Change Shops
7549
X
M
Restaurants
5812,5813,7011
X
M
L
Swimming Pools
7997, 7999
X
L
L
Warehouses
Wholesalers of Chemical
and Petroleum
Industrial
Apparel and Other
Fabrics
Auto Recyclers and
Scrap Yards
Beverages and Brewing
Boat Building and Repair
Chemical Products
4221-4226
X*
(4221-4225)
51625169,5172
X
L
L
L
L
2311–2399
3131–3199
X*
2300 L
3100 H
L
M
5015, 5093
X
L
H
2082-2087
3731,3732
X*
X
2812-2899
X*
(2830, 2850)
L
L
2810 H
2820 H
2840 H
2860 M
2830 L
2850 L
2870 L
2890 L
L
H
2810 L
2820 L
2840 L
2860 L
2830 L
2850 L
2870 L
2890 L
Table B1: Common Storm Water Hotspots and their Pollution Potential
Illicit Discharge
Regulated
Unregulated
Industry Type/
Associated
Potential
Storm Water Storm Water
General Description
SIC Code(s)
Hotspot
Hotspot
Direct
Indirect
Industrial (continued)
Food Processing
Garbage Truck Washout
Activities
Industrial or Commercial
Machinery, Electronic
Equipment
Instruments;
Photographic and
Optical Goods, Watches
and Clocks and other
Miscellaneous
Manufacturing
Leather Tanners
2011–2141
X*
4212
X
2010 H
2020 H
2030 H
2040 H
2050 L.
2060 L
2070 M
2090 L
2110 M
2010 L
2020 L
2030 L
2040 L
2050 L.
2060 L
2070 L
2090 L
2110 L
L
H
3511–3599
3612–3699
X*
L
L
3812–3873
3933-3999
X*
L
L
X
X*
(2514,2522,
2542, 34113433, 34423499, 3590)
H
M
H
L
3411
Metal Production, Plating
and Engraving
Operations
2514, 2522,
2542, 33123399, 34113499, 3590
Paper and Wood
Products
2411-2499,
2511, 2512,
2517, 2519,
2521, 2541,
2611–2679
X*
(2434, 2652–
2657, 2671–
2679)
2400 L
2500 L
2600 H
2400 H
2500 L
2600 H
2911
X
2911 H
H
2711–2796
3011-3089
X*
X*
L
M
L
L
3211-3299
X*
(3233)
L
L
X*
H
L
X*
H
M
X
X
L
L
L
L
X
L
X
L
X
L
X
X
L
L
Petroleum Storage and
Refining
Printing
Rubber and Plastics
Stone, Glass, Clay,
Cement, Concrete, and
Gypsum Product
Textile Mills
Transportation
Equipment
Institutional
Cemeteries
Churches
Colleges and
Universities
Corporate Office Parks
Hospitals
Private Golf Courses
Private Schools
2211–2299
3711–3728,
3743-3799
6553
8661
8221-8222
8062-8069
8071-8072
7997
8211
M
L
L
L
L
Table B1: Common Storm Water Hotspots and their Pollution Potential
Illicit Discharge
Regulated
Unregulated
Industry Type/
Associated
Potential
Storm Water Storm Water
General Description
SIC Code(s)
Hotspot
Hotspot
Direct
Indirect
Municipal
Composting Facilities
2875
X
L
L
Public Golf Courses
7992
X
L
L
Landfills and Hazardous
4953, HZ, LF
X
L
H
Waste Material Disposal
Local Streets
MS4
X
L
H
Maintenance Depots
4173
MS4
M
Municipal Fleet Washing
4100
MS4
L
Public Works Yards
MS4
M
Steam Electric Plants
SE
X
L
Treatment Works
TW
X
L
Transport-Related (NPDES regulation is for the portion of the facility dedicated to vehicle
maintenance shops, equipment-cleaning operations, and airport deicing operations)
Airports
4581
X
L
Streets and Highways
1611, 1622
X
L
Construction
Ports
4449, 4499
X
L
Railroads
4011, 4013
X
L
Rental Car Lots
7513-7519
X
L
US Postal Service
4311
X
L
Trucking Companies and
4212-4215,
X
L
Distribution Centers
4231
Petroleum Bulk Stations
5171
X
L
or Terminals
H
M
H
L
L
M
H
H
H
M
M
M
H
Table B2: SIC Codes for NPDES Industrial Storm Water Regulated Facilities
A. Timber Products
2411
Log Storage and Handling
2421
General Sawmills and Planning Mills
2426
Hardwood Dimension and Flooring Mills
2429
Special Product Sawmills, Not Elsewhere Classified
2431–2439
Millwork, Veneer, Plywood, and Structural Wood (except 2434)
2448, 2449
Wood Containers
2451, 2452
Wood Buildings and Mobile Homes
2491
Wood Preserving
2493
Reconstituted Wood Products
2499
Wood Products, Not Elsewhere Classified
B. Paper and Allied Products Manufacturing
2611
Pulp Mills
2621
Paper Mills
2631
Paperboard Mills
2652–2657
Paperboard Containers and Boxes
2671–2679
Converted Paper and Paperboard Products, Except Containers and Boxes
C. Chemical and Allied Products Manufacturing
2812–2819
Industrial Inorganic Chemicals
2821–2824
Plastics Materials and Synthetic Resins, Synthetic Rubber, Cellulosic and Other
Manmade Fibers Except Glass
2833–2836
Medicinal chemicals and botanical products; pharmaceutical preparations; in-vitro and
in-vivo diagnostic substances; biological products, except diagnostic substances
2841–2844
Soaps, Detergents, Cleaning Preparations; Perfumes, Cosmetics, Other Toilet
Preparations
2851
Paints, Varnishes, Lacquers, Enamels, and Allied Products
2861–2869
Industrial Organic Chemicals
2873–2879
Agricultural Chemicals, Including Facilities that Make Fertilizer Solely from Leather
Scraps and Leather Dust
2891–2899
Miscellaneous Chemical Products
3952 (limited to list)
Inks and Paints, Including China Painting Enamels, India Ink, Drawing Ink, Platinum
Paints for Burnt Wood or Leather Work, Paints for China Painting, Artist’s Paints and
Watercolors
D. Asphalt Paving and Roofing Materials Manufacturers and Lubricant Manufacturers.
2951, 2952
Asphalt Paving and Roofing Materials
2992, 2999
Miscellaneous Products of Petroleum and Coal
E. Glass, Clay, Cement, Concrete, and Gypsum Product Manufacturing
3211
Flat Glass
3221, 3229
Glass and Glassware, Pressed or Blown
3231
Glass Products Made of Purchased Glass
3241
Hydraulic Cement
3251-3259
Structural Clay Products
3261-3269
Pottery and Related Products
3271-3275
Concrete, Gypsum and Plaster Products
3281
Cut Stone and Stone Products
3291–3292
Abrasive and Asbestos Products
3295
Minerals and Earth’s, Ground, or Otherwise Treated
3296
Mineral Wool
3297
Non-Clay Refractories
3299
Nonmetallic Mineral Products, Not Elsewhere Classified
B-8
Urban Subwatershed Restoration Manual
Table B2: SIC Codes for NPDES Industrial Storm Water Regulated Facilities
F. Primary Metals
3312–3317
Steel Works, Blast Furnaces, and Rolling and Finishing Mills
3321–3325
Iron and Steel Foundries
3331–3339
Primary Smelting and Refining of Nonferrous Metals
3341
Secondary Smelting and Refining of Nonferrous Metals
3351–3357
Rolling, Drawing, and Extruding of Nonferrous Metals
3363–3369
Nonferrous Foundries (Castings)
3398, 3399
Miscellaneous Primary Metal Products
G. Metal Mining (Ore Mining and Dressing)
1011
Iron Ores
1021
Copper Ores
1031
Lead and Zinc Ores
1041, 1044
Gold and Silver Ores
1061
Ferroalloy Ores, Except Vanadium
1081
Metal Mining Services
1094, 1099
Miscellaneous Metal Ores
H. Coal Mines and Coal Mining-Related Facilities
1221–1241
Coal Mines and Coal Mining-Related Facilities Sector
I. Oil and Gas Extraction and Refining
1311
Crude Petroleum and Natural Gas
1321
Natural Gas Liquids
1381–1389
Oil and Gas Field Services
2911
Petroleum refining
J. Mineral Mining and Dressing
1411
Dimension Stone
1422–1429.
Crushed and Broken Stone, Including Rip Rap
1481
Nonmetallic Minerals, Except Fuels
1442, 1446.
Sand and Gravel
1455, 1459
Clay, Ceramic, and Refractory Materials
1474–1479
Chemical and Fertilizer Mineral Mining
1499
Miscellaneous Nonmetallic Minerals, Except Fuels
K. Hazardous Waste Treatment Storage or Disposal Facilities
HZ
Hazardous Waste Treatment, Storage or Disposal
L. Landfills and Land Application Sites
LF
Landfills, Land Application Sites and Open Dumps
M. Automobile Salvage Yards
5015
Automobile Salvage Yards
N. Scrap Recycling Facilities
5093
Scrap Recycling Facilities
O. Steam Electric Generating Facilities
SE
Steam Electric Generating Facilities
P. Land Transportation
4011, 4013
Railroad Transportation
4111–4173
Local and Highway Passenger Transportation
4212–4231
Motor Freight Transportation and Warehousing
4311
United States Postal Service
5171
Petroleum Bulk Stations and Terminals
Q. Water Transportation
4412–4499
Water Transportation
R. Ship and Boat Building or Repairing Yards
3731, 3732
Ship and Boat Building or Repairing Yards
S. Air Transportation Facilities
4512–4581
Air Transportation Facilities
B-9
Urban Subwatershed Restoration Manual
Table B2: SIC Codes for NPDES Industrial Storm Water Regulated Facilities
T. Treatment Works
TW
Treatment Works
U. Food and Kindred Products
2011–2015
Meat Products
2021–2026
Dairy Products
2032
Canned, Frozen and Preserved Fruits, Vegetables and Food Specialties.
2041–2048
Grain Mill Products
2051–2053
Bakery Products
2061–2068
Sugar and Confectionery Products
2074–2079
Fats and Oils
2082–2087
Beverages
2091–2099
Miscellaneous Food Preparations and Kindred Products
2111–2141
Tobacco Products
V. Textile Mills, Apparel, and Other Fabric Product Manufacturing
2211–2299
Textile Mill Products
2311–2399
Apparel and Other Finished Products Made From Fabrics and Similar Materials
3131–3199
Leather Products (except 3111)
W. Furniture and Fixtures
2511–2599
Furniture and Fixtures
2434
Wood Kitchen Cabinets
X. Printing and Publishing
2711–2796
Printing, Publishing and Allied Industries
Y. Rubber, Miscellaneous Plastic Products, and Miscellaneous Manufacturing Industries
3011
Tires and Inner Tubes
3021
Rubber and Plastics Footwear
3052, 3053
Gaskets, Packing, and Sealing Devices and Rubber and Plastics Hose and Belting.
3061, 3069
Fabricated Rubber Products, Not Elsewhere Classified
3081–3089
Miscellaneous Plastics Products
3931
Musical Instruments
3942–3949
Dolls, Toys, Games and Sporting and Athletic Goods
3951–3955
Pens, Pencils, and Other Artists’ Materials. (except 3952)
3961, 3965
Costume Jewelry and Novelties, Buttons, and Miscellaneous Notions, Except Precious
Metal
3991–3999
Miscellaneous Manufacturing Industries.
Z. Leather Tanning and Finishing
3111
Leather Tanning and Finishing.
AA. Fabricated Metal Products
3411–3499
Fabricated Metal Products, Except Machinery and Transportation Equipment and
Cutting, Engraving and Allied Services
3911–3915
Jewelry, Silverware, and Plated Ware
3479
Coating, Engraving, and Allied Services
BB. Transportation Equipment, Industrial or Commercial Machinery
3511–3599
Industrial and Commercial Machinery (except 3571–3579)
3711–3799
Transportation Equipment (except 3731, 3732)
CC. Electronic, Electrical, Photographic and Optical Goods
3612–3699 3812–3873 Electronic, Electrical Equipment and Components, Except Computer Equipment
Measuring, Analyzing and Controlling Instrument, Photographic/Optical Goods,
3571–3579
Watches/Clocks
Computer and Office Equipment
DD. Construction (based on land disturbing activities)
1521-1542
Building Construction General Contractors And Operative Builders
1611-1629
Heavy Construction Other Than Building Construction Contractors
B-10
Urban Subwatershed Restoration Manual
Appendix B: Storm Water Hotspots and Potential Discharge Generators
References
Duke, D., K Patel, and B. Masek. 1999.
Widespread Failure to Comply with U.S. Storm
Water Regulations for Industry-Part I: Publicly
Available Data to Estimate Number of
Potentially Regulated Facilities. Environmental
Engineering Science, Volume 16, Number 4.
Duke, D and K. Shaver. 1999. Widespread
Failure to Comply with U.S. Storm Water
Regulations for Industry-Part II: Facility-Level
Evaluations to Estimate Number of Regulated
Facilities. Environmental Engineering Science,
Volume 16, Number 4.
Urban Subwatershed Restoration Manual 11
Final Reissuance of National Pollutant
Discharge Elimination System (NPDES) Storm
Water Multi-Sector General Permit for
Industrial Activities. 65 Federal Register 210
(Monday, October 30, 2000), pp.64746-64799.
Pitt, R. 1993. Investigation of Inappropriate
Pollutant Entries Into Storm Drain Systems.
EPA, Office of Research and Development,
Washington, DC. EPA/600/R-92/238.
B- 11
Appendix B: Storm Water Hotspots and Potential Discharge Generators
B-12
Urban Subwatershed Restoration Manual 11
Appendix C: Hotspot Field Identification Sheet
Appendix C: Hotspot FField
ield Identification Sheet
Urban Subwatershed Restoration Manual 11
C-1
Appendix C: Hotspot Field Identification Sheet
C-2
Urban Subwatershed Restoration Manual 11
Appendix C: Hotspot Field Identification Sheet
H OTSPOT F IELD I DENTIFICA
TION S HEET
DENTIFICATION
Commercial
Animal Care Services
Racetracks, kennels, fenced pens, veterinarians
and businesses that provide boarding services
for animals including horses, dogs, and cats
Auto Repair
Automobile Parking
Building Materials
Campgrounds/RV parks
Car Dealers
Car Washes
Commercial Laundry/Dry Cleaning
Convenience Stores
Equipment Repair
Gasoline Stations
Grocery Stores
Food and Beverage Wholesalers
Construction Equipment Rental and Leasing
Building and Heavy Construction
Marinas
Nurseries and garden centers
Oil Change Shops
Restaurants
Swimming Pools
Warehouses
Wholesalers of Chemicals and Petroleum
Industrial
Apparel and Other Fabrics
Beverages and Brewing
Boat Building and Repair
Chemical Manufacturing
Manufacturers of chemicals such as acids, alkalis,
inks, chlorine, industrial gases, pigments, fibers
and plastics, synthetic rubber, soaps and
cleaners, pharmaceuticals, cosmetics, paints,
varnishes, resins, photographic materials,
chemicals, organic chemicals, agricultural
chemicals, adhesives, sealants, and ink.
Food Processing
Meat packing plants, poultry slaughtering and
processing, sausage and prepared meats, dairy
products, preserved fruits and vegetables, flour,
bakery products, sugar and confectioneries,
vegetable and animal oils, canned, frozen or fresh
fish, snack foods, and manufactured ice
Garbage Truck Wash-out Activities
Urban Subwatershed Restoration Manual 11
Equipment
Engines and turbines, farm and garden
equipment, construction and mining machinery,
metal working machinery, computers and office
equipment, automatic vending machines,
refrigeration and heating equipment, etc.
Heavy Manufacturing
Metal Production, Plating and Engraving
Operations
Paper and Wood Products
Petroleum Storage and Refining
Gasoline, kerosene, distillate and residual oils,
lubricants, and asphalt paving and roofing
materials
Printing
Institutional
Cemeteries
Churches
Colleges and Universities
Corporate Office Parks
Hospitals
Private Golf Courses
Private Schools
Municipal
Composting Facilities
Public Golf Courses
Landfills/Hazardous Waste Material Disposal
Local Streets
Maintenance Depots
Municipal Fleet Washing
Public Works Yards
Steam Electric Plants
Treatment Works
Transport-Related
Airports
Streets and Highways Construction
Ports
Railroads
Rental Car Lots
US Postal Service
Trucking Companies and Distribution Centers
Petroleum Bulk Stations or Terminals
C-3
Appendix C: Hotspot Field Identification Sheet
C-4
Urban Subwatershed Restoration Manual 11