1
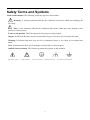
1. Safety Precautions This product complies with the requirements of the following European Community Directives: 89/336/EC (Electromagnetic Compatibility) and 73/23/EC (Low Voltage) as amended by 93/68/EC (CE-Marking). Overvoltage category III 1000V; pollution degree 2. CAT I: For signal level, telecommunication, electronic with small transient over voltage CAT II: For local level, appliances, main wall outlets, portable equipment CAT III: Distribution level, fixed installation, with smaller transient overvoltages than CAT IV. CAT IV: Units and installations, which are supplied overhead lines, which are stand in a risk of persuade of a lightning, i.e. main-switches on current input, overvoltage-diverter, current use counter. To ensure safe operation of the equipment and eliminate the danger of serious injury due to short-circuits (arcing), the following safety precautions must be observed. Damages resulting from failure to observe these safety precautions are exempt from any legal claims whatever. * Do not use this instrument for high-energy industrial installation measurement. This instrument is intended for use in installation over voltage category II according to IEC 664. For measuring circuit not exceeding 1000V DC / 750V AC, 20A. * The instrument must be set up so that the power plug can be removed from the socket easily. * Prior to connection of the equipment to the mains outlet, check that the available mains voltage corresponds to the voltage setting of the equipment. * Connect the mains plug of the equipment only to a mains outlet with earth connection. * Do not place the equipment on damp or wet surfaces. * Do not cover the ventilation slots of the cabinet to ensure that the air is able to circulate freely inside. * Do not insert metal objects into the equipment by way of the ventilation slots. * Do not place water filled containers on the equipment (danger of short-circuit in case of knock over of the container). * Do not exceed the maximum permissible input ratings (danger of serious injury and/or destruction of the equipment). * The meter is designed to withstand the stated max voltages. If it is not possible to exclude without that impulses, transients, disturbance or for other reasons, these voltages are exceeded a suitable presale (10:1) must be used. * Replace a defective fuse only with a fuse of the original rating. Never short-circuit fuse or fuse holding. * Disconnect test leads or probe from the measuring circuit before switching modes or functions. * Do not conduct voltage measurements with the test leads connected to the mA/A- and COM-terminal of the equipment. * The 20A-range is protected. To avoid damage or injury, use the meter only in circuits limited by fuse or circuit breaker to 20A or 4000VA. * To avoid electric shock, disconnect power to the unit under test and discharge all capacitors before taking any resistance measurements. * Do not conduct current measurements with the leads connected to the V/Ω-terminals of the equipment. * Check test leads and probes for faulty insulation or bare wires before connection to the equipment. 1 * To avoid electric shock, do not operate this product in wet or damp conditions. Conduct measuring works only in dry clothing and rubber shoes, i. e. on isolating mats. * Never touch the tips of the test leads or probe. * Comply with the warning labels and other info on the equipment. * The measurement instrument is not to be to operated unattended. * Always start with the highest measuring range when measuring unknown values. * Do not subject the equipment to direct sunlight or extreme temperatures, humidity or dampness. * Do not subject the equipment to shocks or strong vibrations. * Do not operate the equipment near strong magnetic fields (motors, transformers etc.). * Keep hot soldering irons or guns away from the equipment. * Allow the equipment to stabilize at room temperature before taking up measurement (important for exact measurements). * Do not input values over the maximum range of each measurement to avoid damages of the meter. * Do not turn the rotary function switch during voltage or current measurement, otherwise the meter could be damaged. * Use caution when working with voltages above 35V DC or 25V AC. These Voltages pose shock hazard. * Replace the battery as soon as the battery indicator “BAT” appears. With a low battery, the meter might produce false reading that can lead to electric shock and personal injury. * Fetch out the battery when the meter will not be used for long period. * Periodically wipe the cabinet with a damp cloth and mid detergent. Do not use abrasives or solvents. * The meter is suitable for indoor use only * Do not operate the meter before the cabinet has been closed and screwed safely as terminal can carry voltage. * Do not store the meter in a place of explosive, inflammable substances. * Do not modify the equipment in any way * Do not place the equipment face-down on any table or work bench to prevent damaging the controls at the front. * Opening the equipment and service – and repair work must only be performed by qualified service personnel -Measuring instruments don’t belong to children hands- 2 General Safety Requirements Before any operations, please read the following safety precautions to avoid any possible bodily injury and prevent this product or any other products connected from damage. In order to avoid any contingent danger, this product is only used within the range specified. Only the qualified technicians can implement the maintenance. Prevent the Fire or Bodily Injury. Use the proper power line. Only use the power cord specially provided for this product or that has been approved to be used in this user state. Connect or Disconnect Correctly. When the probe or testing wire is connected to the power lead, please do not connect and disconnect the probe or testing wire freely. Product Grounding. This product is grounded through the power lead grounding conductor. In order to prevent any electric shocking, the grounding conductor must be connected to the ground. It requires guarantee that this product has been already grounded correctly before any connection with its input or output terminal. Connect the probe correctly. The grounding end of the probe corresponds to the grounding phase. Please don't connect the grounding end to the positive phase. Pay attention to the nominal values of all terminals. In order to prevent any fire or electric shock risks, please pay attention to all the nominal values and marks of this product. Before implement any connections for this product, please read the user's manual of this product to understand the information about the rated values further. Do not make any operations without the instrument cover installed. If the cover or panel has already been removed, please don't operate this product. Use the proper fuse. Only the fuse complying with the specified type and nominal value for this product can be used. Avoid touching any exposed circuit. When the product is on power, please don't touch the uncovered contacts and parts. Please don't make any operations while there is an uncertain fault emerged. If suspecting damage to this product, please contact the qualified maintenance personnel for check. Keep a good ventilation condition. Please consult the detailed installation instruction in the user's manual so that this product can be erected correctly, keeping it under a good ventilation condition. Please do not make any operations in a moist environment. Please do not make any operates in an explosive environment. Keep the products surface clean and dry. 3 Safety Terms and Symbols Terms in this manual. The following terms may appear in this manual: Warning. A warning statement indicates the conditions and actions which may endanger the life safety. Note. A note statement indicates the conditions and actions which may cause damage to this product or other property. Terms on the product. The following terms may appear on this product: Danger: It indicates that there may be an immediate injury to you when you encounter this mark. Warning: It indicates that there may not be an immediate injury to you when you encounter this mark. Note: It indicates that there may be damage to this product or other property. Symbols on the products. The following symbol may appear on the products: High Voltage Please Consult the Manual. Protective Ground End Earth End on the Shell 4 Grounding End for Measurement General Characteristics of the PeakTech 1200 Colour Digital Storage Oscilloscope With the bandwidth of Record length of 5,000 points for each channel; Sampling rates of 100MS/s for each channel; Reading-out with the cursor; Twenty automatic measurement functions; Autoscale function; Color liquid crystal display of high resolution and high contrast with adjustable back light; Storage and call-out of waveforms; Automatic setting function provided capable of fast setting; Multiple-waveform calculation function; Implementation of detecting the average and peak values of the waveform; Digital real-time oscilloscope; Edge and video triggering function; RS232 or USB communication ports; Different continuous displaying time; User interface in two languages for the user’s choice. 25M; 5 Fig. 1 The Front Panel Function Buttons Back-light Adjustment Menu Selection Vertical Control Connector Horizontal Control Fig. 2 Explanatory Drawing for Operations 6 Trigger Control Fig. 3 Illustrative Drawing of Display Interfaces 1. The Trigger State indicates the following information: Auto: The oscilloscope is under the Automatic mode and is collecting the waveform under the non-trigger state. Trig' d: The oscilloscope has already detected a trigger signal and is collecting the after-triggering information. Ready: All pre-triggered data have been captured and the oscilloscope has been already ready for accepting a trigger. Scan: The oscilloscope captures and displays the waveform data continuously in the scan mode. Stop: The oscilloscope has already stopped the waveform data acquisition. 2. Waveform Viewing Area. 3. The purple pointer indicates the horizontal trigger position, which can be adjusted by the horizontal position control knob. 4. The reading shows the time deviation between the horizontal trigger position and the screen centre line, which equals 0 in the screen center. 5. This reading shows the time deviation between the horizontal trigger position and the window centre line, which is regarded as 0 in the window center. 6. It indicates the current function menu. 7 7. It indicates the operation options for the current function menu, which changes with the function menus. 8. The purple pointer shows the trigger level position. 9. The reading shows the trigger level value. 10. The reading shows the trigger source. 11. It shows the selected trigger type: Rising edge triggering Falling edge triggering Video line synchronous triggering Video field synchronous triggering 12. The reading shows the window time base set value. 13. The reading shows the main time base set value. 14. The two yellow dotted lines indicate the size of the viewing expanded window. 15. The icon shows the coupling mode of the CH2 channel. “—“ indicates the direct current coupling “ ~” indicates the AC coupling 16. The reading shows the vertical scale factor (the Voltage Division) of the CH2 channel. 17. The icon indicates the coupling mode of the CH1 channel: The icon "–" indicates the direct current coupling The icon "~" indicates the AC coupling 18. The reading indicates the vertical scale factor (the Voltage Division) of the CH1 channel. 19. The information shows the zero point positions of CH1 or CH2 channel. 20. The yellow pointer shows the grounding datum point (zero point position) of the waveform of the CH2 channel. If the pointer is not displayed, it shows that this channel is not opened. 21. The red pointer indicates the grounding datum point (zero point position) of the waveform of the CH1 channel. If the pointer is not displayed, it shows that the channel is not opened. 22. The positions of two purple dotted line cursors measurements. 8 How to Carry on the General Inspection After you get a new 1200 oscilloscope, it is recommended that you should make a check on the instrument according to the following steps: 1. Check whether there is any damage caused by transportation. If it is found that the packaging carton or the foamed plastic protection cushion has suffered serious damage, do not throw it away first till the complete device and its accessories succeed in the electrical and mechanical property tests. 2. Check the Accessories The supplied accessories have been already described in the Appendix B “Accessories” of this Manual. You can check whether there is any loss of accessories with reference to this description. If it is found that there is any accessory lost or damaged, please get in touch with the distributor of PEAKTECH responsible for this service or the PEAKTECH’s local offices. 3. Check the Complete Instrument If it is found that there is damage to the appearance of the instrument, or the instrument can not work normally, or fails in the performance test, please get in touch with the PEAKTECH’s distributor responsible for this business or the PEAKTECH’s local offices. If there is damage to the instrument caused by the transportation, please keep the package. With the transportation department or the PEAKTECH’s distributor responsible for this business informed about it, a repairing or replacement of the instrument will be arranged by the PEAKTECH. 9 How to Carry on the Function Inspection Make a fast function check to verify the normal operation of the instrument, according to the following steps: 1. Connect the Instrument to the Power and Push down the Power Switch Button. The instrument carries out all self-check items and shows the prompt “Press any Key Enter the Operating Mode”. Press the “UTILITY” button to get access to the “FUNCTION” menu and push down F2 the menu selection button to call out the function “Recall Factory”. The default attenuation coefficient set value of the probe in the menu is 10X, shown as Fig. 4. Fig. 4 Power on the Instrument 2. Set the Switch in the Oscilloscope Probe as 10X and Connect the Oscilloscope with CH1 Channel. Align the slot in the probe with the plug in the CH1 connector BNC, and then tighten the probe with rotating it to the right side. Connect the probe tip and the ground clamp to the connector of the probe compensator, shown as Fig. 5. 10 Probe comp CH1 Fig. 5 Connection of the Probe 3. Press the AUTOSET Button. The square wave of 1 KHz frequency and 5V peak-peak value will be displayed in several seconds (see Fig. 6). Fig. 6 Autoset Check CH2 by repeating Step 2 and Step 3. 11 How to Implement the Probe Compensation When connect the probe with any input channel for the first time, make this adjustment to match the probe with the input channel. The probe which is not compensated or presents a compensation deviation will result in the measuring error or mistake. For adjusting the probe compensation, please carry out the following steps: 1. Set the attenuation coefficient of the probe in the menu as 10X and that of the switch in the probe as 10X, and connect the oscilloscope probe with the CH1 channel. If a probe hook tip is used, ensure that it keeps in close touch with the probe. Connect the probe tip with the signal connector of the probe compensator and connect the reference wire clamp with the ground wire connector of the probe connector, and then press the button AUTOSET (see Fig. 5). 2. Check the displayed wave forms and regulate the probe till a correct compensation is achieved (see Fig. 7 and Fig. 8). Fig. 7 Displayed Wave Forms of the Probe Compensation 3. Repeat the steps mentioned if necessary. Fig. 8 Adjust Probe 12 How to Set the Probe Attenuation Coefficient The probe has several attenuation coefficients, which will influence the vertical scale factor of the oscilloscope. If it is required to change (check) the set value of the probe attenuation coefficient, press the function menu button of the channels used, then push down the selection button corresponding to the probe till the correct set value is shown. This setting will be valid all the time before it is changed again. Note: The attenuation coefficient of the probe in the menu is preset to 10X when the oscilloscope is delivered from the factory. Make sure that the set value of the attenuation switch in the probe is the same as the menu selection of the probe in the oscilloscope. The set values of the probe switch are 1X and 10X (see Fig. 9). Fig. 9 Attenuation Switch Note: When the attenuation switch is set to 1X, the probe will limit the bandwidth of the oscilloscope in 5MHz. If it is needed to use the whole bandwidth of the oscilloscope, the switch must be set to 10X. 13 How to Use the Probe Safely The safety guard ring around the probe body protects your finger against the electric shock, shown as Fig. 10. Fig. 10 Finger Guard Warning: In order to avoid suffering from the electric shock, please keep your finger behind the safety guard ring of the probe body during the operation. In order to protect you from suffering from the electric shock during your using the probe, do not touch the metal part of the probe tip when the probe is connected to the power supply. Before making any measurements, please connect the probe to the instrument and connect the ground terminal to the earth. 14 How to Implement Auto-calibration The auto-calibration application can make the oscilloscope reach the optimum condition rapidly to obtain the most accurate measurement value. You can carry out this application program at any time, but when the range of variation of the ambient temperature is up to or over 5℃, this program must be executed. For the performing of the self-calibration, all probes or wires should be disconnected with the input connector first. Then, press the “UTILITY” button to call out the FUNCTION menu; push down the F3 menu selection button to choose the option “ Do Self Cal”; finally, run the program after confirming that everything is ready now. 15 Introduction to the Vertical System Shown as Fig.11, there are a series of buttons and knobs in VERTICAL CONTROLS. The following practices will gradually direct you to be familiar with the using of the vertical setting. Fig. 11 Vertical Control Zone 1. Use the button “VERTICAL POSITION” knob to show the signal in the center of the waveform window. The “VERTICAL POSITION” knob functions the regulating of the vertical display position of the signal. Thus, when the “VERTICAL POSITION” knob is rotated, the pointer of the earth datum point of the channel is directed to move up and down following the wave form. Measuring Skill If the channel is under the DC coupling mode, you can rapidly measure the DC component of the signal through the observation of the difference between the wave form and the signal ground. If the channel is under the AC mode, the DC component will be removed by filtration. This mode helps you display the AC component of the signal with a higher sensitivity. 2. Change the Vertical Setting and Observe the Consequent State Information Change. With the information displayed in the status bar at the bottom of the waveform window, you can determine any changes in the channel vertical scale factor. z Rotate the vertical “VOLTS/DIV” knob and change the “Vertical Scale Factor (Voltage Division)”, it can be found that the scale factor of the channel corresponding to the status bar has been changed accordingly. z Press buttons of “CH1 MENU”, “CH2 MENU” and “MATH MENU”, the operation menu, symbols, wave forms and scale factor status information of the corresponding channel will be displayed in the screen. 16 Introduction to the Horizontal System Shown as Fig.12, there are a button and two knobs in the “HORIZONTAL CONTROLS”. The following practices will gradually direct you to be familiar with the setting of horizontal time base. Fig. 12 Horizontal Control Zone 1. Use the horizontal “SEC/DIV” knob to change the horizontal time base setting and observe the consequent status information change. Rotate the horizontal “SEC/DIV” knob to change the horizontal time base, and it can be found that the “Horizontal Time Base” display in the status bar changes accordingly. The horizontal scanning speed steps from 5ns up to 100s in the sequence of 1-2.5-5. 2. Use the “HORIZONTAL POSITION” knob to adjust the horizontal position of the signal in the waveform window. The “HORIZONTAL POSITION” knob is used to control the triggering displacement of the signal or for other special applications. If it is applied to triggering the displacement, it can be observed that the wave form moves horizontally with the knob when you rotate the “Horizontal Position” knob. 3. With the “HORIZONTAL MENU” button pushed down, you can set and initiate the Window Expansion. 17 Introduction to the Trigger System Shown as Fig.13, there are a knob and four buttons in the “TRIGGER CONTROLS”. The following practices will direct you to be familiar with the setting of the trigger system gradually. Fig. 13 Trigger Control Zone 1. Press the “TRIG MENU” button and call out the trigger menu. With the operations of the 5 menu selection buttons, the trigger setting can be changed. 2. Use the “TRIG LEVEL” knob to change the trigger level setting. With the rotation of the “TRIG LEVEL” knob, it can found that the trigger indicator in the screen will move up and down with the rotation of the knob. With the movement of the trigger indicator, it can be observed that the trigger level value displayed in the screen changes. 3. Press the button “SET TO 50%” to set the trigger level as the vertical mid point values of the amplitude of the trigger signal. 4. Press the “FORCE TRIG” button to force a trigger signal, which is mainly applied to the “Normal" and "Single” trigger modes. 5. The “SET TO ZERO” button is used to reset the trigger horizontal position. 18 How to Set the Vertical System The VERTICAL CONTROLS includes three menu buttons such as CH1 MENU, CH2 MENU and MATH MENU, and four knobs such as VERTICA POSITION, VOLTS/DIV (one group for each of the two channels). Setting of CH1 and CH2 Every channel has an independent vertical menu and each item is set respectively based on the channel. With the “CH1 MENU” or “CH2 MENU” menu button pushed down, the system shows the operation menu of the corresponding channel (see Fig. 14). Fig. 14 Channel Setting Menu 19 The description of the Channel Menu is shown as the following list: following form: Function Menu Coupling Channel Probe Inverted 1. Setting AC DC Ground OFF ON 1X 10X 100X 1000X OFF ON Description Block the AC component in the input signal. Unblock the AC and DC components in the input signal. Input signal is interrupted. Close the measurement channel. Open the measuring channel. Choose one according to the probe attenuation factor to make the vertical scale reading accurate. The wave form is displayed normally. Initiate the wave form inverted function. Setting Channel Coupling Taking the Channel 1 for example, the measured signal is a square wave signal containing the direct current bias. The operation steps are shown as below: (1). Press the CH1 MENU button and call out the CH1 SETUP menu. (2). Press the F1 menu selection button and select the Coupling item as “AC” to set the channel coupling as ac mode, under which the direct current component in the signal will be blocked. Then, press the F1 menu selection button again and select the Coupling item as “DC”, setting the channel coupling as dc mode, under which both dc and ac components in the signal will be unblocked. The wave forms are shown as Fig. 15 and Fig. 16. 20 Fig. 15 AC Coupling Oscillogram Fig. 16 DC Coupling Oscillogram 21 2. Setting the Channel “ON/OFF” Taking the Channel 1 for example, the operation steps are shown as below: (1). Press the CH1 MENU button and call out the CH1 SETUP menu. (2). Press the F2 menu selection button and select the Channel as OFF, with Channel 1 switched off. (3). Press F2 menu selection button again, select the channel as ON, with Channel 1 is switched on. 3. Regulate the Attenuation Ratio of the Probe In order to match the attenuation coefficient of the probe, it is required to adjust the attenuation ration coefficient of the probe through the operating menu of the Channel accordingly. If the attenuation coefficient of the probe is 1:1, that of the oscilloscope input channel should also be set to 1X to avoid any errors presented in the displayed scale factor information and the measured data. Take the Channel 1 as an example, the attenuation coefficient of the probe is 1:1, the operation steps is shown as follows: (1). Press the CH1 MENU button, access CH1 SETUP menu. (2). Press the F3 menu selection button and select 1X for the probe. The Figure 17 illustrates the setting and the vertical scale factor when the probe of the attenuation coefficient of 1:1.is used. Fig. 17 Regulation of the Attenuation Ratio of the Probe 22 A List of the Attenuation Coefficients of Probes and the Corresponding Menu Settings. Attenuation Coefficient of the Probe 1:1 10:1 100:1 1000:1 5. Corresponding Menu Setting 1X 10X 100X 1000X Setting of Wave Form Inverted Wave form inverted: the displayed signal is turned 180 degrees against the phase of the earth potential. Taking the Channel 1 for example, the operation steps are shown as follows: (1). Press the CH1 MENU button and get access to the CH1 SETUP menu. (2). Press the F4 menu selection button and select ON in the Inverted. The wave form inverted function is initiated. (3). Press the F4 menu selection button again and select OFF for Inverted item. The function of wave form inverted is closed off. For the screen display, see Fig. 18 and Fig. 19. 23 Fig. 18 Wave Form not Inverted Fig. 19 Wave Form Inverted 24 Implementation of Mathematical Manipulation Function The Mathematical Manipulation function is used to show the results of the additive and subtraction operations between Channel 1 and Channel 2. Taking the additive operation between Channel 1 and Channels 2 for example, the operation steps are as follows: 1. Press the MATH MENU button and call out the WAVE MATH menu. 2. Press the F3 menu selection button and choose CH1+CH2. The green calculated wave form M is displayed in the screen; press the F3 menu selection button again, the wave form M is closed off (see Fig. 20). Fig. 20 Wave Form resulted from CH1 +CH2 Mathematical Manipulation The corresponding FCL (Functional Capabilities List) of the Wave Form Calculation Setting CH1-CH2 CH2-CH1 CH1+CH2 Description Subtract the Channel 2 wave form from the Channel 1 wave form. Subtract the Channel 1 wave form from the Channel 2 wave form. Add the Channel 1 wave form to the Channel 2. 25 Application of VERTICAL POSITION and VOLTS/DIV Knobs 1. The .VERTIVAL POSITION knob is used to adjust the vertical positions of the wave forms of all Channels (including those resulted from the mathematical operation). The analytic resolution of this control knob changes with the vertical division. 2. The VOLTS/DIV knob is used to regulate the vertical resolution of the wave forms of all channels (including those obtained from the mathematical manipulation), which can determine the sensitivity of the vertical division with the sequence of 1-2-5. The vertical sensitivity goes up when the knob is rotated clockwise and goes down when the knob is rotated anticlockwise. 3. When the vertical position of the channel wave form is adjusted, the screen shows the information concerning the vertical position at the lower left corner (see Fig.21). Fig. 21 Information about Vertical Position 26 How to Set the Horizontal system The HORIZONTAL CONTROLS includes the HORIZONTAL MENU button and such knobs as HORIZONTAL POSITION and SEC/DIV. 1. HORIZONTAL POSITION knob: this knob is used to adjust the horizontal positions of all channels (include those obtained from the mathematical manipulation), the analytic resolution of which changes with the time base. 2. SEC/DIV knob: it is used to set the horizontal scale factor for setting the main time base or the window. 3. HORIZONTAL MENU button: with this button pushed down, the screen shows the operating menu (see Fig. 22). Fig. 22 Time Base Mode Menu The description of the Horizontal Menu is as follows: Function Menu Main Time Base Set Window Zone Window Setting Description The setting of the horizontal main time base is used to display the wave form. A window area is defined by two cursors. The defined window area for display is expanded to the full screen. 27 Main Time Base Press the F1 menu selection button and choose the Main Time Base. In this case, the HORIZONTAL POSITION and SEC/DIV knobs are used to adjust the main window. The display in the screen is shown as Fig. 23. Fig. 23 Main Time Base 28 Window Setting Press the F2 menu selection button and choose Set Window. The screen will show a window area defined by two cursors. In this case, the HORIZONTAL POSITION and SEC/DIV knobs can be used to adjust the horizontal position and size of this window area (see Fig. 24). Fig. 24 Set Window 29 Window Expansion Press the F3 menu selection button and choose Zone Window. As a result, the window area defined by two cursors will be expanded to the full screen size (see Fig. 25). Fig. 25 Zone Window 30 How to Set the Trigger System When the oscilloscope begins to collect the data and display the wave form depends on a trigger. Once it is set correctly, the trigger can transfer the unstable display into a meaningful wave form. When beginning to collect data, the oscilloscope will collect adequate data to draw the wave form at the left side of the trigger point at first. It will continuously perform the data acquisition while waiting for the trigger condition. After a trigger is detected, the oscilloscope will continuously collect data enough to draw the wave form at the right side of the trigger point. One knob and four function menu buttons are included in the trigger control zone. TRIG LEVEL: Trigger the level control knob and set the signal voltage corresponding to the trigger point. SET TO 50%: Set the trigger level as the vertical mid point value of the amplitude of the trigger signal. FORCE TRIG: It is a force trigger button for the generation of a trigger signal, which is mainly used in the “Normal” and "Single” triggering modes. SET TO ZERO: Trigger the resetting of the horizontal position. TRIG MENU: It is a trigger menu button. When it is pressed, an operation menu will be presented in the screen, shown as Fig. 26. Fig. 26 Trigger Mode Menu 31 Trigger Control There are two trigger modes: Edge Trigger and Video Trigger. Each trigger mode uses different function menu. The switching between two modes can be implemented by pressing the F1 menu selection button. Edge Trigger: It happens when the trigger input passes through a given level along the set direction. Video Trigger: Carry out the field or line video trigger of the standard video signal. The Edge and Video Trigger menus are described respectively as below: Edge Trigger Under the Edge Trigger mode, a trigger happens in the trigger threshold value of the input signal edge. When the Edge Trigger is selected, a trigger will occur in the rising or falling edge of the input signal. The Edge Trigger Menu is shown as Fig. 27. Fig. 27 Edge Trigger Menu 32 The Edge Trigger Menu is described as below: Function Menu Source Setting CH1 CH2 EXT EXT/5 Slope Mode Rising Falling Auto Normal Single Coupling AC DC HF Rjc LF Rjc Description Set Channel 1 as the trigger signal of the source. Set Channel 2 as the trigger signal of the source. Set the external trigger channel as the trigger signal of the source. Divide the External Trigger Source by 5 to expand the external trigger level range. Set a trigger on the rising edge of the signal. Set a trigger on the falling edge of the signal. Collect the wave form even if there is not trigger condition is detected. Collect the wave form only when the trigger condition is fulfilled. Collect a wave form when a trigger is detected, and then stop sampling. Block the direct current component. Unblock all components. Block the high-frequency signal and only unblock the low-frequency component. Block the low-frequency signal and only unblock the high -frequency component. To next menu Back to previous menu HoldOff 100ns~ 10s Turn “TRIG LEVEL” knob to set time slot before another trigger event Reset hold time to 100ns Holdoff Reset Holdoff:A time interval before the oscilloscope responses to next trigger signal.During this Holdoff period,the trigger system becomes “blind “ to grigger signals.This function helps to view complex signals such as an AM waveform.Press Holdoff button to activate “TRIG LEVEL” knob,then turn it to adjust Holdoff time. Make such settings in Channel 1 as Rising for Slop, Auto for Mode and DC for Coupling. The operation steps are as follows: 1. Press the TRIG MENU button and call out the trigger menu. 2. Press the F1 menu selection button and select Edge for Type. 3. Press the F2 menu selection button and choose CH1 for Source. 4. Press the F3 menu selection button and select Rising for Slope. 5. Press the F4 menu selection button and choose Auto for Mode. 33 6. Press the F5 menu selection button to next menu 7. Press the F2 menu selection button and choose DC for Coupling. The display in the screen is as Fig. 28. 8. Press the F1 menu selection button to back to previous menu 9. Press the F3 menu selection button and choose Falling for Slope. For the screen display, see Fig. 29. Fig. 28 Wave Form Triggered on the Rising Edge Fig. 29 Wave Form Triggered on the Falling Edge 34 Video Trigger After choosing “Video Trigger”, a trigger is possible in field or line of NTSC, PAL or SECAM standard video signal. The operation menu of Video Trigger is shown as Fig. 30. Fig. 30 Video Trigger Menu The description of the Video Trigger menu is shown the following table: Function Menu Source Setting CH1 CH2 EXT EXT/5 Sync Modulation Line Field Odd field Even field Designed Line NTSC PAL/SECAM Description Set Channel 1 as the trigger signal of the source. Set Channel 2 as the trigger signal of the source. Set the external input channel as the trigger signal of the source. Divide the external trigger source by 5 and expand the external trigger level range. Set a trigger level synchronization in the video line. Set a trigger level synchronization in the video field. Set synchronous trigger in the video odd field. Set synchronous trigger in video even field. Set synchronous trigger in designer line. Set synchronization and account choose video standard. To next menu Back to previous menu HoldOff Holdoff Reset 100ns~ 10s Adjust “TRIG LEVEL” key to set time slot before another trigger event Reset hold time to 100ns 35 The operation steps for setting Channel 1 in Video Trigger Mode are as below: 1. Press the TRIG MENU button and get access to the trigger menu. 2. Press the F1 menu selection button and choose Video for Type. 3. Press the F2 menu selection button and choose CH1 for Source. 4. Press the F3 menu selection button and choose Field for Sync. The screen display is shown as Fig. 31. 5. Press the F3 menu selection button and choose Line for Slope. The screen display is shown as Fig. 32. 6. Press the F3 menu selection button again and choose Odd field for Slope. The screen display is shown as Fig. 33. 7. Press the F3 menu selection button again and choose Even field for Slope. The screen display is shown as Fig. 34. 8. Press the F3 menu selection button again and choose Line num for Slope. The screen display is shown as Fig. 35. Fig. 31 Wave Form Triggered in the Video Field 36 Fig. 32 Wave Form Triggered in the Video Line Fig. 33 Wave Form Triggered in the Odd Field 37 Fig. 34 Wave Form Triggered in the Even Field Fig. 35 Wave Form Triggered in the Line Num 38 How to Operate the Function Menu The function menu control zone includes 7 function menu buttons and 2 immediate-execution buttons: SAVE/RCL, MEASURE, ACQUIRE, UTILITY, CURSOR, DISPLAY, AUTOSCALE, AUTOSET and RUN/STOP. How to Implement Sampling Setup Press the ACQUIRE button and the menu is displayed in the screen, shown as Fig. 36. Fig. 36 ACQU MODE Menu The description of the Sampling Setup Menu is shown as follows: Function Menu Sample Peak Detect Average Averages Setting Description General sampling mode. It is used for the detection of the jamming burr and the possibility of reducing the confusion. It is used to reduce the random and don’t-care noises, with the optional number of averages. 4, 16, 64, Choose the number of averages. 128 39 Change the ACQU Mode settings and observe the consequent variation of the wave form displayed. Fig. 37 Peak Detect mode, under which the burrs on the falling edge of the square wave, can be detected and the noise is heavy. 40 Fig. 38 Common ACQU Mode display, in which no burr can be detected. Fig. 39 The displayed wave form after the noise is removed under the Average Mode, in which the average number of 16 is set. 41 How to Set the Display System Push down the DISPLAY button and the menu displayed in the screen is shown as Fig. 40. Fig. 40 Display Set Menu The description of the Display Set Menu is shown as follows: Function Menu Type Persist Format Setting Vectors Dots OFF 1sec 2sec 5sec Infinite YT Description The space between the adjacent sampling points in the display is filled with the vector form. Only the sampling points are displayed. Set the persistence time for each sampling point. Show the relative relation between the vertical voltage and the horizontal time. XY Channel 1 is displayed on the horizontal axis and Channel 2 on the vertical axis. Carry Bitmap The data transmitted in communication are in the bitmap form. Vectors The data transmitted in communication are in the vector form. Battery On Battery power content symbol on Off Battery power content symbol off Display Type: With the F1 menu selection button pushed down, you can shift between Vectors and Dots types. The differences between the two display types can be observed through the comparison 42 between Fig. 41 and Fig.42. Fig. 41 Display in the Vector Form Fig. 42 Display in Dots form 43 Persist When the Persist function is used, the persistence display effect of the picture tube oscilloscope can be simulated: the reserved original data is displayed in fade color and the new data is in bright color. With the F2 menu selection button, different persistence time can be chosen: 1sec, 2sec, 5sec, Infinite and Closed. When the “Infinite” option is set for Persist time, the measuring points will be stored till the controlling value is changed (see Fig. 43). Fig. 43 Infinite Persistence Display XY Format This format is only applicable to Channel 1 and Channel 2. After the XY display format is selected, Channel 1 is displayed in the horizontal axis and Channel 2 in the vertical axis; the oscilloscope is set in the untriggered sample mode: the data are displayed as bright spots and the sampling rate is 1MS/s and can not be changed. The operations of all control knobs are as follows: The Vertical VOLTS/DIV and the Vertical POSITION knobs of Channel 1are used to set the horizontal scale and position. The Vertical VOLTS/DIV and the Vertical POSITION knobs of Channel 2 set the vertical scale and position continuously. 44 are used to The following functions can not work in the XY Format: Reference or digital wave form Cursor Time base control Trigger control Operation steps: 1. Press the DISPLAY button and call out the Display Set Menu. 2. Press the F3 menu selection button and choose the form as XY. The display format is changed to be XY mode (see Fig. 44). Fig. 44 XY Display Mode 45 How to Save and Recall a Wave Form Press the SAVE/RCL button, you can save and call out the wave forms in the instrument. The menu displayed in the screen is shown as Fig. 45. Fig. 45 Wave Form Save Menu The description of the Wave Form Save Menu is shown as the following table: Function Menu Source WAVE Setting CH1 CH2 MATH A,B C,D Save CHA OFF ON Description Choose the wave form to be saved. Choose the address in or from which the waveform is saved or can be get access to.. Save the wave form of the source in the selected address. Switch on or off the display of the stored waveform . 46 Save and Recall the Wave Form The PDS series oscilloscope can store four wave forms, which can be displayed with the current wave form at the same time. The stored wave form called out can not be adjusted. In order to save the wave form of the channel CH1 into the address A, the operation steps should be followed: 1. Press the F1 menu selection button and choose CH1 for Source. 2. Press the F2 menu selection button and choose A for Wave. 3. Press the F3 menu selection button and save the wave form. 4. Press the F4 menu selection button and choose ON for CHA. The stored wave form A will be displayed in the screen. The voltage level and time base level will also be shown at the upper left corner of the display area at the same time (see Fig. 46). Fig. 46 Wave Saving 47 How to Implement the Auxiliary System Function Setting Press the UNTILITY button and the menu is displayed in the screen as Fig. 47. Fig. 47 Function Menu The description of the Auxiliary Function Menu is shown as the following table. Function Menu System Status Recall Factory Do Self Cal Language Setting Chinese English Description Display the system function menu. Call out the factory settings. Carry out the self-calibration procedure. Choose the display language of the operating system. 48 Do Self Cal(Self-Calibration) The self-calibration procedure can improve the accuracy of the oscilloscope under the ambient temperature to the greatest extent. If the change of the ambient temperature is up to or exceeds 5℃, the self-calibration procedure should be executed to obtain the highest level of accuracy. Before executing the self-calibration procedure, disconnect the probe or wire and the input connector. Then,press the F3 menu selection button and choose “Do Self Cal”. After confirming it is all set, push down F3 button and choose “Do Self Cal”, entering the self-calibration procedure of the instrument. SYS STAT(System State) Press the F1 menu selection button and choose “SYS STAT” item. The menu pops up in the screen as Fig. 48. Fig. 48 SYS STAT Menu 49 The “SYS STAT” menu is described as the following table: Function Menu Setting Description Horizontal Show the horizontal parameter of the channel. Vertical Show the vertical parameter of the channel. Trigger Show the parameters of the trigger system. Misc Show the serial number and edition number. After entering into the SYS STAT menu, choose the corresponding function, with the corresponding parameters shown in the screen. If press the F1 menu selection button and choose the function item “Horizontal”, the Horizontal System State will be displayed in the screen. Press any other function button and exit from the SYS STAT menu (see Fig. 49). Fig. 49 Horizontal System State 50 How to Implement the Automatic Measurement With the Measure button pressed down, an automatic measurement can be implemented. There are 20 types of measurements and 4 measurement results can be displayed simultaneously. The 20 types automatic measurements include frequency, cycle, average value, peak-to-peak value , root mean square value, Vmax, Vmin, Vtop, Vbase, Vamp, Overshoot, Preshoot, RiseTime, Fall Time, +Width, -Width, +Duty, -Duty, DelayA B and DelayA B . Press the F1 menu selection button to choose Source or Type menu. You can choose the channel to be measured from the Source menu and choose the measurement Type (Freq, Cycle, Mean, PK–PK, RMS and None). The menu is displayed as Fig. 50. Fig. 50 Measure Menu Term interpretation Vpp: Peak-to-Peak Voltage. Vmax: The maximum amplitude. The most positive peak voltage measured over the entire waveform. Vmin: The minimum amplitude. The most negative peak voltage measured over the entire waveform. Vamp: Voltage between Vtop and Vbase of a waveform Vtop: Voltage of the waveform’s flat top, useful for square/pulse waveforms. Vbase: Voltage of the waveform’s flat base, useful for square/pulse waveforms. Overshoot: Defined as (Vmax-Vtop)/Vamp, useful for square and pulse waveforms. Preshoot: Defined as (Vmin-Vbase)/Vamp, useful for square and pulse waveforms. Average: The arithmetic mean over the entire waveform. 51 Vrms: The true Root Mean Square voltage over the entire waveform. Rise Time: Time that the leading edge of the first pulse in the waveform takes to rise from 10% to 90% of its amplitude. Fall Time: Time that the falling edge of the first pulse in the waveform takes to fall from 90% to 10% of its amplitude. +Width: The width of the first positive pulse in 50% amplitude points. -Width: The width of the first negative pulse in the 50% amplitude points. Delay 1→2 : The delay between the two channels at the rising edge. Delay 1→2 : The delay between the two channels at the falling edge. +Duty: +Duty Cycle, defined as +Width/Period -Duty: -Duty Cycle, defined as -Width/Period. Measure Four automatic measured values can be shown one time at maximum for the wave form of each channel. Only if the wave form channel is in the ON state can the measurement be carried out. No automatic measurement can be made for the saved or the mathematically manipulated wave form, or in the XY or Scan format. Measure the frequency, the peak-to-peak value of the Channel CH1 and the mean, the RMS of the Channel CH2, according the following steps: 1. Press the F1 menu selection button and choose Source. 2. Press the F2 menu selection button and choose CH1. 3. Press the F3 menu selection button and choose CH1. 4. Press the F4 menu selection button and choose CH2. 5. Press the F5 menu selection button and choose CH2. 6. Press the F1 menu selection button and choose Type. 7. Press the F2 menu selection button and choose Freq. 8. Press the F3 menu selection button and choose Pk-Pk. 9. Press the F4 menu selection button and choose Mean. 10. Press the F5 menu selection button and choose Cyc RMS. The measured value will be displayed in the reading window automatically (see Fig. 51). 52 Fig. 51 Automatic Measurement 53 How to Implement the Cursor Measurement Press the CURSOR button to display the cursor measurement function menu (CURS MEAS) in the screen, which includes Voltage Measurement and Time Measurement, shown as Fig. 52. Fig. 52 CURS MEAS Menu The description of the cursor measurement menu is shown as the following table: Function Menu Type Source Delta Cursor 1 Cursor 2 Setting OFF Voltage Time CH1, CH2 Description Switch off the cursor measurement. Display the voltage measurement cursor and menu. Show time measures the cursor and menu. Choose the channel generating the wave form to which the cursor measurement will be applied. Read the difference between cursors. Read the position of Cursor 1 (the Time is read with reference to the horizontal trigger position and the Voltage is to the ground point). Read the position of Cursor 1 (the Time is read with reference to the horizontal trigger position and the Voltage is to the ground point). 54 Cursor Measurement When carrying out the cursor measurement, the position of Cursor 1 can be adjusted with the CURSOR1 (VERTICAL POSITION) knob of Channel 1, and that of Cursor 2 can be adjusted with the CURSOR2 (VERTICAL POSITION) knob of Channel 2. Perform the following operation steps for the voltage cursor measurement of the channel CH1: 1. Press CURSOR and recall the Curs Meas menu. 2. Press the F1 menu selection button to choose Voltage for Type, with two purple dotted lines displayed along the horizontal direction of the screen, which indicating CURSOR1 and CURSOR2. 3. Press the F2 menu selection button and choose CH1 for Source. 4. Adjust the positions of CURSOR1 and CURSOR2 according to the measured wave form, with the absolute value of the voltage amplitude difference between Cursor 1 and Cursor 2 displayed in the increment window. The current position of Cursor1 is displayed in the Cursor1 window and that of Cursor2 is displayed in the Cursor2 window (see Fig. 53). Fig. 53 Wave Form of Voltage Cursor Measurement 55 Carry out the following operation steps for the time cursor measurement of the channel CH1: 1. Press “CURSOR” and recall the CURS MEAS menu. 2. Press the F1 menu selection button and choose Time for Type, with two purple dotted lines displayed along the vertical direction of the screen, which indicating Cursor 1 and Cursor 2. 3. Press the F2 menu selection button and choose CH1 for Source. 4. Adjust the positions of CURSOR1 and CURSOR2 according to the measured wave form, with the cycle and frequency of Cursor1 and Cursor 2 displayed in the increment window. The current position of Cursor1 is displayed in the Cursor1 window and that of Cursor2 is displayed in the Cursor2 window (see Fig. 54). Fig. 54 Wave Form of Cursor Measurement 56 How to Implement the Autoscale function setting The function is applied to follow-up signals automatically even if the signals change at any time. Autoscale enables the instrument to set up trigger mode, voltage division and time scale automatically according to the type, amplitude and frequency of the signals. The menu is as follows: Function Menu Autoscale Mode Setting Instruction OFF Turn off Autoscale ON Turn on Autoscale Vertical Follow-up and adjust vertical without changing horizontal setting scale Horizontal Follow-up and adjust horizontal scale without changing vertical setting HORI—VERT Follow-up and adjust the vertical and horizontal settings. Wave Only show one or two periods Show Multi-period waveforms If you want to measure the two-channel signal, you can do as the follows: 1. Press Autoscale, the function menu will appear on the right of the screen. 2. Press F1 and choose ON. 3. Press F2 and choose Horizontal- Vertical for Mode item. 4. Press F3 and choose for Wave item. Then the wave is displayed in the screen,showon as Fig55. Fig55: Autoscale Horizontal- Vertical multi-period waveforms 57 Fig 56: Autoscale Horizontal- Vertical mono-period waveform Note: 1. Entering into Autoscale function and flicker will be on the top left corner. (flicker every 0.5 second) 2. At the mode of Autoscale, the oscilloscope can self-estimate “Trigger mode” (Edge, Video, and Alternate) and “Type” (Edge, Video). If now, you press “Trigger mode” or “Type”, the forbidden information will display on the screen. 3. At the mode of XY and STOP status, pressing AUTO SET to enter into Autoscale, DSO switches to YT mode and AUTO status. 4. At the mode of Autoscale, DSO is always in the state of DC coupling and AUTO triggering. In this case, the forbidden information will be showing when making Triggering or Coupling settings. 5. At the mode of Autoscale, if adjust the vertical position, voltage division, trigger level or time scale of CH1 or CH2, the oscilloscope will turn off Autoscale function and if press AUTOSET again, the oscilloscope will enter into Autoscale. 6. Turn off the submenu at the Autoscale menu, the Autoscale is off and turn on the submenu still enters into the function. 7. When video triggering, the horizontal time scale is 50us. If one channel is showing edge signal, the other channel is showing video one, the time scale refers to 50us as video one as standard. 8. While the Autoscale is working,below settings will be made forcibly: (1) The unit will switch from non-main time base to main time base status. (2) The unit will siwtch to Peak detection menu while in the state of Average sampling mode. 58 How to Use Executive Buttons The executive buttons include AUTOSET,AUTOSCALE and RUN/STOP. AUTOSET This button is used for the automatic setting of all control values of the instrument to generate the wave form suitable for observation. Press the AUTOSET button and the oscilloscope will perform the fast automatic measurement of the signal. The function items of AUTOSET are shown as the following table: Function Items Acquisition Mode Vertical Coupling Vertical Scale Bandwidth Horizontal Level Horizontal Sale Trigger Type Trigger Source Trigger Coupling Trigger Slope Trigger Level Trigger Mode Display Format Setting Current DC Adjust to the proper division. Full Middle Adjust to the proper division Current Show the minimum number of channels. Current Current Mid-point Setting Auto YT RUN/STOP: Enable or disable the waveform sampling. Notice: Under the Stop state, the vertical division and the horizontal time base of the wave form can be adjusted within a certain range, in other words, the signal can be expanded in the horizontal or vertical direction. When the horizontal time base equal to or is less than 50ms, the horizontal time base can be expanded for 4 divisions downwards. 59 Examples of Application Example 1: Measurement of Simple Signals Observe an unknown signal in the circuit, and display and measure rapidly the frequency and peak-to-peak value of the signal. 1. Carry out the following operation steps for the rapid display of this signal: 1. Set the probe menu attenuation coefficient as 10X and that of the switch in the probe switch as 10X. 2. Connect the probe of Channel 1 to the measured point of the circuit. 3. Push down the AUTOSET button. The oscilloscope will implement the AUTPSET to make the wave form optimized, based on which, you can further regulate the vertical and horizontal divisions till the waveform meets your requirement. 2. Perform Automatic Measurement The oscilloscope can measure most displayed signals automatically. Complete the following operations for the measurement of frequency, cycle, mean and peak-to-peak value: 1. Press the MEASURE button to show the automatic measurement function menu. 2. Press the F1 menu selection button and choose Source, with the Source menu displayed. 3. Press the F2, F3, F4 and F5 menu selection buttons and choose CH1. 4. Press the F1 menu selection button again and choose Type, with the Type menu displayed. 5. Press the F2 menu selection button and choose Freq. 6. Press the F3 menu selection button and choose Period. 7. Press the F4 menu selection button and choose Mean. 8. Press the F5 menu selection button and choose Pk-Pk. Then, the frequency, cycle, mean and peak-to-peak value will present in the menu and change periodically (see Fig. 57). 60 Fig. 57 Waveform of Automation Measurement Example 2: Gain of the Amplifier in the Metering Circuit Set the probe menu attenuation coefficient as 10X and that of the switch in the probe as 10X. Connect the oscilloscope CH1 channel with the circuit signal input end and the CH2 channel to the output end. Operation Steps 1. Push down the AUTOSET button and the oscilloscope will automatically adjust the waveforms of the two channels into the proper display state. 2. Push down the MEASURE button to show the MEASURE menu. 3. Press the F1 menu selection button and choose Source. 4. Press the F2 menu selection button and choose CH1. 5. Press the F3 menu selection button and choose CH2. 6. Press the F1 menu selection button again and choose Type. 7. Press the F2 menu selection button and choose Pk-Pk. 8. Press the F3 menu selection button and choose Pk-Pk. 10. Read the peak-to-peak values of Channel 1 and Channel 2 from the displayed menu (see Fig. 58). 61 11. Calculate the amplifier gain with the following formulas. Gain = Output Signal / Input signal Gain (db) = 20×log (gain) Fig. 58 Wave Form of Gain Measurement Example 3: Capture the Single Signal The digital storage oscilloscope takes the lead in providing the convenience capturing of such non-periodic signals as pulse and burr, etc. If you intent to capture a single signal, you can not set the trigger level and the trigger edge unless you have a particular priori knowledge of this signal. For example, if the pulse is the logic signal of a TTL level, the trigger level should be set to 2 volts and the trigger edge be set as the rising edge trigger. If it is uncertain as to the signal, you can make an observation of it in advance under the automatic or ordinary mode to determine the trigger level and the trigger edge. The operation steps are as follows: 1. Set the probe menu attenuation coefficient to 10X and that of the switch in the probe to 10X. 2. Adjust the VOLTS/DIV and SEC/DIV knobs to set up a proper vertical and horizontal ranges for the signal to be observed. 62 3. Press the button ACQUIRE to display the ACQUIRE Mode menu. 4. Press the F2 menu selection button and choose Peak Detect. 5. Press the TRIG MENU button to display the Trigger Mode menu. 6. Press the F1 menu selection button and choose Edge as the trigger type. 7. Press the F4 menu selection button and choose Single as the trigger mode. 8. Press the F3 menu selection button and choose Rising as the slope. 9. Rotate the LEVEL knob and adjust the trigger level to the mid-value of the signal to be measured. 10. If the Trigger State Indicator at the top of the screen does not indicate Ready, push down the RUN/STOP button and start Acquire, waiting the emergence of the signal in conformity with the trigger conditions. If a signal reaches to the set trigger level, one sampling will be made and then displayed in the screen. With this function, any random occurrence can be captured easily. Taking the burst burr of larger amplitude for example, set the trigger level to the value just greater than the normal signal level, and then press the RUN/STOP button and wait. When there is a burr occurring, the instrument will trigger automatically and record the wave form generated during the period around the trigger time. With the HORIZONTAL POSITION knob in the horizontal control area in the panel rotated, you can change the horizontal position of the trigger position to obtain the negative delay, making an easy observation of the waveform before the burr occurs (see Fig. 59). Fig. 59 Capture the Single Signal 63 Example 4: Analyze the Details of a Signal Observe the Signal Containing Noises If the signal is interfered by the noise, the noise may cause a failure in the circuit. For the analyzing of the noise in detail, please operate the instrument according to the following steps: 1. Press the ACQUIRE button to display the ACQU MODE menu. 2. Press the F2 menu selection button and choose Peak Detect. In this case, the screen display contains the wave form of a random noise. Especially when the time base is set as Low Speed, then noise peak and burr contained in the signal can be observed with the peak detection (See Fig. 60). Fig. 60 Wave Form of the Signal Containing Noises Separate Noises from the Signal When analyze the wave form of a signal, you should remove the noise contained in it. For the reduction of the random noise in the oscilloscope display, please operate the instrument according to the following step: 1. Press the ACQUIRE button to show the ACQU MODE menu. 2. Press the F3 menu selection button and choose Average. 64 3. Press the F4 menu selection button and observe the wave form obtained from averaging the wave forms of different average number. After the averaging, the random noise is reduced and the detail of the signal is easier to be observed. Shown as follows, after the noise is removed, the burrs on the rising and falling edges appear (see Fig. 61). ] Fig. 61 Wave Form of the Noise-Removed Signal Example 5: Application of X-Y Function Examine the Phase Difference between Signals of two Channels Example: Test the phase change of the signal after it passes through a circuit network. Connect the oscilloscope with the circuit and monitor the input and output signals of the circuit. For the examination of the input and output of the circuit in the form of X-Y coordinate graph, please operate according to the following steps: 1. Set the probe menu attenuation coefficient for 10X and that of the switch in the probe for 10X. 2. Connect the probe of channel 1 to the input of the network and that of Channel 2 to the output of the network. 3. Push down the AUTOSET button, with the oscilloscope turning on the signals of the two channels and displaying them in the screen. 65 5. Adjust the VOLTS/DIV knob, making the amplitudes of two signals equal in the rough. 6. Push down the DISPLAY button and recall the DISP SET menu. 7. Press the F3 menu selection button and choose XY for Format. The oscilloscope will display the input and terminal characteristics of the network in the Lissajous graph form. 8. Adjust the VOLTS/DIV and VERTICAL POSITION knobs, optimizing the wave form. 9. With the elliptical oscillogram method adopted, observe and calculate the phase difference (see Fig. 62). The signal must be centered and kept in the horizontal direction. Fig. 62 Lissajous Graph Based on the expression sinq =A/B or C/D, where, q is the phase difference angle, and the definitions of A, B, C, and D are shown as the graph above. As a result, the phase difference angle can be obtained, namely, q =± arcsin (A/B ) or ± arcsin (C/D). If the principal axis of the ellipse is in the I and III quadrants, the determined phase difference angel should be in the I and IV quadrants, that is, in the range of (0- π /2) or (3π / 2- 2π). If the principal axis of the ellipse is in the II and IV quadrants, the determined phase difference angle is in the II and III quadrants, that is, within the range of (π / 2 - π) or (π- 3π /2). 66 Example 6: Video Signal Trigger Observe the video circuit of a television, apply the video trigger and obtain the stable video output signal display. Video Field Trigger For the trigger in the video field, carry out operations according to the following steps: 1. Press the TRIG MENU button to display the trigger menu. 2. Press the F1 menu selection button and choose Video for Type. 3. Press the F2 menu selection button and choose CH1 for Source. 4. Press the F3 menu selection button and choose Field for Sync. 5. Adjust the VOLTS/DIV, VERTICAL POSITION and SEC/DIV knobs to obtain a proper wave form display (see Fig. 63). Fig. 63 Wave Form Obtained from Video Field Trigger 1. Press the TRIG MENU button to display the trigger men. 2. Press the F1 menu selection button and choose Video for Type. 3. Press the F2 menu selection button and choose CH1 for Source. 4. Press the F3 menu selection button and choose Line for Sync. 5. Adjust the VOLTS/DIV, VERTICAL POSITION and SEC/DIV knobs to obtain the proper wave form display (see Fig. 64). 67 Fig. 64 Wave Form Obtained from the Video Line Trigger Video Odd Field Trigger For the trigger in the video field, carry out operations according to the following steps: 1. Press the TRIG MENU button to display the trigger menu. 2. Press the F1 menu selection button and choose Video for Type. 3. Press the F2 menu selection button and choose CH1 for Source. 4. Press the F3 menu selection button and choose Odd Field for Sync. 5. Adjust the VOLTS/DIV, VERTICAL POSITION and SEC/DIV knobs to obtain a proper wave form display (see Fig. 65). Fig. 65 Wave Form Obtained from the Odd Field Trigger 68 Video Even Field Trigger For the trigger in the video field, carry out operations according to the following steps: 1. Press the TRIG MENU button to display the trigger menu. 2. Press the F1 menu selection button and choose Video for Type. 3. Press the F2 menu selection button and choose CH1 for Source. 4. Press the F3 menu selection button and choose Even Field for Sync. 5. Adjust the VOLTS/DIV, VERTICAL POSITION and SEC/DIV knobs to obtain a proper wave form display (see Fig. 66). Fig. 66 Wave Form Obtained from the Even Field Trigger Video Line Num Trigger For the trigger in the video field, carry out operations according to the following steps: 1. Press the TRIG MENU button to display the trigger menu. 2. Press the F1 menu selection button and choose Video for Type. 3. Press the F2 menu selection button and choose CH1 for Source. 4. Press the F3 menu selection button and choose Line Num for Sync. 5. Press the F4 menu selection button and choose NTSC for Modulation. 6. Adjust the VOLTS/DIV, VERTICAL POSITION and SEC/DIV knobs to obtain a proper wave form display (see Fig. 67). 69 Fig. 67 Wave Form Obtained from the Line NUM Trigger 70 Fault Treatment 1. In the case of that the oscilloscope is still in the black-screen state without any display after the power is switch on, implement the following fault treatment procedure. z z z z Check whether the power connection is connected properly. Check whether the power switch is pushed down to the designated position. Restart the instrument after complete the checks above. If this product still can not work normally, please get in touch with PeakTech and we will be under your service. 2. After acquiring the signal, carry out the following operations if the wave form of the signal is not displayed in the screen. z Check whether the probe is properly connected to the signal connecting wire. z Check whether the signal connecting wire is correctly connected to the BNC (namely, the channel connector). z Check whether the probe is properly connected with the object to be measured. z Check whether there is any signal generated from the object to be measured (the trouble can be shot by the connection of the channel from which there is a signal generated with the channel in fault). z Make the signal acquisition operation again. 3. The measured voltage amplitude value is 10 times greater or smaller than the actual value. Check whether the channel attenuation coefficient and the attenuation ration of the probe used in practical application is match. 4. There is wave form displayed, but it is not stable. z Check whether the Source item in the TRIG MODE menu is in conformity with the signal channel used in the practical application. z Check on the trigger Type item: The common signal chooses the Edge trigger mode for Type and the video signal the Video. Only if a proper trigger mode is applied, the wave form can be displayed steadily. z Try to change the trigger coupling into the high frequency suppress and the low frequency suppress to smooth the high frequency or low frequency noise triggered by the interference. 5. No Display Responses to the Push-down of RUN/STOP. Check whether Normal or Signal is chosen for Polarity in the TRIG MODE menu and the trigger level exceeds the wave form range. If it is, make the trigger level is centered in the screen or set the trigger mode as Auto. In addition, with the AUTOSET button pressed, the setting above can be completed automatically. 6. After the AVERAGE value sampling is set in the ACQU MODE or the a longer duration is set in the DISP MODE, the display rate is slowed down. It is a normal phenomenon. 71 Appendix A: Technical Specifications Unless otherwise specified, the technical specifications applied are applicable to the probe with the attenuation switch setting 10X. Only if the oscilloscope fulfill the following two conditions at first, can these specification standards be reached. This instrument should run for more than 30 minutes continuously under the specified operating temperature. If the change range of the operating temperature is up to or exceeds 5℃, open the system function menu and execute the “Auto-calibration” procedure. All specification standards can be fulfilled, except one(s) marked with the word “Typical”. Sampling ACQU Mode Sampling Rate Sample Peak Detection Average 100 MS/s Input Input Coupling Input Impedance Probe attenuation coefficient Max. Input Voltage DC, AC ,Ground 1MΩ± 2%, connected with 20pF± 5pF in parallel 1X, 10X, 100X, 1000X 300V, Peak Value Level Sampling Rate Range Waveform interpolation Record Length Scanning Speed Range (S/div ) Measuring Accuracy of Time Interval (△T) (Full Bandwidth) 10S/s ~ 100MS/s (sinx) /x 5000 sampling points per channel 5ns/div~100s/div, according to the stepping mode of 1- 2.55. Single: ± (One Sampling Interval Time +100ppm × Reading +0.6ns) >Averages of 16: ± (One Sampling Interval Time +100ppm× Reading +0.4ns) 72 Vertical A/D Converter Resolution of 8 bits, with the sampling carried out in two channels at the same time. Sensitivity (Volt/division) Range (V/div ) Displacement Range Simulative Bandwidth Single Bandwidth Low frequency respond (AC Coupling, - 3dB) Rising Time (Typical, at BNC ) DC Gain Accuracy DC Measuring Accuracy ( Average for ACQU MODE) 5mV/div- 5V/div (at the input BNC) ± 10div (5mV- 5V ) 25M Full Bandwidth ≥5Hz (at BNC) ≤14ns ± 5% The voltage difference (△V) between any two points on the wave form after averaging the captured wave forms of more than 16: ± (5% Reading + 0.05 divisions). Trigger Trigger Sensitivity (Edge Trigger) DC Coupling Internal Channel 1 and Channel 2: 1div (DC ~ Full Bandwidth ) 100mV(DC ~ 25M) 500mV(DC ~ 25M) It is the same as the DC coupling in case of 50Hz or more. ± 6 divisions from the screen center. EXT EXT/5 Inside ± 600mV ± 3V ± 0.3 div EXT ± (40mV + 6% of Set Value) EXT/5 ± (200mV +6% of Set Value) EXT EXT/5 AC Coupling Trigger Level Range Trigger Level Accuracy (Typical): It is applicable to the signal with the rising and falling time ≥ 20ns Trigger Displacement Trigger Holdoff range Set Level to 50% (Typical) Trigger Sensitivity (Video trigger, typical) Signal System and Line/Field Frequency (Video Trigger Type) Preliminary Trigger: 655 divisions Late Trigger: 4 divisions. 100ns~10s Operation under the condition of input signal frequency ≥ 50Hz. Internal Peak-to-peak value of 2 divisions EXT 400mV EXT/5 2V Supporting the NTSC, PAL and SECAM broadcast system of any field frequency of line frequency. 73 Measurement Cursor Measurement Voltage difference (△V) and time difference (△T) between cursors. frequency, cycle, average value, peak-to-peak value , root mean square value, Vmax, Vmin, Vtop, Vbase, Vamp, Overshoot, Preshoot, RiseTime, Fall Time, +Width, -Width, +Duty, -Duty, DelayA B and DelayA B Automatic Measurement Probe 1X Position DC: up to 6 MHz 1: 1 20pf ~ 40pf 1MΩ± 2% 85pf- 115pf 150 V DC Bandwidth Attenuation Ratio Compensation Range Input Resistance Input Electric Capacity Input Voltage 10X Position DC: up to full bandwidth 10: 1 10MΩ± 2% 14.5pf- 17.5pf 300 V DC General Technical Specifications Display Display Type Display Resolution Display Colors 7.8"Colored LCD (Liquid Crystal Display) 640 (Horizontal) × 480 (Vertical) Pixels 256 Colors Output of the Probe Compensator Output Voltage (Typical ) Frequency (Typical ) About 5V, with the Peak-to-Peak value equal to or greater than 1MΩ of load. Square wave of 1KHz Power Mains Voltage Power Consumption Fuse 100~240 VAC RMS, 50Hz, CAT II < 15W 1A, T grade, 250V Environment Temperature Relative Humidity Height Cooling Method Working temperature: 0 ℃~ 40 ℃ Storage temperature: -20 ℃~ +60 ℃ ≤ 90% Operating: 3,000 m Non-operating: 15,000 m Natural convection 74 Mechanical Specifications Dimension 350mm× 157mm×120mm Weight 1 kilogram Interval Period of Adjustment: One year is recommended for the calibration interval period. 75 Appendix B: Enclosure Standard Accessories: z Passive probe: 2, 1.2 m, 1:1 (10:1) z CD: 1, for operation instruction. z USB data line z Power line: one, up to the standards of the country in which it is used. z User's Manual: One Options: z Battery Appendix Repairing C: Maintenance, Cleaning and General Maintenance Please don't store or put the instrument in the place where the liquid crystal display will be directly exposed to the sunlight for a long time. Caution: The instrument or probe should not be stained with the spraying agent, liquid and solvent to avoid any damage to it. Cleaning Check the probe and instrument regularly according to their operating state. Clean the external surface of the instrument following the steps shown as below: 1. Please wipe the dust from the instrument and probe surface with a soft cloth. Do not make any scuffing on the transparent LCD protection screen when clean the LCD screen. 2. Clean the instrument with a wet soft cloth not dripping water, during the period of which please pay attention to the disconnection of power. It is recommended to scrub with soft detergent or fresh water. Please don't apply any corrosive chemical cleaning agent to prevent the instrument or probe from damage. Warn: Before power on again for operation, it is required to confirm that the instrument has already been dried completely, avoiding any electrical short circuit or bodily injury resulting form the moisture. 76 Appendix D: Battery Using Guide Charging the oscilloscope The lithium battery maybe not be charged when delivery. Please charge the battery for 12 hours to make sure enough power to supply (the oscilloscope should be turned on during charging) to oscilloscope. The battery can supply power for 4 hours after being charged completely. There will have battery power indication show on the top of panel when oscilloscope power supplied by the battery. , and imply for different power consumption and when shows it means the power can only supply for 5 minutes maximum. , Note: To avoid superheat of battery during charging, the environment temperature is not allowed to exceed the permissible value given in technical specification. Replacing the Lithium Battery Unit It is usually not required to replace the battery unit. But when it is required to replace it, only qualified personnel can carry out this operation, and only use the same specification lithium battery All rights, also for translation, reprinting and copy of this manual or parts are reserved. Reproduction of all kinds (photocopy, microfilm or other) only by written permission of the publisher. This manual considers the latest technical knowing. Technical changings which are in the interest of progress reserved. We herewith confirm, that the units are calibrated by the factory according to the specifications as per the technical specifications. We recommend to calibrate the unit again, after 1 year. 2009-7-3 Heinz-Günter Lau GmbH - Kornkamp 32 - DE-22926 Ahrensburg / Germany +49-(0) 4102-42343/44 ¬+49-(0) 4102-434 16 [email protected] ß www.peaktech.de 77