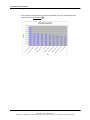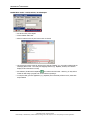
1
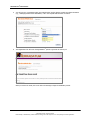
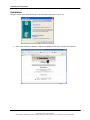
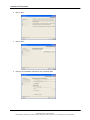
® AgentMetrics User Manual June 2008 ©Terradatum 2008. All rights reserved. Patent Pending. BrokerMetrics® products include technology that is the subject of one or more pending U.S. Patent applications. Table of Contents Access & Customization Features ............................................................................................. 3 Minimum System Requirements..........................................................................................................................3 Registration.......................................................................................................................................................3 Prerequisites...................................................................................................................................................3 Procedure.......................................................................................................................................................3 Installation ........................................................................................................................................................5 Login ................................................................................................................................................................9 Utilities Menu ..................................................................................................................................................10 My Options ...................................................................................................................................................10 Change My Password ....................................................................................................................................10 My Areas ......................................................................................................................................................11 My Searches .................................................................................................................................................16 AgentMetrics® Conventions and Protocols ............................................................................. 21 Market Share Totals ................................................................................................................ 22 Search Screen .................................................................................................................................................22 Search Results.................................................................................................................................................23 Chart ..............................................................................................................................................................24 Grid ................................................................................................................................................................25 Market Dynamics..................................................................................................................... 26 Search Screen .................................................................................................................................................26 Search Results.................................................................................................................................................26 Chart Page ......................................................................................................................................................27 Chart Controls ..............................................................................................................................................27 Chart............................................................................................................................................................28 Key Information............................................................................................................................................29 2 Year (Monthly) Information ........................................................................................................................29 6 Months (Weekly) Information .....................................................................................................................29 Grid Page ........................................................................................................................................................30 Tabs ...............................................................................................................................................................30 Price ............................................................................................................................................................30 Supply & Demand .........................................................................................................................................30 Sales Rate ....................................................................................................................................................30 Pricing Analysis ....................................................................................................................... 31 Search Screen .................................................................................................................................................31 Results............................................................................................................................................................32 Step #1 – Price Distribution...........................................................................................................................32 Step #2 – Sales Rate, Months Supply of Inventory and Pricing Window............................................................33 Exports .................................................................................................................................... 34 ii ©Terradatum 2008. All rights reserved. Patent Pending. BrokerMetrics® products include technology that is the subject of one or more pending U.S. Patent applications. AGENTMETRICS® USER MANUAL Access & Customization Features Minimum System Requirements Before installing the AgentMetrics® software or getting set up, it is important to ensure that your system meets the minimum requirements to operate the program, and that your PC is configured correctly. 1. Check with your system’s administrator to confirm that your PC has the following: a. Pentium III processor (or more recent) b. Windows XP or Windows VISTA as its operating system c. At least 60Mb of available RAM d. At least 65Mb of Hard Disk Storage e. Internet Explorer 4.0 (or more recent) as its internet browser 2. Confirm the appropriate screen resolution: a. The AgentMetrics® program is best viewed with the screen resolution set at 1024 x 768. b. To confirm that your PC is set appropriately: i. Close (or minimize) all of your open programs and documents so that your desktop is in view. ii. Right mouse-click on any open space on the desktop to display a menu, and then left mouse-click on the “Properties” option. iii. On the dialog box titled “Display Properties,” left mouse-click on the “Settings” tab at the top. iv. In the lower left-hand corner you will see a moveable gauge titled “Screen Resolution.” By depressing your left mouse button and holding it down over the arrow on the gauge, drag the arrow to adjust your monitor’s screen resolution to 1024 X 768. v. Click on ‘Apply.’ Your screen will go black for a moment as it resets. You may then be asked if you want to keep the new settings. Click on “Yes” and close out the dialog box You are now ready to go through Registration. Registration After confirming that your system meets the minimum requirements and is configured appropriately, you must complete the AgentMetrics® registration process. Prerequisites In order 1. 2. 3. 4. to complete the registration process you must: Be at a PC on which you are going to use AgentMetrics® Have access to the internet Have access to your email Have your AgentMetrics® User Name and Password. If you have not received either a User Name or a Password, or if you have misplaced your User Name or Password: Check with your Training Coordinator, or Call Terradatum Technical Support at 1-888-212-4793 ext. 2 Procedure 1. 2. 3. 4. Start the registration process by opening your internet browser and typing-in the following URL provided to you by your training coordinator. If you have not received either a User Name or a Password, or if you have misplaced your User Name or Password check with your Training Coordinator. At the AgentMetrics® registration page specifically designed for your firm, click on the AgentMetrics® link. At the System Requirements page, click on ‘Continue’ to go to the Login page. Type in the User Name and Password you received, and click on ‘Login.’ Page 3 of 37 ©Terradatum 2008. All rights reserved. Patent Pending. BrokerMetrics® products include technology that is the subject of one or more pending U.S. Patent applications. AGENTMETRICS® USER MANUAL 5. You will now go to a registration page (see example below) and be asked to provide some basic information (e.g., challenge question and E-mail address). Fill in the required fields and click on ‘Submit.’ 6. The Registration form will cause the AgentMetrics® system to generate an email to you. When you receive the email, click on the link in the message to begin the installation process. Page 4 of 37 ©Terradatum 2008. All rights reserved. Patent Pending. BrokerMetrics® products include technology that is the subject of one or more pending U.S. Patent applications. AGENTMETRICS® USER MANUAL Installation Clicking on the link in the email will bring up a “Security Warning” dialog box. Click on ‘Yes.’ 1. Click on ‘Start Installer for Windows’ to begin the installation process, which may take a few moments. Page 5 of 37 ©Terradatum 2008. All rights reserved. Patent Pending. BrokerMetrics® products include technology that is the subject of one or more pending U.S. Patent applications. AGENTMETRICS® USER MANUAL 2. Click on ‘Next.’ 3. Click on ‘Next.’ 4. Click the “On the Desktop" radio button, then, click ‘Next’ again. Page 6 of 37 ©Terradatum 2008. All rights reserved. Patent Pending. BrokerMetrics® products include technology that is the subject of one or more pending U.S. Patent applications. AGENTMETRICS® USER MANUAL 5. Click on ‘Install’. 6. Wait for the installation to complete; this will take a few moments. 7. Click on ‘Done’. Page 7 of 37 ©Terradatum 2008. All rights reserved. Patent Pending. BrokerMetrics® products include technology that is the subject of one or more pending U.S. Patent applications. AGENTMETRICS® USER MANUAL 8. Finish by closing your browser. Congratulations! You are now ready to log in and begin using AgentMetrics®! Page 8 of 37 ©Terradatum 2008. All rights reserved. Patent Pending. BrokerMetrics® products include technology that is the subject of one or more pending U.S. Patent applications. AGENTMETRICS® USER MANUAL Login 1. Once AgentMetrics® has been installed properly; double-click on the AgentMetrics® icon on your desktop to open the program. 2. Enter your User Name and Password and click the Login button You may install AgentMetrics® on all necessary computers, i.e. where you do your real estate work (home, office, laptop) AgentMetrics® recognizes each user based on their unique ID & Password, and displays the appropriate views for each user’s role. The system is dynamic and updated daily so there can be small data variances over time (e.g. pending to sold status changes will always add market share to the applicable COE date). Page 9 of 37 ©Terradatum 2008. All rights reserved. Patent Pending. BrokerMetrics® products include technology that is the subject of one or more pending U.S. Patent applications. AGENTMETRICS® USER MANUAL Utilities Menu Where data input and customization begin…. AgentMetrics® allows the user to input key office/company data and personalize various system configurations. Please take the time to familiarize yourself with these functions. They will pay many long-term dividends from a program “power” and “ease-of-use” perspective. The next several pages will guide you through the process of setting up: My Options o Input personal info and logo for reports Change My Password My Areas o Customize MLS system geographies. My Searches o Create and save searches My Options User Info Most of the fields have been pre-populated during the company setup process. However, there are two fields that require your input: Email Signature - Allows you to add a personal touch to the emails you send from the system. Add Logo – The logo you enter here will add a professional touch to all reports. The file must be a jpg type of file. Change My Password Allows user to change the default user-password to a password selected by user. Page 10 of 37 ©Terradatum 2008. All rights reserved. Patent Pending. BrokerMetrics® products include technology that is the subject of one or more pending U.S. Patent applications. AGENTMETRICS® USER MANUAL My Areas Create and save groups of areas (cities, counties, MLS areas and zip codes) to be displayed in the area pick-lists on all search screens. This feature lessens the need to hunt-and-peck through the long lists of areas that are contained in most large, regional MLS systems. Click on My Areas on the Preferences menu to display this window: This utility allows you to set up and customize comparison sets of competitors to use in the Market Share tool for market analysis purposes. Comparison sets are groups of competitors. Competitors are groups of one or more offices. For example, you might wish to compare the offices of XYZ agency in Napa with the offices of ABC agency and DEF agency in Napa. You would first create a Competitor Set Called Napa, and then set up three competitor groups called ABC, DEF and XYZ. Step 1 The left side will list: Area Types available for your MLS; under each Area Type will be the Saved Areas (if any) you have created for each Area Type. All folders and lists will be expanded when the window is opened. Click on the minus sign next to a folder to collapse it (hide its contents); on the plus sign to display the contents. Page 11 of 37 ©Terradatum 2008. All rights reserved. Patent Pending. BrokerMetrics® products include technology that is the subject of one or more pending U.S. Patent applications. click AGENTMETRICS® USER MANUAL New Saved Area New Saved Area – Preferences Menu Click on My Areas on the Preferences Menu. Right-click on an Area Type and click on New Area: Enter a name for your area and click OK: Select the areas from the Areas Selection window: • • • Click on a row or multiple rows (using Shift-Click or Ctrl-Click), then on Add>>, or Double-click on a row to move the selection to the Selected pane. Click OK. Click OK when you see this message: The new saved area will be listed in the Area Type picklist on all search screens. Page 12 of 37 ©Terradatum 2008. All rights reserved. Patent Pending. BrokerMetrics® products include technology that is the subject of one or more pending U.S. Patent applications. AGENTMETRICS® USER MANUAL New Saved Area - Search Screen After you’ve selected an Area Type and made your area selections on any search screen, click on the Save button: Enter a name for your area and click OK: Click OK when you see this message: The new saved area will be listed in the Area Type picklist on all search screens. To make changes to a Saved Area, right-click on the Area Name, then on Delete or Rename. To add or remove selections included in the Saved Area, click on the Add or Remove buttons. Rename a Saved Area Click on My Areas on the Preferences Menu. Right-click on the saved area you wish to rename and click on Rename Area: Enter the new name, and click OK: Page 13 of 37 ©Terradatum 2008. All rights reserved. Patent Pending. BrokerMetrics® products include technology that is the subject of one or more pending U.S. Patent applications. AGENTMETRICS® USER MANUAL Modify a Saved Area Modify Saved Areas – Preferences Menu Click on My Areas on the Preferences Menu. Click on the area you wish to change. Make the desired changes: Click on a row, then on Remove to delete the area from the group, and/or Click on Add to display the Area Selection window. Be sure to click the Save button when you’ve completed the modifications to the saved area. Click on the OK button when this message is displayed: Modify Saved Areas – Search Screen After a saved area has been selected on a search screen, changing any of the selected areas will activate the Save button. Click on the Save button to display this window: You may either click OK to save the revised areas under the same name, or enter a different name to save the revised areas as a new group (the “old” group will remain intact, with the original set of areas). Page 14 of 37 ©Terradatum 2008. All rights reserved. Patent Pending. BrokerMetrics® products include technology that is the subject of one or more pending U.S. Patent applications. AGENTMETRICS® USER MANUAL Delete a Saved Area Click on My Areas on the Preferences Menu. Right-click on the saved area you wish to delete and click on Delete Area: Confirm the deletion by clicking on Yes: Click OK when you see this message: Caution – Saved Searches that use the deleted Saved Area will also be deleted. Be sure to click on the Save button before closing the editor. Page 15 of 37 ©Terradatum 2008. All rights reserved. Patent Pending. BrokerMetrics® products include technology that is the subject of one or more pending U.S. Patent applications. AGENTMETRICS® USER MANUAL My Searches Use this feature to create saved searches. Searches may also be saved from the search screens; instructions for both methods are included below. Click on My Searches on the Preferences menu to display this window: The left pane will list the Saved searches (if any) you have created for each tool. All folders and lists will be expanded when the window is opened. Click on the minus sign next to a MLS name or tool name to collapse the list (hide its contents); click on the plus sign to display the list: Page 16 of 37 ©Terradatum 2008. All rights reserved. Patent Pending. BrokerMetrics® products include technology that is the subject of one or more pending U.S. Patent applications. AGENTMETRICS® USER MANUAL New Search Click on My Searches on the Preferences Menu. Right-click on a Tool and click on New Search: Enter a name for your search and click OK: Select the search criteria: Then click on Save this Search. Page 17 of 37 ©Terradatum 2008. All rights reserved. Patent Pending. BrokerMetrics® products include technology that is the subject of one or more pending U.S. Patent applications. AGENTMETRICS® USER MANUAL New Search - Search Screen After you’ve selected the desired criteria (Property Types and Areas must be selected), click on the Save this Search button at the top of the window: Enter a name for the search: Click OK when you see this message: Page 18 of 37 ©Terradatum 2008. All rights reserved. Patent Pending. BrokerMetrics® products include technology that is the subject of one or more pending U.S. Patent applications. AGENTMETRICS® USER MANUAL Rename a Saved Search Click on My Searches on the Preferences Menu. Right-click on the saved search you wish to rename and click on Rename Search: Enter the new name, and click OK: Modify a Saved Search Click on My Searches on the Preferences Menu. Click on the search you wish to change. Click on the Save this Search button at the bottom of the window. Click on the OK button when this message is displayed: Modify a Saved Search – Search Screen After a saved search has been selected on a search screen, changing any of the criteria will activate the Save this Search button. Click on the button to display this window: You may either click OK to save the revised criteria under the same name, or enter a different name to save the revised criteria as a new search (the “old” search will remain intact, with the original set of criteria). Page 19 of 37 ©Terradatum 2008. All rights reserved. Patent Pending. BrokerMetrics® products include technology that is the subject of one or more pending U.S. Patent applications. AGENTMETRICS® USER MANUAL Delete a Saved Search Click on My Searches on the Preferences Menu. Right-click on the saved search you wish to delete and click on Delete Search: Confirm the deletion by clicking on Yes: Click OK when you see this message: Page 20 of 37 ©Terradatum 2008. All rights reserved. Patent Pending. BrokerMetrics® products include technology that is the subject of one or more pending U.S. Patent applications. AGENTMETRICS® USER MANUAL AgentMetrics® Conventions and Protocols The following functions operate consistently across all tools: Right Mouse-Click Holding the right button on your mouse while the cursor is positioned over a data element (for example, a specific bar on a chart or a row in a grid) will allow you to drill down and see the data that underlies the AgentMetrics® aggregated displays. This is particularly useful when you want to see the details (such as actual listing information) that comprise the aggregated data. Sometimes referred to as “drill-down” information. Mouseover Positioning the cursor over a point or bar in a chart will produce a small display with the numeric value or details that make up that data element. This is particularly useful when you want to see the actual number of listings, the dollar volume, or the listing details for specific data points in any of the displays. Column Sort/Resort T S When a grid is displayed initially, one of the column headers will have a small red arrow pointing up or down. This is the default column used to arrange the data in that grid. Rearrange the data in the grid in by clicking on another column header. Now you are ready to begin using the AgentMetrics® tools!! Page 21 of 37 ©Terradatum 2008. All rights reserved. Patent Pending. BrokerMetrics® products include technology that is the subject of one or more pending U.S. Patent applications. AGENTMETRICS® USER MANUAL Market Share Totals Traditional market share measurements by $ Volume or # Units within the MLS using any criteria the user desires.. Search Screen Property and Area Types mirror your MLS. Date Range: 24 months’ worth of data is available. Search Types: Office or Broker. Status area shows the progress of your search. Stop the search at any time by clicking the Cancel button to return to the search screen and change the criteria. Page 22 of 37 ©Terradatum 2008. All rights reserved. Patent Pending. BrokerMetrics® products include technology that is the subject of one or more pending U.S. Patent applications. AGENTMETRICS® USER MANUAL Search Results Displayed in two forms: chart and grid. Toggle between them using the chart and grid buttons. Chart form is the default display. The grid form is accessed via the toggle button. Print and email functionality is available. Multiple report formats are available, including: o $ Volume and # Units for List-side only and Sell-side only. o List Side demonstrates your success in obtaining the highest prices relative to the original listing price for your sellers (List Side). o Sell Side displays your ability to obtain the lowest prices relative to the original listing price for your buyers. o Total $ Volume and # Units Per Producing Agents show production of agents with at least one closed list or sell transaction side in the last 12 months. o Sold Price vs. Original Price % (List Side and Sell Side) Underlying record information is accessed and displayed via the AgentMetrics® right mouse click function and is exportable to any database program (e.g. Excel) if desired. Export the entire grid with the click of a button. The export file will contain the exact data in the grid from which you initiated the export. Page 23 of 37 ©Terradatum 2008. All rights reserved. Patent Pending. BrokerMetrics® products include technology that is the subject of one or more pending U.S. Patent applications. AGENTMETRICS® USER MANUAL Chart Rows that are selected in the grid (see next page) will be displayed on the chart. Checkboxes above the chart allow you to display only the information that is important to you. Underlying information is access and displayed via the right mouse click function on the chat bars. Page 24 of 37 ©Terradatum 2008. All rights reserved. Patent Pending. BrokerMetrics® products include technology that is the subject of one or more pending U.S. Patent applications. AGENTMETRICS® USER MANUAL Grid Grid format displays all offices or brokerages that did at least one side of a transaction within the search criteria used (see example below). Top 10 rows (excluding non-MLS) are selected (bold red text) for convenience. The rows that are selected (via mouse click) will be charted – chart esthetics will help you determine the appropriate limit. Grid Controls can be used to view only selected (bold red) rows and/or include office address. Underlying record information is accessed and displayed via the AgentMetrics® right mouse click function and is exportable as a csv file for use in another program (e.g. Excel) if desired. Page 25 of 37 ©Terradatum 2008. All rights reserved. Patent Pending. BrokerMetrics® products include technology that is the subject of one or more pending U.S. Patent applications. AGENTMETRICS® USER MANUAL Market Dynamics Allows you to better understand the movement of various market variables over time, from both a macro and micro perspective. For instance, you can view the median price trending for SFD homes over the whole MLS or for a very specific type, e.g. 4 BD homes in Plano. Search Screen Property types and area types mirror your MLS system. Bedroom and bathroom criteria are available. Any price range can be used. Time period can cover either 2 Years (Monthly) or 6 Months (Weekly) Search Results This tool measures changes to market conditions over 2 Years (Monthly) and 6 Months (Weekly). Each view consists of a chart page and a corresponding grid. Toggle between them using the chart and grid buttons The views are presented on 3 tabs: Price, Supply & Demand, and Sales Rate. Each chart page is comprised of 3 general areas: Chart Controls, Chart, and Key Information. Page 26 of 37 ©Terradatum 2008. All rights reserved. Patent Pending. BrokerMetrics® products include technology that is the subject of one or more pending U.S. Patent applications. AGENTMETRICS® USER MANUAL Chart Page Chart Controls Depending on the information displayed and time period selected in the search, some or all of the following features are available on each view: Additional Data Each chart has a default view which plots the primary data set. Certain charts allow you to add supplementary data sets by selecting the checkboxes. Information Overlays Display certain values over the chart bars. The feature is available when one data set is plotted; it is inactive when supplementary data sets are added to the charts. Demarcation Lines These lines are placed across the width of the chart to depict monthly averages, and/or the values for the beginning and ending months. The feature is available when one data set is plotted; it is inactive when supplementary data sets are added to the charts. Trend Lines Straight or polynomial (curved) trend lines are available for all views. The feature is available when any number of data sets are plotted; one line will be displayed for each data set. Page 27 of 37 ©Terradatum 2008. All rights reserved. Patent Pending. BrokerMetrics® products include technology that is the subject of one or more pending U.S. Patent applications. AGENTMETRICS® USER MANUAL Chart Each chart is designed to convey certain specific information. You may customize the primary views by utilizing the chart controls described above. The Key Information grids below the charts, described below, help you interpret the data and provide important related information. Office and listing information is available by right-clicking on a bar or data point on the chart. • Click on Listings to view and/or export all listings for the month or week, depending on search criteria. There are separate tabs for each status based on the statuses selected in the chart control panel above the graph. • Click on Office Breakdown for a list of the offices that are involved in the data calculations for that specific month or week. Right-click on a row in the Office Breakdown for Office Detail or Listing Detail. o Office Detail provides addresses and contact information for the office. o Office Listings displays the listings for that office. There are separate tabs for each status based on the statuses selected in the chart control panel above the graph. Right-click on a row in Listing Detail for the specifics of that listing. Page 28 of 37 ©Terradatum 2008. All rights reserved. Patent Pending. BrokerMetrics® products include technology that is the subject of one or more pending U.S. Patent applications. AGENTMETRICS® USER MANUAL Key Information The area below the charts is divided into three sections for both 2 Year (Monthly) and 6 Months (Weekly) time periods 2 Year (Monthly) Information 2 Year Focuses on the change in various market metrics over the entire (25-month) time period. “Triplets” Monitors the changes between the same calendar month over the last three years (e.g. Mar 05 – Mar 06 – Mar 07). Seasonal variation is thus isolated from this view, so that the focus remains strictly on the underlying market changes that have occurred year over year. Current Month Provides information on how the current month has changed from either the year before or the peak month of the entire time period (25 months). 6 Months (Weekly) Information Last 24 Weeks Focuses on the change in various market metrics for the entire 24 week time period. PTW (Previous Twelve Weeks) vs LTW (Last Twelve Weeks) Compares the averages of what is being measured over the last two 12-week periods. PTW represents the average for weeks 13 through 24 and LTW represents the average for weeks 1 through 12 (week 1 is the most recent week). Current Week Show the averages on how the current week has changed compared to the LTW averages. Page 29 of 37 ©Terradatum 2008. All rights reserved. Patent Pending. BrokerMetrics® products include technology that is the subject of one or more pending U.S. Patent applications. AGENTMETRICS® USER MANUAL Grid Page The grid page displays the data by month or week. The grid columns are color-coded to the statuses plotted on the corresponding chart. Office and listing information is available by right-clicking on a row on the grid. Click on Office Breakdown for a list of the offices that are involved in the data calculations for that specific month or week. Right-click on a row in the Office Breakdown for Office Detail or Listing Detail. Click on Listings to view the listings that were calculated for that specifice month or week. Office Detail provides addresses and contact information for the office. Office Listings displays the listings for that office. There are separate tabs for each status available for plotting on the corresponding chart. Right-click on a row in Listing Detail for the specifics of that listing. Tabs Price This tab displays information depicting the movement of average and median prices based on the time period selected in the search criteria. Supply & Demand This tab portrays the relationships between the numbers of listings in each status category based on the time period selected in the search criteria. Sales Rate This tab illustrates the sales activity pace over the 25 months or 24 weeks. Two methods of calculating MSI (Months Supply of Inventory) are available: NAR MSI The number of properties For Sale on the last day of the month (FS#) divided by the number of properties that went Under Contract (UC#) during the month: NAR MSI = FS# ÷ UC# MSI Terradatum’s MSI calculation equals the number of properties For Sale (FS) during the month (that is, the property was Active at least one day during the month) minus the number of properties that went Under Contract (UC) during the month minus the number of properties that Expired (X) during the month, divided by the number or properties that went Under Contract (UC) during the month: TD MSI = (FS – UC – X) ÷ UC Basic Absorption This chart monitors the amount of inventory versus the overall sales rate: Inventory is broken down into two components: New – Listing has an initial list date that falls during the month in question Residual – The initial list date occurred prior to the month in question Therefore, New Inventory is “freshly minted” for the month, and Residual Inventory includes listings that are being carried forward from earlier months. Page 30 of 37 ©Terradatum 2008. All rights reserved. Patent Pending. BrokerMetrics® products include technology that is the subject of one or more pending U.S. Patent applications. AGENTMETRICS® USER MANUAL Pricing Analysis Provides the agent with a tool that allows for a quick, two-step method of gauging the appropriate price for a listing. Thus, the agent can easily determine if a long DOM listing is at the appropriate price point (or not) for current market conditions. Search Screen Property types and area types mirror your MLS system. Bedroom and bathroom criteria are available. Any price range can be used. Suggested Price: Enter the suggested price in the text box provided. This input is not required; however, entering a suggested price will help you focus the search results more precisely. If a Suggested Price is not entered, the Median Price of all properties meeting the search criteria will be used. Page 31 of 37 ©Terradatum 2008. All rights reserved. Patent Pending. BrokerMetrics® products include technology that is the subject of one or more pending U.S. Patent applications. AGENTMETRICS® USER MANUAL Results Analyzing the results of a Pricing Analysis search is a two-step process: Step #1 – Price Distribution The Price Distribution chart displays the last 12 months’ price distributions, overlaid with current inventory. The suggested price of the subject property is indicated on the vertical red line, which shows how the property fits within the distribution curve. If a suggested price was not entered, the vertical red line will indicate the median price of all properties that meet the search criteria. Use the Interval and Pricing window controls to fine-tune the appropriate price intervals (depicted as data points on the chart) and pricing window size. The default pricing window (the yellow band) is 5% under and 5% over the suggested price of the subject property. Hold the mouse pointer over a data point on the chart to display the pricing interval and the number of properties that were sold or listed during the last 12 months (green and blue lines, respectively) or are currently for sale (red line). Page 32 of 37 ©Terradatum 2008. All rights reserved. Patent Pending. BrokerMetrics® products include technology that is the subject of one or more pending U.S. Patent applications. AGENTMETRICS® USER MANUAL Step #2 – Sales Rate, Months Supply of Inventory and Pricing Window Sales Rate and MSI (Months Supply of Inventory) This chart shows the monthly sales rate (the average number of units sold per month) and inventory supply (the number of months it would take to sell the properties currently on the market, based on the Sales Rate) for properties in the Pricing Zone (the market segment that includes the subject property). Pricing Window The Pricing Window scatter graph displays the properties within the Pricing Zone relative to the subject property (the vertical red line). The DOM number is represented by the vertical height (loft) of each data point—e.g., the higher any data point, the longer it has been on the market. Listings Grid The grid below the chart contains data on the specific properties in the Pricing Window. Click on a row to remove a property from the Pricing Window; click it again to restore it. Hold the mouse pointer over a data point on the chart to highlight the related row in the grid, and to display key information on the property (Property Type, Address, Price and DOM). Hollow symbols on the graph represent properties that have experienced no price reductions; solid symbols represent properties that have had at least one price reduction. Fine-tuning Display Active, Ratified (Pending and Contingent), and/or Sold properties using the checkboxes above the grid. The chart initially displays only Sold properties. Display properties sold within the last 12, 6 (default), or 3 months, or within the previous one month, by clicking the radio buttons above the grid. The Sales Rate and MSI will recalculate accordingly. Hide properties that have had one or more price reduction(s) by clicking the checkbox at the right above the grid. Use the red slider bar to tighten up the pricing window (place the mouse pointer on one end of the slider, click, hold, and move the slider). Page 33 of 37 ©Terradatum 2008. All rights reserved. Patent Pending. BrokerMetrics® products include technology that is the subject of one or more pending U.S. Patent applications. AGENTMETRICS® USER MANUAL Exports AgentMetrics® allows you to export data from many places in the program into a file that can be read and manipulated by other programs (e.g., Microsoft Excel, Microsoft MapPoint, etc.). These exports allow the user to extend the scope and power of the aggregated information with functionality from other sources. A few examples will illustrate how to use the various exports: Market Share Totals – Market Share Grid Export On the File menu, select Export. Choose ‘Market Share Grid.’ Select a location for the file, and enter a name for the file This creates a CSV file that may be opened in programs such as Excel. o Once you have opened the file, you may format the data to create the chart and/or data table you desire. Page 34 of 37 ©Terradatum 2008. All rights reserved. Patent Pending. BrokerMetrics® products include technology that is the subject of one or more pending U.S. Patent applications. AGENTMETRICS® USER MANUAL o Then use Excel’s charting function to create the presentation you desire (the chart below was created with Excel’s Chart Wizard ). Page 35 of 37 ©Terradatum 2008. All rights reserved. Patent Pending. BrokerMetrics® products include technology that is the subject of one or more pending U.S. Patent applications. AGENTMETRICS® USER MANUAL Market Share Totals – Total $ Volume / # Units Export On the File menu, select Export. Choose ‘Market Share Grid.’ Select a location for the file, and enter a name for the file This export also creates a CSV file, but this time it has GIS “handles” (e.g. zip codes) included with the underlying data records. As a result, GIS mapping software (e.g. MapPoint, ArcView) can read and display the file information on a map. , can read the CSV file format. However, you may wish to GIS software, like Microsoft’s MapPoint format the data using a program such as Excel before importing it. To map the data, open the application (e.g., MapPoint) and in the Data pull-down menu, select Data Import Wizard. Page 36 of 37 ©Terradatum 2008. All rights reserved. Patent Pending. BrokerMetrics® products include technology that is the subject of one or more pending U.S. Patent applications. AGENTMETRICS® USER MANUAL The example below uses Microsoft’s MapPoint to present the information in the following manner. Page 37 of 37 ©Terradatum 2008. All rights reserved. Patent Pending. BrokerMetrics® products include technology that is the subject of one or more pending U.S. Patent applications.