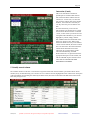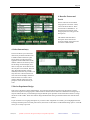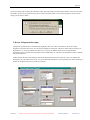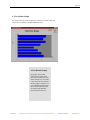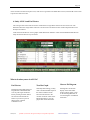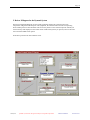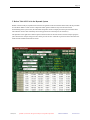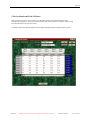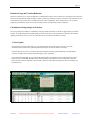
1
Qualitek-4
for Windows
Automatic Design and Analysis of
Taguchi Experiments
QT4
Reference Manual
Nutek, Inc.
Quality Engineering Seminar and Software
Bloomfield Hills, MI, USA. www.Nutek-us.com
Page 2
Reference Manual
IBM PC/Compatibles Software for
Automatic Design and Analysis of Taguchi Experiments
Nutek, Inc.
Bloomfield Hills, Michigan, USA.
Nutek, Inc.
Qualitek-4, Automatic Design and Analysis of Taguchi Experiments
Reference Manual
Version: 06.01
Page 3
NUTEK LICENSE AGREEMENT
Each Nutek product at retail is licensed by Nutek, Inc. to the original purchaser and any
subsequent owner of the product for their use by a single user at a time. You may use the
software on any item of compatible hardware that you own or use. The license to use the
software sold to you includes personal use and use in your business or profession. You are
permitted to install the QT4 software program to the hard disk of one personal computer.
You are not permitted to make copies of the Program medium or the User's Manual unless
you have purchased Site License
or Corporate
Site License.
Warranty
Information
W A R RA N T Y
Nutek, Inc. warrants that the original QUALITEK-4 program diskettes are free from
defects in material and workmanship, assuming normal use, for a period of ninety (90) days
from the date of purchase.
If a defect occurs during this time, you may return the diskette along
with proof of purchase, for a replacement copy free of charge.
NUTEK, INC., ALL RIGHTS RESERVED
NO LIABILITY FOR CONSEQUENTIAL
In no event shall Nutek be liable for any special, incidental, indirect, or consequential damages whatsoever (including
damages for loss of business profits, business interruptions, loss of business information, or any other pecuniary loss)
arising out of the use of or inability to use the software product, even if Nutek advised of the possibility of such damages.
Nutek, Inc.
Qualitek-4, Automatic Design and Analysis of Taguchi Experiments
Reference Manual
Version: 06.01
Page 4
Nutek Product Support
In case you have difficulty installing Qualitek-4(QT4) for Windows, call Nutek during weekdays. If we are unavailable
when you call, be sure to leave a message with your name and telephone number. We will contact you within 24 hours.
Qualitek-4 for Windows is made for IBM/Compatibles 486 or later model computers.
You will be able to install QT4 if your computer has Windows 98 or later versions installed. While preparing to install, you
must close all other programs that you might be working on or otherwise may be open.
If you are outside the United States, you may find it convenient to send us E-mail about your problem. We will respond to
you within a week or earlier.
CUSTOMER SUPPORT PLAN
Nutek provides installation assistance to all registered users of the QUALITEK-4 (QT4)
software. When calling for help, please identify the purchaser's name, company and the registration
number of your QT4 software.
(The registration number is displayed in the registration screen of the QT4 program).
Most of your questions on the QT4 program can be answered by simply re-reading this manual
and trying the procedure again. However, if you still have questions and need assistance with
installation, please visit our web site (http://nutek-us.com/wp-q4w.html ), call or write to us. The
price of the software does not include support for use and project application of the software.
Nutek, Inc.
3829 Quarton Road, Suite 102
Bloomfield Hills, MI, USA 48302-4059
Tel: 1-248-540-4827, For latest information visit: http://nutek-us.com
Nutek, Inc.
Qualitek-4, Automatic Design and Analysis of Taguchi Experiments
Reference Manual
Version: 06.01
Page 5
Contents
Page
Chapter 1
Welcome to Qualitek-4 for Windows
About This Manual
New Features in Qualitek-4 for Windows
Switching from Qualitek-4 for DOS
7
7
8
Installation
Window 3.x Installation
Window 95 Installation
Installation Problems
9
9
12
Chapter 3
How to Start and Exit Program
Quitting Program
13
14
Chapter 4
Application Support
On-line Support
15
Chapter 5
Experiment Planning
18
Chapter 6
Experiment Design
(a) Simple Experiments
Manual Design
Automatic Design
(b) Experiments with Outer Array
Manual Design
Automatic Design
Description of Trial Conditions
(c) Experiments with Dynamic Characteristic
Review P-Diagram
Description of Signal and Noise Conditions
22
26
30
30
32
34
35
36
40
Chapter 7
Editing Factors, Arrays and Results
41
Chapter 8
Preparation of Results
Direct Input of Results
Preparation of Results
Overall Evaluation Criterion 9OEC)
OEC Summary
Exporting and Importing Results
Transferring Results by Direct COPY and PASTE Method
43
46
47
50
52
54
Chapter 2
Nutek, Inc.
Qualitek-4, Automatic Design and Analysis of Taguchi Experiments
Reference Manual
Version: 06.01
Page 6
Chapter 9
Analysis of Results
Standard Analysis
- What to Do in ANOVA
- Estimate of Performance
Analysis of Multiple Sample Results (S/N)
Analysis of Dynamic Characteristic
Estimation Savings
56
62
65
68
68
77
Printing Reports and Graphs
Suggested Report Content
Preparing Comprehensive Report
On Screen Printing
Example Case Study Report
80
80
81
81
82
Appendix
Nutek, Inc.
Qualitek-4, Automatic Design and Analysis of Taguchi Experiments
Reference Manual
Version: 06.01
Page 7
Chapter 1
Welcome to Qualitek-4 for Windows
Welcome to Qualitek-4 (QT4) for Windows. QT4 is a user-friendly software for Automatic Design and Analysis of Taguchi
Experiments. Like its predecessor, Qualitek-4 DOS version, it has many experiment design and analysis features that make
you accomplish your projects in the least amount of time. Whether you are an expert or new to the Design of Experiment
applications, QT4 will help you complete your projects more efficiently.
QT4 is easy to learn and use. Extensive on-line help can help you brush up your background on the subjects. There are
over twenty topic overviews providing you with a comprehensive subject review. As a supplement to this manual, the online help can guide you every step of your application. Additionally, individual Screen Help provides you with clear
interpretation of the items displayed on the screen.
About This Manual
Our experience tells us that a vast majority of users do not read the manual until necessary. We, therefore, organized the
content of this manual in order of anticipated user needs rather than describing the menu items in sequence. Thus, we first
talk about items you need to get started with. Then we discussed items that help you accomplish the experiment design,
analysis etc. You will find that most of the materials are presented in a manner such that it addresses "how to" questions
you may have.
Short Tutorials and miscellaneous items and trouble shooting tips are included at the end. An adequate number of screen
displays are included for ease of operation.
For latest changes, updates and brief operating guidelines, always visit our Web Site and download the applicable file and
update the Qualitek-4 program directory as per the instruction.
This reference manual is not intended to provide the theories governing the application or purpose of the Taguchi
approach and as such does not replace the need for training or a textbook on the subject. For theories and practices of the
Taguchi methods, consult either of the following two books (Visit www.nutek-us.com/wp-txt.html for broader references):
1. Design of Experiments Using the Taguchi Approach: 16 Steps to Product and Process
Improvement by Ranjit Roy, Hardcover (January 2001) John Wiley & Sons; ISBN: 0471361011.
2. A Primer on the Taguchi Method by Ranjit Roy ,Hardcover - 247
pages 1 edition
Nutek, Inc.
Qualitek-4, Automatic Design and Analysis of Taguchi Experiments
Reference Manual
Version: 06.01
Page 8
New Features in Qualitek-4 for Windows
QT4 for Windows has many new features over and above the features offered by the DOS version:
•
•
•
•
•
•
•
Experiment design arrays have been extended to L-64 for both inner and outer array designs.
Number of samples per trial condition has been extended to 120/trial.
Dynamic characteristic includes 12 Signal and 10 Noise levels
Test of presence of interaction can be carried out for mixed level factors
Automatic experiment design capabilities extended to include more complex designs
Savings due to improvement calculated automatically
Reduced variation diagram generated from existing experiment data
Switching from Qualitek-4 for DOS
If you are familiar with earlier Qualitek-4 (DOS) version, you will immediately recognize the placement and content of the
menu items. The design and analysis capabilities have been placed under the corresponding menu headings. You will be
able to find the option necessary by determining the type of task, whether it falls under Design or Analysis, etc.
QT4 is compatible with your experiment files of the DOS version. All basic experiment files of DOS version have the
extension .QT4. The Window version will have the extension .Q4W. To use your old experiment file, simply copy the file
into your \USRFILES subdirectory. Then get into QUALTEK-4 and open your ___.QT4 file (make sure to display all files if
you do not see your files the first time). You may work with your file as normal and be sure to save before you quit. When
you save, the file will now be transformed automatically into the new format and saved with extension .Q4W. For your
future applications you will work with your file with the new extension.
Nutek, Inc.
Qualitek-4, Automatic Design and Analysis of Taguchi Experiments
Reference Manual
Version: 06.01
Page 9
Chapter 2
Installing Qualitek-4 in Window 95 or Windows 3.x
To install Qualitek-4 program, you will need the program disks (Three 3-½ floppy disks or one CD-ROM) and your personal
fifteen digit Registration number. If you do not have the correct registration number, the program will install as a DEMO
version allowing you to use it for designing experiments with L-8 array only.
You will install the program the same way as all other Windows program - just insert the CD-ROM or disk 1 of 3 into the
drive run X:\|SETUP (X = CD or floppy drive as applicable).
Windows 3.x installation
Close all open programs before
starting installation. Insert program
disk 1 into the floppy drive.
From the Program Manager screen,
click on the File menu and click again
on Run.
In the command ilne box, type the
letter of your 3 1/2” floppy drive (say
A), a colon, a back slash and SETUP.
For example if your drive is A, you
would type A:\SETUP. Then click on
the OK button and follow the screen
instructions.
Window 95 installation
Close all open programs before starting
installation. Insert program disk 1 into the
floppy drive
Click the Start button at lower left of your
Window 95 screen and click Run from the
menu. At the RUN command, open the
X:\SETUP file and click OK. Follow the
screen prompt to complete installation.
Nutek, Inc.
Qualitek-4, Automatic Design and Analysis of Taguchi Experiments
Reference Manual
Version: 06.01
Page 10
Qualitek-4 Installation in
Progress
As you Run the SETUP file, you will see
the screen on the right. Close all programs
before you proceed to install Qualitek-4. If
you have some program running, Click
Cancel button, otherwis e Click Next
button.
Enter the name of the registered user and
the name of the company. When done,
Click Next.
Qualitek-4 installation in progress
If you are installing from floppy disks, your
computer will copy the initialization files
from disk 1 and quickly prompt you for disk 2
You will
the 15-digit
andneed
diskto3.enter
Remove
disk 1, insert disk 2, and
registration
number assigned to you in
click OK.
place of Demo. This number is printed in
the letter granting the user license. Your
registration
number will
to:files and will
Your computer
will look
beginsimilar
to copy
quickly prompt you for disk 3. Remove disk 2
402240198112099
and place
disk 3 in the floppy drive. Click OK to
proceed with the program setup.
If you do not have a valid registration
number, you can install Qualitek-4 using
‘Demo’ as the registration number. When
installed as a Demo, Qualitek-4 will allow
you to use it
When done entering the registration
Nutek, Inc.
Qualitek-4, Automatic Design and Analysis of Taguchi Experiments
number,
Click Next.
Reference Manual
Version: 06.01
Page 11
Installation Problems
First, check to see that your computer has the necessary requirements that Qualitek-4 needs.
That is, check to see that you have enough hard disk space and enough memory (RAM).
Also, you may want to check the integrity of the floppy disk(s) containing the program. If
these solutions do not remedy your problem, feel free to contact us here at Nutek Inc. If
you wish to return the program for a full refund, you must return it in the original package
within two weeks of delivery.
Nutek, Inc.
Qualitek-4, Automatic Design and Analysis of Taguchi Experiments
Reference Manual
Version: 06.01
Page 12
Need Assistance With Application Procedures?
If you need help in the use of the program, or the logic behind the
Taguchi Method, refer to the built in on-line help included with
Qualitek-4. You may also find some more detailed and useful
information on our web site:
http://www.nutek-us.com
Nutek, Inc.
Qualitek-4, Automatic Design and Analysis of Taguchi Experiments
Reference Manual
Version: 06.01
Page 13
Chapter 3
How to Start and Exit Program
You can use the Start button of Window 95 or later versions to start Qualitek-4 program. To start, click the Start button,
and then point to Qualitek-4 program. If you are using Window 3.x, then double click the Qualitek-4 icon from the Window
Program Manager screen.
Window 3.x
From the Qualitek-4 folder, doubleclick the Qualitek-4 icon.
After a few introductory
screens, you will arrive at the
Qualitek-4 main screen. You
can now begin to use the
program for experiment
designing.
For help with HOW TO GET STARTED and REVEW QUALITEK-4 Screens, visit:
http://nutek-us.com/wp-q4w-start.html & http://nutek-us.com/wp-q4w-screen.html
Nutek, Inc.
Qualitek-4, Automatic Design and Analysis of Taguchi Experiments
Reference Manual
Version: 06.01
Page 14
Qualitek-4 Main Screen
What to do next?
You have several options. If you
are not ready to start a new design,
you would most likely prefer to
review one or more examples from
the list of example experiments
included with the QT4 program
disk. To review an example
experiment:
- From the FILE menu open file
PISTON.Q4W or any other file of
your choice.
- Click on the REVIEW menu and
select Trials. This option allows
you to review and print the trial
conditions. Click on CANCEL
button to return to main screen.
- Click on EDIT MENU and select
Factors and Levels or any other
item. Click OK when you are done
and follow screen prompt to return
to main screen.
Quitting Qualitek-4
If at any time you wish to quit and exit Qualitek-4, choose the
FILE option from the main screen’s pull down menu and click on
EXIT. You will then have exited Qualitek-4 and returned to the
Windows Desktop.
When you exit the program, QT4 remembers the file you were
working on. So that when you run QT4 again, it will start you
with the file you were working on before. You need not CLOSE a
file as when you open another experiment file from the FILE
menu, QT4 automatically closes the previous file.
Nutek, Inc.
Qualitek-4, Automatic Design and Analysis of Taguchi Experiments
- Click on ANALYSIS menu and
select Standard or S/N analysis.
Note that S/N is only allowed when
there are more than one column of
results. After you select the
Quality Characteristic, follow the
screen prompt or click on the OK
buttons to proceed with the
analysis. Note that there are three
basic screens that display results
of analysis. In the order of their
sequence, they are; Main Effect,
ANOVA, and Optimum screens. A
number of options are available
from each of these screens. The
Optimum screens represent the
conclusion of analysis at which
point when you click the OK
button, QT4 will bring you back to
the main screen.
Reference Manual
Version: 06.01
Page 15
Chapter 4
On-line Application Support
The basic steps in the application process are as outlined below. Brief description and application guidelines are included
on each of the application steps in the Qualitek-4 on-line help.
Select Project and plan Experiment
Look for simpler project to apply first. Arrange for the planning/brainstorming session. Determine:
* Evaluation criteria and define a method to combine them
* Control factors and their levels.
* Interaction (if any)
* Noise factors (if any)
* Number of samples to be tested.
* Experiment logistics.
Experiment Design
Design experiment & Describe trial conditions.
* Determine the order of running the experiment
* Describe noise conditions for testing samples if the design includes an outer array
Conduct Experiment
Carry out experiments
* Note readings, calculate and record averages if multiple readings of the same criteria are taken.
* Calculate OEC using the formula defined in the planning session.
Analyze Results
* Determine factor influence (Main Effect)
* Identify significant factors (ANOVA)
* Determine optimum condition and estimate performance
* Calculate confidence interval of optimum performance
* Adjust design tolerances based on ANOVA
Confirm Predicted Improvement
Run confirmation tests with multiple samples at the optimum condition. Compare the average
performance with the confidence interval determined from DOE.
Nutek, Inc.
Qualitek-4, Automatic Design and Analysis of Taguchi Experiments
Reference Manual
Version: 06.01
Page 16
Need Assistance With Application Procedures?
If you need further help in the use of the program, or the theory behind the Taguchi
Approach, always refer to the built in on-line help included with Qualitek-4. You
may also find some more detailed and useful information on our web site:
http://nutek-us.com
Although QT4 is designed mainly to help you accomplish your design and analysis tasks on command and not to teach
you the method, we have placed a large volume of information about the method and its application strategies. Most of the
theory related items and general topics have been placed under HELP menu in the main screen. Discussion topics and
search items are described in hypertext so that when a click on an item it takes you directly into the subject matter. To get
some tips on what the content of the screen mean or how to interpret the data, click on the HELP button for help on the
specific screen.
Nutek, Inc.
Qualitek-4, Automatic Design and Analysis of Taguchi Experiments
Reference Manual
Version: 06.01
Page 17
Nutek, Inc.
Qualitek-4, Automatic Design and Analysis of Taguchi Experiments
Reference Manual
Version: 06.01
Page 18
Chapter 5
Experiment Planning
Experiment planning is a necessary and important first step in the application process. Of course planning/brainstorming
for the project is done outside the program and before you come to use the program. But should you need some help with
how to carry out the planning session or what to discuss in the planning session, a considerable amount of guidelines
have been included in the main screen HELP in QT4. Remember it is the formal planning session, which supplies answers
to the pertinent questions before an experiment is designed.
The main screen HELP in QT4 contains guidelines as follows:
PURPOSE OF BRAINSTORMING SESSION - Purposes of a brainstorming session are many:
* Identify factors, levels and derive other pertinent information about the experiment, collectively with all involved in the
experiment.
* Develop team effort and achieve the maximum participation from the team members.
* Determine all experiment related items by consensus decisions.
WHO SHOULD CONDUCT?
The session should be facilitated by a person who has a good working knowledge of the Taguchi methodologies.
Engineers or statisticians dedicated to helping others apply this tool will make better facilitators.
WHO SHOULD HOST THE SESSION?
The team/project leader should host the brainstorming session.
WHO SHOULD ATTEND?
The project team members consisting of all those who have first-hand knowledge and/or involvement in the subject under
study should be included. For an engineering design or a manufacturing process, both the design and the manufacturing
personnel should attend. If cost or supplier knowledge is likely factors, then persons from these disciplines should be
encouraged to attend (group size permitting).
HOW MANY SHOULD ATTEND?
The more the better. The upper limit should be around 15. It can be as low as 2.
WHAT IS THE AGENDA FOR THE SESSION?
None. Some exposure will help. Application experience on the part of some participants will be a plus. A facilitator with
application experience can help the participants with brief overviews when needed.
TOPICS OF DISCUSSIONS
The following topics should be included in the agenda for the brainstorming session.
1. OBJECTIVE OF THE STUDY (What are you after?)
A. What is the characteristic of quality? How do we evaluate the objective?
B. How do we measure the quality characteristic? What are the units of measurement?
Nutek, Inc.
Qualitek-4, Automatic Design and Analysis of Taguchi Experiments
Reference Manual
Version: 06.01
Page 19
C. What are the criteria (attributes) of evaluation for the quality characteristic?
D. When there is more than one criterion or there are several attributes of the quality characteristic,
how do we combine them into an Overall Evaluation Criterion(OEC)?
E. How are the different quality criteria weighted?
F. What is the sense of the quality characteristic?
Lower is better, nominal is the best, etc.
2. DESIGN FACTORS AND THEIR LEVELS
A. What are all the possible factors?
B. Which ones are more important than others (Pareto diagram)?
C. How many factors should be included in the study?
D. How to select levels for the factors? How many levels?
E. What is the trade off between levels and factors?
3. "NOISE" VARIABLES (How to make a robust design?)
A. What factors are likely to influence the objective function, but can not be
controlled in real life.
B. How can the product under study be made insensitive to the noise factors?
C. How are these factors included in the study?
4. INTERACTION STUDIES (Which factors are likely to interact?)
A. Which are the factors most likely to interact?
B. How many interactions can be included?
C. Should we include an interaction or an additional factor?
D. Do we need to study the interaction at all?
5. TASK ASSIGNMENT AND DESCRIPTION (Who will do what, how and when?)
A. What steps are to be followed in combining all the quality criteria into an OEC?
B. What to do with the factors not included in the study?
C. How to simulate the experiments to represent the customer/field applications?
D. How many repetitions and in what order will the experiments be run?
E. Who will do what and when? Who will analyze the data?
Nutek, Inc.
Qualitek-4, Automatic Design and Analysis of Taguchi Experiments
Reference Manual
Version: 06.01
Page 20
Nutek, Inc.
Qualitek-4, Automatic Design and Analysis of Taguchi Experiments
Reference Manual
Version: 06.01
Page 21
Chapter 6
Experiment Design
Experiment design is the primary task you would want to accomplish by using QT4. The design task can only begin when
you have completed the planning session and you have identified the factors and their levels and interactions. The size of
your experiment will depend on the number of factors and levels you have. QT4 allows you to accomplish the experiment
design two ways. The first option is for you to be in charge (Manual Design). Here you select the array for the experiment
and also decide which factor goes to which column. The alternative way is to let QT4 prescribe the smallest design for
your situation (Automatic Design).
Depending on your project your experiment design can have only and (a) Inner array, (b) Inner and Outer array, and (c)
inner array and (c) Inner array and Dynamic characteristic. You can let QT4 design your experiments with Inner array only
or experiments with outer array. But if you are studying Dynamic systems, you must add that to your inner array design
manually.
If your design includes
Manual Design
Then select option
Automatic Design
(a) Simple experiment - Inner array only
Inner array
or
Inner array
(b) Experiment design with Outer array
Inner and Outer array
or
Inner and Outer
(c) Experiment design with Dynamic Characteristic
Inner array and DC
or
Inner array
(a) Simple Experiments
Simple experiments are those that are designed using only an inner array. Your experiment may indeed have noise factors;
no formal outer array is utilized to define the noise conditions. You can design such experiments using the Manual or
Automatic DESIGN options.
Nutek, Inc.
Qualitek-4, Automatic Design and Analysis of Taguchi Experiments
Reference Manual
Version: 06.01
Page 22
Manual design
1. Select Menu option
From the main screen, click on
the DESIGN menu option and
then select Manual and Inner
array. You need not close the
exiting experiment file on the
screen. It will be closed
automatically and data in
memory will be erased.
Click the YES button when the
message about the current data
appears next.
2. Select Array
From the Inner array selection screen, check
the array you want to use for your design.
You have choice of selecting any array from
the list of L-4 through L-64. Suppose that
you select the L-8 array for your design.
Nutek, Inc.
Qualitek-4, Automatic Design and Analysis of Taguchi Experiments
Reference Manual
Version: 06.01
Page 23
3. Describe Factors and levels
Experiment design is accomplished in the Inner Array Design screen. Before start entering the description, you need to
have a piece of paper where you have written the names of your factors and levels, and also identify which columns these
factors are assigned.
Suppose that the factor you want to assign in column 1 is TIME. Highlight the CELL under Factor and row number 1(rows
in this table are columns of the Orthogonal array) by clicking with the right mouse button. Then type the description of the
factor. For analysis reference purposes, it is a good idea to use a leader character designation like A, B, etc. So instead of
typing TIME, type A: Time.
To describe the levels, click the CELL under Level 1 in the same row as the factor or press Shift+Right Arrow Key, then
type the description of the level. Of course you have to have at least two levels for each factor. Also, while describing the
level, if your level is 45 Seconds, type in 45 Seconds, not just 45. If you entered only 45, QT4 will not complain, but it is a
good idea to include characters and numbers both for description.
4. Reserve columns for Interaction studies
When your design includes interaction studies, you will need to reserve the appropriate columns for interaction. Suppose
that you wish to reserve a column for interaction between factors (QT4 capabilities limited to interaction between 2-level
factors only) A & B, you can do these two ways. If you already know the column for the interaction, from the Triangular
Table, you can highlight the CELL under the Factor in the row number then click the COL.INT button at the bottom of the
screen.
Nutek, Inc.
Qualitek-4, Automatic Design and Analysis of Taguchi Experiments
Reference Manual
Version: 06.01
Page 24
Interaction (Contd.)
The screen will indicate a number of
possible pairs of columns which will mix
their interaction effect with the selected
column (col. 3 in this case). To select the
pair of interest, simply click on the column
numbers, 1x2 in this case. Note that you
can only select one pair of column at one
time.
If on the other hand, you are not sure
which column you should reserve to study
the interaction between factors in columns
1 and 2, in other words you do not have the
Triangular Table information, you need not
highlight any column, simply click the
INT.TABLE button from the bottom of the
Inner array design screen. When in the
Interaction Table screen, key in the number
1 under A and 2 under B, the click on Check
box to set interaction. This will indicate the
column which should be reserved for
interaction. If you want QT4 to set this
interaction automatically, click OK.
When interaction is set, QT4 will insert the
appropriate description in the column, and
indicate *INTER* in place of the first level
in the same line. NEVER TYPE THIS
DESCRIPTION YOURSELF.
5. Identify unused columns
The columns that have no factors or interactions assigned are referred as unused columns. QT4 needs to know which
columns, if any are determined by you as unused. To set a column as unused, highlight the CELL under Factor description
in the line number corresponding the column by the mouse click, then click on the button UNUSED at the bottom of the
Inner array design screen.
Nutek, Inc.
Qualitek-4, Automatic Design and Analysis of Taguchi Experiments
Reference Manual
Version: 06.01
Page 25
Your experiment design description is complete when you have addressed each and every column of the array, which are
the rows identified by the number. For completeness, all columns must have a factor, an interaction, or be unused. In case
of factors, there must be at least two levels described. QT4 will not allow you to proceed unless the description is
complete. When ready, click OK to proceed.
6. Enter Project Descriptions
This screen allows you to attach four lines of description about your project. These items are optional and used only in
printing reports when available. To set the Quality Characteristic appropriate for your experiment, click the pointer at the
end of the line and make your selection. QT4 automatically puts the selected description.
7. Review and Modify Array
The Edit Inner Array screen shows the
array you have selected for your
experiment. All columns except those are
identified as unused, are shown in the
original form. All unused columns are
automatically turned into zero by QT4. If for
some reason you want to use an unused
column, you must reset the column to its
original form. To reset the column, highlight
the CELL in the first row of the column by
the mouse click and then click on the
RESET COL. button at the bottom of the
screen. You would always need to do this
step when you reassign a column from
unused status to assigning a Factor or an
Interaction.
If your design requires a column to be
upgraded or modified, you can do so in this
screen. Just click on the CELL to modify
and key in the number.
Nutek, Inc.
Qualitek-4, Automatic Design and Analysis of Taguchi Experiments
Reference Manual
Version: 06.01
Page 26
8. Name and Save Files
The final screen in the experiment design
process allows you to name your
experiment file. QT4 attaches .Q4W to all
experiment files. You need only to supply
the first eight characters of the file name. It
is a good idea to start your file name with
an alphabetic character. You can have most
any characters in the middle, except few
delimiters like “,”, “;”, “:” etc. are not
desirable.
The experiment file will always be saved in
the directory called USRFILES. While
installing you has a choice to place this
directory in and drive and directory you
want. By default, this is a sub-director
under the Q4W director. If you do not see
the USRFILE directory in the display box,
click on C:\, search for the USRFILES
directory and select it before you OK to
save your file.
Automatic Design
In automatic design, QT4 designs the experiment for you automatically. Given your experimental parameters such as
number of factors at various levels and their descriptions, QT4 selects the most suitable array and assigns factors to the
most desirable columns. Once the design is displayed, you can then modify the description, reassign the factors, and
modify columns if necessary.
1. Selection Menu Option
To let QT4 design your
experiment, click DESIGN option
from the main screen (Experiment
Configuration) and select
Automatic Design.
In the next screen QT4 alerts you
about the fact that all existing
experiment data will be erased.
Click OK to proceed.
Nutek, Inc.
Qualitek-4, Automatic Design and Analysis of Taguchi Experiments
Reference Manual
Version: 06.01
Page 27
2. Set Requirements
This screen allows you to set the
experiment size by indicating the number of
factors at two, three, and four levels, and
also the interaction between two 2-level
factors. Considering the same experiment
designed earlier (four 2-level factors and
one interaction), click the box left of
Number of 2-level factors.., then set the
counter to 4. Check the Interaction box
next and set the counter number to 1. Since
in this experiment there are no three or four
level factors and no noise factors, nothing
else needed to be checked.
Note: QT4 can design most common
experimental situations requiring Inner and
Outer arrays. If QT4 cannot design your
experiment, it will prompt you so. Should
you want QT4 to design your experiment
anyway, modify your requirements slightly
and try again. You will then have the
opportunity to alter your design manually.
3. Review Proposed Experiment Design
Based on the requirements, QT4 selects the most
economical array for the experiment. If the information
displayed, which is what QT4 used to determine the
design, is not correct, click No. This will allow you to
redefine the requirements. Otherwise click OK to
proceed.
Nutek, Inc.
Qualitek-4, Automatic Design and Analysis of Taguchi Experiments
Reference Manual
Version: 06.01
Page 28
4. Describe Factors and
Levels
Factors and levels are described
using separate screens for 2-level,
3-level and 4-level factors. The 2level factors are defined first. To
describe factors and levels, click
the appropriate box and type in the
descriptions.
The numbers left of the factor
description boxes indicate the
sequence number of the factor and
are not the column number
4. Select Interaction(s)
This screen allows you to select the
interaction you desire from the list of
available column interactions. QT4
always shows you the interaction
applicable and available based on the
number of factors and the array used
for the design. In this example, since
there are only four 2-level factors and
the array has seven columns, there are
three dependent(common column
numbers) interactions are possible. You
may select one or more interaction or
none at all. In the example, interaction
between factors in colums 1 and 2
(AxB) is desired. Follow the screen
prompt to select the interaction you
want.
5. Review Experiment Design
This screen is the same as in the manual design. You will notice that all factors, their level descriptions, and the
interaction are placed in the appropriate column locations and the unused columns are identified. This design may or
may not look like the one you would design using the manual option. QT4 has certain fixed rules it follows to assign
the factors to the column. These rules follows design that minimizes mixing of unwanted interactions with the factor
effects.
If you created an error in typing descriptions or you want to alter assignment of a column, you can highlight the CELL
and retype the description. From this point onward, the screens are the same as in the Manual Design option. Click OK
when you are ready to proceed.
Nutek, Inc.
Qualitek-4, Automatic Design and Analysis of Taguchi Experiments
Reference Manual
Version: 06.01
Page 29
6. Review Orthogonal Array
Examine the Orthogonal array and
click OK to proceed.
(Same as the Manual Design option)
7. Save Experiment File
Find the USRFILES directory and name the
experiment file with extension .Q4W (Bracket2.Q4W)
and click OK when ready. Your file is now saved and
you are ready to describe the Trial conditions and
carry out the experiments.
(Same as the Manual Design option)
Nutek, Inc.
Qualitek-4, Automatic Design and Analysis of Taguchi Experiments
Reference Manual
Version: 06.01
Page 30
(b) Experiments with Outer Arrays
Outer arrays are used to formally incorporate the Noise factors into the experiment. Of course before an outer array is
added to the experiment, the inner array must be designed first. Before proceeding to design the outer array, make sure
that your Inner array is designed and that the desired experiment file is opened. If the file is not already opened, open the
desired file by selecting the FILE menu from the main screen(Experiment Configuration).
Manual design
1. Select menu item
From the main screen
DESIGN menu, select
manual design then click
on Outer Array.
2. Select Outer Array
The same number of arrays as available for the Inner
Array design is also available for the Outer Array
design. Of course the Outer Array you need depends
on the number of Noise factors you want to include in
your experiment. The rules for selection of the array
are, as for the control factors, dependent upon the
number of Noise factors and their levels.
In the example experiment, two 2-level Noise factors are
to be included and thus, an L-4 array is checked.
Nutek, Inc.
Qualitek-4, Automatic Design and Analysis of Taguchi Experiments
Reference Manual
Version: 06.01
Page 31
3. Describe Noise Factors and Levels
The descriptions of Noise Factors and their Levels are entered just the same way as the Control Factors and
their Levels. This screen has all the same features as the Inner Array Design screen.
To enter a factor or level description, click the appropriate box and type the description. Be sure to use the
command buttons to set the column for Interaction or to set it as Unused. When all rows (which are columns with
respect to the orthogonal array) are described, click OK to proceed to the Outer array screen.
4. Complete Outer Array design
While at Outer Array screen, if any column modifications are needed, do so and click OK to proceed to the file
update screen. Click OK for update and OK again to confirm that the file will be revised. QT4 will now return to
the main screen displaying the experiment configuration with the Outer Array.
Nutek, Inc.
Qualitek-4, Automatic Design and Analysis of Taguchi Experiments
Reference Manual
Version: 06.01
Page 32
Automatic design
1. Select menu item
In the Automatic design option, both the Inner Array and the Outer Array design are accomplished at the same
time. When you are ready to design your experiment, select the Automatic design option from the main screen
DESIGN menu. You need not close the current design displayed as it will be closed as you proceed.
2. Select Design Options
The parameters for experiment
design are set in this screen. The
example design (BRACKET1), used
earlier, there are four 2-level factors,
one Interaction, and two 2-level
Noise factors. To set the numbers,
first click on the box left of the
description, then click on the up or
down arrow to adjust the number.
Since in Automatic design the
complete experiment, starting with
the Inner array design, is
accomplished, screens that are
applicable for the Outer array
portion are shown here. For Inner
array design refer to the section
described earlier.
Nutek, Inc.
Qualitek-4, Automatic Design and Analysis of Taguchi Experiments
Reference Manual
Version: 06.01
Page 33
3. Describe Noise
Factors and Levels
This screen will come
after control factors are
described. Click on the
appropriate space and
enter the description.
Click OK when finished.
QT4 automatically
selects the smallest Outer
array you need for the
design and proceed to
display the descriptions
of both Inner and Outer
Arrays. Follow the
screen prompt and
proceed.
4. Complete Automatic Design Process
Once the descriptions of factors and levels are entered, QT4 puts you back on the same set of screens that are
used for the Manual design. Screens and action required to complete the design is the same as those shown
under Manual Design earlier and should be referred when necessary.
After the Inner array design screen, QT4 will display the Outer design screens for your review, and when finished, you will
have option to save the data under a file of your choice. The subsequent screens are the same as those shown in the
previous section.
Nutek, Inc.
Qualitek-4, Automatic Design and Analysis of Taguchi Experiments
Reference Manual
Version: 06.01
Page 34
Description of Trial and Noise Conditions
After the experiment is designed, the trial condition can be described using the Factors and the array. The term TRIAL
CONDITION is used to the combinations of control factor levels which are the prescriptions for different test conditions
necessary to accomplish the experiment (all trial conditions). The term NOISE CONDITION, on the other hand refers to the
combinations of the Noise factor levels which created the condition to which the trial conditions are exposed to. In the
example experiment an L-8 is used for the Inner array and an L-4 is used for the Outer array. Thus there will be eight Trial
conditions and four Noise conditions. Experimenter should combine the Trial conditions and the Noise conditions as per
the combinations required by the Outer array.
1. Select menu item
From the main screen
REVIEW menu, select
Trial Conditions or Noise
Conditions as desired.
1. Review and Print Conditions
While in Trial Condition screen, click
Next Trial to display the next condition.
Click Print button if you want to print one
or all the conditions.
The Randomly selected number indicates
the order in which experimenter should
conduct the experiment when possible.
Click Cancel button when finished
reviewing the conditions.
Repeat the same steps for Noise
Conditions starting with the REVIEW
menu option.
Nutek, Inc.
Qualitek-4, Automatic Design and Analysis of Taguchi Experiments
Reference Manual
Version: 06.01
Page 35
(c) Experiments with Dynamic Characteristics
Just as Outer arrays are used to formally incorporate the Noise factors, effect of Signal and Noise factors applicable to a
Dynamic System is included in the experiment by this special design. There is no orthogonal array used for the outer array.
Instead the levels of the Signal and the Noise factors are combined to form all the possible combinations are described.
While conducting the experiment, each trial condition is exposed to these combinations of the Signal and the noise factors.
The Dynamic Characteristic can be added to the experiment only after the inner array is designed first. Before proceeding
to design the outer array, make sure that your Inner array is designed and that the desired experiment file is opened. If the
file is not already opened, open the desired file by selecting the FILE menu from the main screen (Experiment
Configuration). To describe the Dynamic Characteristic (DC) design capabilities, the experiment DC-AS400.Q4W will be
used. If you wish to redesign the DC for an existing experiment, you can work with a copy of the experiment file and
proceed to redesign by first removing the existing DC design. To remove current DC, click on the EDIT menu item and
select Remove Dynamic Characteristic option.
1. Select Menu Option
From the main screen DESIGN menu, select manual design then click on Dynamic Characteristic.
Nutek, Inc.
Qualitek-4, Automatic Design and Analysis of Taguchi Experiments
Reference Manual
Version: 06.01
Page 36
If you are working with an existing file which has results, QT4 will prompt you about the fact that the results will be erased.
Click OK to proceed if you get this message. If you chose to keep the results, its size will be adjusted to suit the new DC
design you are about to define.
2. Review P-diagram (before input)
The dynamic system function is schematically displayed in this screen. The control factors, which are already
designed as part of the Inner Array, are only known parameters at this point. The factors which will be necessary are
Signal factor (1 to 12 levels) and the Noise factor (2 to 10 levels). In addition, there are five system parameter
descriptions such as Customer Intent, Symptoms, Perceived Results, etc. will have to be furnished in order to complete
the system definition.
Double click on the box/text for Signal to describe the Signal and Noise factors and levels. Once you complete the
description, you will return to this screen. Now proceed and describe the five system parameters by double clicking on
the box for Dynamic System or any of the five locations.
Nutek, Inc.
Qualitek-4, Automatic Design and Analysis of Taguchi Experiments
Reference Manual
Version: 06.01
Page 37
3. Specify Number of Signal and Noise Factor Levels
QT4 allows you to incorporate one Signal factor which may have up to 12 levels (or 12 signals at one level each at
1 level) and one Noise factor with up to 10 levels (or 10 separate noise factors). The number of levels of the Signal
and the Noise factors, along with the number of repetitions in each of the Signal & Noise factor
Before any system information
combination(called a CELL), determines the size of the experiment.
QT4 requires that each trial condition will have equal number of Cells. The number of cell equals the number of
Signal levels x number of Noise levels. The total number of samples/results, however, is number of Cell x number
of samples in each Cell.
Click the up or down arrow for each box to adjust the levels you desire. Click OK to proceed to describe the
factors.
Note:
How can you include multiple Signal factors?
Suppose you have 3 Signal factors at two levels. Treat them like 3 x 2 = 6 levels of Signal factor. While describing the levels
of the Signal factor, keep note and describe the levels to reflect your description.
You can treat multiple Noise factors in the same manner.
Cell represents a unique condition defined by combining Signal and Noise levels. There must be at least one sample tested
in each cell. Depending on the levels of the Signal and Noise, the number of samples per Cell could be very large. QT4 is
limited to 120 samples per trial condition. Which means that?
# Signal levels x # Noise levels x # samples/Cell = 120
Thus if # Signal levels = 3 and # Noise levels = 2, the number of samples per Cell could be as high as 120/(3x2) = 20.
Size of Experiment Calculation
In the example considered, total number of samples required is 3 x 2 x 2 x 8 Trials = 96.
Nutek, Inc.
Qualitek-4, Automatic Design and Analysis of Taguchi Experiments
Reference Manual
Version: 06.01
Page 38
4. Describe Signal and Noise factors
Use the mouse to click on the box for description and type in the description of the Signal factor with alphabetic
or numeric characters. Enter the numeric values of the Signal factor levels. The levels of the Signal factor MUST
BE in terms of numeric quantities in the ascending order of magnitudes.
Similarly, key-in the description of the Noise factor. Unlike the Signal levels, the Noise levels may be described
using alphabetic and numeric terms. They need not be numeric quantities.
In case the number of levels of the Signal or Noise factors is larger than what the screen can accommodate, like other
screens, a scroll bar will appear below the level description box. Scroll it to the right and complete descriptions of all levels
before exiting the screen.
Nutek, Inc.
Qualitek-4, Automatic Design and Analysis of Taguchi Experiments
Reference Manual
Version: 06.01
Page 39
5. Indicate Response
Equation Type
Depending of the nature of
the dynamic behavior of the
system, the response
equation can be best
described on of the three
types of straight line
equations. Prior knowledge or
an assumption as to which
one is most likely behavior is
needed for the purposes of
analysis of results. Click the
item that best suits your
system, then click OK to
proceed.
When you are done with describing Signal and noise factors, QT4 will return you to the P-diagram. Double click on
Dynamic System to enter descriptions of the system. When available, clearly describe Symptom, Response, etc. for the
Dynamic System under investigation.
6. Define System
Parameters
Symptom - It is the reason for
the experimental study.
Things that are causes for
concern about the system
performance.
Response - It is what the
result/performance will be
judged by.
Customer Intent - This is
what customer does to obtain
the desired results.
Customer Perceived Results
- It is what the customer sees
as the effect of improvement.
System Description - A word
or two description of the
system function.
Nutek, Inc.
Qualitek-4, Automatic Design and Analysis of Taguchi Experiments
Reference Manual
Version: 06.01
Page 40
Description of Signal and Noise Conditions
After experiment is designed, the combination of the Signal and the Noise levels to which the trial conditions are to be
exposed can be described using REVIEW menu option from the main screen. These conditions are different from the
description of the TRIAL CONDITIONS which are the combinations of control factor levels. The term NOISE
CONDITION, on the other hand refers to the combinations of the Noise factor levels in case of OUTER ARRAY design,
which represent the conditions under which the experiments are carried out. In the example experiment with Dynamic
Characteristic, an L-8 is used for the Inner array and the three levels of Signal and the two levels of Noise creates six
separate combinations(CELL). Since there are two samples tested in each cell, for each trial condition, two samples are
exposed to each of the Signal and Noise combinations.
To review the Signal/Noise combination for experiment, click on the REVIEW menu item from the main screen and select
Dynamic Characteristic. Review and Print descriptions using the screen buttons as desired. Note that the descriptions
shown are applicable to all Trial conditions for the experiment.
Nutek, Inc.
Qualitek-4, Automatic Design and Analysis of Taguchi Experiments
Reference Manual
Version: 06.01
Page 41
Chapter 7
Editing Factors, Arrays and Results
Corrections and modifications of experiment design parameters can be done online, that is while entering descriptions or
results, and also after input is complete. The EDIT option from the main screen allows modifications of the Factors, Levels,
Arrays, Results, etc. already entered earlier or belonging to an existing experiment. To edit information, OPEN the
experiment file desired unless you are already working with the file and it is currently being displayed in the main screen.
In addition to editing factors and arrays, you will use this menu option also to REMOVE OUTER ARRAY from your
experiment when you need to do so. To totally exclude the Noise factors from your experiment, simply select the option
from the EDIT menu. This action removes the Outer Array and your experiment is displayed without it. BE SURE TO SAVE
YOUR EXPERIMENT FILE IF YOU WISH TO RETAIN THIS EXPERIMENT DESIGN.
1. Select Menu Option
From the main screen, select the EDIT menu and click on the item desired for editing.
Nutek, Inc.
Qualitek-4, Automatic Design and Analysis of Taguchi Experiments
Reference Manual
Version: 06.01
Page 42
2. Modify Array
Once the item you want to modify is displayed, click on the
item and retype the description. Click OK when finished. In
the similar manner you can edit Control factors, Outer array,
Noise factors, and Dynamic Characteristic involved in your
experiment. Each item has to be selected, on e at a time from
the EDIT menu, and modified.
2. Update File
Once you modify one or more data, QT4 allows you
the option to save the file in the same name (update
file) or save it under a different name. By default
QT4 always displays the existing file name. Just
click OK if you are simply updating the file.
The Save File screen always assumes that you will
keep the same file name and update the existing file.
If you want not to disturb the existing file and save
changes under a new file name, then you type in the
new file name (only the first 8 characters needed). If
you keep the same file name and proceed to update,
QT4 prompts to let you know that the file exits and
that you are proceeding to overwrite. Click on YES
button to proceed.
You can also direct the path for your file as you
would in any Windows program. Click on the
Directory and Drive to select the path and directory
for the file you are saving.
Nutek, Inc.
Qualitek-4, Automatic Design and Analysis of Taguchi Experiments
Reference Manual
Version: 06.01
Page 43
Chapter 8
Direct Input and Preparation of Results
In Design of Experiments (DOE) the term RESULT has special meaning. For the first part, as usual, results are numerical
data representing the performance of the product/process under investigation for a specific test sample. To be noted also
that results are only intermediate input to the DOE application process and not to be confused with the results of analysis
or the whole process. So what is obtained from analysis of the designed experiments? Of course these are CONCLUSIONS
and PREDICTIONS made from the analysis.
For the second part, results could reflect combined evaluations of several objectives. In this case result is a single number
without any units which is a single quantity obtained by combining several numbers representing evaluations from
multiple objectives/criteria. If your experiment requires evaluation of the performance under more than one criteria of
evaluation, you need to prepare the results by combining multiple evaluations into an Overall Evaluation Criteria(OEC). No
matter the number of criteria of evaluation criteria, you will always have one OEC for one sample. Thus the OEC ‘s for the
sample will constitute the results and should be used for analysis.
Direct Input of Results (Evaluation from Single Objective)
In case of single objective or when you wish to perform analysis using one evaluation at a time, you will enter the data
directly in the result column. This is expected to be the case for most of your experiments. The number of columns of
results, as always, will depend on the number of samples tested for each trial condition.
1. Select Menu
Option
Open the file you want to
work with and then select
Enter Results from the
RESULT menu from the
main screen.
As you proceed QT4 erases
all existing results, if any, in
the file. Should you want to
preserve the existing file, at
end of result entry you will
have a chance to save the
file under a different name.
Nutek, Inc.
Qualitek-4, Automatic Design and Analysis of Taguchi Experiments
Reference Manual
Version: 06.01
Page 44
2. Enter Results and Update File
QT4 requires your experimental results to be equal in number for all trial condition. In other words you will
always have full columns of results. It is a good idea, therefore, to key in results one column, starting with the
first column, at a time. Your data range is between - 99,999 to 999,999. Zero is a valid entry and your results could
be as small as .0001.
Reset Cell button clears a cell and Reset column will clear the entire column of data. Remember you can only see
what the screen can fit. If your experiment is large, use the scroll bar to enter and view the rest of the results.
Use the Dummy Data button only when you wish a practice run. It can quickly fill the entire range of data (up to
120 columns) by some random numbers within the range you specify. When done entering results click OK to
Save File option. Update the exiting file or under a new name and return to the main screen.
Nutek, Inc.
Qualitek-4, Automatic Design and Analysis of Taguchi Experiments
Reference Manual
Version: 06.01
Page 45
Transform Results
If your results are larger than 99,999 or
smaller than .0001, then you should scale
the results down or up as appropriate. To
transform the results, after entering results,
click on the Transform button and select the
option you desire.
In addition to scaling results up or down,
you may also convert the results in other
coordinate systems.
Omega transformation - is recommended
when your results are in percentages.
Back Omega transform - can be handy
when you want to convert your results in
percentages ranging between 0 and 99.999.
Trigonometric transform - will allow you to
operate your results by Trigonometric
functions.
Integer Values -will round off all your
results leaving only the integer magnitudes.
Scaling Down Results
Results can be scaled down
(or up) simply by clicking
the option desired.
Nutek, Inc.
Qualitek-4, Automatic Design and Analysis of Taguchi Experiments
Reference Manual
Version: 06.01
Page 46
Preparation of Results (Combining Evaluation from multiple objectives)
Background
Preparation of results is a necessary consideration when your experimental results are evaluated using more than one
criterion of evaluations. In this regard the word “Results” take a special meaning in DOE application process. Of course
result is an intermediate input to the whole process. The basic data collected as the experimental results may be better
called as READINGS. Readings represent quantitative data representing evaluation criteria. Each reading however, may be
the average of many OBSERVATIONS of the same evaluation. Results can be a single READING or combination of
multiple READINGS into a single index, as you as the experimenter wants it to be.
Practice of combining multiple criteria of evaluations into a single index is indeed common in academic, sporting and other
competitive events. The grade point average we are so used to using, is nothing but a single quantity representing the
average of all grades. The method of determining the best in the Olympic gymnastic events are determined in a scale of 0 6 by combining scores in several areas of performance like, jumping, style, balance, landing, etc. The scores in each of
these criteria are averaged to calculate the final score.
If academic performance and sporting events can be determined by a single index, why can’t scientific experiments and
engineering projects be evaluated by a simplistic single index? There are good reasons. In the former cases, all evaluations
have the same RANGE (low and high score) of evaluation. All evaluations also have the same units (mostly no units),
same sense of desirability (Quality Characteristic/QC), same units of measurements, and same relative importance
(weighting). This is not the case with scientific experiments. Thus attempts to meaningful combinations of evaluations
from different criteria of evaluations, which most likely have different units of measurements and different importance,
demands proper considerations of physics of the situation.
Why should you consider combining different evaluations into a single index?
When there are multiple objectives, each objective may be evaluated by different criteria of evaluations. Suppose that in
the process of BAKING CAKE, the objectives are TASTE, MOISTNESS, and VOIDS. We can always analyze the results of
the experiments by taking readings (single criteria reading as results) of each criteria separately and determine the best
recipe for the cake. If the best recipe so determined by taking all criteria, one at a time, was the same, then there is no need
to look at all the criteria collectively. But what if they are not? Which recipe then should we go for?
Just because two readings are expressed in numb ers, they may not be added together to produce meaningful results. For
instance, laws of physics will not allow us to combine one quantity expressed in terms of DEGREES FAHRENHEIT with
another quantity expressed in terms of NEWTON METERS. The reason for this is obviously the units of measurement,
which if unequal, addition is not allowed.
In addition to the units, the sense of desirability, that is the Quality Characteristic (QC) must also be of the same kind
before two evaluation can be added together. Consider the case of two sportsmen who are both proficient in the game of
Basketball and Golf. Their average scores are as shown.
Sportsman 1
Basketball
Golf (9 holes)
Totals
Nutek, Inc.
28
Sportsman 2
33
QC
Bigger is better
42
37
Smaller is better
____________________________________
70
70
Qualitek-4, Automatic Design and Analysis of Taguchi Experiments
Reference Manual
Version: 06.01
Page 47
Who is the better player? To answer this question, we will be grossly wrong if we simply compare their total scores. This is
because, even though the two scores have the same unit of measurement, their sum does not produce meaningful numbers
as they have different sense of desirability(or QC) since in the game of Basketball, the higher score is desirable, where as in
the game of Golf, a lower score wins the match.
Measurements involved in engineering and science most often include evaluations which have different units of
measurements and also different QC’s. Combining them into a single index, called an Overall Evaluation Criteria (OEC),
requires some adjustment to formula combining the individual criteria of evaluations. First the readings under individual
evaluations must be NORMALIZED, that is freed from their units (dimensionless). Second, contribution from all reading
must conform to the same QC, either Bigger or Smaller. Third, individual readings must be represented in proportion to the
relative weightings (degree of importance) determined subjectively by the project team consensus. Consider the CAKE
BAKING process and suppose that following were decided in the planning session convened for the experimental study.
Evaluation Criteria Table and OEC
Criteria Des.
(X)
Worst Reading Best Reading
(Xw)
(Xb)
QC
Rel. Weighting
(W t)
Sample Reading
(X)
1. Taste (X1)
0
12
Bigger
55%
9
2. Moistness(X2), grams
25 - 50
40
Nominal
20%
34.9
3. Voids (X3)
8
2
Smaller
25%
5
Overall Evaluation Criteria (OEC)
X1 - X1w/b
OEC = (
X1b - X1w
) x W t1 + ( 1-
X2 - X2w/b
)xW + (1X2b - X2w t2
For the sample data: (example calculation with
X1 =
9
X3 - X3w/b
)x W
X3b - X3wt3
X2
= 34.9
X3 =
5
OEC = ( 9-0)/(12-0) x 55 + ( 1 - (34.19-40)/(40-25) ) x 20 + ( 1 - (5-2)/(8-2) ) x 25 = 41.25 + 12.25 + 12.5
= 66.0
Explanation of OEC equation
The Taste reading is a subjective evaluation and agreed to be a number between 0 to 12, with 12 being the best possible
reading. The QC for this criteria is Bigger is better and since it carries a heavier relative weighting (55%), all other criteria
will be made to conform to this QC.
Nutek, Inc.
Qualitek-4, Automatic Design and Analysis of Taguchi Experiments
Reference Manual
Version: 06.01
Page 48
The individual criteria reading(X) are first subtracted by lowest magnitude of the best or worst readings (Xw/b). This
quantity is then divided by the range of the reading (best - worst) to convert the quantity into a dimensionless number.
The resultant is now multiplied by the relative weighting expressed in percentage which reflects the appropriate importance
carried by these particular criteria.
The second criteria, Moistness measured in grams is such that a fixed volume measures 40 grams in ideal condition, and
the range is expected between 25 and 50 grams. This constitutes a Nominal is the best QC. A nominal reading is equivalent
to smaller is better reading when the nominal value is subtracted from the reading. But in order to add a Smaller is better
reading with one that is Bigger is better, its QC is theoretically changed to bigger is better by subtracting its effect from 1.
Again the whole quantity is multiplied by the relative weighting for the criteria.
The third criteria, Voids, are a count of number of voids ranging between 2 and 8. Since least number of voids is desirable,
this criteria is also handled the same way by converting its influence to Bigger is better QC.
Qualitek-4 can prepare the OEC’s which are considered as the RESULTS for the analysis when you describe the evaluation
criteria table and enter the readings appropriately. To prepare the OEC from the reading under multiple criteria of evaluation
follow these steps.
1. Describe Evaluation Criteria Table
2. Enter Evaluations for each sample under each Trial condition
3. Review OEC and accept (or reject) them as results.
1. Select Menu Option
Open the file you want to work with and then select Multiple Criteria(OEC) from the RESULT menu from the main
screen.
The purpose of creating OEC’s is to have an option to analyze the results using a single index for each of the
sample by combining more than one evaluation criteria. Of course, when analysis is desired using readings under
each individual criteria, the corresponding reading (one criteria readings at a time) can directly be entered as result
using the Enter Result option.
Nutek, Inc.
Qualitek-4, Automatic Design and Analysis of Taguchi Experiments
Reference Manual
Version: 06.01
Page 49
2. Describe Evaluation Criteria (How to enter data)
Before entering any readings (sample evaluations), the criteria of evaluations must be described. To describe
items, click the appropriate space first(use POUND.Q4W as a reference experiment)
a. Describe Criteria. Example: Taste (See Criteria Definition screen in next page)
b. Enter a numeric value under Worst Vlaue. Example: 0 (expected worst reading)
c. Enter a numeric value under Best Value. Example: 12 (expected best reading)
d. Click on QC until desired character appears. (must be consistent with best/worst value)
e. Enter a number between 1 and 99 in column for Rel Wt. The Rel. Wt. for all criteria must==100.
f. Click/Check the column Used to indicate the criteria is included.
g. Repeat steps a - f above to describe the other criteria.
Definitions
Criteria - can be any alphanumeric characters.
Worst Value - This is the worst reading expected/found among all samples tested. It must be numeric (in case of
Nominal QC, it must be the worst deviant from the nominal value. For example, if range of expected readings is 25 50 and the nominal is 40, then worst reading will be 25)
Best Readi ng - It is the best possible numeric reading. In case of Nominal QC, it must be the target/Nominal value.
QC - It is the quality characteristic of the individual criteria of evaluation. Click this space to select the appropriate
characteristic.
Rel. Weighting - It is the relative importance of the criteria in terms of a number between 0 - 100. It represents
percent of importance, but % sign is not to be entered. All relative weighting must add to 100. And, of course, 0
will mean that the criteria are not included in calculating OEC.
Used - You must click this column and make sure X sign appears indicating that the criteria is included. This must
be done before you can enter sample readings.
Once the criteria are described, you may enter readings under different criteria. Click on the appropriate space and
key in data. Click on Trial# box to select the correct trial number.
3. Enter Evaluations (Original readings under each criteria of evaluation)
After the criteria are described, evaluations under each criterion are entered, for one test sample at a time. Each test sample
tested is identified by a trial number and a run number. Each sample then, will have as many evaluations (one readings for
each evaluation criteria) as the number of criteria described and checked (Used column). The numbers 11, 44 and 3 shown
in the screen(next page) represent the Taste reading(11), Moistness reading(44), and Voids (3) reading for the first
sample(Run#1) of Trial 1. As evaluations are entered, the OEC values are calculated and placed in the proper trial# and
run# location.
Qualitek-4 requires that all trial condition have the same number of runs. Therefore, evaluations for all trial and the same
run numbers for all trials must be entered before clicking OK, which makes QT4 accept OEC as results. The QC for the
result now becomes the Quality Characteristic shown for the OEC (as decided by Qualitek-4 based on the relative
weightings of the criteria)
Be sure to SAVE experiment file by selecting Save or Save as from the File menu option.
Nutek, Inc.
Qualitek-4, Automatic Design and Analysis of Taguchi Experiments
Reference Manual
Version: 06.01
Page 50
4. Review OEC Values
Select OEC from the EDIT menu to modify any description or evaluations.
Be sure to SAVE experiment file by selecting Save or Save as from the File menu option.
[This capabilities were under development at the time of publication of this manual.]
OEC SUMMARY
When the product/process is to satisfy more than one objective, performances of samples tested for each trial condition
are evaluated by multiple criteria of evaluations. Such evaluations can be combined into a single quantity, called Overall
Evaluation Criteria (OEC), which is considered as the result for the sample. Each individual criterion may have different
units of measurements, quality characteristic, and relative weighting. In order to combine these different criteria, they must
first be normalized (no units), QC aligned (either Bigger or Smaller), and weighted accordingly.
When multiple objectives are present, as always, results of the experiments can be analyzed by taking evaluations (which
is considered results for analysis) of each criteria, separately. This way a complete analysis can be performed based on
each criteria of evaluation. If all such analyses produce the same optimum design and the same trend of factor influences,
there would be no need for an additional analysis. Should they differ, however, an additional analysis using OEC may
produce some vital statistics reflecting the relative merits (weightings) of the individual criteria of evaluation as determined
by the project team during the planning session.
Nutek, Inc.
Qualitek-4, Automatic Design and Analysis of Taguchi Experiments
Reference Manual
Version: 06.01
Page 51
Evaluation Criteria Table
Criteria description
Worst
Best
Quality
Relative
Sample 1
reading
reading
Characteris
Weighting
Readings
tics
Taste
0
12
Bigger
55 %
11
Moistness
25
45
Nominal
30 %
44
Number of Voids
8
Smaller
15 %
3
2
O E C = > 91.41
Overall Evaluation Criteria(OEC)
Example: Test Sample for Trial 1, Run 1
Before combining readings of all criteria, each reading is made dimensionless by dividing by a reference number,
which is the difference of the Worst and the Best reading. To avoid complication due to SIGN changes, absolute
values are used. To make logical meaning out of adding two numbers, their QC’s must also be of the same kind. Both
Smaller and Nominal(which becomes Smaller when deviation from the nominal is used) QC’s are transformed to act like
Bigger QC by subtracting the fraction contribution from 1. Each criteria contribution are then multiplied by their
respective relative weighting to for the OEC. Since all criteria have been made to behave like the Bigger QC, the QC for
OEC is now Bigger is better. The decision about whether the OEC is made to have Bigger or Smaller QC depends on
the cumulative percentages of all criteria with Bigger QC(over 50 or not).
(OEC)11
| 11 - 0 |
| 44 - 45 |
|3 - 2|
= ( ----------------- ) x 55 + ( 1 - ------------ ) x 30 + (1 - -------------- ) x 15
| 12 - 0 |
| 45 - 25 |
|8 - 2|
= (11/12) x 55 + ( 1 - 1/20 ) x 30 + ( 1 - 1/6 ) x 15
= 50.41 + 28.5 + 12.5
= 91.41
Likewise OEC for all runs in all trials are calculated. The Quality Characteristic(QC) for OEC is Bigger is better as all
criteria have been switched to align their QC to match that of the Taste. This is done by (1 - fraction contribution), etc.
Note that there can be only one OEC (or RESULT) for a single sample and that the OEC calculated for each sample
becomes the sample RESULT, which are then be used to carry out the analysis and to determine the optimum
condition.
Nutek, Inc.
Qualitek-4, Automatic Design and Analysis of Taguchi Experiments
Reference Manual
Version: 06.01
Page 52
Exporting and Importing Results
Results of your experiments can be exported for use by other analysis software. Results also can be imported saving
manual entry. This would particularly be helpful when your array is large and the number of samples per trial is also large.
For exchanging results with another statistical analysis program or simulation model, the data format has been kept to
basic text format. The result file can be created using DOS EDIT or made using and word processor program then saving
them as text file. In either case, the file format must be strictly followed. The result file must be named with an extension
.RES. In other words, for PISTON.Q4W file, the result file will be PISTON.RES. The exact format of the file can be seen by
reviewing any .RES file in your directory or by exporting PISTON.Q4W file which will create a PISTON.RES file
automatically.
1. Select Menu Option
Open the file you want to work with and then select Export Results from the RESULT menu from the main screen.
If you are importing results for the first time or you want to learn how to export results, you will find it beneficial to
practice exporting results with PISTON. Experiment file. Open PISTON file and proceed.
Nutek, Inc.
Qualitek-4, Automatic Design and Analysis of Taguchi Experiments
Reference Manual
Version: 06.01
Page 53
2. Save Result File
The export file will be automatically named
same as the experiment file of origin of the
result with extension .RES. You will have the
option to name differently if you want. You may
also direct it to any directory and path of your
choice.
The file saved will contain the results of the
experiments with some instructions about the
format which can be deleted or expanded as
desired.
The file format shown below or how the export
file appears must be maintained for the results
file to be imported. The results from an
experiment with L-8 array and three samples per
trial will appear as the one shown below.
PISTON.RES (File format/content)
REM - This is a file of the results of PISTON.RES
REM - The number of results on each line is determined by NR
REM - but, the amount that can fit on a line in a text file
REM - is dependent on the text editor your using (usually 1022 characters)
REM - All files of this type must be in this format. There can be as many
REM - of these REM lines as desired with no blank lines in between. Then,
REM - there must be one blank line after the REM lines. The next line must
REM - be the NE value. The next line must be the NR value. Then each
REM - subsequent line must be each subsequent row of the result array with
REM - the values separated only by a comma.
8
3
45,56,64
34,45,53
67,65,60
45,56,64
87,81,69
78,73,68
45,56,52
42,54,47
Nutek, Inc.
Qualitek-4, Automatic Design and Analysis of Taguchi Experiments
Reference Manual
Version: 06.01
Page 54
Importing Results File
Open the file you want to work with and then select
Import Results from the RESULT menu from the main
screen.
From the file selection screen, look for the .RES file
you want to import. The file you want to imp ort need
not be named same as the file name of your
experiment. It can have any name as long as it has the
extension .RES and contains results in the required
format. If you do not see the file in the display
window, be sure to adjust the Type of File and select
the file. If your file is stored in another directory or
drive, change the path accordingly.
If your experiment file happen to have results already,
but you wish to overwrite or discard this results, you
may do so by selecting Enter Results first and then
CANCEL option. This will remove the old results and
ready you for importing the result file.
Before creating result file for import, review any
existing ____.RES file or examine it by first creating a
result file by exporting results from PISTON.Q4W file.
Transferring Results by Direct COPY and PASTE Method
To transfer results from spreadsheet or word
processing, or text editor programs, follow
the Transfer Results option from the Results
menu in the Main Screen. You may find this
option convenient when your experiment
and/or the number of samples in each trial
condition is large.
When you select this method of importing
results, you will see the screen shown next.
Nutek, Inc.
Qualitek-4, Automatic Design and Analysis of Taguchi Experiments
Reference Manual
Version: 06.01
Page 55
You can COPY and PASTE your results in a spreadsheet or word processing document. Make sure that the row and
columns of your results matches the need for your experiments. That means that the number of rows of results must
equal the number of trial conditions and the number of columns be within 120.
For practice, you may create DUMMY data with any number of columns (<120). A set of DUMMY DATA with 5
columns is shown below. When you are satisfied with the results in the grid, click Proceed –Edit and Save Data
button.
The data you accepted
will be shown in the next
screen for your review.
You will now be able to
edit or modify these
results using the options
in this screen.
Nutek, Inc.
Qualitek-4, Automatic Design and Analysis of Taguchi Experiments
Reference Manual
Version: 06.01
Page 56
Chapter 9
Analysis of Results
When all the trial conditions are tested and the results are entered into the experiment file, analysis of the
results can now be performed. QT4 allows you to analyze the results in two ways: Standard Analysis is
always performed when there is only one sample tested for each trial condition. In case of multiple samples
per trial, Signal to Noise ratio (S/N) analysis is strongly recommended, but Standard analysis can be
performed if desired. To demonstrate all major steps in analysis, the BRACKET example created earlier
with one sample per trial will be considered.
Standard Analysis
1. Select Menu Option
Open the file you desire to work
on. From the main screen, select
Standard Analysis from the
ANALYSIS menu option. If
there were multiple columns of
results, which will be the case
when multiple samples for each
trial were tested, you should
analyze the results S/N ratios
for each trial results.
Nutek, Inc.
Qualitek-4, Automatic Design and Analysis of Taguchi Experiments
Reference Manual
Version: 06.01
Page 57
2. Select Quality
Characteristic for Analysis
Whether you wish to perform
Standard or S/N analysis, you have
the option to pursue the same with
one of the three Quality
Characteristics (QC). Although
your experiment most likely will
have a fixed QC, you may select
one QC at a time and perform
analysis. The QC for your
experiment and the one selected for
the previous analysis are shown
just above the QC selection box.
Check one of the three QC and click
OK to proceed.
3. Review Results
This screen allows you to
examine the results. If the
size of the array is larger
than the display area, be
sure to click the scroll
keys to review all rows
and columns of results.
The numbers under the
BLUE shaded area lists
the trial averages. In case
of S/N analysis these
numbers are the S/N
ratios for each trial
condition. Click on the
GRAPH button to display
graph of the results. Click
OK when done.
Nutek, Inc.
Qualitek-4, Automatic Design and Analysis of Taguchi Experiments
Reference Manual
Version: 06.01
Page 58
4. View Results Graph
Bar graph of the trial results displays the variations of results within and
between trial conditions. Click RETURN when done.
4.View Results Graph
Bar graphs of the results
captures the variation of the
same within and between trials.
In the example case, since there
is only one result for each trial,
the bars graph as solid bars. In
case of multiple sample results,
the variations within the trials
are shaded. Click RETURN
when finished with review.
Nutek, Inc.
Qualitek-4, Automatic Design and Analysis of Taguchi Experiments
Reference Manual
Version: 06.01
Page 59
5. Study Factor Influences and Interactions
The averages of the trial results are used to calculate the average effects of factor at each of its levels. The
difference between average effects and level 1 and level 2 are also shown as most common experiments involve 2level factors.
Click on the PLOT button to review graphs of individual factor influence. Click on the INTERACTION button to
study interaction between any two factors.
You can view factor influence graph one factor at a time. Click the buttons at the bottom of that graph to view other factor
graphs. The calculated values of the average effects used for the plot are shown on right. Click RETURN to go back to the
Main Effect screen.
Nutek, Inc.
Qualitek-4, Automatic Design and Analysis of Taguchi Experiments
Reference Manual
Version: 06.01
Page 60
When you click th interaction button, QT4 allows the option to view interaction between selected pair of factors or let it
calculate all possible interactions for your review. Click on MANUAL if you want to view interaction between any two
factors, then double click on the factors. If you want QT4 to calculate all possible interactions, select AUTO.
In AUTO option, QT4 calculates n(n-1)/2 interactions for n number of factors in the experiment. Thus if there were 15
factors, 15x(15-1)/2 = 105 interactions are calculated. In the current example there are only 4 factors which give rise to 6
interactions.
To rank the strength of these interactions in descending order, a quantity called SEVERITY INDEX (S.I) is calculated. The
values of S.I. range between 0 - 100% corresponding to the angle between the interaction lines of 0 - 90 degrees.
To examine an interaction, double click the Interaction Factor descriptions. Click on the S.I. button if you want to examine
the interaction pairs and their ranking.
Nutek, Inc.
Qualitek-4, Automatic Design and Analysis of Taguchi Experiments
Reference Manual
Version: 06.01
Page 61
S.I graph shows the ranking of
interactions based on their
strength of presence.
How can you make use of the
S.I. graph and its ranking?
For most part this information is
useful in your subsequent
experiments, if you decide to
peruse any. The top ranking
interactions are the ones to be
included for your follow up
experiment. Even if an
interaction is strongly present,
it is not an indication of whether
it is significant or not, which
can only be determined from
ANOVA. But ANOVA allows
test for significance only when
a column is reserved for the
interaction which is not the case
for most interactions considered
in the S.I. graph.
How would you decide whether
you need to run follow up
experiments? Use the
confirmation test results and
how close to estimated
performance it is, as the
indicator. If you do not confirm,
there is a good possibility that
the interaction studies will yield
better results. Which interaction
should you include in the future
experiments? Use the S.I.
information to develop your
new experimental study.
If you happen to find an interaction which is already included in your experiment, is significant (in ANOVA), then the
review of the interaction plot is important. The factor levels most desirable to incorporate the interaction effect into the
prediction of the Optimum condition and the performance, are determined from this graph. If QC is Bigger is better, the
desirable level is obtained by the levels represented by the highest pint in the graph. The opposite is true if the QC were
Smaller is better.
Nutek, Inc.
Qualitek-4, Automatic Design and Analysis of Taguchi Experiments
Reference Manual
Version: 06.01
Page 62
At the conclusion of interaction plot review, click return to get back to the Main effect screen, and click OK in that screen
to proceed to ANOVA screen.
6. Study ANOVA and Pool Factors
The averages of the trial results are used to calculate the average effects of factor at each of its levels. The
difference between average effects and level 1 and level 2 are also shown as most coomon experiments involve
mostly 2-level factors.
Click on the PLOT button to review graphs of individual factor influence. Click on the INTERACTION button to
study interaction between any two factors.
What to do when you are in ANOVA?
Pool Factors
View Bar Graph
Observe Pie Diagram
Discarding column effects that are
insignificant is called POOLING.
You can pool single column at a
time by clicking on POOL button.
Click on the Auto Pool factor
button if you want to pool all
effects below a desired
Confidence Level.
Generally after Pooling, you may
want to examine the Bar Graph of
the relative influence of the
factor and interaction to the
variation of results. Click on the
Bar Graph button to view the
graph. Click return when done.
Pie diagram is an alternate
display of the same effect
shown in the bar graph.. Click
on the Pie Diagram button to
view the diagram. Click Retrun
when done..
Nutek, Inc.
Qualitek-4, Automatic Design and Analysis of Taguchi Experiments
Reference Manual
Version: 06.01
Page 63
To Pool a column item, double click the description. The screen displays the confidence level the factor or column has.
Click OK if you wish to Pool it. The decision of whether to pool should be based on the Confidence level desired. The level
of confidence one wants can be arbitrary. It is recommended that you always work with a fixed Confidence level (C.L) for
the experiment, say 80%, 90% or 95%. Whether a factor/Interaction is significant or not depends on whether it has the
confidence level you desire. But the calculation of C.L a column has, or the test of significance can only be done when the
Degrees of Freedom (DOF) of the error term(the last line in ANOVA table) is non-zero. So when the error DOF is zero or
small, the C.L may not be calculated and you may decide to pool the factor arbitrarily. Obviously, you should start pooling
with the weakest column when available. How long should you pool? Continue to pool factors/Interactions as long as they
are insignificant and the error DOF is closer to half the total DOF of the experiment.
When it is not possible to
calculate the C.L., QT4 prompts
you and gives you option to pool
or not pool.
In case you want QT4 to pool all
factors that do not meet the
minimum C.L., you will be asked
about the minimum C.L. you
desire. Enter a number between 0
and 99.99 and click OK. QT4
readily pools all factors which fail
to meet the desired C.L and
displays the revised NOVA.
Nutek, Inc.
Qualitek-4, Automatic Design and Analysis of Taguchi Experiments
Reference Manual
Version: 06.01
Page 64
Color coding of the Pie Diagram
indicates the area proportional to
the influence of the column to the
variation of the results.
When there is large number of
factors involved, a limited number
of column effects are shown at a
time. Click the scroll button to
move column above and below the
column numbers on the display.
When at the ANOVA screen, click
OK to proceed to the Optimum
screen.
Nutek, Inc.
Qualitek-4, Automatic Design and Analysis of Taguchi Experiments
Reference Manual
Version: 06.01
Page 65
7. Determine Optimum Condition and Estimate Performance
The optimum screen displays the Optimum condition and the performance at the Optimum condition. The
performance calculated is only an estimate as it is based on a linear function of the individual column contributions.
The Optimum condition and the prediction of performance is always based on the significant factors only as the
estimate produced this way is the most conservative.
The most common activities in this screen are to calculate the Confidence Interval (C.I.) and review of the stacked
Graph. For some experiment, estimation of the performance at any arbitrary factor level might of interest.
Click on the C.I. button when you want to calculate the confidence interval. The C.I. is calculated for a given C.L. and only
when the error DOF is non-zero. Thus if the error DOF is zero or too small, QT4 cannot calculate the C.I .
The C.I. is a number in the same units of measurement as the performance and it represent the accepted variation of the
mean performance from a population tested at the Optimum condition. Thus the C.I. in comb ination with the estimate of
performance forms the yardstick for confirmation of the prediction based on the experimental results.
C.I . Computation Routine
Calculation of C.I. requires the use of F-ratios. Most common books contain several tables of F-ratios. Instead of
referring to a fixed set of lookup table, QT4 utilizes the original equation for the F-ratios. Unfortunately the
expression for the F-ratio in terms of C.L, factor DOF and the error DOF, etc. is quite complex requiring iterative
solution. Furthermore, unlike the manual method where F-ratio is selected from the table for a given C.L, the
expression is directly solvable for C.L given a F-ratio and not vice versa. Therefore, the solution QT4 determines is
most close to the C.L. desired and may not exactly match the text book values.
Nutek, Inc.
Qualitek-4, Automatic Design and Analysis of Taguchi Experiments
Reference Manual
Version: 06.01
Page 66
C.L for calculation of C.I.
If C.I. is not calculated even though the
error DOF>0, then lower the C.L.
Calculated C.I.
Units of C.I are the same as that of the
optimum performance.
.
The Bar Graph of the factor
contributions show the
additional effect of individual
factor and interaction which are
added to the average
performance to produce the
estimated performance at the
optimum condition (Yopt).
Nutek, Inc.
Qualitek-4, Automatic Design and Analysis of Taguchi Experiments
Reference Manual
Version: 06.01
Page 67
Estimate Performance at Any Arbitrary Condition
Although optimum condition yields the best performance, there are situations when setting the optimum level is not
immediately possible because of cost or other difficulties. By clicking on the ESTIMATE button you will be able to
calculate the performance at any levels of the factors. Note that QT4 sets the interaction levels automatically based
on the levels of the interacting factors: If the levels of both factors are either 1 or 2 (A1B1 or A2B2), the level of the
interaction AxB will be at 1. On the other hand if levels of the factors are different, the level of the interaction will be
at 2 (AxB at level 2).
To estimate performance, click on the level number and enter the level number desired. Notice that as the level
number is entered the level description and the performance values are instantaneously adjusted.
When done with estimation, click OK to return to Optimum screen. At optimum screen click OK to return to the main
screen. Now that the analysis is completed, you may enter into report option and print reports of the key analysis steps,
cost savings and variation reduction reports.
Nutek, Inc.
Qualitek-4, Automatic Design and Analysis of Taguchi Experiments
Reference Manual
Version: 06.01
Page 68
Analysis of Multiple Sample Results (S/N ratios)
When your experiments include multiple samples per trial condition, analysis using S/N ratios of the results is strongly
recommended. This would be the case when there is an outer array or otherwise there are multiple samples per trial
condition. In this analysis approach, S/N ratios of the trial results are used for analysis instead of the average of trial
results in the Standard Analysis. All calculations for Main effect, ANOVA and Optimum condition are carried out with S/N
ratios. You must remember to transform the Optimum performance back to the original units of result when interpreting the
improvement or predicting expected performance.
1. Select menu Option
Open the experiment file you
desire and be in the main
screen. Select S/N Analysis
from the ANALYSIS menu
option. Experiment file
PISTON1.Q4W is selected
for discussion of S/N
analysis.
2. Pick Quality Characteristic for
Analysis
Depending on the performance objectives of
your project, your experiment will have one of
the three Quality Characteristic(QC). For
analysis purposes, however, you can select
any one that you like and carry out the same
three different ways. The experiment QC and
the QC selected in the previous analysis are
also shown in the screen.
Suppose that analysis using Nominal QC is
desired. Check Nominal QC and click OK to
proceed.
Nutek, Inc.
Qualitek-4, Automatic Design and Analysis of Taguchi Experiments
Reference Manual
Version: 06.01
Page 69
3 select S/N Type
There are several expressions of S/N
ratios for the static systems, which
are common kinds of experiments.
The most popular among them is the
one based on the MSD.
Check the expression you desire if
different from the default MSD
expression. Click OK to proceed.
4. Enter Target Value
When Nominal QC is the choice for
analysis, QT4 requires you to supply
the nominal (same as Target) value of
the performance.
Type in the target value and click OK
to proceed.
Nutek, Inc.
Qualitek-4, Automatic Design and Analysis of Taguchi Experiments
Reference Manual
Version: 06.01
Page 70
5. Review Results
and S/N
S/N ratios of the
results of individual
trial conditions are
shown on the right,
with the number of
results in each trial.
Click OK to proceed
for Main Effect
calculations.
6. Review Main Effect and Interaction Plots
In the analysis using S/N, all calculations involved in the analysis is performed using the column of S/N values (the
original results are not used). Therefore, the factor average effects shown in the screen are all in S/N ratios.
Remember all S/N values are not always negative, as shown in this example; it depends on the magnitude of the
results and the QC used for the analysis.
For discussions about how to review the Main Effect graphs and the Interaction plots, refer to the earlier section on
analysis of simple experiments. Click OK to proceed to ANOVA.
Nutek, Inc.
Qualitek-4, Automatic Design and Analysis of Taguchi Experiments
Reference Manual
Version: 06.01
Page 71
8. Review ANOVA and Pool Insignificant Factor and Interaction Effects
-
Like Main Effects, ANOVA numbers are also in the transformed state, except the last column which is always
expressed in terms of percent influence to the variation of the results. Pool factor one at a time or several at a time
using the Auto Pool button.
For detailed procedure refer to the previous section. Click OK to proceed to Optimum screen.
9. Establish Optimum condition and Estimate Performance
As with the Main Effect and ANOVA, the factor contributions and the expected performance are also expressed
in S/N ratios. The Optimum factor levels and their descriptions are shown in the table. Click on the transform
button to convert the performance value from S/N to the original units of the results.
Nutek, Inc.
Qualitek-4, Automatic Design and Analysis of Taguchi Experiments
Reference Manual
Version: 06.01
Page 72
10. Transform Expected S/N
into Result Units
Conversion of S/N into expected
results can be only an approximation.
The method of transformation is
different for different Quality
Characteristic as is the definition of
MSD.
In the example shown, the expected
performance in terms of S/N is
-14.17. Since the nominal value is 45
(QC = Nominal is the best), the
expected performance in the
measured units of result becomes
45.0 +/- 5.11. This transformation is
important since most people will
relate to this number and the
confirmation test results can be
compared with this value.
Click OK when done with this screen.
While at the Optimum screen, click
OK button to return to the main
screen.
Nutek, Inc.
Qualitek-4, Automatic Design and Analysis of Taguchi Experiments
Reference Manual
Version: 06.01
Page 73
Analysis using Dynamic Characteristic
Analysis of results from a dynamic system requires the use of Dynamic Characteristic. This is a special form of Nominal is
the Best Quality Characteristic. The option to select Dynamic Characteristic (DC) will only be available when the
experiment design is created using DC and the results are collected by conducting the test prescribed. However, QT4 will
allow you to perform S/N analysis if for some reason you wish to carry out such analysis.
1. Select Menu Option
Open the file of your choice. Example experiment DC-AS400.Q4W will be used following descriptions. From the
main screen, click on the ANALYSIS menu and select Dynamic Characteristic option.
Nutek, Inc.
Qualitek-4, Automatic Design and Analysis of Taguchi Experiments
Reference Manual
Version: 06.01
Page 74
2. Review P-Diagram for the Dynamic System
The Process Diagram(P-Diagram) for the system graphically displays the system function with
components of Signal and the Response. The Symptoms, the Customer Intent and the corresponding
Perceived Responses are also identified. This screen only allows review of the descriptions. Should you
wish to edit any item displayed or the results which would be analyzed as you proceed, return to the main
screen and select EDIT menu options.
Click OK to proceed to the Trial ANOVA screen.
Nutek, Inc.
Qualitek-4, Automatic Design and Analysis of Taguchi Experiments
Reference Manual
Version: 06.01
Page 75
3. Review Trial ANOVA for the Dynamic System
Similar to the S/N analysis, Dynamic Characteristic also generates S/N for individual Trial results, but the procedure
for calculation differs. In this case the components which produce ANOVA may be of interest to better
understanding of the system. Thus, the individual component values are displayed in this special ANOVA table.
The notations used are what commonly used in the popular texts on the subject (see references).
The quantities in the right most columns represent the S/N ratios for the trials and are used for analysis purposes
just as done for the Analysis using S/N ratios in the previous section. Click OK to proceed to the screen where the
results and the calculated trial S/N are shown.
Nutek, Inc.
Qualitek-4, Automatic Design and Analysis of Taguchi Experiments
Reference Manual
Version: 06.01
Page 76
5. Review Results and Trial S/N Ratios
This screen allows you to review results of your Dynamic System and the calculated S/N for the
individual trial conditions. The steps in analysis beyond this point are identical to that for analysis using
S/N ratio described in the previous section.
Click OK to proceed to the Main Effect screen and follow through with the complete analysis process.
Nutek, Inc.
Qualitek-4, Automatic Design and Analysis of Taguchi Experiments
Reference Manual
Version: 06.01
Page 77
Estimate Savings and Variation Reduction
These two items may serve as good component of a management report at the conclusion of an experiment. Since the main
reason for the experimental study should be to improve quality by reducing variations, its impact on the reduction of costs
from reduced scraps and warranty is of immense interest to the management. These options allows you to produce
graphical representations of the cost savings resulting from the corresponding variation reduction.
Calculation of Savings using Loss Function
The savings from improvement is calculated by using the analytical model (Loss Function) proposed by Dr. Genechi
Taguchi. A company manufacturing and selling parts will always have scraps and warranty. Therefore, theoretically
speaking it will always incur a loss. So it is the reduction of loss which is attributed as savings.
1. Select Option
Open the file you want to work with. Carry out complete analysis of results. This is necessary, since the
calculated values of S/N for the optimum performance may be used for calculations of savings.
From the main screen, click on Loss menu and select Nominal or General option depending on the information
you have available and the quality characteristic(QC) of your experiment.
If your result bears Nominal QC, you will use the Nominal option for calculation of loss. This option will require
that you know CUSTOMER TOLERANCE and other production information. If on the other hand, you do not
know customer tolerance, but know current LOSS, current S/N and improved design S/N, then you should go for
the General case.
Nutek, Inc.
Qualitek-4, Automatic Design and Analysis of Taguchi Experiments
Reference Manual
Version: 06.01
Page 78
(a) Calculate Loss with Nominal
Quality Characteristic
Target value is the nominal value of the
measured results. The Tolerance refers
to the Customer Tolerance. This quantity
is the key to the accuracy of the
calculation. The better you can
estimate/assume this value the better will
be your Loss estimate. It may or may not
be known for your product/process. In
that case you will need to assume a
value.
Current S/N ratio represents the status of
the current production part/process. If
current production is unavailable, then
average of the all trial S/N’s should be
taken as this value.
The S/N for the new design (of
part/process) should be the value
obtained by running confirmation
tests, or if confirmation tests are not
done, it is the S/N estimated at the
Optimum condition from the
experimental results.
The loss formulas:
L = K (y - y o)2 for a part
L = K (MSD) for a population
of parts
Steps:
- Calculate constant K by
substituting the boundary
condition, L= cost of rejection when
y = +/- Tolerance.
- Calculate Loss using L = K(MSD),
where MSD is found from given
S/N values.
Nutek, Inc.
Qualitek-4, Automatic Design and Analysis of Taguchi Experiments
Reference Manual
Version: 06.01
Page 79
(b) Calculate Loss (general case)
Since the Loss function for a population
of part is expressed as
L = K (MSD)
the Loss associated with a population
perforance can be calculated if MSD or
S/N is known. However, for complete
solution , the constant K must be
determined from a known value of L and
MSD. Thus if Loss and the S/N at current
design is known, the constant K can be
calculated as
K = Lcurrent / MSDcurrent
where MSD = 10
- [S/N]/10
The Loss must always be expressed
in terms of extra cost associated
with production of unit part. Its
value ranges between 0 and the cost
of production of unit part. If all parts
are made out of specifications, then
the Loss/unit is same as the cost of
production. If no part is made out of
specifications, then the Loss/part is
zero.
Nutek, Inc.
Qualitek-4, Automatic Design and Analysis of Taguchi Experiments
Reference Manual
Version: 06.01
Page 80
Appendix
Printing Reports and Graphs
There are two common ways to prepare a report of your experiments.
(I) CAPTURE AND PASTE METHOD: Your report is much more versatile when you capture and paste Qualitek-4 screens
of your choice on to your Word report documents.
(II) QUALITEK-4 PRINT OPTION: You can use the PRINT button from Qualitek-4 screens to produce the desired number
of experimental output pages to attach to your formally prepared report.
STANDARD REPORT CONTENT: Factors and Levels, Inner and Outer Arrays, Results, Main Effect, ANOVA, Optimum,
Main effect Graphs, ANOVA Graphs, Interaction Graphs, variation Diagram, etc.
Suggested Report Content
1. Project Title
- include names of team members (participants in the study)
2. Brief Description of the project function and the purpose of the study
- indicate reasons for the study and the benefits derived
3. Evaluation Criteria
- discuss how different objectives were measured
4. Factors and Levels
- explain how factors were selected from a long list
- discuss the rationale for number of levels and their values
5. Noise Factors and Interactions, if any
- discuss how interaction (if included) were selected
- justify use of noise factors in the design (if included)
6. Orthogonal Array and the design
7. Main Effects – indicate trend of influence of factors and interactions
8.ANOVA – list factors with higher relative influence to the variation
9. Optimum Condition and Performance (convert if in S/N)
- indicate any factor level adjusted for interaction
10. Confidence Interval (C.I.)
11. Expected Savings from the new design
12. Conclusions and Recommendations
- based on the results, what do you propose for further study
- explain when you would know that the experiment is satisfactory
Nutek, Inc.
Qualitek-4, Automatic Design and Analysis of Taguchi Experiments
Reference Manual
Version: 06.01
Page 81
Preparing Comprehensive Electronic Report Document
Upon completion of analysis of results, you will be able to prepare a comprehensive report using Microsoft WORD. To
start, prepare a WORD document with the above content space. Run Qualitek-4 with your experiment file and collect
screen images you want following the guidelines below. A sample report is shown at end of this chapter.
Capturing and Pasting Qualitek-4 Screens
Before capturing a screen, start WORD (procedure true for version 6.0) and be in the page you want to paste the screen.
Now run Qualitek-4 and follow these steps. (It is assumed that you are familiar with multitasking)
(1) Be in the screen you want to capture. Hold down Alt key and press PrntScreen key.
This action stores the captured screen in Windows Clipboard.
(2) Switch to the WORD document. From the Edit menu select PASTE. The screen in the Clipboard is now placed on the
document.
Cropping Captured Screens Using WORD Capabilities
(3) Optionally, for better control and easy positioning of the pasted screen, select the picture by clicking on it, then from
the INSERT menu select FRAME. It is also possible to CROP(cut and size) the picture using standard WORD capabilities.
To CROP, select the picture and place mouse pointer on any HANDLE, press Shift key down and DRAG the mouse to
desired sizing location.
On Screen Printing
Reports for each individual experimental parameter such as Factors, Array, Results, etc. can also be printed while creating
or editing the information and it is on display. Additionally it can be printed from the REPORT menu option from the main
screen. Options that are currently available and are logically appropriate will be highlighted. The options unavailable are
dimmed.
1. Select Option
Open the experiment file you want to work with. Go through with the analysis process if you wish to print reports
of Main Effect, ANOVA, Optimum Condition, etc. Then select REPORT menu item from the main screen. Most
item can be printed by displaying that item and clicking on the Print option displayed on the top right corner of
the screen.
Nutek, Inc.
Qualitek-4, Automatic Design and Analysis of Taguchi Experiments
Reference Manual
Version: 06.01
Page 82
Example Case Study Report
Project Title: Piston Bearing Durability Life Optimization Study
Experiment was conducted by: (Industrial users)
Brief Description of the project function and the purpose of the study:
Recent warranty study indicated high rate of field failure of the Piston Bearing (type DX30) due to excessive wear and
vibration related malfunction. This study was undertaken to enhance the durability life under field relevant 80Th
percentile application load.
Evaluation Criteria:
Experimental bearing samples were tested and performance evaluated by observing durability life (in hours, weighted at
60%) and by measuring force generated due to unbalanced vibration (g force, weighted at 40%). These two criteria of
evaluation were combined to produce an overall result used for the analysis. The scheme to calculate the Overall
Evaluation Criteria (OEC) is not shown here. The Quality Characteristic (QC) of OEC is Bigger is Better.
Factors and Levels:
Brainstorming with the team members
and other project personnel identified
seven Factors. Among the factors,
three uncontrollable factors were held
fixed for the purpose of the
experiments. Four remaining factors
and an interaction between two factors
were considered for the study.
Nutek, Inc.
Qualitek-4, Automatic Design and Analysis of Taguchi Experiments
Reference Manual
Version: 06.01
Page 83
Noise Factors and Interactions:
Interaction between Speed and Viscosity was considered most important.
Many noise factors were identified, but not included in this study.
Orthogonal Array and the design
Three samples in each of
the eight experimental
conditions were tested.
The observed readings for
durability life and vibration
force were combined for
each sample (45 for the
first sample in
experiment#1).
Main Effects
The average factor influences
showed trend of influence of
various factors, which helps to
determine the desirable
condition for the QC. It also
helped determine the levels of
the interacting factors (Speed
and Oil Viscosity) most suitable
for the desired performance.
From Test of Presence of
Interaction showed that Speed
at Level 2 and Oil Viscosity at
Level 1 are to be included in
the Optimum Condition
Nutek, Inc.
Qualitek-4, Automatic Design and Analysis of Taguchi Experiments
Reference Manual
Version: 06.01
Page 84
ANOVA:
ANOVA shows the relative influence of the factors and interaction to the variation of results. The most influence is due
the interaction included in the study, followed by factors Oil Viscosity, Speed, and Pin Straightness.
The Other/Error (28%)
indicates the influence from
all factors, not included in
the study and the
experimental error, if any.
Optimum Condition and Performance
The expected performance
at optimum condition
(79.664) shows an increase
of 21.08 points from the
average performance.
Improvement = (79.6658.58)/58.58 = 36%
Levels of interacting
factors are the same as
indicated otherwise. Thus
no adjustments of factor
level are necessary.
Nutek, Inc.
Qualitek-4, Automatic Design and Analysis of Taguchi Experiments
Reference Manual
Version: 06.01
Page 85
Confidence Interval (C.I.)
At 90% confidence level the Mean
of the population performance is
expected to fall within 74.39 and
84.93.
For confirmation/validity of the
analysis and predicted performance,
a set of samples were tested in the
Optimum Condition and the average
performance was found to be 81.5
.
Expected Savings from the new design
Savings = 46 cents for every dollars loss
Variation reduction: Cpk increased from 1.0 to 1.359
Nutek, Inc.
Qualitek-4, Automatic Design and Analysis of Taguchi Experiments
Reference Manual
Version: 06.01