1
SABRE
SIGN BRIDGE ANALYSIS AND
EVALUATION SYSTEM
Bridge Engineering Software & Technology Center
Department of Civil Engineering
University of Maryland
College Park, MD
Revision 5C
April 2012
TABLE OF CONTENTS
Page
List of Tables……………………………………………………………………………………………...ii
List of Figures……………………………………………………………………………………………iii
Chapter 1- Introduction
1-1
Chapter 2 - Description of Program ...................................................................................................... 2-1
2.1
Purpose ............................................................................................................................ 2-1
2.2
Sign Bridge Components................................................................................................. 2-1
2.3
Overview ......................................................................................................................... 2-2
2.4
Special Features............................................................................................................... 2-3
2.5
Automatic Mesh Generation .......................................................................................... 2-4
2.6
On-Screen Graphics ........................................................................................................ 2-4
2.7
Structural Analysis Capabilities ...................................................................................... 2-4
2.8
Review of Analysis Results............................................................................................. 2-6
2.9
Post Processing Capabilities............................................................................................ 2-6
Chapter 3 – Input of Data ...................................................................................................................... 3-1
3.1
General ............................................................................................................................ 3-1
3.2
Data Input........................................................................................................................ 3-1
Chapter 4 – Output of Results................................................................................................................ 4-1
Chapter 5 - Diagnostics ........................................................................................................................... 5-1
Chapter 6 – Description of System ........................................................................................................ 6-1
6.1
Using WIN-SABRE ........................................................................................................ 6-1
6.2
Before You Begin............................................................................................................ 6-1
6.3
Accessing the Main Menu............................................................................................... 6-2
6.4
The SABRE Main Menu ................................................................................................. 6-3
6.5
Detailed Usage of The Utility Program........................................................................... 6-4
Chapter 7 – Methodology ...................................................................................................................... 7-1
7.1
General ............................................................................................................................ 7-1
7.2
Calculation of Torsional Concentration Stress Factor..................................................... 7-1
7.3
Mesh Generation ............................................................................................................. 7-3
7.4
Screen Graphics............................................................................................................... 7-5
7.5
Analysis........................................................................................................................... 7-9
7.6
Base Plate Design.......................................................................................................... 7-13
7.7
Fatigue Check................................................................................................................ 7-17
7.8
Fatigue Design Examples for Highway Sign Details ................................................... 7-18
APPENDIX A:
APPENDIX A2:
APPENDIX B:
APPENDIX C:
APPENDIX D:
Input Screens.......................................................................................................... A-1
Presentation and Calculation of Fatigue Combine Stress Ratio...................... A2-1
Major Changes for the 2009 AASHTO Specifications ........................................B-1
Output Tables..........................................................................................................C-1
Error and Warning Messages............................................................................... D-1
i
References:
..................................................................................................................Referemces-1
Tables
2.1
2.2
2.3.1
2.3.2
2.4.1
2.4.2
2.4.3
2.4.4
2.4.5
2.4.6
2.4.7
2.5
2.6
2.7.1
2.7.2
2.8
2.9
2.10
2.11
2.12
2.13
3.1
4.1
6.1.1
6.1.2
6.2
6.3
7.1
7.2
7.3
7.4.1
7.4.2
7.4.3
7.5.1
7.5.2
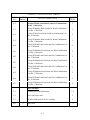
Sign Bridge Configurations............................................................................................. 2-8
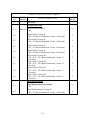
Sign Bridge Tower Types................................................................................................ 2-9
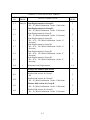
Sign Bridge Beam Types............................................................................................... 2-10
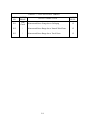
Sign Bridge Beam Types............................................................................................... 2-11
Sign Bridge Types ......................................................................................................... 2-12
Actual Structure Type vs Model ................................................................................... 2-13
Actual Structure Type vs Model ................................................................................... 2-14
Actual Structure Type vs Model ................................................................................... 2-15
Actual Structure Type vs Model ................................................................................... 2-16
Actual Structure Type vs Model ................................................................................... 2-17
Actual Structure Type vs Model ................................................................................... 2-18
Member Type and Category Within Unit...................................................................... 2-19
Tubular Shapes .............................................................................................................. 2-20
General Sections............................................................................................................ 2-21
General Sections............................................................................................................ 2-23
Summary of Sign Bridge Components.......................................................................... 2-24
Definition of Program Limits ........................................................................................ 2-25
Analysis Assumptions ................................................................................................... 2-26
Summary of Sign Bridge Features and Options ............................................................ 2-27
Summary of Sign Bridge Features and Options ............................................................ 2-28
Definition of Member Types for Release...................................................................... 2-29
List of Sign Bridge Input Screens ................................................................................... 3-2
Definition of Output Levels ............................................................................................ 4-2
List of SABRE.EXE Menu Selections .......................................................................... 6-10
List of SABRE.EXE Menu Selections .......................................................................... 6-11
Data Required for Mesh Generation ............................................................................. 6-12
Data Created during Mesh Generation .......................................................................... 6-13
Comparisons of Calculated and Table Values of K ...................................................... 7-22
Sign Bridge Constructions............................................................................................. 7-23
AASHTO Group Load Combinations ........................................................................... 7-24
Allowable Unit Stress Relationships............................................................................. 7-25
Allowable Unit Stress Relationships............................................................................. 7-26
Allowable Unit Stress Relationships............................................................................. 7-27
Interaction Equations..................................................................................................... 7-28
Interaction Equations..................................................................................................... 7-29
ii
Figures
2.1
7.1
7.2
7.3
7.4
7.5
7.6
7.7
Structural Coordinate System........................................................................................ 2-30
Torsional Factors........................................................................................................... 7-30
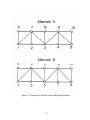
Example of Possible Joint Numbering Schemes ........................................................... 7-31
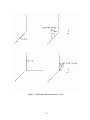
Example Rotation About Y Axis................................................................................... 7-32
Example Rotation About X Axis................................................................................... 7-33
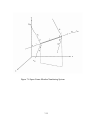
Example Rotation About Y and X Axes ....................................................................... 7-34
Space Frame Member Numbering System.................................................................... 7-35
Base Plate Design Factors ............................................................................................. 7-36
iii
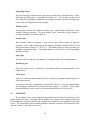
WIN-SABRE
Windows-Based Pre/Postprocessor for the Computer Analysis
of 3-D Sign Bridge
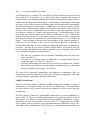
1 - INTRODUCTION
WIN-SABRE — Sign Bridge Analysis and Evaluation System runs on Windows platform
personal computers and includes preprocessor, analysis, and postprocessor modules. The
preprocessor includes data entry/editing, mesh generation, and on-screen graphing, among other
functions. The analysis module uses the general stiffness method to perform static analysis of
space frames and includes automatic load calculation (dead, wind, and ice), stress analysis, and
code checking. The analysis is based upon the 2009 AASHTO "Standard Specifications for
Structural Supports for Highway Signs, Luminaires and Traffic Signals” 5th Edition or the 2001
AASHTO Specs. 4th edition, for both steel and aluminum structures. (For comparison purpose,
the AASHTO Specs. 3rd edition is also available, but for steel structure only.)
The postprocessor includes on-screen graphing, review of analysis results, base plate fatigue
check, fatigue detail check in Excel and design of base plates and splice plates.
The American Association of State Highway and Transportation Officials (AASHTO) has
developed the "Standard Specifications for Structural Supports for Highway Signs, Luminaires
and Traffic Signals" to govern the design of sign structures. These specifications, Reference 1,
standardize the requirements for load application, methods of analysis, allowable stresses and
design details for sign supports and, as a result, have made easier the design and erection of sign
supports.
All of the entry and editing of data is accomplished with the aid of windows input screens. This
relieves the user of the responsibility of creating and maintaining the formatted text files required
for analysis. Each screen is divided into a number of data cells which can be edited individually.
The user can move freely from screen to screen and from cell to cell and can concentrate on the
meaning of the data rather than whether it is entered into the proper location. Also, a number of
utilities are provided to aid in the review and editing of the data, such as on-screen graphics and
output file viewing.
The mesh generation capabilities cover thirty of the most common sign bridge configurations
used in most of the states. This frees the user from the task of calculating and typing each
structure joint and member into a data file. That data can now be generated automatically. Also,
the structure solved by the stiffness method can be code-checked automatically.
1-1
2 - DESCRIPTION OF PROGRAM
2.1
PURPOSE
The primary purpose of the development of this program was to shorten and simplify the
design/analysis process for sign support structures. To be used properly, though, the user must
be aware of the capabilities and limitations of the program. These are described in this chapter.
2.2
SIGN BRIDGE COMPONENTS
1.
2.
3.
4.
5.
6.
7.
8
9.
Sign bridge configuration.
Tower types.
Beam types.
Sign Bridge types.
Member types.
Section types.
Sign types.
Walkway types.
Vertical attachment member (VAM) types.
These components are described in more detail in the remainder of this chapter.
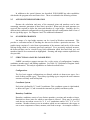
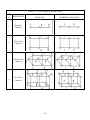
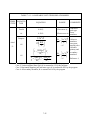
Sign Bridge Configurations
The configuration of a sign bridge defines the basic layout of the structure, i.e., the
overall number of towers and spans. Currently, five configurations are available in the
program, as summarized in Table 2.1. The beams in a structure can be placed at different
elevations and can have different depths and widths. The towers in a structure can have
different top and bottom elevations but towers with two posts must all have the same
width. The joint and member numbering schemes are explained in Chapter 7 Methodology.
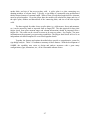
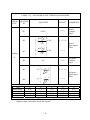
Tower Types
Two types of towers are allowed, single post towers or double posts. The tower posts can
be either prismatic or linearly tapered. The double posts can be trussed or nontrussed. A
restriction of the program is that all towers within a structure must have the same number
of posts. Table 2.2 contains an illustration of the two tower types.
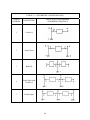
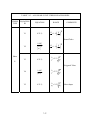
Beam Types
Eight basic beam types are allowed, as shown in Tables 2.3.1 and 2.3.2. The cantilever
and span beams are similar except for their joint and member numbering schemes, which
are explained in Chapter 7. The beam chords can be either prismatic or linearly tapered.
A restriction is that all beams in a structure must have the same number of chords.
2-1
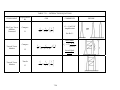
Sign Bridge Types
The four beam types and two tower types can be combined in six different ways. These
define the sign bridge type, as summarized in Table 2.4.1. The six types can be used in
any of the five sign bridge configurations, described previously, but only one bridge type
can be used in a configuration at any one time.
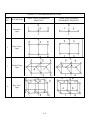
Member Types
The program includes four different member types, which define the function of the
member within the structure. The four member types, classified as either primary or
secondary members, are listed in Table 2.5.
Section Types
Each member must be assigned a cross section type, which defines its physical
properties. In all, eight section types are recognized, four tubular shapes (Table 2.6) and
four general shapes (Tables 2.7.1 and 2.7.2). The tubular shapes are used as primary and
secondary structural members. The general shapes are used only as vertical attachment
members (VAMs).
Sign Types
Presently, only one sign type is considered - rectangular signs with constant thickness.
Walkway Types
Only one walkway type is considered - rectangular walkways mounted parallel to the
bridge beams.
VAM Types
Only one vertical attachment member type is recognized - prismatic general shapes (see
section types above).
A summary of the above components is presented in Table 2.8. To aid in understanding,
the components in that table are grouped into three groups, I, II, and III. These groups
represent different levels of detail, with increasing detail from level I to level III.
2.3
OVERVIEW
The program consists of an integrated environment for the analysis and design of sign
bridge support structures. Included in the environment are a preprocessor module for data and
file management, an analysis module, and a postprocessor module for screen graphics and output
review. The organization of these modules and their relation to each other are described in more
detail in Chapter 6 - Description of System.
2-2
2.4
SPECIAL FEATURES
WIN-SABRE contains several special features developed to make the program as easy as
possible to use and to shorten the design/analysis cycle. These features are outlined below.
Windows Pull-Down Menu System
A Windows pull-down menu system is provided as a means of navigating about the
program. SABRE operates in a manner whereby the user may enter, edit, or review data
in any order, generally, or make use of the many tools available, at any time. See
Chapter 6 for more information.
Data Entry and Editing
All data required by SIGN BRIDGE is entered by the user into input cells, generally via
the computer keyboard. The user may move to any cell on a screen by using the mouse
or enter key and may move to any screen by using the pull-down menu system. To
minimize input errors, only data valid for that particular cell is accepted. For example,
alpha characters cannot be entered into a cell expecting numerical data and a minus sign
cannot be entered into a cell expecting a positive value.
Automatic Joint and Member Renumbering
If a joint or member is deleted or inserted, the remaining joints and members are
automatically renumbered to maintain their positions relative to each other. This
eliminates the need to recalculate and enter the other joints and/or members manually
after deleting or inserting. Chapter 6 provides more information on this subject.
Section Lookup
Before analysis can occur, the section properties for each member must be defined.
These properties are calculated from the member diameters, wall thicknesses, etc., which
can be entered manually by the user or imported from a shape file. A shape file is a user
created text file containing a table of dimensions for a particular structural shape. An
example would be a file containing dimensions of the various AISC wide flange shapes.
The user may call this file up onto the screen, review the data within it, and select a
suitable section. The data for that section then is copied into the current data cell. See
Chapter 6 for additional discussion.
On-Screen Help
The program provides extensive on-screen help during operation. This may be in the
form of a brief description of the data expected, allowable values, or other pertinent
information. Pressing “Help” displays a window on the screen with information. Help is
available at all times except during analysis.
2-3
In addition to the special features just described, WIN-SABRE has other capabilities
which make the program easier and faster to use. These are outlined in the following sections.
2.5
AUTOMATIC MESH GENERATION
Because the calculation and entry of the structural joints and members can be time
consuming, automatic generation of these data is provided. When used, the mesh generator can
create all data required to define the joints and members of a sign bridge. Currently, the five
different basic structural configurations can be generated with each configuration built of one of
the six sign bridge types. See Chapters 6 and 7 for additional information.
2.6
ON-SCREEN GRAPHICS
An image of a sign bridge structure can be viewed in Windows environment. This
provides a convenient means of checking the data used to define a particular structure. The
graphic image consists of a wire frame representation of the structure and can be of the current
structure being edited or a structure previously analyzed. For a previously analyzed structure,
the deflected shape can be viewed for any load combination (dead, dead and wind, etc.) and
members found to be overstressed are highlighted. Zooming and image rotation capabilities are
also provided.
2.7
STRUCTURAL ANALYSIS CAPABILITIES
SABRE can analyze support structures for a wide variety of configurations, boundary
conditions, member types, and loading conditions. See Table 2.9 - Definition of Program Limits
for more information. The analysis capabilities are further described below.
Configurations
The five basic support configurations are allowed with the six beam-tower types, for a
total of thirty possible types. These thirty sign bridge types comprise the most common
structures currently used in Maryland.
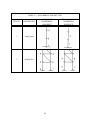
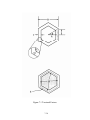
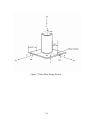
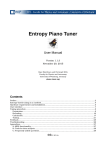
Coordinate System
Each joint is defined by X, Y and Z coordinates. This coordinate system is right-handed,
as shown in Figure 2.1, and is termed the structural (or global) coordinate system.
Boundary Conditions
Boundary conditions consist of two distinct quantities, reactions and member releases.
Reactions are those joints for which no movement is allowed. These may be specified
such that no movement occurs for X, Y or Z translations and/or X-X, Y-Y, or Z-Z
rotations. Member releases occur in members which are not continuous with respect to
one or more components of shear, moment, axial load or torque. An example would be a
2-4
member which contains a hinge. The hinge is a moment release at either end of the
member. It is necessitated by various construction details such as u-bolts, where no
moment can be transmitted from a horizontal member to the vertical tower members.
Table 2.13 gives the Definition of Member Types for Releases.
Prismatic or Tapered Members
Structural members can be either prismatic or tapered. To accommodate tapering,
members can be grouped into a unit which can be assigned different cross sections at the
two ends. For example, the members comprising a tapered tower can be grouped into a
tower unit and the cross section properties defined at only the top and bottom of the
tower. The dimensions and section properties of each member of that unit are then
interpolated by the program.
Loadings
The program allows for both automatic load generation and for manual load input. The
automatic load generation follows the AASHTO code for all dead, ice, and wind load
calculations. The methods used in calculating these loads are given in detail in Chapter
7. Maximum flexibility with respect to loadings is allowed with the various options
described as follows:
1.
2.
3.
The dead load may be altered with a detail factor to account for connections,
stiffeners, etc.
Ice loads may be adjusted by overriding the standard 3 psf that AASHTO
specifies with another value. The ice load may be placed on either one or both
sides of the sign.
Wind loads may be adjusted by altering the wind velocity or gust factor.
Finally, the program allows for completely general loadings via a manual entry. Here,
the loads are input as joint loads.
Sign Bridge Details
The sign bridge details are composed of components such as signs, vertical attachment
members (used to attach the sign to the structure), and walkway units. These can be
placed at any location on the structure and the effects of their dead weights, wind loads
and ice loads are then included automatically during analysis.
Stress Analysis
The stress analysis performed by the program follows the AASHTO Specifications,
Reference 1. The stress investigation itself involves the determination of stresses and
their interaction (i.e., the Combined Stress Ratio) for all members throughout the
structure. A detailed description of the method can be found in Sect. 7.
2-5
Structural Analysis
The method used in the analysis of the sign support structure is the stiffness matrix
method with a three-dimensional frame formulation. This method, subject to the
assumptions listed in Table 2.10, yields joint displacements, member end moments,
torques, shears, axial forces, and reactions. The limits of the number of members and
joints allowed in the analysis are given in Table 2.9. A detailed description of the method
can be found in Reference 2.
The results of the analysis, printed in an ASCII text file, form a complete report of the
analyzed structure, including input verification, section properties, joint loads,
deflections, stresses, etc. The user is then free to review the results graphically, import
the reactions for design purposes, and perform other postprocessing operations. See
Chapter 4 - Output of Results for more information on this subject.
Limitations
Currently, the program does not consider the following special conditions: Vibration
effects, prestrained members, induced displacements, elastic connections or supports,
thermal stresses, or P-Δ effects. Of special concern is the effect of vibration on the
structure. According to the AASHTO code, the member L/r restrictions should prevent
vibration failure and so only a static analysis is required. To be complete, however, a
rigorous dynamic analysis would be desirable. Also of special concern, is the effect of
elastic connections. As explained later, this program assumes all member connections to
be either completely fixed or pinned, a simplification which does not model real
conditions accurately. In an actual support structure such elements as u-bolts, although
modeled as pins, have, in fact, some degree of fixity. This can be accounted for with the
use of linearly elastic connections, where the degree of fixity can be set by the user. It is
suggested that this too be added to the program.
The program also does not perform the following AASHTO checks: Allowable
deflections, camber, and minimum material thicknesses. It is the responsibility of the
user to check these for compliance with the requirements.
2.8
REVIEW OF ANALYSIS RESULTS
The output file created during analysis can be viewed on-screen or sent to a printer. With
on-screen viewing the user can page through the output file or jump directly to selected tables.
For printing purposes, either the entire file can be printed or selected tables.
2.9
POST PROCESSING CAPABILITIES
There are four special features of sign bridges within the program, base plate design,
splice plate design and base plate and other details’ fatigue check. A base plate is the plate
connecting the bottom of a sign bridge tower to the concrete foundation. Given the proper data
the program will calculate the shape and size of the base plate, number and dimensions of the
2-6
anchor bolts, and size of the tower-to-plate weld. A splice plate is a plate connecting two
abutting members of a beam chord. Typically, a sign bridge is constructed using prefabricated
tubular beam elements of constant length. When a beam exceeds that length then two elements
must be spliced together. Given the proper data, the module will calculate the shape and size of
the splice plate, number and dimensions of the connecting bolts, and size of the tube-to-plate
weld.
The data required for either a base or splice plate (e.g. yield stresses, forces and moments,
etc.) can be entered by hand or imported from an output file. The data required for base plate
fatigue check (base plate moment range and column information) should be imported from a
fatigue file. The results can be viewed on-screen or be sent to a printer. See Chapter 7 for more
information on the program's post processing capabilities. The fatigue detail check in Excel is an
independent calculation template for several most popular details.
Together, the features and options described above provide a comprehensive system for
sign bridge analysis. Table 2.12 contains a summary of these features. With the development of
SABRE, the capability now exists to design and analyze structures with a great many
configurations, types, dimensions, etc., all in a reasonable amount of time.
2-7
TABLE 2.1 – SIGN BRIDGE CONFIGURATIONS
CONFIG.
NUMBER
DESCRIPTION
1
Cantilever
2
Single Span
3
Butterfly
4
Single Span with
Cantilever
5
Double Span
BASIC JOINT AND MEMBER
NUMBERING SEQUENCE
2-8
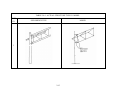
TABLE 2.2 – SIGN BRIDGE TOWER TYPES
TYPE ID
DESCRIPTION
1
Single point
2
Double Post
BASIC JOINT
NUMBERING
SEQUENCE
2-9
BASIC MAIN MEMBER
NUMBERING
SEQUENCE
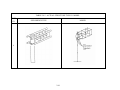
TABLE 2.3.1 – SIGN BRIDGE BEAM TYPES
TYPE
DESCRIPTION
ID
1
Monotube,
Cantilever
2
Plane Truss,
Cantilever
3
Trichord Truss,
Cantilever
4
Box Truss,
Cantilever
BASIC JOINT NUMBERING
SEQUENCE
2-10
BASIC MAIN MEMBER
NUMBERING SEQUENCE
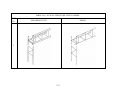
TABLE 2.3.2 – SIGN BRIDGE BEAM TYPES
TYPE
DESCRIPTION
ID
1
Monotube,
Span
2
Plane Truss,
Span
3
Trichord Truss,
Span
4
Box Truss,
Span
BASIC JOINT NUMBERING
SEQUENCE
2-11
BASIC MAIN MEMBER
NUMBERING SEQUENCE
TABLE 2.4.1 – SIGN BRIDGE TYPES
TYPE ID
DESCRIPTION
POSTS PER
TOWER
CHORDS
PER BEAM
REFERENCE
1
Monotube on Single Post
1
1
Table 2.4.2
2
Plane Truss on Single
Post
1
2
Table 2.4.3
3
Trichord on Single Post
1
3
Table 2.4.4
4
Trichord on Double Posts
2
3
Table 2.4.5
5
Box Truss on Single Post
1
4
Table 2.4.6
6
Box Truss on Double
Posts
2
4
Table 2.4.7
2-12
TABLE 2.4.2 – ACTUAL STRUCTURE TYPE VS. MODEL
TYPE
ID
SIGN BRIDGE TYPE
MODEL
1
2-13
TABLE 2.4.3 – ACTUAL STRUCTURE TYPE VS. MODEL
TYPE
ID
SIGN BRIDGE TYPE
MODEL
2
2-14
TABLE 2.4.4 – ACTUAL STRUCTURE TYPE VS. MODEL
TYPE
ID
SIGN BRIDGE TYPE
MODEL
3
2-15
TABLE 2.4.5 – ACTUAL STRUCTURE TYPE VS. MODEL
TYPE
ID
SIGN BRIDGE TYPE
MODEL
4
2-16
TABLE 2.4.6 – ACTUAL STRUCTURE TYPE VS. MODEL
TYPE
ID
SIGN BRIDGE TYPE
MODEL
5
2-17
TABLE 2.4.7 – ACTUAL STRUCTURE TYPE VS. MODEL
TYPE
ID
SIGN BRIDGE TYPE
MODEL
6
2-18
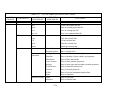
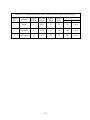
TABLE 2.5 – MEMBER TYPE AND CATEGORY WITHIN UNIT
MEMBER
STRUCTURAL COMPONENT
TYPE
CATEGORY
DESCRIPTION
FIGURE
1
Secondary
Interior truss members for plane, trichord and
box trusses
2
Primary
Exterior truss members for plane, trichord and
box trusses
3
Primary
Vertical (tower) members
4
Secondary
Interior truss members for tower
2-19
TABLE 2.6 – TUBULAR SHAPES
SHAPE
ID
TYPE
1
STRESS
CONCENTRATION
FACTOR
FIGURE
COMMENTS
Not Used
2
Round
Not Required
Note the definition of the outer
diameter D.
3
Dodecagonal
Figure B-1
AASHTO Spec.
Note the definition of the outer
diameter D.
4
Octagonal
Figure B-1
AASHTO Spec.
Note the definition of the outer
diameter D.
5
Square
Figure B-1
AASHTO Spec.
Note the definition of the outer
diameter D.
2-20
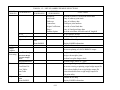
TABLE 2.7.1 – GENERAL SECTIONS
ID
6
7
TYPE
FIGURE
GENERAL PARAMETERS
PARAMETER
UNITS
S1
in (mm)
S2
in (mm)
S3
in (mm)
S4
none
Rectangular
Shapes
Angle Shapes
2-21
DESCRIPTION
Width of section outside to outside
measured parallel to x-x axis.
Width of section outside to outside
measured parallel to y-y axis.
Thickness of section (assumed to be
constant throughout section).
Stress concentration factor. If left
blank, program assumes value of 1.0.
S5
Not Used
S6
Not Used
S1
in (mm)
Width of bottom leg
S2
in (mm)
Width of top leg
S3
in (mm)
S4
none
Thickness of section (assumed
constant)
Stress concentration factor. If left
blank program assumes value of 1.0.
S5
Not Used
S6
Not Used
TABLE 2.7.1 – GENERAL SECTIONS (cont.)
ID
6
TYPE
FIGURE
GENERAL PARAMETERS
PARAMETER
UNITS
S1
in (mm)
S2
in (mm)
S3
in (mm)
S4
in (mm)
Cover plate with parallel to x-x axis
S5
in (mm)
Cover plate thickness
Rectangular
Shapes
Alternate 1
6
Rectangular
Shapes
Alternate 2
Width of section outside to outside
measured parallel to x-x axis
Width of section outside to outside
measured parallel to y-y axis
Thickness of section (assumed to be
constant throughout section)
To distinguish Alt. 1 from Alt. 2, the
field for “thickness of round tube” is
used to input cover plate thickness (T =
S5)
Width of section outside to outside
measured parallel to x-x axis
Width of section outside to outside
measured parallel to y-y axis
Thickness of section (assumed to be
constant throughout section)
S6
in (mm)
S1
in (mm)
S2
in (mm)
S3
in (mm)
S4
in (mm)
Wing section width parallel to x-x axis
S5
in (mm)
Wing section height from outside of
main section to outside of wing section
S6
2-22
DESCRIPTION
Not Used
TABLE 2.7.2 – GENERAL SECTIONS
GENERAL PARAMETERS
ID
TYPE
8
9
FIGURE
PARAMETER
UNITS
S1
in (mm)
Flange width
S2
in (mm)
Depth of section
S3
in (mm)
Flange thickness
Not Used
Wide Flange
Shapes
S4
S5
Not Used
in (mm)
S6
10
DESCRIPTION
“Z” Shapes
Not Used
S1
in (mm)
Width of both legs
(assumed symmetric)
S2
in (mm)
Height of section
S3
in (mm)
S4
in (mm)
S5
none
S6
2-23
Web thickness
Thickness of section
(assumed constant)
Stress concentration factor. If left
blank, program assumes value of 1.0.
Not Used
Not Used
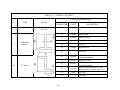
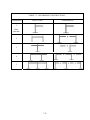
TABLE 2.8 – SUMMARY OF SIGN BRIDGE COMPONENTS
LEVEL
TERM
I
Sign Bridge
Configurations
NO.
REFS.
The basic number of beams and towers
in the structure and their orientation
5
Table
2.1
The number of posts in each tower
2
Table
2.2
Beam Type
The number of chords in each beam.
8
Table
2.3
Sign Bridge
The combinations of beams and towers
and their connections
6
Table
2.4.1
Member Types
The category of each member and its
function within the structure
4
Table
2.5
Section Types
The allowable member cross sections
8
Tables
2.6, 2.7
Sign Types
The signs supported by the structure
1
⎯
The maintenance walkways (catwalks)
supported by the structure
1
⎯
The members connecting the signs to the
structure
1
⎯
Tower Types
II
III
Walkway Types
VAM Types
DESCRIPTION
2-24
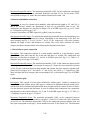
TABLE 2.9 – DEFINITION OF PROGRAM LIMITS
ITEM NO.
DESCRIPTION
MAXIMUM
NORMAL
LARGE
1
Number of Joints
420
4000
2
Number of Sections
40
40
3
Number of Members
999
4000
4
Number of VAMs
25
25
5
Number Supporting Members/VAM
3
3
6
Number of Walkways
5
5
7
Number of Load Numbers
20
60
8
Number of Signs
10
10
9
Number of VAMs per Sign
7
7
10
Number of Units per Structure
40
40
11
Number of Posts per Tower
2
2
12
Number of Chords per Beam
4
4
13
Number of Segments per Post
16
16
14
Number of Segments per Chord
- Cantilever beam
- Span beam
16
36
98
98
2-25
TABLE 2.10 – ANALYSIS ASSUMPTIONS
ITEM NO.
DESCRIPTION
1
Linearly elastic material
2
Small deformations
3
Shear deformations neglected
4
6 kinematic degrees of freedom at each joint – 1 axial, 2 shears, 2
moments, and 1 torsion
5
Tapered members are modeled as a combination of stepped
prismatic members
6
All steel, all aluminum, or steel post/aluminum chord
construction (Window V3.2 based on 4th edition only)
2-26
TABLE 2.11 – SUMMARY OF SIGN BRIDGE FEATURES AND OPTIONS
SYSTEM FEATURES
- pull-down menus
- extensive on-screen help at all levels
- automatic generation of joints and member
- on-screen lookup table of AISC standard rolled sections
- on-screen lookup table of user defined tubular sections
- user selected out levels
- default value overriding capability
- extensive output generation in tabular form
- on-screen output file viewing
- indexed output tables in 8 ½“ × 11” format
- design tools
- multi-level error checking and diagnostics
- in-core analysis
- complete documentation
SPECIFICATIONS
- Latest AASHTO Standard Specs. for Structural Supports for Highway Signs,
Luminaires and Traffic Signals
- AASHTO load application
- AASHTO allow stress calculation
- AASHTO code checking
STRUCTURAL MODEL
- 3-D space frame model
- 6 degrees of freedom
- arbitrary boundary conditions
- arbitrary hinge placement
- general direct stiffness method w/ optimized memory
- 5 basic structural configurations
- 6 tower and beam combinations
- prismatic or tapered members
- All steel, all aluminum, or steel post/aluminum chord construction (Window V3.2
and up based on 4th edition only)
- tubular frame members
2-27
TABLE 2.12 – SUMMARY OF SIGN BRIDGE FEATURES AND OPTIONS
LOADINGS
- AASHTO or user defined wind application
- automatic ice load calculation
- wind shielding taken into account
- automatic dead load calculation
- optimal user defined joint loads
- maximum load combinations effects used
ANALYSIS
- analysis of all frame members
- automatic member property calculation
- calculation of joint displacements and reactions
- calculating of member end moments, torques, shears, and axial forces
- stress calculation of each load condition
- calculation of stress interactions
CODE CHECK
- AASHTO requirements for tubular members
- combined stress ratios
- equation number references
POST PROCESSING
- base plate design
- splice plate design
- optional import of design forces and moments
- base plate fatigue check
- fatigue detail check in Excel
GRAPHICS
- on-screen graphics
- input review
- output review
- real time image rotation
- zooming
- substructure isolation
- member detail review deflected shape viewing
- highlighting of overstressed members
2-28
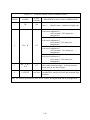
TABLE 2.13 – DEFINITION OF MEMBER TYPES FOR RELEASE
NEAR (JJ) END RELEASES
MEMBER
MOMENT
TYPE
XX
0
(or blank)
1
X
2
YY
FORCE
ZZ
X
Y
MOMENT
Z
XX
YY
ZZ
X
4
X
5
X
6
X
X
X
X
X
X
X
X
X
X
8
X
9
X
10
X
11
X
12
X
13
14
FORCE
X
3
7
FAR (JK) END RELEASES
X
X
X
X
X
X
X
X
2-29
X
X
X
Y
Z
Figure 2.1 Structural Coordinate System
2-30
3 - INPUT OF DATA
3.1
GENERAL
In order for a sign bridge to be analyzed, certain data are required. These data
define the joint locations, element connectivity, member properties, and other structure
information required for analysis. It is important that the entry and editing of this data
are made as easy as possible so that maximum time can be spent on the engineering
aspect of the problem.
3.2
DATA INPUT
Data entry is accomplished with input screens. Instead of being entered into a
formatted text file, data is entered into cells which appear on the screen. Each screen has
a number of input cells which can be edited individually. Table 3.1 summarizes the
program input screens and the card numbers used with each screen. Also, Appendix A
contains copies of all SABRE input screens and Appendix B contains descriptions of
each input cell.
3-1
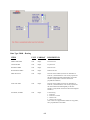
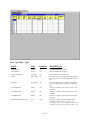
TABLE 3.1 – LIST OF SIGN BRIDGE INPUT SCREENS
DATA TYPE NUMBER USED WITH
SCREEN
SCREEN TITLE
Project Data
01012, 01022
General Program Options
01032
Sign Bridge Configuration
21000
Element Definition
31000, 32000
Dimensions
34000, 35000, 36000, 37000, 41000
Cross Sections
33000
Bracing
33000, 38000
Yield Stresses
39000
Definition of Sections
04012
Definition of Joints
03012
Definition of Members
05012
Member Option
06012
Vertical Attachment Members
07012
Sign Data
09012
Gen. Program Design Parameters
01042
Joint Load Data
10012
Walkways
08012
Connections
01052
Height Coefficients (Ch)
09112
Hinges
40000
Base Plate Design Parameters
50000
Splice Plate Design Parameters
51000
Base Plate Fatigue Check Parameters
52000
3-2
4 - OUTPUT OF RESULTS
Results of a structural analysis by WIN-SABRE are printed in tabular form in an
ASCII text file. The name of the output file and its location are defined by the user prior
to analysis. Currently, the user has two possible levels of output from which to choose,
level 1 (short), or level 2 (long). Level 1 generates the minimum amount of data,
providing a quick review of the results. Level 2 generates additional data, providing
more detailed results. See Table 4.1 for a description of the two levels.
The data within an output file are presented in various tables which are organized
into three basic groups, input verification, analysis, and code check. The input
verification tables provide a means for the user to check the validity of the data entered.
The analysis tables summarize the structural analysis results, such as deflections, end
actions, etc. The code check tables summarize the results of the AASHTO code checks
such as allowable stresses and CSR values. The results are printed for each member, load
combination, etc.
The data from any output file are available for base and splice plate design,
graphing, and printing. Appendix C contains a list of each table generated during
analysis.
4-1
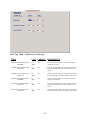
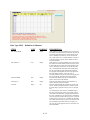
TABLE 4.1 – DEFINITION OF OUTPUT LEVELS
OUTPUT
LEVELS
DESCRIPTION
OUTPUT GIVEN
1
All input data, maximum joint
Basic level for engineering design
displacements, allowable stresses,
or analysis
and combined stress ratios
2
The same as Output Level 1 plus
Basic level for engineering design
joint loads, member end actions,
or analysis with added detail
and joint deformations for all
above level 1
group loads
4-2
5 - DIAGNOSTICS
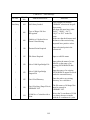
To minimize the occurrence of errors, certain checks are made within SABRE, at five
levels of program operations.
The first level of error checking occurs during data input and has been described
previously in Special Features. During data entry, information is screened immediately upon
entry and any invalid data will either generate an error message or will not be accepted. As
an example, the cell containing the number of desired beam chords will accept only four
different values, the integers 1 through 4, corresponding to a one-chord beam (monotube),
two-chord beam (plane truss), etc. If the user tries to enter any value outside of that range, it
will not be accepted by the program; i.e., the number pressed will not be echoed to the
screen.
A second level of error checking occurs as a prelude to mesh generation or analysis.
Before mesh generation or analysis begins, all data is reviewed for its validity. If any invalid
data is detected, then an error message is generated. For instance, in order for a valid mesh
to be created, the elevations of the top and bottom of each tower must be entered. If, after
checking, the top elevation of a tower is found to be lower than the bottom (a physical
impossibility), then two actions will be taken. First, an error message will be printed in a
screen window notifying the user of the specific problem and, second, control will be passed
to the input screen where the tower elevations are entered. The improper data must be
entered correctly before mesh generation can be reattempted. An error of this type cannot be
ignored or overridden.
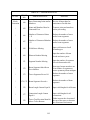
The third level consists of normally fatal errors found during analysis. These are
errors undetected by the previous levels of checking but which result in unacceptable
conditions. An example of such an error is the definition of a wide flange shape as a main
tower member. Only tubular shapes are allowed for main members so this condition is
checked and flagged. Errors detected at this level will result in termination of the analysis
process.
A fourth level of error checking, warning messages, is less restrictive than the others.
Warning messages notify the user of potential problems but also let the user ignore the
implications. For example, a sign is connected to its support structure with one or more
vertical attachment members (VAMs). If the user fails to define the VAMs properly for a
sign, then that sign will not be connected to the structure and, as a result, its dead load, wind
load, etc. will not be considered during analysis. To alert the user to this condition, a
warning will appear in a screen window, giving him or her the opportunity to reconsider.
The final level of error checking occurs at the language level. These are
unprogrammed error checks which are embedded in the programming languages and end
with typically unpredictable results. An example of such an error is the calculation of the
square root of a negative number. If this condition has not been trapped in the previous
levels, then the result will depend on the present program level. SABRE has been designed
to avoid all errors at this level.
5-1
A list of all SABRE error and warning messages is contained in Appendix D.
5-2
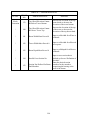
6 - DESCRIPTION OF SYSTEM
6.1
USING WIN-SABRE
WIN-SABRE currently is available for use on microcomputers using the Microsoft
Windows environment. This manual describes the Windows version of WIN-SABRE, hereafter
referred to as SABRE. This version utilizes a Windows-based pull-down menu structure to
access SABRE’s input, analysis, output graphics, post processing, and printing utilities.
6.2
BEFORE YOU BEGIN
SABRE is designed to run on microcomputers that use the Microsoft Windows operating
system. While this manual provides step-by-step instruction in the use of SABRE, it cannot
address the specific operation of every personal computer (PC). Before you begin, please ask
yourself the following questions:
1.
2.
3.
4.
5.
Are you familiar with the PC or microcomputer you are using?
Are you familiar with Microsoft Windows?
Do you have an understanding of the concepts and use of terms such as menus,
help screens, cursor, mouse, files, etc.?
Have you read/installed the SABRE software using the installation instructions
you received with your system disks?
Have you filed your installation instructions with your other SABRE reference
material?
If you cannot answer “Yes” to all of these questions, please take the time to address them
before continuing on in this manual.
If you are prepared to continue, take a moment to look over the Table of Contents
provided at the beginning of this manual. You will find that the remainder of this document
illustrates the detailed use of the four basic utility functions of SABRE in Section 1.4.
The remainder of this section describes how to enter SABRE and how to access the Main
Menu.
6-1
6.3
ACCESSING THE MAIN MENU
The SABRE MAIN MENU is the main access screen to each of the utilities provided
within the SABRE system. It is also the main return point when you have finished using one of
the utilities.
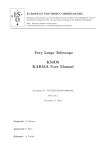
If your PC is currently off, simply turn it on and run Microsoft Windows. After entering
Windows, SABRE can be run by double-clicking the SABRE icon. The SABRE Introduction
Screen will be displayed on your monitor in a few seconds.
6-2
6.4
THE SABRE MAIN MENU
This screen allows you to access any of the six utilities in SABRE or to exit the program.
These are the Input, Analysis, Output Graphics, Post Processing, Print, and Help utilities
Input Utility – allows you to create new sign bridge data files or to edit existing files.
Once you have entered the details of a structure, then you can save it for
later use.
Analysis Utility – allows you to execute the SABRE program using the data stored in
any of your input data files.
Output Graphic Utility – allows you to view and print the shape of a SABRE structure
previously analyzed.
Post Processing Utility – allows you to do base plate and other details' fatigue check and
design base plates and splice plates.
Print Utility – allows you to view and print output files and tables. It also provides a
directory of available tables for your convenience.
6-3
Exit – allows you to exit SABRE simply by clicking on the word ‘Exit’ in the SABRE
Main Menu or by typing Alt-x on your keyboard.
Help Utility – allows you to view help for the Help basics, commands, and buttons.
Help Utility also may be accessed from Input Utility.
6.5
DETAILED USAGE OF THE UTILITY PROGRAMS
Input Utility – is accessed by clicking on the Input in the main menu. It allows you to
create new sign bridge data files or to edit existing files. Once you have entered the
details of a structure, you can then save it for later use.
To open a data file:
1.
2.
3.
4.
On the File menu, click Open.
In the Look in box, click the drive that contains the file.
Below the look in box, click the folder that you want.
Double_click the data file, or type it in the File Name box.
To create a new data file:
On the File menu, click New.
To save a new, unnamed data file:
1.
2.
3.
On the File menu, click Save As.
In the File name box, type a name for the data file.
Click Save.
To save an existing data file:
On the File menu, click Save.
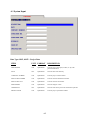
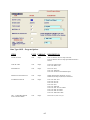
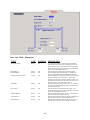
Input Screens:
The available input categories are System, Structure Generation, Structure Lookup,
Options. Each category has its own submenu(s) which include related bridge input data
screens.
Using the keyboard with input screens:
To move in a table
Press
To the next cell in the row
ENTER or TAB or Right arrow
To the previous cell in the row
Left arrow
6-4
Up one row in a table
Up arrow
Down one row in a table
Down arrow
To move in individual fields
Press space bar
To the next field
ENTER or TAB or Right arrow or Down arrow
To the previous field
Left arrow or Up arrow
To delete, cut, copy, and paste data in a field:
To delete data, select them. Then on the Edit menu, click Delete.
To cut data so you can move it to another field, select the data. Then on the Edit menu,
click Cut.
To copy data so you can paste a copy of it in another field, select the data. Then on the
Edit menu, click Copy.
To paste data you have cut or copied, click the place where you want to put the data.
Then on the Edit menu, click Paste.
To undo your last action, on the Edit menu, click Undo.
To delete, cut, copy and paste data in a row:
To delete a row of data, double click the gray area on the leftmost side of the table to
highlight the row. Then on the Edit menu, click Delete.
To cut a row of data so you can move it to another place, double click the gray area on
the leftmost side of the table to highlight the row. Then on the Edit menu, click Cut.
To copy a row of data so you can paste it in another place, double click the gray area on
the leftmost side of the table to highlight the row. Then on the Edit menu, click Copy.
To paste a row of data you have cut or copied, double click the gray area on the leftmost
side of the table to highlight the row where you want to put the data, Then on the Edit
menu, click Paste.
To undo your last action, on the Edit menu, click Undo.
Going to the next or previous screen:
Clicking on the <up arrow> icon takes you back to the previous screen.
6-5
Clicking on the <down arrow> icon takes you down to the next screen.
Going to a specific screen:
On the Input Screen menu click any input screen title.
On the Go To menu click any input screen data type number.
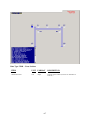
Input Graphic:
Plots the joint location and member connectivity for the current data file, as inputted by
the user or created by the MESH generator.
Automatic Joint and Member Renumbering:
The user may insert or delete an entire row of data, defined as a record. The insertion or
deletion of a record may, however, affect data on another screen. For instance, the "left"
and "right" ends of a member on Definition of Members represent joints defined on
Definition of Joints. If a record is deleted on the Joints screen then all joints listed
following that record will be shifted down the joint list. For example, if joint number 6 is
deleted from the joint list then joint number 7 will become 6, 8 will become 7, and so on.
All members connected to joints numbered greater than 6 will automatically be
renumbered on the Member screen, thus saving the user the tedious task of renumbering
by hand. Any member, however, that previously had been connected directly to joint 6,
will become undefined. The user is responsible for redefining any such member. It is
important to note that even when data has been created by the mesh generator, the user
then can edit that data as if it had been entered by hand. This provides a considerable
degree of flexibility.
Shape Files:
The input of the member properties for each element of a SABRE is accomplished on
Definition of Sections. The data required on that screen consist of section types (tubes,
WF, etc.) and dimensions (diameters, depths, thicknesses, etc.). The entry of this data
can be accomplished in one of two ways, by the manual entry of the data or by the import
of the data from a shape file. A shape file is a user-created formatted text file containing
a list of dimensions for a particular type of structural shape. As an example, the user can
create a shape file, using any word processor, which contains a list of the diameters, wall
thicknesses, moments of inertia, etc. for round tubes. That file then can be called up from
screen Definition of Sections by pressing the Section Lookup key. The data in that file
will appear in a screen window which users can browse through at their convenience. If
the user desires to use the data for a particular section, the user can highlight the data and
click copy. Then click the record selector to highlight the row where you want to put the
data and click paste. The relevant data from the selected section will be imported into the
proper cells on the current line of Definition of Sections. Currently, two types of shape
6-6
files are recognized, tubes and wide flange sections. The tubes can be round, square,
octagonal, or dodecagonal. The file formats are predefined and cannot be changed by the
user.
Description of MESH:
MESH generates the joint and member data used in the analysis. In order to generate the
mesh, certain data which defines the structure are required. These data are summarized
in Table 6.3. With that data MESH is able to generate the data listed in Table 6.4, which
defines the frame joints and members. After generation of all mesh data the structural
frame is completely defined and can be analyzed, assuming that all other required data
also has been entered.
Analysis Utility – is accessed by clicking on the Analysis in the main menu. It allows
you to execute the SABRE program using the data stored in any of your input data files.
To select an input data file:
1.
2.
3.
4.
Click the Input File button.
In the Look in box, click the drive that contains the file.
Below the look in box, click the folder that you want.
Double_click the data file, or type it in the File Name box.
NOTE:
The default output file will appear below the output file button, after an input data file is
selected. To select a different output file, click the Output File button, then follow the
same procedures.
To execute SABRE:
Clicking the OK button on the run utility screen will execute SABRE. After the
execution starts, a separate window will appear on the screen with the program status
shown.
Print Utility
To change printers and printing options:
1.
2.
3.
On the Print menu, click Print Setup.
To change printers, paper size, or page orientation, make the appropriate
modifications.
Click OK.
6-7
To Print screen:
On the Print menu, click Print Screen.
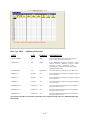
Print Utility is accessed by clicking on Print in the main menu.
It allows you to view and print output files and tables. It also provides a directory of
available tables for your convenience.
To open a result file:
1.
2.
3.
4.
Click the drive that contains the file.
Click the directory folder that you want.
Double_click the file in the file list box or type it in the file name box.
Click OK.
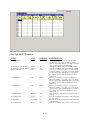
To view the whole result file:
Click the View/Print File tab to view the whole file.
To find a string:
1.
2.
3.
Click Find String.
In the Enter Search String box, enter the text you want to search for.
Click OK.
To find next string:
Click Find Next to search the next string.
To print the whole result file:
1.
2.
3.
Click the Print button.
Chose a printout option.
Click OK.
To change printing options:
1.
2.
3.
Click Print Setup.
To change printers, paper size, or page orientation, make the appropriate
modifications.
Click OK.
6-8
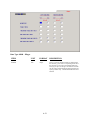
To view the tables:
1.
2.
3.
Click the View Tables tab.
Click on a table you would like to view from the list on the top.
The selected table will be displayed on the bottom.
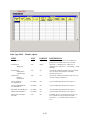
To print the tables:
1.
2.
3.
4.
Click the Print Tables tab.
Click on the tables you would like to print from the list on the bottom.
The selected tables will appear on the top list.
Click Print.
Note: To delete a table from the top list, click on the table.
Output Graphics Utility
By clicking on the word ‘Graphic,’ shown in the menu bar of the Main Menu screen, you
will be transferred to the SABRE Graphic Utility screen. The Output option, in addition
to plotting the joints and members, provides several other tools. First, the deflected
structural shape for the various loading conditions can be plotted, thus revealing obvious
problem areas. Also, any member having been analyzed as overstressed (CSR, 1.0) will
be highlighted on the screen, making quick identification possible. The user may also
review the analysis results of any particular member in the structure, including
dimensions, deflections, and CSR value. The user has the ability to view the image from
any arbitrary viewing angle, zoom in on any part of the image, and toggle the joint and
member numbering on and off.
Post Processing Utility
The POST PROCESSING module has four special features of SABREs, base plates
design, splice plates design and base plate and other details’ fatigue check. The Base
Plate Design option is used to design the plate connecting the bottom of a SABRE tower
to the concrete foundation. The Splice Plate Deign option is used to design the plate
connecting two abutting members of a beam chord. The data required for base plate
design and splice plate design options can be entered by hand or imported from an output
file. When imported, the forces and moments yielding the most conservative design are
used. For base plate fatigue check option, the required data should be imported from the
fatigue file. An analysis can be performed when all other desired data is entered. The
results are displayed in a screen window and can then be sent to a printer or viewed
graphically. Fatigue detail check is an independent Excel template for several most
popular details. This Excel template contains macros; to run the macros, change the
macro security level to a lower setting. The security setting is under Options on the Tools
menu.
6-9
TABLE 6.1.1 – LIST OF SABRE.EXE MENU SELECTIONS
MAIN
CHOICES
Exit
Input
SUBCHOICES
File
Edit
Input Screen
SUB
SUBCHOICES
New
Open
Save
Save As
Undo
Copy
Cut
Paste
Delete
System
Structure
Generation
Structure Lookup
SUB SUB
SUBCHOICES
Project Data
Program Options
Configuration
Elements
Dimensions
Cross Sections
Bracing
Yield Stresses
Sections
VAMs
Signs
Joints
Members
6-10
FUNCTIONS
Exit the system
Create a new input data file
Open an existing input data file
Save an existing data file
Save a new unnamed data file
Undo the action
Copy the selected data
Cut the selected data
Paste the selected data
Delete the selected data
Entry of project identification data
Entry of output level
Choice of basic structural configuration
Entry of number of posts, chords, and segments
Entry of fame dimensions
Entry of main member properties
Entry of truss types and secondary member properties
Entry of material yield stresses
Entry of section properties
Entry of vertical attachment member data
Entry of sign data
Entry of joint data
Entry of member data
TABLE 6.1.2 – LIST OF SABRE.EXE MENU SELECTIONS
MAIN
CHOICES
SUBCHOICES
Go To
Input Graphic
Help
Analysis
Output
Graphics
Post
Processing
SUB
SUBCHOICES
Options
SUB SUB
SUBCHOICES
Parameters
Joint Loads
Walkways
Connections
Height Coefficients
Hinges
Member Option
FUNCTIONS
Override of wind, ice, dead load default data
Entry of arbitrary joint leads
Entry of walkway data
Chord-post joint numbers
Override of wind load data
Entry of chord-post hinge data
Override wind data, allowable and eff. length K
Go to a specific Screen
On-Screen plotting of current data file
Contents and
Index
SABRE on-line help
About SABRE
Display SABRE information
Analysis of current data
On-screen plotting of a SIGN BRIDGE output
Base Plate Design
Design a tower base plate
Design a beam splice plate
Splice Plate Design
Base Plate Fatigue
Check
Fatigue Detail Check
Perform base plate fatigue check
Perform fatigue check of 7 types
Open a sign bridge output file
On screen viewing or printing a sign bridge output file
View selected tables from a sign bridge output file
Print selected table from a sign bridge output file
Exit print utility
Print
Open File
View/Print File
View Tables
Print Table
Exit
Help
Contents and
Index
SABRE on-line help
About SABRE
Display SABRE information
6-11
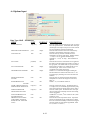
TABLE 6.2 – DATA REQUIRED FOR MESH GENERATION
SCREEN
TITLE
TYPE OF INPUT
Configuration
One of the five basic structural types to be analyzed (e.g., cantilever,
span, etc.)
Elements
The number of beam chords, tower posts, and segments in both
Dimensions
Beam lengths, widths, depths, heights, and tower widths and heights
Cross Sections
The shapes and dimensions of each tower, beam and bracing element
Bracing
The type of truss pattern (e.g., Pratt, Warren, etc.) or each beam and
tower and the shape and dimensions of the bracing members
Yield Stresses
The material yield stress for each type of beam, tower, and bracing
element
Hinges
The type of member end conditions desired at the beam-to-tower
connections, i.e., fixed, hinged, etc.
6-12
TABLE 6.3 – DATA CREATED DURING MESH GENERATION
SCREEN
TITLE
TYPE OF OUTPUT
Joint Data
Joint numbers, coordinates, boundary conditions, and beam-chord
connection numbers
Member Data
Member numbers, section numbers, joint numbers, principle axis, unit
number, unit type, material yield stress, and member type
6-13
7 - METHODOLOGY
7.1
GENERAL
The methodologies of topics specifically related to the SABRE program are discussed in
this Chapter.
7.2
CALCULATION OF TORSIONAL CONCENTRATION STRESS FACTOR
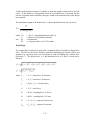
As described in Chapter 6, the program can calculate the torsional stress concentration
factor, Kt, for tubular members. For nonround tubular members the shear stress due to torsion is
constant about the periphery of the section with higher concentrations at the corners. Torsional
shear stress can be expressed as
T = K t T0 = K t
where
and
Kt
τ0
Mx
c
R
t
Mx
cR 2 t
(Eq. 7.1)
= stress concentration factor,
= average torsional stress,
= torsional moment about the local X-X axis,
= shape coefficient for the particular tube,
= tube radius to the midline of the wall,
= wall thickness.
All of these parameters, other than Kt, are defined easily during input or calculated during
analysis. The calculation of Kt, however, requires some effort.
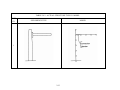
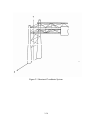
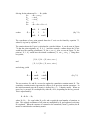
The calculation of Kt is taken from Reference 4 where the stress due to torsion at the
corner of a tubular member is given as
T=
where
and
T0 t ⎡1 − s (ra + ri ) / 4 A ⎤ T0 sr
+
A
2
ri ⎢⎣ log(ra / ri ) ⎥⎦
(Eq. 7.2)
τ0 and t are as previously defined,
ri
= inner corner radius,
= outer corner radius,
ra
r
= distance to the point of interest
= ri for maximum stress,
s
= tube perimeter to the midline of the wall,
A
= tube area to the midline of the wall.
These factors are illustrated in Figure 7.1. By relating equations 7.1 and 7.2, it can be
shown that
7-1
Kt =
T
t ⎡1 − s (ra + ri ) / 4 A ⎤ sri
= ⎢
+
T0 ri ⎣ log(ra / ri ) ⎥⎦ 2 A
When the sectional dimensions of a tubular member are imported into Screen 9, the
parameters D, t, and ri are read directly from the shape file. In order to calculate Kt, then, it is
necessary to first calculate ra, s, and A by
and
where
and
ra
s
A
= ri + t,
= 2·n·h,
= n·R·h,
n
D
R
t
h
= number of sides to the section,
= outside-to-outside diameter,
= ( D - t ) / 2,
= wall thickness,
= 360˚ / n,
= R sin Θ.
Knowing these values, Kt can be determined.
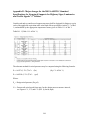
Examples
Several example problems have been performed for comparison with AASHTO Figure
1.3.1B(3).
In Example 1, a square tube with an outside-to-outside diameter of 50.25" (1276.4 mm),
a wall thickness of .25" (6.4 mm), and an inner corner radius of .25" (6.4 mm) is selected. So
English Units
and
n
D
t
ri
R
h
s
A
ra
=4
= 50.25"
= .25"
= .25"
= (50.25 - .25) / 2 = 25"
= 360˚ / 4 = 90˚
= 25 sin (90˚) = 25"
= 2 (4) (25) = 200"
= 4 (25) (25) = 2500 sq.in.
= .25 + .25 = .5"
Therefore,
7-2
Kt =
.25 ⎡1 − 200(.5 + .25) / 4(2500) ⎤ (200)(.25)
⎥ + 2(2500) = 1.4311
.25 ⎢⎣
log(.5 / .25)
⎦
Metric Units
n
D
t
ri
R
h
s
A
ra
=4
= 1276.4 mm
= 6.4 mm
= 6.4 mm
= (1276.4 - 6.4) / 2 = 635 mm
= 360o / 4 = 90o
= 635 sin (90o) = 635 mm
= 2 (4) (635) = 5080 mm
= 4 (635) (635) = 1612900 mm2
= 6.4 + 6.4 = 12.8 mm
Therefore,
Kt =
6.4 ⎡1 − 5080(12.8 + 6.4 ) / 4(1,612,900)⎤ (5080)(6.4 )
⎥ + 2(1,612,900) = 1.4311
6.4 ⎢⎣
log(.5 / .25)
⎦
From AASHTO Figure 1.3.1B(3), Kt is found to be about 1.44. The results for this and two
other examples can be found in Table 7.1. As can be seen in that table, the results compare
favorably. Note that the dimensions used in the examples are chosen for convenience only and
do not represent any real shapes.
7.3
MESH GENERATION
Special methods for this program to streamline the mesh generation process are described
in this section.
Joint Numbering
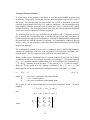
One of the primary functions of mesh generation is the creation of the joints and
members in such a manner as to minimize the size of the required stiffness matrix. In
programs which use the banded matrix method the size of the stiffness matrix is related
directly to the total number of degrees of freedom and the semi-band width. For space
frames, the size of the stiffness matrix is an N × NB array where,
N
NB
6
JKi
JJi
= total number of degrees of freedom
= semi-band width = 6 *JKi - JJi + 1* max,
= number of degrees of freedom per joint
= the joint number at the "right" member end
= the joint number at the "left" member end
7-3
and i
= 1 to the total number of members
As indicated by the max notation, NB is defined by the largest difference between the end
joint numbers for all members. It is evident, then, that to minimize the amount of
required memory, the maximum difference between the joint numbers at either end of a
member must be minimized for all members. A disadvantage of this method is that many
zero terms in the stiffness matrix are included within the bandwidth and, consequently,
are stored and operated on unnecessarily. SABRE, however, makes use of the "skyline"
method, a more efficient storage scheme where the zero terms outside of the skyline are
not used. The result is a method which is less sensitive to the joint numbering sequence
and, therefore, requires less memory and processing time. Detailed discussions of the
band width and skyline methods can be found in References 2 and 5, respectively.
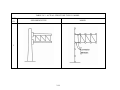
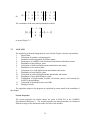
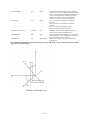
Despite the benefits in the use of the skyline method, it is still desirable to number the
joints in such a manner as to minimize the joint number differences. As an example, in
Figure 7.2, the maximum difference in the joint numbers of the diagonal members is
equal to 6 (7-1) for Alternate A and 3 (4-1) for Alternate B. Because it is desirable to
minimize these differences it is obvious that the numbering scheme used in Alternate B is
preferable. Alternate B will require a smaller stiffness matrix, less memory, and less
processing time. In SABRE this reasoning is expanded to cover all possible cases, which
can be summarized in the three following rules:
1.
2.
3.
The joints for a particular tower are numbered alternating from one post to the
other. See Table 2.2.
The joints for a particular beam are numbered in a rotating fashion from one
chord to the other. See Tables 2.3.1 and 2.3.2.
Structures which contain more than one tower or beam are numbered in a manner
that minimizes the differences in joint numbers at connection joints, where beam
chords are attached to tower posts. See Table 2.1.
The joints for all structural configurations and beam-tower combinations, then, are
automatically numbered using the preceding rules, whichever are applicable. The result
is reduced memory requirements and faster solution time.
SABRE Constructions
Because of the large number of different SABRE configurations available, a family of
subroutines was developed and they are used for all configurations. These subroutines
are used to define a basic structure which can be combined in various ways to form any
configuration.
The basic structure consists of a right-handed cantilevered tower-beam combination, as
seen in Table 7.2. The five available configurations can be constructed with all or part of
this structure. For instance, a single cantilevered beam SABRE (configuration 1) can be
formed from only one basic structure, as seen in Table 7.2. A single span type SABRE
can be formed with two structures, one right-handed and one left-handed, as seen in the
same table. Some configurations (3 and 4) make use of just the beam portion of the basic
7-4
structure as a component. Again, the advantage of this method is that only the
programming of the basic structure is required, thus reducing development time and
memory requirements for the program code.
SABRE Modeling
Another important consideration in mesh generation is the creation of a structural model
to represent the actual structure. A real sign bridge consists of a number of threedimensional elements (beams, plates, connections, etc.) which together act as a unit. In
this program, however, all elements are assumed to behave as beam elements.
Of particular concern are the special connections which attach the beam chord to the
tower post. For cantilevered structures (beams supported at only one end) connection
members are treated as rigid members with relatively high moments of inertia in order to
provide structural continuity and to avoid stability problems. U-bolts, hinges, etc. would
create stability problems in a cantilevered beam during analysis and so are not allowed.
The connections are given a special designation during generation to mark them as
connection members. For span type structures (beams supported at both ends)
connection members are treated as regular beam members; u-bolts, hinges, etc. may be
defined at the user's discretion. Tables 2.4.2 through 2.4.7 illustrate each of the six
SABRE types and the associated models.
7.4
SCREEN GRAPHICS
SABRE includes an extensive library of special graphics functions which allow for easy
data review. Several of these functions are discussed in this section.
Scaling
When initially displayed, the SABRE image is plotted at a scale that ensures it fits within
the screen limits. Scaling is accomplished by requiring that the ratio of the span length to
tower height of the image is the same as that of the actual structure. This is done
automatically within the program. The origin of the screen coordinate system is set at the
center of the computer screen and the structure is plotted so that it is centered about the
origin. If the structure is then rotated it will appear to rotate about a point at the screen
center.
Zooming
Any arbitrary part of the structure may be magnified for closer inspection by creating a
zoom window. A zoom window is created by defining the opposite corners of a
rectangular area on the screen. After these corners are defined, the portion of the
structure enclosed by the zoom window is rescaled in proportion to the window
dimensions so that it fills the entire screen. The enlarged structure can then be rotated,
zoomed again, etc. The structure can be returned to the unzoomed (original) scale at any
time with the touch of a key.
7-5
Viewing of Rotated Structure
A useful feature of the program is the ability to view the plotted SABRE structure from
an arbitrary viewpoint by rotating the structure about the system origin at the center of
the screen. The structure may be rotated about the vertical or horizontal screen axes
using the four keyboard arrow keys, left, right, up, and down. The left and right arrow
keys rotate the structure about the vertical screen axis, where a rotation to the right is
defined as positive. The up and down arrow keys rotate the structure about the horizontal
screen axis, where a rotation up is defined as positive.
The rotations about the two axes are defined by the angles y and x. Each time an arrow
key is pressed, the corresponding angle is redefined by the current angle increment (set
by the user) and the sign (positive or negative), each joint is mathematically rotated about
the associated axis, and the structure is replotted. It is important to emphasize that the
angles y and x are not cumulative values but, rather, incremental values measured from
the previous position.
The mathematical rotation of each joint is performed using a matrix transformation,
whereby the coordinates of the new joint are products of the old joint coordinates and a
rotation matrix. The two rotation axes have different associated matrices.
When a point in three dimensional space is rotated about the Y axis only the X and Z
coordinates are affected. For example, as can be seen in Figure 7.3, the point originally
at [ 1, Y, 0 ] and then rotated y radians about the Y axis would have the coordinates [cos
y, Y, -sin y]. Similarly, as seen in Figure 7.3, the point at [ 0, Y, 1 ] which is rotated y
about the Y axis would have the resulting coordinates [ sin y, Y, cos y ]. This
transformation can be represented by the multiplication of a vector and a 3 × 3 matrix
or
P Ry
where P
Ry
P´
= P´
(Eq. 7.3)
= the vector coordinates of the original point,
= a 3 x 3 rotation matrix,
= the vector coordinates of the rotated point.
The matrix Ry can be found using the two previously mentioned points. In matrix
notation,
[ 1, Y, 0 ] Ry = [ cos y, Y, -sin y ]
and
[ 0, Y, 1 ] Ry = [ sin y, Y, cos y ],
where
R11
R12
R13
R y = R21
R31
R22
R32
R23
R33
7-6
Solving for the unknowns R11 ..... R33 yields
R11
= R33 = cos γy
= -sin θy
R13
R31
= sin θy
R22
=1
R21
= R12 = R23 = R32 = 0,
so that
Ry =
cosθ y
0 − sin θ y
0
sin θ y
1
0
0
cosθ y
(Eq. 7.4)
The coordinates of any point rotated about the Y axis can be found by equation 7.3,
where Ry is given by equation 7.4.
The rotation about the X axis is calculated in a similar fashion. It can be seen in Figure
7.4 that the point originally at [ X, 0, 1 ] and then rotated x radians about the X axis
would have the resulting coordinates [ X, sin x, cos x]. Also, as seen in Figure 7.4, the
point at [ X, 1, 0 ] would have the rotated coordinates [ X, cos x, -sin x ]. Using these
two points,
[ X, 0, 1 ] Rx = [ X, sin x, cos x ]
and
[ X, 1, 0 ] Rx = [ X, cos x, -sin x ]
and solving, yields
1
0
R x = 0 cosθ x
0
− sin θ x
0 sin θ x
cosθ x
(Eq. 7.5)
The two matrices, Ry and Rx, are used to update the cumulative rotation matrix R. The
cumulative rotation matrix represents the effects of all previous rotation operations. In
the initial unrotated state the R matrix is defined by a 3 × 3 identity matrix. When an
arrow key is pressed, R is multiplied by either Ry or Rx, depending on the key pressed.
This is represented by
R = R1 R2 .... Rn,
where R1, R2, ... Rn equal either Ry or Rx and n equals the total number of rotations to
date. The original coordinates of all joints are multiplied by R, and replotted, each time
R is updated. When the structure is returned to the unrotated ("home") position, the R
matrix is reinitialized to an identity matrix.
7-7
Example
Say that the point [ 1, 1, 1 ] is to be rotated π/2 radians about the Y axis. If the point is
initially in the unrotated position then the cumulative R matrix before the rotation is
given by
1 0 0
R= 0 1 0
0 0 1
Rotation about the Y axis requires multiplication by Ry, where
cos π / 2 0 − sin π / 2
Ry =
0
sin π / 2
So,
1
0
0
0 0 −1
= 0 1
0
1 0
0
cos π / 2
0 0 −1 1 0 0
0 −1 0
R = 0 1 0 0 0 −1 = 0 0 −1
1 0 0 0 1 0
1 0
0
The coordinates of the rotated point then would be
0 0 −1
[1, 1, 1] 0 1 0 = [1, 1, − 1]
1 0
0
as seen in Figure 7.5. If the point is then rotated π/2 radians about the X axis another
matrix operation is required. Rotation about the X axis requires multiplication by Rx,
where
1
0
0
1 0
0
R x = 0 cos π / 2 − sin π / 2 = 0 0 − 1
0 sin π / 2 cos π / 2
0 1 0
7-8
0 0 −1 1 0
So,
R= 0 1
1 0
0
0 −1
0 0 0 −1 = 0
0 0 1 0
1
0
0
0
−1
0
The coordinates of the new rotated point then would be
0 −1 0
[1, 1, 1] 0 0 − 1 = [1,−1,−1]
1 0
0
as seen in Figure 7.5.
7.5
ANALYSIS
The operations performed during analysis were listed in Chapter 6 and are repeated here:
1.
Input of data.
2.
Calculation of member section properties.
3.
Formation and decomposition of stiffness matrix.
4.
Performance of AASHTO code checks and calculation of allowable stresses.
5.
Distribution of dead loads to joints.
6.
Calculation of dead load displacements and member end actions.
7.
Distribution of ice loads to joints.
8.
Calculation of ice load displacements and member end actions.
9.
Distribution of wind loads to joints.
10.
Calculation of wind load displacements and member end actions.
11.
Distribution of user-defined loads to joints.
12.
Combination of displacements, member end actions, stresses, and reactions for
AASHTO group loadings.
13.
Calculation of maximum stresses and CSRs.
14.
Printing of results.
The operations unique to the program are explained in greater detail in the remainder of
this chapter.
Section Properties
The section properties for tubular shapes are given in Table B-1 in the AASHTO
Specifications (Reference 1). The section properties for tapered members are calculated
from the average of the dimensions at the two ends of the member.
7-9
Dead Loads
Dead loads are automatically generated within the program by applying the member
weights to the corresponding joints. This is shown as:
DLi
where DLi
Ai
Li
and
DF
= Ai Li DF
= weight of ith member,
= 490 pcf (7849 Kg/m3) = unit weight of steel,
= cross sectional area of ith member,
= length of ith member,
= detail factor (connections, etc.).
Ice Loads
An ice loading with a default value of 3 psf (143.64 Pa) is applied to the surfaces of all
structural supports and on the face of all sign panels. An alternate ice load value may be
input at the user's discretion. The ice load may be applied to both sides of a sign or only
to one side.
Wind Loads
Wind loads, in accordance with AASHTO requirements, are generated automatically by
calculating the wind pressure on the structure elements. This can be shown as
Wi
Pi
Ai
Li
Kzi
Cdi
Ir,G,V
= Pzi Ai Li = wind load due to ith member, where Pzi = 0.00256 KziGV² IrCdi
= wind pressure on ith member,
= average area normal to axis of ith member,
= length of ith member,
= exposure factor of ith member (Table 3.5 of Reference 1 or 2.01(z/zg)2/α),
= Drag coefficient of ith member (Table 3.6 of Reference 1), and
= Importance Factor (Table 3-2 of Reference 1), Gust factor (maximum of 1.14)
and wind speed (Figure 3.2 of Reference 1).
Height coefficients are used to account for variation of wind velocity with respect to
height. If a member falls within more than one zone then a weighted average is used.
For example, if a member with a length of 20 ft (6.096 m) has 16.4 ft (5.0 m) which fall
into a zone with a coefficient of 0.87 and 3.6 ft (1.096 m) which falls into a zone with a
coefficient of 0.94 then the average coefficient is calculated to be
English Units - (0.87) (16.4/20) + (0.94) (3.6/20) = 0.88.
Metric Units - (0.87)(5.0/6.096) + (0.94)(1.096/6.096) = 0.88
Pressure due to wind loading is applied to the face of the sign but not to members which
are shielded over more than 65% of their area. For members with less than 35% shielded,
7-10
the entire member is assumed to be completely exposed. If one member is shielded by
another then the drag coefficients are modified in accordance with Ref. 1. The drag
coefficients for the signs are also taken from Ref. 1.
Wind areas for tapered members are taken on the average area of the member normal to
the wind direction.
User-Defined Loads
In addition to the automatically calculated wind, dead, and ice loads the user has the
capability to define arbitrary joint loads. These loads may be forces in the X, Y, or Z
directions or moments about the X-X, Y-Y, or Z-Z axes. Joint loads are always applied
in the global direction.
Live Loads
Optional walkway live loads can be defined at the user's discretion. The magnitude of
the load is input as well as the load's location on the structure. The live load is then
distributed to the structure via the VAMs. Because walkways are not considered
structural elements, the effect of the live load on the walkway is not checked.
Joint Loads
The forces due to the wind, dead, and ice loads are distributed to the joints under the
assumption that the members are simply supported. Fixed-end moments are not
considered; it is assumed that the moments will cancel internally over the length of the
unit. The appropriate shear components, determined by the direction cosines, are applied
to the corresponding degrees of freedom. The various loads are combined in accordance
with AASHTO requirements, as summarized in Table 7.3, and the maximum effects
calculated for each member individually.
Structural Analysis
The method employed for structural analysis is that of the general stiffness method for
three-dimensional frames. This method is described in detail in Reference 2 and assumes
the following:
1)
2)
3)
4)
Linearly elastic material.
Small deformations.
No shear deformations.
6 kinematic degrees of freedom at each joint 1 axial, 2 shears, 2 moments, and 1 torsion.
See Figure 7.6.
7-11
Special Members
Special members, such as connections, have been created in order to make the structural
model complete. These special members are simplified representations of complex
assemblages so stress results and code checks are not performed. Connection members
are required to ensure structural continuity. A high moment of inertia is assigned
automatically to represent their relatively high stiffness compared to that of the adjacent
members.
Other special members are the VAMs and the horizontal members which compose the
walkways and lighting support units. These are not considered structural elements, only
as attachment points and dead load sources.
Stress Analysis
As part of the analysis procedure, SABRE performs a complete stress analysis of the
structural members of the structure. This analysis is described as follows:
Allowable Member Stresses
Allowable stresses are required in the computation of the Combined Stress Ratio
(CSR) of each member. The allowable stresses are a function of the member's
usage (tower element, truss element, etc.), stress condition (tension or
compression), effective length, and cross sectional properties. The equations used
are taken from Reference 1 and are summarized in Tables 7.4 through 7.6.
Member Unit Stresses
The unit stress in a member is found by performing a complete stress analysis for
each loading condition. The loading resulting in the largest stress for that member
is then used for all subsequent computations. The specific formulas used in the
stress computations for the various shapes are given in Table B-1 in Reference 1.
Interaction Relationships
The combined effects of moment, shear, and axial stresses are considered with the
CSR interaction equations. These are given in Reference 1 and are summarized in
Tables 7.5.1 and 7.5.2. The AASHTO specifications require that all members be
designed so that their individual CSRs are less than or equal to one. This
requirement restricts the member stress to less than that of the material yield
stress divided by some safety factor.
7.6
BASE PLATE DESIGN
7-12
The program can calculate the quantities and dimensions of certain details pertaining to
column base plates when given the following data:
1.
2.
3.
Yield stresses - bolts, base plate, and welds
Column parameters - outside diameter, wall thickness, and shape (round, square,
etc.)
Base forces - X, Y, and Z directions
4.
5.
Base moments - about the X-X, Y-Y, and Z-Z axes
AASHTO governing load combination (DL, DL+W, etc.)
Given this data, the program calculates the following:
1.
2.
3.
Anchor bolts - quantity, diameter, area, separation, and embedment length
Weld - throat and leg lengths
Base plate - shape, diameter, and thickness
It is important to note that the design is based on finding a minimally sized plate and that
it is up to the design engineer to verify the suitability of the results. The methodology for each of
these is described in the following:
Data Entry
The column parameters, base forces, and base moments can be entered by hand or
imported from an output file. When imported from an output file the results yielding the
most conservative design are used. This is governed by the following rules:
1.
2.
Column parameters are taken from the largest column in the structure.
Base Forces - Base shears, Vx and Vz, are taken from the largest shear reactions
found for all
AASHTO load combinations - i.e. [*Vx* + *Vz*]max.
3.
4.
Base axial force, Vy, is taken from the smallest axial force found for all load
combinations.
Base Moments - Base biaxial moments, Mx and Mz, are taken from the largest
moment reactions of all AASHTO combinations - i.e. [*Mx* + *Mz*]max. Base
torsion, My, is taken from the largest torsional reaction found for all load
combinations.
Governing Load Combination - The load combination resulting in the largest base
reactions is used.
Anchor Bolt Calculation
7-13
Design of the base plate anchor bolts is an iterative process which starts with a minimum
number of bolts (four) and proceeds through a series of calculations until either an
acceptable design is found or a maximum number of bolts (eight) is exceeded. Each time
an unacceptable design is found the number of bolts is incremented by two and the
process is repeated.
According to Reference 1, anchor bolts subject to combined shear and tension loads may
be proportioned using
Fv2 > fv² + (k ft)²
where fv
ft
k
Fv
Ft
= V / Ab = actual bolt shear stress,
= P / Ab = actual bolt tensile stress,
= Fv / Ft = combined shear/tension constant,
= 0.30 Fy = allowable bolt shear stress,
= 0.50 Fy = allowable bolt tensile stress,
V =
(V x + Vtx )2 + (V z + Vtz )2
Vx
Vz
Vtx
Vtz
= shear in X direction,
= shear in Z direction,
= shear in X direction due to torsion,
= shear in Z direction due to torsion,
P=
Mx + Mz
Bc Bn / 2
−
Vy
Bn
= actual shear,
= actual bolt tension, ignore Vy term if in compression.
or 50% of the maximum column allowable load
and
Mx
Mz
Vy
Ab
Bc
Bn
Fy
= moment about X axis,
= moment about Z axis,
= axial force,
= bolt area,
= bolt separation, (or opposite bolt distance, i.e. column diameter + 6”)
= number of bolts,
= bolt yield stress.
As can be seen, the total shear force on a bolt, V, is found considering the shear forces in
both the X and Z directions as well as the shear due to torsion. The total tensile force on
a bolt, P, is found considering biaxial bending, Mx and Mz, as well as the axial force, Vy.
These reactions are illustrated in Figure 7.7.
7-14
A three-inch separation distance is initially set from the outside column wall to the bolt
center. If this distance is subsequently found to be insufficient it is increased and the
process is repeated until a satisfactory design is found or the assumed limits of the design
are exceeded.
The embedment length of an anchor bolt, L, is based upon bond stress and is given by
L=
P
135πDb ( SF )
where 135
f´c
and
Db
SF
= .045 f'c = allowable bond stress (Ref. 6),
= 3000 psi (20.684 MPa) (assumed),
= bolt diameter.
= 1 for group load 1 and 1.33 for others.
Weld Design
The column-plate connection is made with a continuous fillet weld which is designed for
shear. The force on the weld is found by uniformly distributing all reactions (forces and
moments) to equivalent forces per unit length of weld and finding the resultant force
(Reference 7). The design force, fr, is the maximum force of f1 and f2, which can be
shown as
f1 =
( f vx + f t )2 + ( f vz + f t )2 + ( f a + f bz + f bx )2
f2 =
( f vxz )2 + ( f mxz )2
where fvx
= Vx/C = shear force, X direction,
fvz
= Vz/C = shear force, Z direction,
ft
= My Dc / 2 Jw = torsional force,
fa
= Vy/C = axial force,
fbx
= Mx/Sw = bending force, X-X axis,
fbz
= Mz/Sw = bending force, Z-Z axis,
fvxz
= fvc * Ac / C = capacity of shear force,
fmxz
= fbc * Sc / Sw = capacity of moment,
7-15
and
fvc
= 0.33 * fyc * SF (safety factor) * 0.5
fbc
= 0.66 * fyc * SF (safety factor) * 0.5
C
= weld length = column circumference,
Dc
= column outside diameter,
Ac
= area of column,
Sc
= section modulus of column,
Jw
= polar moment of inertia per unit length,
Sw
= section modulus per unit length.
The weld dimensions are found from
and
Wl
= fr / (.707 Fw) = leg length
Wt
= .707 Wl = throat length,
where Fw
= allowable weld stress.
The calculated weld dimensions are checked against minimum and maximum AISC
requirements, Reference 8. If the dimensions are found to be not in accordance with
AISC requirements then the dimensions are adjusted accordingly.
Plate Design
Shape of the base plate depends on the number of anchor bolts required; four bolts
require a square plate, 6 bolts require a hexagonal plate, and eight bolts an octagonal
plate.
Size of the plate is based on the diagonal separation distance of the bolts plus an
additional five inches of clearance to the plate edge.
Thickness of the plate is governed by bending along the critical section shown in Figure
7.7. The effective width of the plate at that point along the critical section is given by
English Units
B = 2d X − (Db + .25)
-- - - for square, hexagonal, octagonal
where d = 2.5 inches,
X = 1 for Square plate, ≅ 2 for Hexagonal, = tan 67.5 for Octagonal
7-16
and
Db + .25 = bolt hole diameter.
B = Π Bc / Bn - (Db + .25)
- - - for round
Metric Units
B = 2 d X − ( D b + 6. 4 )
- - - for square, hexagonal, octagonal
where d = 63.5 mm
X = 1 for Square plate, ≅ 2 for Hexagonal, = tan 67.5 for Octagonal
and
Db + 6.4 = bolt hole diameter.
B = Π Bc / Bn - (Db + 6.4)
- - - for round
Plate thickness is found from
where S
Me
e
and
Fb
t = 6S / B
= Me / Fb = required section modulus,
= P e = moment due to eccentricity,
= (Bc - Dc - 2 Wl) / 4 = eccentricity,
= .66 Fy = allowable bending stress of plate.
Eccentricity, e, is measured to the assumed point of contraflexure located midway
between the bolt and the outside edge of the weld.
For all of the preceding, the allowable values are increased by 40% for load combinations
including wind effects, in accordance with AASHTO recommendations.
7.7
FATIGUE CHECK
The SABRE program can do fatigue check for cantilevered steel and aluminum sign structures
when importing the following data from the fatigue file:
1.
2.
Base moment ranges – about X-X and Z-Z axes; and
Column parameters – outside diameter, wall thickness, and cross section shape.
The user also needs to provide the following data:
1.
2.
Base plate parameters – bolt diameter, bolt thread pitch, farthest bolt diameter to
the center and number of bolts; and
Stiffener parameters – height, width, thickness and total number.
Given these data, the program calculates the following:
1.
2.
3.
4.
Anchor bolt stress range;
Stress range at column-to-baseplate connection;
Stress range at stiffener-to-baseplate connection; and
Stress range at termination of stiffener.
7-17
Base Moment Range Calculation
Three types of loading (galloping, natural wind gust and truck-induced gust) should be
considered for cantilevered steel and aluminum sign structures based upon the new (5th edition)
AASHTO Standard Specifications for Structural Supports for Highway Signs, Luminaries and
Traffic Signals.
Galloping
Overhead cantilevered sign structures shall be designed for galloping-induced cyclic loads by
applying an equivalent static shear pressure vertically to the surface area as viewed in normal
elevation of all sign panels. The magnitude of this vertical shear pressure range shall be equal to
the following:
PG = 1000 ⋅ I F (Pa )
PG = 21 ⋅ I F (psf )
(Metric Units)
(English Units)
where IF is the importance factor applied to limit state wind load effects to adjust for the desired
level of structural reliability.
Natural Wind Gust
Cantilevered overhead sign structures shall be designed to resist an equivalent static natural wind
gust pressure range of
PNW = 250C d I F (Pa )
PNW = 5.2C d I F (psf )
(Metric Units)
(English Units)
Where Cd is the wind drag coefficient specified in Table 3-6 (AASHTO Specifications).
The design natural wind gust pressure range is based on a yearly mean speed of 5 m/s (11.2
mph). For locations with more detailed wind records, particularly sites with higher wind speeds,
the natural wind gust may be modified.
Truck-Induced Gust
Overhead sign structures shall be designed to resist an equivalent static truck gust pressure range
of
PTG = 900C d I F (Pa )
PTG = 18.8C d I F ( psf )
(Metric Units)
(English Units)
The equivalent static truck pressure range may be reduced for locations where vehicle speeds are
less than 30 m/s (65 mph).
7-18
7.8
Fatigue Design Examples for Highway Sign Details
This section deals with the fatigue design of connections used for highway sign structures and
luminaries. Some excel templates have been prepared for this paper. Following is a description
of each sheet.
a. Built-up box
Description: This consists of two small gussets fillet welded to the main member which are
connected to a main gusset plate. Another gusset plate with mast arm connected to it is bolted
with the main gusset. The connections and diagrams are described as Details # 5, 17 and 19 in
NCHRP report 469, pg 11-15, Table 11-2. Diagram is given on pg 11-21. For above
calculations, NCHRP report 469, pg B14 is used as reference.
Maximum Permissible Stress: The maximum permissible CAFL (Constant-Amplitude Fatigue
Limit) for the welded connection as per Detail 19 is corresponding to category ‘ET’ and Detail
17 to category E’. Hence the stress induced should be less than 1.2 ksi and 2.6 ksi for steel
connection categories ‘ET” and E’, respectively. For bolted connections, as per Detail 5, the
category is ‘D’ and the CAFL is 7 ksi.
b. Fillet welded tube-to-tube pass through connection
Description: This connection consists of two tubes. A stub passes through the column and it is
welded along the perimeter on both sides of the column. The connections and diagrams are
described as Details # 18 and 19 (pass-through & no-pass-through fillet welded tube-to-tube
connections, respectively) in NCHRP report 469, pg 11-15, Table 11-2. The diagram is given on
pg 11-21 (Example 9). For above calculations, NCHRP report 469, pg B75 is used as reference.
Maximum Permissible Stress: As per the note f, pg11-17 in the NCHRP report, stresses at the
bottom of the connection should be checked. The maximum permissible CAFL at the bottom of
the column is corresponding to category E. Hence the stress should be less than 4.5 ksi. For the
stub, the CAFL should be less than permitted in category E’ for detail 18 for pass-through (or ET
for Detail 19 for no pass-through). Hence the stress should be less than 2.6 ksi for Detail #18 (or
1.2 ksi for Detail #19.)
c. Fillet welded socket connection
Description: This connection is used for base plate – column connection. The plate has a hole
equal to the external diameter of the column with some clearance. The column and plate are
welded from inside and from outside as shown in the figure. The connections and diagrams are
described as Detail # 16 (fillet welded connection) in NCHRP report 469, pg 11-15, Table 11-2.
Diagram is given on pg 11-20 (Example 7). For the above calculations, NCHRP report 469, pg
B94 is used as reference.
7-19
Maximum Permissible Stress: The maximum permissible CAFL for the connection corresponds
to category E’. Hence the stress calculated should be less than 2.6 ksi. For the bolts, CAFL
corresponds to category D. Hence the stress induced should be less than 7 ksi.
d. Reinforced handhole connection
Description: In case of a column with a handhole, with width and the length as ‘W’ and ‘Lh‘, it
has to be checked whether the dimensions of hole are in permissible limit or not. The
connections and diagrams are described as Detail # 20 in NCHRP report 469, pg 11-15, Table
11-2. Diagram is given on pg 11-20.
For above calculations, NCHRP report 469, pg B94 is used as reference.
Maximum Permissible Stress: To calculate the maximum permissible stress, the limitations given
in NCHRP report pg11-15 should be referred. Depending on the dimensions of the hole, the
stress category may be C, D or E (10 ksi, 7 ksi or 4.5 ksi, respectively.) The stress category
depends on length of hole and thickness of column. This excel sheet calculates the stress
category and hence the permissible stress automatically depends on the input.
e. Slotted tube-to-gusset connection
Description: This connection consists of a main member attached to a stub through a gusset
plate. Gusset plate slides into the slot in the stub and then it is welded. The connections and
diagrams are described as Details # 15 and 24 in NCHRP report 469, Pg 11-15, Table 11-2.
Diagrams are given on pgs 11-20 and 23.
Maximum Permissible Stress: The maximum permissible CAFL at the connection between stub
and the gusset plate (Detail #15) corresponds to category E’. Hence the stress should be less than
2.6 ksi. For the connection between main member and column, the stress category depends on R
(Detail #24 of category D of 7 ksi with R > 2” and E of 4.5 ksi with R ≤ 2”, respectively.) This
sheet calculates the stress category and corresponding CAFL as described in pg11-16 of NCHRP
report.
f. Stiffened base plate
Description: This consists of a base plate stiffened by stiffener pates. Column is connected to
base plate through stiffener plates. Base plate is connected to abutments through anchor bolts.
Anchor bolt stress calculation and permissible stress in anchor bolts are similar to sheet #3 hence
it is not discussed again in this document. In case of stiffener plate connections, the connections
and diagrams are described as Details # 12, 21 and 23 in NCHRP report 469, pg 11-15, Table 112. Diagrams are given on pgs 11-22 and 23.
Maximum Permissible Stress: The maximum permissible CAFL at the connection between
column and stiffener group corresponds to category E’ (Detail #12). Hence the CAFL should not
exceed 2.6 ksi. The maximum permissible CAFL at the connection between stiffener plate and
base plate corresponds to category C and it should not exceed 10 ksi (Detail #23). The maximum
7-20
permissible stress at the termination of stiffener plate corresponds to category E’ and should not
exceed 2.6 ksi (Detail #21).
7-21
TABLE 7.1 – COMPARISONS OF CALCULATED AND TABLE VALUES OF Kt
Kt
CALC. AASHTO
PROB.
NO.
SHAPE
NO. OF
SIDES
OUTER
DIAM.
WALL
THICK.
INNER
RAD.
1
Square
4
50.25
.25
.25
1.43
1.44 ±
2
Octagonal
8
16.92
.25
.50
1.20
1.20 ±
3
Dodecagonal
12
5.25
.25
.75
1.05
1.06 ±
7-22
TABLE 7.2 – SIGN BRIDGE CONSTRUCTIONS
Configuration
STRUCTURE
COMPONENTS
1
Basic
Structure
2
3
4
5
7-23
TABLE 7.3 – AASHTO GROUP LOAD COMBINATIONS
GROUP
LOADS
% ALL.
STRESS
1
DL
100
2
DL + W
133
3
DL + ½ W +
ICE
133
4
FATIGUE
See Note
DESCRIPTION AND LOAD COMBINATION
Case 1:
(Detail Factor) × (Member Weight) only.
Case 1: Dead load + wind in the +z direction
with wind combination 1
(100% normal + 20% transverse
components)
Case 2: Dead load + wind in the +z direction
with wind combination 2
(60% normal + 30% transverse
components)
Case 3: Dead load + wind in the –z direction
with wind combination 1
(100% normal + 20% transverse
components)
Case 4: Dead load + wind in the –z direction
with wind combination 2
(60% normal + 30% transverse
components)
Ice loads assumed acting on all exposed surfaces of
all members other than signs. Ice loads assumed
acting only on one face of signs.
Galloping, natural wind gust and truck-induced gust
considered for cantilevered steel and aluminum sign
structures.
Note: See Section II (AASHTO SPECIFICATIONS) fro fatigue loads and stress range limits.
7-24
TABLE 7.4.1 – ALLOWABLE UNIT STRESS RELATIONSHIPS
STRES
S TYPE
EQUATIO
N ID
EQUATION
RANGE
Tensile
0.60 Fy
Gross area Ag
A1
0.50 Fu
Effective area Ae
Compres.
12π 2 E
Axial
Fa
A2
A3
⎛ KL ⎞
23⎜
⎟
⎝ r ⎠
2
⎡ (KL r )2 ⎤
⎢1 −
⎥ Fy
2
2
C
c
⎣
⎦
3
5 3(KL r ) (KL r )
+
−
3
8Cc
8Cc3
KL ⎡ 2π 2 E ⎤
≥⎢
⎥
r
⎢⎣ Fy ⎥⎦
= Cc
KL ⎡ 2π 2 E ⎤
<⎢
⎥
r
⎢⎣ Fy ⎦⎥
= Cc
COMMENTS
1
1
2
2
Untrussed
pole type
tower
members
All tower
members
except untrussed poles.
All other
primary and
secondary
members.
Reference 1,
Note: Case 1: Vertical support (pole type), K is assumed as 2.0 by the program
Case 2: Vertical support (truss type), K is assumed as 1.2 by the program
Case 3: Horizontal supports (pole and truss type), K is assumed as 0.65 by the program
Case 4: All secondary members, K is assumed as 0.65 by the program
7-25
TABLE 7.4.2 – ALLOWABLE UNIT STRESS RELATIONSHIPS
STRESS EQUATION
TYPE
ID
B1
EQUATION
RANGE♦
0.66 Fy
λ ≤ λp
⎡
⎛ E ⎞⎤
⎢ 0.09⎜ Fy ⎟ ⎥
⎝
⎠ ⎥ 0.39 F
⎢1 +
y
D
⎥
⎢
t
⎥⎦
⎢⎣
⎡
⎛ E ⎞⎤
⎢ 0.09⎜ Fy ⎟ ⎥
⎝
⎠ ⎥ 0.39 F
⎢1 +
y
D
⎥
⎢
t
⎥⎦
⎢⎣
B2
B3
Bending
( )
λ p < λ ≤ λr
( )
λ > λr
⎡
⎢
a 2 Fy ⎢1 −
⎢
⎣
⎡
⎢
a 4 Fy ⎢1 −
⎢
⎣
B5
B6
Tube
Hexdecagonal
Dodecagonal
Octagonal
Rectangular
λ ≤ λp
a1 Fy
a1
0.66
0.65
0.64
0.60
⎤
b⎥
⎥
t⎥
E
Fy ⎦
⎤
a5 b ⎥
⎥
t⎥
E
Fy ⎦
a3
a2
1.71
1.15
0.96
0.82
Round
Compact
Tubes
Round
Noncompact
Tubes
Fb
B4
COMMENTS
Polygonal
Compact
Tubes
λ p < λ ≤ λr
Polygonal
Noncompact
Tubes
λ > λr
a3
0.55
0.39
0.30
0.24
a4
0.74
0.75
0.73
0.74
a5
0.23
0.22
0.19
0.19
♦ See TABLE 5-3 of 2009 AASHTO “Standard Specifications for Structural Supports for
Highway Signs, Luminaires and Traffic Signals”
7-26
TABLE 7.4.3 – ALLOWABLE UNIT STRESS RELATIONSHIPS
STRESS
TYPE
EQUATION
ID
V1
EQUATION
RANGE
⎛ E
D
≤ 1.16⎜
⎜F
t
⎝ y
0.33 Fy
COMMENTS
⎞
⎟
⎟
⎠
2
3
Round Tubes
0.41E
3
V2
⎛D⎞
⎜ ⎟
⎝ t ⎠
V3
0.33 Fy
⎛ E
D
> 1.16⎜
⎜F
t
⎝ y
2
Shear
Fv
⎞
⎟
⎟
⎠
2
3
b
E
≤ 2.23
t
Fy
Polygonal Tubes
V4
1.64 E
(b / t )2
b
E
> 2.23
t
Fy
V5
0.33 Fy
h
E
≤ 2.23
tw
Fy
7-27
Other shapes
TABLE 7.5.1 – INTERACTION EQUATIONS
COMPONENT
Pole Type Tower
Member,
Untrussed
Trussed Tower
Member
Trussed Tower
Member
EQUATION
ID.
Compres.
I1
Compres.
I2
Tensile
I3
CSR
COMMENTS
fa
f
⎡f ⎤
+ b +⎢ v ⎥
.6 F y C A Fb ⎣ Fv ⎦
fa
fb
+
+
Fa (1 − f a / Fa )Fb
2
CA = Coeff. Of
Amplification
See Ref. 1
[ ]
fv 2
Fv
Sect. Stabil.
π 2E
Fa = .52
(K 1 / r ) 2
Overall Stab.
K =2
fa
f
⎡f ⎤
+ b +⎢ v ⎥
.6 F y C A Fb ⎣ Fv ⎦
2
7-28
FIGURE
TABLE 7.5.2 – INTERACTION EQUATIONS
COMPONENT
EQUATION
ID.
Horizontal and
inclined truss
support members
Compres.
Horizontal and
inclined truss
support members
Tensile
I4
I5
CSR
COMMENTS
fa
fb
⎡f ⎤
+
+⎢ v ⎥
Fa (1 − f a / Fa )Fb ⎣ Fv ⎦
fa
f
⎡f ⎤
+ b +⎢ v ⎥
.6 F y Fb ⎣ Fv ⎦
2
2
7-29
Fa = .52
π 2E
(K 1 / r ) 2
where K = ¾
FIGURE
Figure 7.1 Torsional Factors
7-30
Figure 7.2 Example of Possible Joint Numbering Schemes
7-31
Figure 7.3 Example Rotation about Y Axis
7-32
Figure 7.4 Example Rotation about X Axis
7-33
Figure 7.5 Example Rotation about Y and X Axes
7-34
Figure 7.6 Space Frame Member Numbering System
7-35
Figure 7.7 Base Plate Design Factors
7-36
Appendix A – Input Screens
A-1
A.1 System Input
Data Type 01012, 01022 – Project Data
ITEM
UNIT FORMAT
DESCRIPTION
DESCRIPTION
none
alphanumeric
Enter the project description, location, or any other
pertinent information
DATE
none
alphanumeric
Enter the date of the data entry
CONTRACT NUMBER
none
alphanumeric
Enter the project contract number
STRUCTURE NUMBER
none
alphanumeric
Enter the structure identification number
STRUCTURE UNIT
none
alphanumeric
Enter the structure unit number
DESIGNED BY
none
alphanumeric
Enter the designer’s name
CHECKED BY
none
alphanumeric
Enter the name of the person who checked the input data
SPECIFICATION
none
alphanumeric
Enter the project specification number
A-2
Data Type 01032 – Program Options
ITEM
UNIT FORMAT
DESCRIPTION
OUTPUT LEVEL
none
integer
Enter 1 if the basic level of output is desired;
Enter 2 if the basic level of output plus additional detail is
desired.
TYPE OF UNIT
none
integer
Enter 0 for English Units;
Enter 1 for Metric Units.
MATERIAL ID
none
integer
Enter 0 for Steel;
Enter 1 for Aluminum.
Enter 2 for Steel Posts and Aluminum Span
MODULUS OF ELASTICITY
none
integer
Default 206,850 Mpa (30,000 ksi) for steel
Default 68,950 Mpa (10,000 ksi) for aluminum
ALUMINUM TYPE ID
none
integer
Enter 1 for 6061-T651
Enter 2 for 6061-T6
Enter 3 for 6063-T6
Enter 4 for 6065
Enter 5 for 5086-H34
Enter 6 for 6061-T651/T6 welded
Enter 7 for 6063-T6 welded
Enter 8 for 6005-T6 welded
Enter 9 for 5086-H34 welded
6061 – T6 WELDED W/4043
ALLOY FILLER WIRE
none
integer
Enter 0 for no; Enter 1 for yes
A-3
A.2 Structure Generation Input
Data Type 21000 – Configuration
ITEM
UNIT FORMAT
DESCRIPTION
CONFIGURATION
none
To select a configuration, click the mouse to the desired
choice. The current configuration is highlighted with a
bright color. A configuration must be chosen if automatic
joint and member generation is desired.
A-4
Data Type 31000 – Element Definition
ITEM
UNIT FORMAT
DESCRIPTION
CHORDS
none
integer
Enter one of the following numbers:
1 – monotube
2 – plane truss
3 – tri-chord truss
4 – box truss
SEGMENTS
none
integer
Enter the number of segments desired in each beam chord
or tower post. For a span type beam (i.e., supported by a
tower on each end) only an even number of segments are
allowed. No more than 16 segments are allowed for a
span type beam chord.
POSTS
none
integer
Enter one of the following numbers:
1 – single post;
2 – two trussed posts
A-5
Data Type 34000 – Dimensions
ITEM
UNIT
FORMAT
DESCRIPTION
BEAM LENGTH
feet(m)
real
BEAM ELEV.
BEAM DEPTH
feet(m)
feet(m)
real
real
CONNECTION LENGTH
feet(m)
real
TOP ELEV.
feet(m)
real
BOT. ELEV.
feet(m)
real
TOWER WIDTH
feet(m)
real
LAST BRACE
feet(m)
real
FIRST BRACE
feet(m)
real
For a cantilevered beam, enter the length of the beam,
measured from the center of the supporting tower to the
end of the beam. For a span beam enter the length of the
beam, measured from the centers of both, measured from
the centers of both supporting towers.
Enter the elevation of the lowest chord of the beam.
Enter the depth of the trussed beam; i.e., the distance
between the highest chord(s) and the lowest chord(s).
Enter the length of the connection member which attaches
the beam chord(s) to the tower post(s). This length
should not exceed 2.5ft (.76m) for accurate results. For a
trussed tower with two posts, this value may equal 0. For
all other structures, this value must exceed 0.
Enter the elevation of the top of the tower. For a trussed
tower with two posts, both posts will be assumed to have
the same top elevation.
Enter the elevation of the bottom of the tower. For a
trussed tower with two posts, both posts will be assumed
to have the same bottom elevation.
Enter the width of the trussed tower(s); i.e., the distance
between the from post and the rear post.
Enter the vertical distance from the bottom of the beam to
the point below where the tower bracing is to end.
Enter the vertical distance from the base of the tower to
the point above where the tower bracing is to begin.
A-6
Data Type 33000 – Cross Sections
ITEM
UNIT FORMAT
DESCRIPTION
CROSS SECTION
none
Enter the section number (from Screen “Definition of
Sections”).
integer
A-7
Data Type 38000 – Bracing
ITEM
UNIT FORMAT
DESCRIPTION
FRONT PATTERN
none
integer
Front truss face
TOP PATTERN
none
integer
Top truss face
REAR PATTERN
none
integer
Rear truss face
BOTTOM PATTERN
none
integer
Bottom truss face
PERP. SECTION
none
integer
Enter the section number (from Screen “Definition of
Sections”), which defines the cross section properties for
the truss members attached perpendicularly to the main
members. (Only tubular sections are allowed for
perpendicular members.)
DIAG. SECTION
none
integer
Enter the section number (from Screen “Definition of
Sections”), which defines the cross section properties for
the truss members attached diagonally to the main
members. (Only tubular sections are allowed for diagonal
members.)
PATTERN, TOWER
none
integer
Tower bracing
1 – Pratt truss
2 – Pratt truss reversed
3 – Warren truss
4 – Warren truss reversed
Note: If there is no perpendicular member for any pattern,
leave perpendicular section blank.
A-8
Data Type 39000 – Yield Stresses (Steel only)
ITEM
UNIT FORMAT
DESCRIPTION
TOWER YIELD STRESS (MAIN
MEMBER)
ksi
(Mpa)
real
Enter the material yield stress for the main (primary)
members of the tower.
TOWER YIELD STRESS (PERP.
BRACING)
ksi
(Mpa)
real
Enter the material yield stress for the bracing members
attached perpendicularly to the main members of the
towers.
TOWER YIELD STRESS (DIAG.
BRACING)
ksi
(Mpa)
real
Enter the material yield stress for the bracing members
attached diagonally to the main members of the towers.
BEAM YIELD STRESS (MAIN
MEMBER)
ksi
(Mpa)
real
Enter the material yield stress for the main (primary)
members of the beams.
BEAM YIELD STRESS (PERP.
BRACING)
ksi
(Mpa)
real
Enter the material yield stress for the bracing members
attached perpendicularly to the main members of the
beams.
BEAM YIELD STRESS (DIAG.
BRACING)
ksi
(Mpa)
real
Enter the material yield stress for the bracing members
attached diagonally to the main members of the beams.
A-9
Data Type 04012 – Definition of Sections
ITEM
UNIT
FORMAT
DESCRIPTION
STANDARD SECTION NO.
none
alphanumeric
Enter W for a wide flange section, or L for an angle.
This data is for information purposes only and its input
is optional
STANDARD SECTION DEPTH
inch (mm)
integer
Enter the nominal depth of the section. This data is for
information purposes only and its input is optional.
STANDARD SECTION
WEIGHT
lb/ft
integer
Enter the nominal weight of the section. This data is
for information purposes only and its input is optional.
TUBULAR SHAPE I.D. NO.
none
integer
Enter one of the following cross section numbers:
2 – round cross section
3 – dodecagonal cross section
4 – octagonal cross section
5 – square cross section
999 – connection
TUBULAR OUTSIDE DIAM.
inch (mm)
real
Enter the outside diameter of the tubular cross sections.
TUBULAR WALL THICK(TW)
inch (mm)
real
Enter the wall thickness of the tubular section.
TORSIONAL STRESS
none
real
Enter the torsional stress concentration factor for the
particular cross section. This value may be inputted
directly or calculated by the program upon leaving the
[Sections] screen.
GENERAL SECT. I.D. NO.
none
integer
Enter one of the following cross section numbers:
6 – rectangular cross section (or cruciform)
7 – angle cross section
8 – channel (currently unavailable)
9 – W cross section
10 – Z cross section
GENERAL SECT. WEIGHT
kip/ft(KN/m)
real
Enter the weight per unit foot for the general section.
S1, S2, S3, S4, S5
PARAMETERS
inch (mm)
real
Enter the S1, S2, S3, S4, S5 parameters.
A-10
Data Type 07012 – VAMS
ITEM
UNIT
FORMAT
DESCRIPTION
VAM SECTION I.D. NUMBER
none
integer
Enter the desired section number (from Screen
“Definitions of Sections”) for the vertical attachment
member (VAM). Only general sections are allowed
(angles, WF’s, and Z’s). A vertical attachment member
is a member which attaches a sign to the sign structure.
TOP VAM X-COORDINATES
feet (m)
real
Enter the x-coordinate of the top of the vertical
attachment member. The x-coordinate of the VAM
cannot coincide with the x-coordinate of any joint, as
defined in Screen “Definition of Joints”.
TOP VAM Y-COORDINATES
feet (m)
real
Enter the y-coordinate of the top of the vertical
attachment member.
TOP VAM Z-COORDINATES
feet (m)
real
Enter the z-coordinate of the top of the vertical
attachment member.
LENGTH
feet (m)
real
Enter the length of the vertical attachment member.
SUPPORTING MEMBERS
none
integer
Enter the member numbers (from Screen “Definition of
Members), which support each vertical attachment
member.
Supporting members are generated by Mesh.
ATTACHED SIGN UNITS
none
integer
Enter the sign numbers (from Screen “Sign Data”),
which are supported by each vertical attachment
member.
WALKWAY UNITS
none
integer
Enter the walkway numbers (from Screen
“Walkways”), which are supported by each vertical
attachment member.
A-11
Data Type 09012 – Signs
ITEM
UNIT
FORMAT
DESCRIPTION
SIGN WIDTH
feet (m)
real
Enter the width of the sign panel.
SIGN HEIGHT
feet (m)
real
Enter the height of the sign panel.
SIGN THICKNESS
inch (mm)
real
Enter the thickness of the sign panel.
SLOPE
in/ft (mm/m)
real
Enter the slope of the sign panel horizontal (parallel to
the z-axis) per foot (meter) vertical (parallel to the yaxis).
DENSITY
k/cg (Kg/m3)
real
Enter the density of the sign material. The value of
0.175 k/cf (2803 Kg/m3) is the density for aluminum
signs.
X-COORDINATE
feet (m)
real
Enter the x-coordinate of the lower left corner of the
sign panel.
Y-COORDINATE
feet (m)
real
Enter the y-coordinate of the lower left corner of the
sign panel.
Z-COORDINATE
feet (m)
real
Enter the z-coordinate of the lower left corner of the
sign panel.
SIGN DRAG COEFFICIENT
none
real
Enter the overridden sign drag coefficient (SCD).
(Internally set SCD for W/H ≤ 1, SCD = 1.12;
1 < W/H ≤ 2, SCD = 1.19; 2 < W/H ≤ 5, SCD = 1.2;
5 < W/H ≤ 10, SCD 1.23; 10 < W/H ≤ 15, SCD = 1.3)
A-12
A.3 Structure Lookup Input
Data Type 03012 – Definition of Joints
ITEM
UNIT
FORMAT
DESCRIPTION
X-COORDINATES
feet (m)
real
Y-COORDINATES
feet (m)
real
Z-COORDINATES
feet (m)
real
X-AXIS TRANSLATION
none
integer
Y-AXIS TRANSLATION
none
integer
Z-AXIS TRANSLATION
none
integer
X-X AXIS ROTATION
none
integer
Y-Y AXIS ROTATION
none
integer
Z-Z AXIS ROTATION
none
integer
Enter the x-coordinate of the point in space for the
corresponding structure joint.
Enter the y-coordinate of the point in space for the
corresponding structure joint.
Enter the z-coordinate of the point in space for the
corresponding structure joint.
Enter 0 if the joint is not supported against translation
in the x direction; Enter 1 if the joint is supported
against translation in the x direction.
Enter 0 if the joint is not supported against translation
in the y direction; Enter 1 if the joint is supported
against translation if the y direction.
Enter 0 if the joint is not supported against translation
in the z direction; Enter 1 if the joint is supported
against translation in the z direction.
Enter 0 if the joint is not support against rotation about
the x-x axis ; Enter 1 if the joint is supported against
rotation about the x-x axis.
Enter 0 if the joint is not supported against rotation
about the y-y axis; Enter 1 if the joint is supported
against rotation about the y-y axis.
Enter 0 if the joint is not supported against rotation
about the z-z axis; Enter 1 if the joint is supported
against rotation about the z-z axis.
A-13
Data Type 05012 – Definition of Members
ITEM
UNIT
FORMAT
DESCRIPTION
SECTION, FROM
none
integer
SECTION, TO
none
integer
JOINTS, FROM
none
integer
JOINTS, TO
none
integer
ANGLE
degree
real
If this cell is for a primary member (part of a unit) and
the member is the first member in that unit (exists at the
J-end of the unit) then enter the section number (from
Screen “Definition of Sections”) for the J-end of the
unit. If this cell is for a secondary member (not part of
a unit) then simply enter the section number for the Jend of the member.
If this cell is for a primary member (part of a unit) and
the member is the last member in that unit (exists at the
K-end of the unit) then enter the section number (from
Screen “Definition of Sections”) for the K-end of the
unit. All intermediate cells between the cell defining
the unit J-end and the unit K-end must be left blank.
The program will interpolate the section properties for
the intermediate members. If this cell is for a
secondary member (not part of a unit) then simply enter
the section number from the K-end of the member.
Enter the joint number (from Screen “Definition of
Joints”) of the J-end of the member
Enter the joint number (from Screen “Definition of
Joints”) of the K-end of the member
Enter the angle defining the principal axis of the cross
section. Refer to the figure below For tubular sections
this angle may be ignored since any axis is a principal
axis.
For wide flange or other sections, the default angle is
the strong axis along the Z axis (out of plane). For the
calculation of the allowable, changing angle will affect
the stress calculation but not the post KL/r computation
where the program assumes the strong axis as r with the
total height as L and K of 1.2 to calculate the allowable.
This can be used for majority of the case since the weak
axis is usually the direction of the tower’s post(s). If
not, user may use the optional screen to enter their own
desired allowable.
A-14
UNIT NUMBER
none
integer
Enter the unit member (starting with 1) in which the
member exists. A unit is a major continuous structural
member made up of smaller members defined between
joints. This cell should be left blank for secondary
members. See Table 2.5 in the User Manual for
definitions of primary and secondary members.
Enter 1, if interior truss members for boxed and
trichords;
Enter 2, if exterior truss member for boxed and
trichords;
Enter 3, if main vertical members (towers);
Enter 4, if truss members for tower units.
UNIT TYPE
none
integer
METERIAL YIELD (Fy)
ksi (MPa)
real
Enter the yield stress for the member material. See
Screen 8 for the yield stress default values.
MEMBER TYPE
none
integer
STRESS CAT
none
Alphanumeric
Enter the member identifier. Blank or “0” is assuming a
fixed-end member. “14” is assuming a truss member.
For other member types, see Table 2.13.
Fatigue stress category at the joint. For details, see
Appendix A2.
Note: Members and joints are generated by Mesh. User may add, delete or alter members and joints on their
respective screens after Mesh.
Definition of Principal Axis
A-15
A.4 Options Input
Data Type 01042 – Parameters
ITEM
UNIT
FORMAT
DESCRIPTION
WIND VELOCITY
mph (m/s)
real
MEAN REGULAR INTERVAL
years
integer
GUST FACTOR
none
real
ICE LOADS
psf (KPa)
real
ICE LOAD OPTIONS
none
integer
TRUSS BRACING OPTIONS
none
integer
DEAD LOAD DETAIL
FACTOR
none
real
WIND IMPORTANCE
FACTOR
YEARLY MEAN VELOCITY
FOR NATURAL WIND GUST
none
real
Enter the annual extreme wind velocity at 30’ (9.144 m)
above the ground surface. The default value of 80 mph
(128 Kmph) is based upon a 50-year recurrence interval
for all overhead sign structures in Maryland.
Enter the mean recurrence interval for wind velocity.
This data is optional and is used only as a label.
Enter the factor by which all wind levels will be
multiplied to account for gust effects. Regular method
– 1.14 (4th or 5th ed.), alternate method in Spec.
Appendix C – 1.69 (5th ed. only). This information is
optional.
Enter the value of the ice load which is to be applied to
the surface of the structural supports and to one face of
the sign panels. The default value is 3 psf (143.6 KPa).
Enter 0 if the ice load is to be considered only on one
side of the signs. Enter 1 if the ice load is to be
considered on both sides of the signs.
Default or “0” is Moment Bracing by assuming all
braced members are fixed at both ends. Enter “1” for
Truss Bracing by assuming truss action for all braced
members.
Enter the factor by which the structure dead load is
multiplied to account for the weight of connections,
bolts, etc.
Default = 1.0, see AASHTO Table 3-2.
mps (m/s)
real
VEHICLE SPEED FOR
TRUCK-INDUCED GUST
mps (m/s)
real
FATIGUE IMPORTANCE
FACTOR OPTIONS
IMPORTANCE FACTORS
(GALLOPING, NATURAL
WIND, TRUCK - INDUCED
GUST)
none
none
Enter the yearly mean velocity. The default value of
11.2 mph (5 m/s) is a reasonable upper-bound of yearly
mean wind velocities for most locations in the country.
Enter the vehicle speed. The default value of 65 mph
(30 m/s) wind to approximately coincide with existing
vehicle speed limit.
AASHTO 4th Ed. I & II, 5th Ed. Cantilever I & II, NonCantilever, I & II.
Enter the value of the importance factors. Importance
factors are introduced into the specifications to adjust
the level of structural reliability of cantilevered support
structures. Please see user manual Appendix B, Table
B-1.1 (Table 11-1 of Ref. 1)
real
A-16
Data Type 10012 – Additional Joint Loads
ITEM
UNIT
FORMAT
DESCRIPTION
JOINT NUMBER
none
integer
Enter the joint number (from Screen “Definition of
Joints”) where the load is to be applied
LOAD TYPE
none
integer
Type of added load (0 or blank = Dead load, 1 = Wind
load, 2 = Ice load, 3 = Galloping – Y only, 4 = Natural
wind gusts – Z only, 5 = Truck gusts – Y only.
For load types 3, 4 and 5, enter force range on their
designated direction only.
DESCRIPTION
none
alphanumeric
Enter a description of the load (e.g., ICE, SPEC1, etc.).
FORCES, X
kip (KN)
real
Enter concentrated force that is to be applied to the joint
in the x-direction.
FORCES, Y
kip (KN)
real
Enter concentrated force that is to be applied to the joint
in the y-direction.
FORCES, Z
kip (KN)
real
Enter concentrated force that is to be applied to the joint
in the z-direction.
MOMENTS, X-X
k-ft (KN-m)
real
Enter the concentrated moment that is to be applied to
the joint about the x-x axis.
MOMENTS, Y-Y
k-ft (KN-m)
real
Enter the concentrated moment that is to be applied to
the joint about the y-y axis.
MOMENTS, Z-Z
k-ft (KN-m)
real
Enter the concentrated moment that is to be applied to
the joint about the z-z axis.
Note: Dead, wind and ice loads will be generated by the program internally. These are additional loads other
than default.
A-17
Data Type 08012 – Walkways
ITEM
UNIT
FORMAT
DESCRIPTION
WALKWAY NO.
none
integer
X-COORDINATE END, LEFT
X-COORDINATE END, RIGHT
LOAD TYPE, DL
feet (m)
feet (m)
none
real
real
integer
LOAD TYPE, ICE
none
integer
LOAD TYPE, LL
none
integer
UNIFORM LOAD
klf (KN/m)
real
Z-COORDINATE
feet (m)
real
WIND AREA
ft2/ft (m2/m)
real
Y-COORDINATE
feet (m)
real
Enter the walkway number for the load type under
consideration. If more than one load type is to be
applied to a particular walkway, each load type must be
defined separately and on different lines.
Enter the x-coordinate of the left end of the walkway.
Enter the x-coordinate of the right end of the walkway.
Enter a [1] to indicate the presence of a uniform dead
load on the walkway. If you enter a [1] in this column
and also wish to apply an additional ice or live load to
the walkway, you must enter the additional load on
another line.
Enter a [1] to indicate the presence of a uniform ice
load on the walkway. If you enter a [1] in this column
and also wish to apply an additional dead or live load to
the walkway, you must enter the additional load on
another line.
Enter a [1] to indicate the presence of a uniform live
load on the walkway. If you enter a [1] in this column
and also wish to apply an additional dead or ice load to
the walkway, you must enter the additional load on
another line.
Enter the intensity of the uniform load applied to the
walkway.
Enter the z-coordinate of the location of the resultant of
the uniform load.
Enter the area in the z-direction which defines the wind
on the walkway.
Enter the y-coordinate of the centroid of the wind area.
A-18
Data Type 01052 – Connections
ITEM
UNIT
FORMAT
DESCRIPTION
CONNECTION JOINTS
none
integer
Enter the number of each structure joint where a beam
is connected to a tower. Normally, this information is
created by the program when the joints and members
are generated; therefore, the manual entry of the data is
not required.
A-19
Data Type 09112 – Height Coeff.
ITEM
UNIT
FORMAT
DESCRIPTION
HEIGHT
feet (m)
integer
Enter the height (upper or lower limit) for the
corresponding wind coefficient. The heights must be in
ascending order from the bottom of the screen to the top
of the screen.
COEFFICIENT (Ch)
none
real
Enter the height coefficient for the corresponding upper
and lower heights.
HEIGHT COEFFICIENT
none
- 3rd edition
- 4th /5th edition (default)
A-20
Data Type 40000 – Hinges
ITEM
UNIT
FORMAT
DESCRIPTION
HINGES
none
integer
Enter [1] if a hinge (moment release) is desired about
the structure y-y axis at the corresponding beam end or
the structure z-z axis at the corresponding beam end.
Enter [0] (or space) if a hinge is not desired. This data
will be used to model bolts during mesh generation for
span-type beams only. Cantilevered beams will not be
affected.
A-21
Data Type 06012 – Member Option
ITEM
UNIT
FORMAT
DESCRIPTION
MEMBER NO.
none
integer
Enter member number (from screen “Definition of
Members) where default values to be overridden.
WIND DATA
SHIELD ID
none
integer
(Shield ID = 1 shielding on the –Z direction; = 2
shielding on the +Z direction; = 3 no shielding; = 4 both
shielding)
WIND DATA
WIND DRAG
COEFFICIENT
none
real
Override the AASHTO specified values Cd (internally
set by the shape of the member see AASHTO
specification Table 3-6)
WIND DATA
HEIGHT
COEFICIENT
none
real
Override the AASHTO specification values Ch (as set
on Screen “Height Coefficient”)
AXIAL TENSION
ALLOWABLE Ft
Ksi (MPa)
real
As per AASHTO Specifications (See Chapter 7)
AXIAL COMPRESSION
ALLOWABLE Fa
Ksi (MPa)
real
As per AASHTO Specifications (See Chapter 7)
BENDING ALLOWABLE Fb
Ksi (MPa)
real
As per AASHTO Specifications (See Chapter 7)
SHEAR ALLOWABLE Fv
Ksi (MPa)
real
As per AASHTO Specifications (See Chapter 7)
EFFECTIVE LENGTH K
FACTOR
none
real
The default factors: For single vertical post case, K =
2.0; For double vertical post with truss member
connected, K = 1.2, Chords and truss members, K =
0.65
A-22
A.5 Post-Processing Input Screens
Splice Plate Design Parameters
ITEM
UNIT
FORMAT
DESCRIPTION
ENGLISH/S.I. UNIT
none
integer
Enter the English or SI unit used in this design.
BOLT YIELD STRESS
PLATE YIELD STRESS
CHORD YIELD STRESS
ksi (MPa)
ksi (MPa)
ksi (MPa)
real
real
real
Enter the yield stress for the splice plate anchor bolts.
Enter the yield stress for the splice plate.
Enter the yield stress for the chord.
CHORD OUTSIDE DIAM.
in (mm)
real
CHORD WALL THICKNESS
in (mm)
real
CHORD SHAPE I.D. NO
none
integer
JOINT FORCE,
X DIRECTION
JOINT FORCE,
Y DIRECTION
JOINT FORCE,
Z DIRECTION
JOINT MOMENT,
X-X AXIS
JOINT MOMENT,
Y-Y AXIS
JOINT MOMENT,
Z-Z AXIS
ALLOWABLE WELD STRESS
kips (KN)
real
kips (KN)
real
kips (KN)
real
k-ft (KN-m)
real
k-ft (KN-m)
real
k-ft (KN-m)
real
kis (MPa)
real
Enter the outside diameter of the chord at the level of
the chord at the desired joint.
Enter the wall thickness of the chord at the desired
joint.
Enter one of the following tubular shape numbers:
2 – round cross section
3 – dodecagonal cross section
4 – octagonal cross section
5 – square cross section
Enter the shear reaction force at the desired joint. The x
direction refers to the structure global axis.
Enter the axial force at the desired joint. The y
direction refers to the structure global axis.
Enter the shear force at the desired joint. The z
direction refers to the structure global axis.
Enter the moment about the x-x axis at the desired joint.
The x-x refers to the structure global axis.
Enter the moment about the y-y axis at the desired joint.
The y-y refers to the structure global axis.
Enter the moment about the z-z axis at the desired joint.
The z-z refers to the structure global axis.
Enter the allowable stress for the weld connecting the
column to the splice plate to the chord.
A-23
GROUP LOAD NO.
none
integer
SPLICE PLATE SHAPE
none
integer
DESIRED NO. OF BOLTS
none
integer
JOINT NUMBER
none
integer
COEFFICIENT
none
A-24
Enter the applicable group load number associated with
the forces and moments entered previously. Refer to
Table 3-1 in the AASHTO Standard Specs. for
Structural Supports for Highway Signs, Luminaries and
Traffic Signals.
Enter the shape number (as defined above for the chord
shape)
Enter number of bolts desired by the user. If nothing is
input, program will design the number of bolts. Note:
Number of bolts should be an even number.
Enter the number of the joint on the beam where the
splice will be located. A splice can be located only at a
joint.
Select 3rd Edition or 4th Edition-Default.
Base Plate Design Parameters
ITEM
UNIT
FORMAT
DESCRIPTION
Enter the English or SI unit used in this design.
Enter the yield stress for the base plate anchor bolts.
Enter the yield stress for the base plate.
Enter the yield stress for the column
Enter the outside diameter of the column at the level of
the base plate.
Enter the wall thickness of the column at the level of
the base plate.
Enter one of the following tubular shape numbers:
2 – round cross section
3 – dodecagonal cross section
4 – octagonal cross section
5 – square cross section
Enter the shear reaction force at the column base. The
x direction refers to the structure global axis.
Enter the axial force at the column base. The y
direction refers to the structure global axis.
Enter the shear force at the column base. The z
direction refers to the structure global axis.
Enter the moment about the x-x axis at the column
base. The x-x refers to the structure global axis.
Enter the moment about the y-y axis at the column
base. The y-y refers to the structure global axis.
Enter the moment about the z-z axis at the column base.
The z-z refers to the structure global axis.
Enter the allowable stress for the weld connecting the
column to the base plate.
Enter the applicable group load number associated with
ENGLISH/S.I. UNIT
BOLT YIELD STRESS
BASE PLATE YIELD STRESS
COLUMN YIELD STRESS
COLUMN OUTSIDE DIAM.
none
ksi (MPa)
ksi (MPa)
ksi (MPa)
in (mm)
integer
real
real
real
real
COLUMN WALL THICKNESS
in (mm)
real
COLUMN SHAPE I.D. NO
none
integer
BASE FORCE,
X DIRECTION
BASE FORCE,
Y DIRECTION
BASE FORCE,
Z DIRECTION
BASE MOMENT,
X-X AXIS
BASE MOMENT,
Y-Y AXIS
BASE MOMENT,
Z-Z AXIS
ALLOWABLE WELD STRESS
kips (KN)
real
kips (KN)
real
kips (KN)
real
k-ft (KN-m)
real
k-ft (KN-m)
real
k-ft (KN-m)
real
kis (MPa)
real
GROUP LOAD NO.
none
integer
A-25
BASE PLATE SHAPE
none
integer
DESIRED NO. OF BOLTS
none
integer
the forces and moments entered previously. Refer to
Table 1.2.6 in the AASHTO Standard Specs. for
Structural Supports for Highway Signs, Luminaires and
Traffic Signals.
Enter the shape number (as defined above for the
column shape)
Enter number of bolts desired by the user. If nothing is
input, program will design the number of bolts. Note:
Number of bolts should be an even number.
Note: Minimum 6 bolts for cantilever structures.
Minimum 4 bolts for overhead bridge structures.
COEFFICIENT
Select 3rd Edition or 4th Edition-Default.
none
A-26
Base Plate Fatigue Check
ITEM
UNIT
FORMAT
DESCRIPTION
ENGLISH/SI UNIT
BASE MOMENT RANGE
X-X AXIS
BASE MOMENT RANGE
Z-Z AXIS
COLUMN OUTSIDE DIAM.
none
K-ft (KN-m)
integer
real
K-ft (KN-m)
real
in (mm)
real
COLUMN WALL THICKNESS
in (mm)
real
COLUMN SHAPE ID. NO.
none
integer
BASE PLATE SHAPE
none
integer
BASE PLATE BOLT DIAM
BASE PLATE BOLT THREAD
PITCH
BOLT CIRCLE DIAMETER
DISTANCE
NO. OF BOLT
STIFFENER HEIGHT
STIFFENER WIDTH
STIFFENER THICKNESS
NO. OF STIFFENER
COLUMN-TO-BASE PLATE
CONNECTION
in (mm)
in (mm)
real
real
Enter the English or SI unit used in the design
Enter the moment range about the x-x axis at the
column base
Enter the moment range about the x-x axis at the
column base
Enter the outside diameter of the column at the level of
the base plate.
Enter the wall thickness of the column at the level of
the base plate.
2 – round cross section
3 – dodecagonal cross section
4 – octagonal cross section
5 – square cross section
Enter the shape number (as defined above for the
column shape)
Enter the bolt diameter for the base plate
Enter the bolt thread pitch
in (mm)
real
Enter the diameter distance for the bolt circle
none
in (mm)
in (mm)
in (mm)
none
none
integer
real
real
real
integer
integer
Enter number of bolts desired by the user.
Enter the height of the stiffener
Enter the width of the stiffener
Enter the thickness of the stiffener
Enter number of stiffeners desired by the user
1-Groove-Welded Tube-to-Transverse Plate
Connection
2-Fillet-Welded Socket Connection
A-27
Appendix A2 – Presentation and Calculation of Fatigue Combine Stress Ratio
User has the option of overriding the predefine stress categories as defined in Table A-2.1 and
demonstrated in Figure A-2.1 or enter their own stress categories on input screen for ‘Definition
of Members’, Data Type 05012. (Input has to be after MESH command. Otherwise, input will
be emptied.) Stress categories as defined in Table A-2.2 are allowed and their corresponding
constant-amplitude fatigue limits are utilized by the program. Calculation of fatigue combined
stress ratio (FCSR) is shown below:
1. Close section (2-round, 5-square,…sections)
2. Open section (7-angle, 8-ST,…sections)
ೌ ାට್ೣ మ ା್ మ
ிೞೝ
ೌ ା್ೣ ା್
ிೞೝ
Where Fsr = Allowable stress range based on tables above.
Table A-2.1- Predefined detail locations with their respective stress categories:
Type
Category
Detail No. and Description
Post End
E'
16. Fillet-welded tube-to-transverse
plate connections
16. Fillet-welded tube-to-transverse
8, 16
plate connections
16. Fillet-welded tube-to-transverse
8, 16
plate connections
19. Fillet-welded T-,Y-, and K-tube10,11
to-tube, angle-to-tube, or plate-to-tube
connections.
Cantilever type – Post-to- E'
chord connection
Span type - Post-to-chord E'
connection
Truss-to-post or truss-to- E
chord connection
A2‐1 AASHTO
Examples
7
Table A--2.2 – Constaant-amplitudde fatigue lim
mits
Stress Category
A
B
B′ (inpput as B1)
C
D
E
E' (inpput as E1)
E
ET
K
Steel
ksi
24
16
12
10
7
4.5
2.6
1.2
1
Aluminum
m
ksi
10.2
6
4.6
4
2.5
1.9
1
0.44
0.38
Stresss category E - Truss-to-ppost or
truss--to-chord connnection Stresss category E'
E - Post-to-chhord
conneections (bothh span- and
Cantiilever-types
Stresss category E'
E - Post End Figure A-2.1
A
- Predefined detail locations wiith their resppective stresss categories
A2‐2 Appendix B - Major changes for the 2009 AASHTO “Standard
Specifications for Structural Supports for Highway Signs, Luminaries
and Traffic Signals” 5th Edition.
Cantilevered and no cantilevered support structures shall be designed for fatigue to resist
each of the applicable equivalent static wind load effects specified in Article 11.7 of Ref.
1, and modified by the appropriate importance factors given in Table 11.1 of Ref.1.
Table B-1.1 (Table 11-1 of Ref. 1)
The alternate method for wind pressures may be computed using the following formula:
Pz = 0.0473 (1.3Vm)2CdCh
Pz = 0.00256 (1.3Vm)2CdCh
(Pa)
(Eq. C-1 of Ref. 1)
(psf)
Where:
Pz = Design wind pressure (Pa, psf)
Vm = Fastest-mile wind speed from map, for the design mean recurrence interval,
see Figures C-1, C-2, and C-3 (Ref. 1) (km/h, mph)
B-1
Appendix C – Output Tables
C-1
TABLE C.1 – LIST OF OUTPUT TABLES
TABLE
NO.
OUTPUT
PHASE
1.1
Input.
Verif.
1.2
OUTPUT TABLE TITLE
OUTPUT
LEVEL
Input Verification
Definition of Joints
1, 2
“
Definition of Sections
1, 2
1.3
“
Definition of Members
1, 2
1.4
“
Definition of Vertical Attachment Members
1, 2
1.5
“
Definition of Walkways and Conduits
1, 2
1.6
“
Definition of Signs
1, 2
1.7
“
Coefficients of Height
1,2
1.8
“
Joint Load Data
1, 2
General Data
2.1
“
General Member Data
1, 2
2.2
“
General Member Data
1, 2
Dead Load Data
3.1
Analysis
General Dead Load Information
1, 2
Wind Load Data
4.1
“
4.2
“
4.3
“
4.4
“
4.5
Analysis
General Wind Load Information
Group II Wind Load Joint Loads for Combination 1 in
the +Z direction.
Group II Member-End-Actions for Wind Combination
1 in the +Z direction.
Group II Wind Load Joint Loads for Combination 2 in
the +Z direction.
Group II Member-End-Actions for Wind Combination
2 in the +Z direction.
C-2
1, 2
2
2
2
2
TABLE C.2 – LIST OF OUTPUT TABLES
TABLE
NO.
OUTPUT
PHASE
4.6
“
4.7
“
4.8
“
Group II Wind Load Joint Loads for Combination 2 in
the –Z direction.
2
4.9
“
Group II Member-End-Actions for Wind Combination
2 in the –Z direction.
2
4.10
“
Group III Wind Load Joint Loads for Combination 1 in
the +Z direction.
2
4.11
“
Group III Member-End-Actions for Wind Combination
1 in the +Z direction.
2
4.12
“
Group III Wind Load Joint Loads for Combination 2 in
the +Z direction.
2
4.13
“
Group III Member-End-Actions for Wind Combination
2 in the +Z direction.
2
4.14
“
Group III Wind Load Joint Loads for Combination 1 in
the –Z direction.
2
4.15
“
Group III Member-End-Actions for Wind Combination
1 in the –Z Direction.
2
4.16
“
Group III Wind Load Joint Loads for Combination 2 in
the –Z direction.
2
4.17
“
Group III Member-End-Actions for Wind Combination
2 in the –Z direction.
2
OUTPUT TABLE TITLE
Group II Wind Load Joint Loads for Combination 1
in the –Z direction.
Group II Member-End-Actions for Wind Combination
1 in the –Z direction.
OUTPUT
LEVEL
2
2
Ice Load Data
5.1
“
General Ice Load Information
5.2
“
Ice Load Joint Loads
2
5.3
“
Member-End-Actions for Ice Loading
2
6.0
---
Not Used.
---
C-3
1, 2
TABLE C.3 – LIST OF OUTPUT TABLES
TABLE
NO.
7.0
OUTPUT
PHASE
--Not Used.
OUTPUT TABLE TITLE
OUTPUT
LEVEL
---
Group Joint Loads
Joint Loads for Group I:
DL
2
“
Joint Loads fro Group II:
DL + W (Wind Combination 1 in the +Z direction)
2
8.3
“
Joint Loads for Group II:
DL + W (Wind Combination 2 in the +Z direction)
2
8.4
“
Joint Loads for Group II:
DL + W (Wind Combination 1 in the –Z direction)
2
8.5
“
8.6
“
8.7
“
8.8
“
8.9
“
8.1
Analysis
8.2
Joint Loads for Group II:
DL + W (Wind Combination 2 in the –Z direction)
Joint Loads for Group III:
DL + ICE + .5W (Wind Combination 1 in the +Z
direction)
Joint Loads for Group III:
DL + ICE + .5W (Wind Combination 2 in the +Z
direction)
Joint Loads for Group III:
DL + ICE + .5W (Wind Combination 1 in the –Z
direction)
Joint Loads for Group III:
DL + ICE + .5W (Wind Combination 2 in the –Z
direction)
2
2
2
2
2
Joint Displacements
9.1
“
Joint Displacements for Group I:
DL
2
9.2
“
Joint Displacements for Group II:
DL + W (Wind Combination 1 in the +Z direction)
2
C-4
TABLE C.4 – LIST OF OUTPUT TABLES
TABLE
NO.
OUTPUT
PHASE
9.3
Analysis
Joint Displacements for Group II:
DL + W (Wind Combination 2 in the +Z direction)
2
9.4
“
Joint Displacements for Group II:
DL + W (Wind Combination 1 in the –Z direction)
2
9.5
“
9.6
“
9.7
“
9.8
“
9.9
“
9.10
“
OUTPUT TABLE TITLE
Joint Displacements for Group II:
DL + W (Wind Combination 2 in the –Z direction)
Joint Displacements for Group III:
DL + ICE + .5W (Wind Combination 1 in the +Z
direction)
Joint Displacements for Group III:
DL + ICE + .5W (Wind Combination 2 in the +Z
direction)
Joint Displacements for Group III:
DL + ICE + .5W (Wind Combination 1 in the –Z
direction)
Joint Displacements for Group III:
DL + ICE + .5W (Wind Combination 2 in the –Z
direction)
Maximum Joint Displacements
OUTPUT
LEVEL
2
2
2
2
2
1, 2
Group Load Member-End-Actions
10.1
“
Member-End-Actions for Group I:
DL
2
10.2
“
Member-End-Actions for Group II:
DL + W (Wind Combination 1 in the +Z direction)
2
10.3
“
Member-End-Actions for Group II:
DL + W (Wind Combination 2 in the +Z direction)
2
10.4
“
Member-End-Actions for Group II:
DL + W (Wind Combination 1 in the –Z direction)
2
C-5
TABLE C.5 – LIST OF OUTPUT TABLES
TABLE
NO.
OUTPUT
PHASE
10.5
Analysis
10.6
“
10.7
“
10.8
“
10.9
“
OUTPUT TABLE TITLE
Member-End-Actions for Group II:
DL + W (Wind Combination 2 in the –Z direction)
Member-End-Actions for Group III:
DL + ICE + .5W (Wind Combination 1 in the +Z
direction)
Member-End-Actions for Group III:
DL + ICE + .5W (Wind Combination 2 in the +Z
direction)
Member-End-Actions for Group III:
DL + ICE + .5W (Wind Combination 1 in the –Z
direction)
Member-End-Actions for Group III:
DL + ICE + .5W (Wind Combination 2 in the –Z
direction)
OUTPUT
LEVEL
2
2
2
2
2
Tower Member Stress Information
11.1
Code
Check
11.2
Tower Member Details
1, 2
“
Tower Member Allowables at 100% (Group 1)
1, 2
11.3
“
Tower Member Allowables at 133% (Groups 2 + 3)
1, 2
11.4
“
Combined Stresses in Tower Members
1, 2
Truss Member Stress Information
12.1
“
Truss Member Details
1, 2
12.2
“
Truss Member Allowables at 100% (Group 1)
1, 2
12.3
“
Truss Member Allowables at 133% (Groups 2 + 3)
1, 2
12.4
“
Combined Stresses in Truss Members
1, 2
C-6
TABLE C.6 – LIST OF OUTPUT TABLES
TABLE
NO.
OUTPUT
PHASE
OUTPUT TABLE TITLE
OUTPUT
LEVEL
Support Reactions
13.1
Code
Check
13.2
Support Reactions for Group I:
DL
1, 2
“
Support Reactions for Group II:
DL + W (Wind Combination 1 in the +Z direction)
1, 2
13.3
“
Support Reactions for Group II:
DL + W (Wind Combination 2 in the +Z direction)
1, 2
13.4
“
Support Reactions for Group II:
DL + W (Wind Combination 1 in the –Z direction)
1, 2
13.5
“
13.6
“
13.7
“
13.8
“
13.9
“
Support Reactions for Group II:
DL + W (Wind Combination 2 in the –Z direction)
Support Reactions for Group III:
DL + ICE + .5W (Wind Combination 1 in the +Z
direction)
Support Reactions for Group III:
DL + ICE + .5W (Wind Combination 2 in the +Z
direction)
Support Reactions for Group III:
DL + ICE + .5W (Wind Combination 1 in the –Z
direction)
Support Reactions for Group III:
DL + ICE + .5W (Wind Combination 2 in the –Z
direction)
C-7
1, 2
1, 2
1, 2
1, 2
1, 2
TABLE C.7 – LIST OF OUTPUT TABLES
TABLE
NO.
OUTPUT
PHASE
20.1
Code
Check
20.2
20.3
OUTPUT TABLE TITLE
OUTPUT
LEVEL
Moment and Stress Range due to Galloping
1.2
“
Moment and Stress Range due to Natural Wind Gusts.
1.2
“
Moment and Stress Range due to Truck Gusts
1.2
C-8
Appendix D – Error and Warning Messages
D-1
TABLE D.1 – Error Message
LEVEL
ERROR
NO.
Data Entry
104
ERROR MASSAGE
REMEDY
No Library Loaded
Load a shape file from the
LIBRARY selection of the pulldown menu.
106
Type of Shape File Not
Recognized
All shape file must have either
“ROU”, “DOD”, “OCT”,
“SQU” or “WF” in the file
name.
“
108
Unable to Calculate Stress
Factor! Data Missing.
Make sure that the diameter and
thickness of the section being
imported have positive values.
“
110
Decimal Point Required
Input a decimal point in the
current cell.
“
115
File Name Required
Input a valid file name.
“
“
120
Not a Valid Sign Bridge File
Input either the name of a new
data file or the name of an
existing SIGN BRIDGE data
file.
“
122
Not a Valid Sign Bridge
Output File
Input the name of an existing
SIGN BRIDGE output file saved
under the current directory.
“
125
Can’t Find Directory
Enter the path to an existing
directory on a valid drive.
“
130
Can’t Find Any Shape Files in
LIBRARY.LST
The file names of all shape files
must be entered in
LIBRARY.LST.
“
134
VAM No. x Coincides with a
Joint
Mover the X coordinate of VAM
x so that it does not coincide
with the X coordinate of a joint.
D-2
TABLE D.2 – ERROR MESSAGES
LEVEL
ERROR
NO.
ERROR MASSAGE
Mesh
Generation
160
Error Generating Joints and/or
Members
Review all input data for
omissions or invalid data
“
162
Joints and Members Must be
Generated First
Generate joints and members
before proceeding
“
166
Number of Generated Joints
>X
Reduce the number of tower
and/or beam segments.
“
167
Number of Generated Member
>X
Reduce the number of tower
and/or beam segments.
“
168
Yield Stress Missing
Input yield stresses for all
element types.
“
169
Element Number Missing
Input the number of beam
chords and tower posts.
“
171
Segment Number Missing
Input the number of segments
for each beam and tower.
“
172
Beam Segments Must Be an
Even Number
Span-type beams must have an
even number of segments to
ensure symmetry about midspan.
“
173
Tower Segments Exceed 16
Reduce the number of tower
segments.
“
REMEDY
Reduce the number of beam
segments.
174, 175 Beam Segments Exceed x
“
176
Beam Length Cannot Equal 0
Input valid lengths for all beams
“
177
Connection Length Cannot
Equal 0
Input valid lengths for all
connections.
178
Tower Top Elevation Must Be
Above Tower Bottom
Either increase the elevation of
the top of the tower or decrease
the elevation of the bottom.
“
D-3
TABLE D.3 – ERROR MESSAGES
LEVEL
ERROR
NO.
Mesh
Generation
179
Top Chord Elevation Cannot
Be Below Tower Bottom
Increase the elevation of the top
beam chord or decrease the
elevation of the tower bottom.
“
180
Top Chord Elevation Cannot
Be Above Tower Top
Increase the elevation of the top
of the tower or decrease the
elevation of the top beam chord.
“
181
Beam Width Must Exceed 0
Input a valid width for all box or
trichords.
“
182
Tower Width Must Exceed 0
Input a valid width for all braced
tower posts.
“
183
Beam Depth Must Exceed 0
Input a valid depth for all box or
trichords.
ERROR MASSAGE
REMEDY
“
184
Invalid Cross Section No.
“
152
Section Not Defined for Beam
End Members
D-4
Input a cross section that is
defined on Screen “Definition of
Sections”.
Enter the desired section
numbers for the members
comprising the bracing at the
ends of the beams.
TABLE D.5 – ERROR MESSAGES
LEVEL
ERROR
NO.
Analysis
F1
Input Data Sequence at Card
No. X
Check sequence of card number
given.
“
F2
Total of x is Inconsistent with
Joint Number x
Check joint number given and
joint input sequence.
“
F3
Total of x is Inconsistent with
Section Number x
Check section number given and
section input sequence.
“
F4
Total of x is Inconsistent with
Member Number x
Check member number given
and member input sequence
“
F6
Total of x is Inconsistent with
VAM Number x
Check VAM number given and
VAM input sequence.
“
F7
Total of x is Inconsistent with
Walkway Number x
Check walkway number given
and walkway input sequence.
“
F8
Total of x is Inconsistent with
Sign Number x
Check sign number given and
sign input sequence.
“
F9
Maximum Number of Units
Exceeded (maximum = 40)
Check member input, number of
units <= 40.
“
F10
Structure Type Error
Check configuration no. (1-5
only).
“
F11
Improper Section for Tower
Member x
“
F12
Orientation Error for Unit
Number x
ERROR MASSAGE
REMEDY
D-5
Check member number x tubular
sections only for primary
vertical members.
Check orientation for unit
number given. Member types 1
and 4 cannot be part of a unit.
TABLE D.6 – ERROR MESSAGES
LEVEL
ERROR
NO.
Analysis
F13
Initial Data Errors of
Maximum Height Zone
Check structure input height >
55.
“
F14
Procedure Fails
Check for proper number of
support restraints at proper
locations.
“
F15
VAM Type Number x Not
Defined, VAM Number x
Check section of VAM number
given.
F16
Section Number x is not
Defined for VAM Number x
Check section number for VAM
number given cannot be 1-6
(tubular).
F18
The Supporting Member For
VAM Number x is Not
Defined
Check input support member for
VAM number given.
“
“
ERROR MASSAGE
REMEDY
D-6
References
1. “Standard Specification for Structural Supports for Highway Signs, Luminaires, and
Traffic Signals”; American Association of State Highway and Transportation Officials;
Washington, D.C.; 1994, 2001, and 2009.
2. Gere, J. M., Weaver, W. Jr.; “Analysis of Framed Structures”; D. Van Nostrand Co., New
York; 1980
3. “Microsoft Windows Family of Operating Systems”; Microsoft Corporation; 1987-2009
4. S. Timenshenko; “Strength of Materials” – Part II; D. Van Nostrand Co. New York; 1957
5. Bathe, K. L., Wilson, E.L.; “Numerical Methods in Finite Element Analysis”; PrenticeHall, Inc., New Jersey; 1976
6. “Building Code Requirements for Reinforced Concrete”; American Concrete Institute;
Detroit; 1999
7. Blodgett, O. W.; “Design of Welded Structures”; Lincoln Arc Welding Foundation;
Cleveland; 1968
8. “ASD Manual of Steel Construction”, 9th Edition; American Institute of Steel
Construction; Chicago; 1980
9. “NCHR Report 469-Fatigue-Resistant Design of Cantilevered Signal, Sign and Light
Supports,” Transportation Research Board, Washington, D.C.; 2002
Reference-1