1
PSGA– 101A
Polarization Measurement System
PolaWise™
Operation Manual
Nov. 5, 2010
General Photonics Corp.
5228 Edison Ave.
Chino, CA 91710 USA
Document #: GP-UM-PSGA-101A-12
Ph: (909) 590-5473
Fax: (909) 902-5536
www.generalphotonics.com
Page 1 of 86
WARRANTY
All of General Photonics’ products have been inspected and found to comply with our
stringent quality assurance standards before shipping. If any damage occurs during
shipment, please contact the carrier and inform us or our distributors as soon as possible.
Please do not, under any circumstances, attempt user repair of any General Photonics
product. To avoid further damage, any repair of defective products must be performed by
well-trained engineers.
General Photonics warrants that this product will be free from defects in materials or
workmanship for a period of one year from the date of original shipment (listed on the
certificate of quality or packing list enclosed with the original shipment). A product
found to be defective during the warranty period will be repaired or replaced, at no
charge, at General Photonics’ option.
If a problem is found, please contact General Photonics for assistance. If necessary,
return the defective product, freight prepaid, clearly labeled with the RMA number, with
as complete a description of the problem as possible. The repaired or replacement product
will be returned, freight prepaid, as soon as possible.
The above warranty specifically excludes products that have been repaired or modified
by non-manufacturer-authorized personnel, as well as damage caused by misuse, abuse,
improper storage or handling, or acts of nature.
This warranty is in lieu of all other warranties, expressed or implied. General Photonics
will not be liable for any indirect or consequential damages or losses resulting from the
use of its products.
Document #: GP-UM-PSGA-101A-12
Page 2 of 86
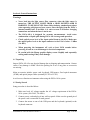
SAFETY CONSIDERATIONS
The following safety precautions must be observed during operation, service and repair
of this instrument. Failure to comply with these precautions or with specific warnings
elsewhere in this manual violates safety standards of design, manufacture, and intended
use of the instrument. General Photonics Corp. assumes no liability for customers’ failure
to comply with these requirements.
• Before operation, the user should inspect the instrument and
review the manual carefully.
•
The instrument’s rear panel includes a chassis ground terminal for electrical
safety.
•
Make sure that the instrument is in a secured work environment (in terms of
temperature, humidity, electrical power, hazard due to fire or shock, etc.) for
proper operation.
•
Standard laser safety procedures should be followed during operation.
Document #: GP-UM-PSGA-101A-12
Page 3 of 86
Table of Contents:
Section 1. Specifications..................................................................................................... 5
Section 2. Overview:........................................................................................................... 7
Section 3. Feature Description:........................................................................................... 8
3.1 Optical Features: ....................................................................................................... 8
3.2 Electrical Features:.................................................................................................. 10
Section 4. General Instructions:........................................................................................ 12
4.1 Unpacking ............................................................................................................... 12
4.2 Getting Started ........................................................................................................ 12
Section 5. Polarization State Generation and Analysis..................................................... 16
5.1
5.2
5.3
Polarization Parameters .................................................................................... 16
Polarization State Generator (PSG) Module..................................................... 18
Polarization State Analyzer (PSA) Module ...................................................... 20
Section 6. Measurements: ................................................................................................. 24
6.1
6.2
6.3
6.4
6.5
6.6
6.7
Polarization Mode Dispersion (PMD) Measurement ....................................... 24
Polarization Dependent Loss (PDL) Measurement .......................................... 37
Polarization Extinction Ratio (PER) Measurement: ......................................... 43
Mueller Matrix measurement............................................................................ 47
Long Term Measurement.................................................................................. 51
Angle Measurement .......................................................................................... 53
Beat-length Measurement ................................................................................. 54
Section 7. Front Panel Control:......................................................................................... 57
Section 8. Internal Tunable Laser (Optional): .................................................................. 68
Section 9. Remote Control:............................................................................................... 71
9.1
9.2
9.3
9.4
9.5
9.6
9.7
9.8
9.9
GPIB Control .................................................................................................... 71
Ethernet Control................................................................................................ 73
PSG GPIB/Ethernet Commands ....................................................................... 75
PSA GPIB/Ethernet Commands: ...................................................................... 76
PMD/PDL scan GPIB/Ethernet Commands ..................................................... 77
PDL single wavelength measurement GPIB/Ethernet Commands................... 79
Wavelength Setup Commands for PMD and PDL measurement..................... 80
Internal tunable laser commands ...................................................................... 81
Error Definitions ............................................................................................... 83
Section 10. Technical Support and Factory Service Information:.................................... 84
Document #: GP-UM-PSGA-101A-12
Page 4 of 86
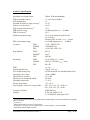
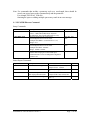
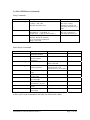
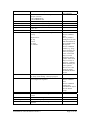
Section 1. Specifications
Operating wavelength range 1
SOP generation accuracy
SOP repeatability
Azimuth & ellipticity angle accuracy 2
Stokes vector accuracy2
DOP measurement accuracy2, 3
PER dynamic range
PER axis accuracy2
PMD measurement range
DGD
SOPMD
PDL
1440 to 1620 nm (standard)
± 1° on Poincaré Sphere
±1°
< 0.25°
± 0.5%
± 1%
>40 dB (Input Power > −10 dBm)
± 0.2°
1 fs to 10 ps (Internal tunable laser)
1 fs to 400 ps
(External laser, 0.01nm < λstep < 10 nm)
0 to 40 dB (Input power > −10 dBm)
± (1fs + DGD*0.5%)
± (SOPMD*1%)
± (0.05 dB + PDL*2%)
Repeatability:
DGD 4
SOPMD4
PDL 5
0.03 fs
0.3ps2
0.04 dB
Resolution
DGD
SOPMD
PDL
1 fs (1550nm, λstep = 2nm)
0.005 ps2 (1550nm, λstep = 2nm)
0.01 dB
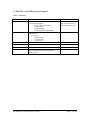
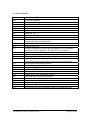
PDL measurement range
Accuracy:
PMD
Internal tunable laser
Wavelength tuning step
Operating power range
Optical power accuracy
Optical power damage threshold
Operating temperature
Storage temperature
Power supply: Universal -accepts either
Computer interface
Displays
< 0.1 ps
1528 to 1563 nm
50 GHz minimum for internal tunable laser
−40 to +2 dBm
± 0.25 dB
300 mW
5 ~ 40 °C
−20 ~ 60 °C
100 ~ 120 VAC, 50 ~ 60 Hz, or
200 ~ 240 VAC, 50 ~ 60 Hz
GPIB, Ethernet
8" flip-top graphic LCD
2 x 20 character front-panel LCD
1
Specifications listed here apply to the standard 1440-1620nm model. Contact General Photonics regarding
other wavelengths.
2
At 23±0.5°C
3
DOP measurement accuracy for C and L bands.
4
Averaged over 10 steps, with wavelength step size = 2nm for DGD, 0.1nm for SOPMD.
5
Measured by Mueller Matrix method.
Document #: GP-UM-PSGA-101A-12
Page 5 of 86
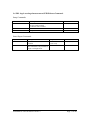
External storage
Software
Optical Connectors:
Laser Output and PSG input/output
PSA Input
Dimensions
Document #: GP-UM-PSGA-101A-12
USB removable storage media (flash drive)
Control/display program (included)
FC/PC, FC/APC, SC/PC, or SC/APC
FC free space
2U, 19 inch 3/4 rack width
3.5"(H) x 14"(W) x 14"(L)
Page 6 of 86
Section 2. Overview:
The PSGA-101A (PolaWise™) is a complete polarization measurement system for fiber
optic applications, based on General Photonics’ patented magneto-optic polarization
generation and analysis technology and designed for accurate characterization of all
polarization related properties of light sources and optical materials. Its major functions
include polarization state generation (PSG), polarization state analysis (PSA),
polarization extinction ratio (PER) measurement, polarization dependent loss (PDL)
measurement, and polarization mode dispersion (PMD) measurement.
The instrument has three display options. The primary one is the flip-top LCD graphic
display, for self-contained use of all graphic user interface-based instrument control and
data display options. An external monitor can also be used via the VGA port. The front
panel 2x20 character LCD allows push-button operation of the instrument for simple
measurements that do not require a graphic display.
The internal tunable laser included in the standard version of the instrument allows
measurement of PMD values up to 10 ps. The PSGA can also be used with external
tunable lasers for measurement of PMD values outside this range.
The PSGA-101A can be remote controlled through industry standard GPIB or
ETHERNET connections. The ETHERNET capability enables customers to measure the
polarization properties of existing links at different network locations.
Document #: GP-UM-PSGA-101A-12
Page 7 of 86
Section 3. Feature Description:
3.1 Optical Features:
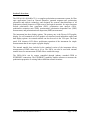
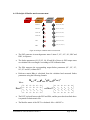
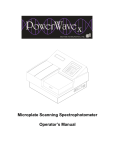
The PSGA-101A system has four fiber adapters for optical beam inputs and outputs, as
marked on the front panel (Figure 1). The far left connector is the output from the
optional internal tunable laser. The two middle connectors are the input (to connect to
either the internal laser source or an external source) and output of the polarization state
generator (PSG). The far right connector is the input to the polarization state analyzer
(PSA). The recommended (default) connector type for the internal tunable laser output
and PSG input/output is FC/PC, although other connector types are available by customer
request. The PSA input is free space and can accept either FC/APC or FC/PC connectors
(FC/APC is recommended to reduce back reflection from the connector).
Figure 1 PSGA-101A front panel
The laser and PSG connectors are universal connector interfaces (UCI), which feature a
male-type adapter top piece that can be removed for direct access to the ferrule end for
routine cleaning and maintenance without removing the entire adapter from the panel.
This feature helps avoid high insertion loss, high return loss and measurement instability
caused by dirty or contaminated connectors.
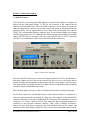
Since the PSA input is free space, there is no internal ferrule that would need cleaning.
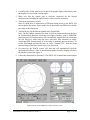
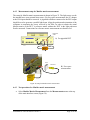
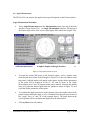
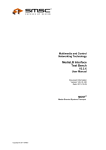
For the three connectors with internal ferrules, each connector ferrule is contained in a
universal connector interface consisting of a front piece that connects to the external fiber
connector, and a base piece that is mounted on the front panel of the instrument, as shown
in Figure 2. To clean a connector ferrule, first, make sure that no external connector is
connected to the universal connector interface. Then, using a Phillips screwdriver,
remove the two small screws connecting the front and back parts of the adapter, and
carefully pull the front flange straight out. (Note: never remove the adapter base from the
Document #: GP-UM-PSGA-101A-12
Page 8 of 86
front panel). The ferrule end should now be exposed. Clean the ferrule using standard
cleaning procedures (compressed air or a fresh lint-free tissue and alcohol), taking care to
avoid scratching the ferrule surface. Finally, replace the front flange (position it so that
the key notch faces up, and the small alignment pin lines up with the hole in the base
piece, before pushing it in) and the screws. For frequent measurements, we recommend
that the user prepare a patch cord fiber to avoid wear on the internal connector.
Hole for
alignment pin
Remove
screws
Front flange
Adapter base
do not remove
Ferrule end
Figure 2 Diagram of universal connector interface
External fiber connectors should be cleaned using industry standard cleaning methods
before connection to the PSGA-101A. If this procedure is followed before each
connection, the instrument’s internal connector ferrules should not need regular cleaning.
However, high insertion loss or measurement instability that does not improve after
cleaning the external connectors may indicate that the instrument’s internal connector
ferrules require cleaning.
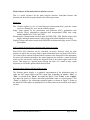
Note:
The output power of the PSGA-101A’s internal tunable laser is fixed, and may be as high
as 13-14 dBm. To ensure that the light input to the PSA is within the specified dynamic
range for accurate measurements (-40 to +2 dBm), a 10 dB optical attenuator is supplied
as an accessory with the PSGA-101A. The attenuator should be connected between the
laser output and the PSG input.
Document #: GP-UM-PSGA-101A-12
Page 9 of 86
3.2 Electrical Features:
The PSGA-101A system uses the standard wall electricity supply (100~240V, 50~60Hz).
Due to high voltage, the following safety precautions must be exercised during operation.
•
•
•
The ground pin on the power supply cord must be connected to earth ground of
the wall receptacle.
Never touch the boards inside the package without proper insulation.
The PSGA-101A is not user serviceable. It should be serviced only by factoryauthorized personnel.
The front panel of the PSGA-101A contains the main power switch (Power), laser key
(Light), liquid crystal display (LCD), push button control pads, keyboard connector, two
USB connectors and four optical connectors, as shown in Figure 1. One of the USB
connectors is generally used for mouse control; the other can be used for flash memory.
A flip-top LCD graphic display is located on top of the main body of the PSGA-101A.
Front panel description:
LCD display: displays data and operation mode information
Power: main electrical power on/off switch
Light: key enables/disables control of the internal tunable laser
Laser (OUT): output connector for internal tunable laser;
PSG (IN): PSG light input connector (for connecting external or internal light source
to the PSG)
PSG (OUT): PSG output connector
PSA (IN): PSA input connector
Keypad: push buttons for measurement status control (see Section 7)
Keyboard: connector port to connect a keyboard to the PSGA-101A
USB: two USB ports for mouse control and flash memory
Document #: GP-UM-PSGA-101A-12
Page 10 of 86
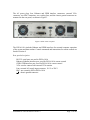
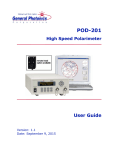
The AC power plug, fuse, Ethernet and GPIB interface connectors, external VGA
connector, two BNC connectors, two cooling fans, and the chassis ground connector are
mounted on the rear panel, as shown in Figure 3.
Figure 3 PSGA-101A rear panel
The PSGA-101A includes Ethernet and GPIB interfaces for external computer operation
of the system and data readout. Control commands and instructions for remote control are
listed in Section 9.
Rear panel description:
RS-232: serial port, not used in PSGA-101A
Ethernet: Ethernet interface port, used for PSGA-101A remote control
GPIB: GPIB interface port, used for PSGA-101A remote control
VGA: used to connect with external VGA monitor
Line: external AC supply input connector, 110 V or 220 V
BNC: not currently used in PSGA-101A
: chassis ground connector
Document #: GP-UM-PSGA-101A-12
Page 11 of 86
Section 4. General Instructions:
Warnings:
•
Never look into the light source fiber connector when the light source is
turned on. THE OUTPUT LIGHT FROM A HIGH POWER LASER IS
HARMFUL TO HUMAN EYES. Please follow industry standard procedures
when operating a high power laser source. Since the light from the PSGA’s
internal tunable laser is invisible, it is safer to turn it off before changing
connections and when the laser is not in use.
•
The PSGA-101A is designed for accurate measurements. Avoid water
condensation or liquid spills during PSGA-101A storage and operation.
•
Check optical power level of the input optical beam to the PSA. Make sure
the optical power level at the input connector to the PSA is below +2 dBm
(1.6 mW).
•
When powering the instrument off, wait at least 20-30 seconds before
powering it back on to avoid damage to electrical components.
•
Be careful with the flip-up graphic display screen. Rapidly and repeatedly
raising and lowering it may cause damage.
4.1 Unpacking
Inspect PSGA-101A for any physical damage due to shipping and transportation. Contact
carrier if any damage is found. Check the packing list to see if any parts or accessories
are missing.
Major accessories include: power cord, keyboard, USB mouse, fixed optical attenuator
(10 dB), and optical jumper cables (normally FC/PC to FC/PC).
Avoid excess vibration environments when using the PSGA-101A system.
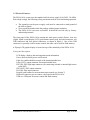
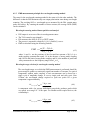
4.2 Getting Started
Setup procedure is described below:
1. Make sure local AC voltage matches the AC voltage requirement of the PSGA101A system (100~240V, 50~60Hz).
2. Connect power cord and plug it into wall receptacle. Make sure the ground pin of
the power cord is connected to earth ground.
3. Connect the mouse to one of the USB ports and the keyboard (optional) to the
keyboard connector.
Document #: GP-UM-PSGA-101A-12
Page 12 of 86
4. Carefully slide off the metal cover for the LCD graphic display, then slowly raise
the display to a convenient viewing angle.
5. Make sure that the optical path is correctly connected for the desired
measurements, including the optical source, either external or internal.
6. Turn on the main power switch.
Note: If a flash drive is connected to a USB port during power up, the PSGA will
not recognize the mouse. Please make sure to disconnect any flash drives before
powering on the instrument.
7. Turn on the key for the internal tunable laser, if applicable.
Note: The key enables control of the laser. It does not automatically turn the laser
on. Measurement functions involving wavelength scanning, such as PMD/PDL
measurement or ER measurement, will automatically turn on the laser when they
are run. However, when using the laser with basic PSA functions or singlewavelength PDL measurements, it is necessary to manually turn on the laser. To
set the wavelength and turn the laser on, select “Internal TLS” from the Setup
menu to bring up the laser control screen (see Section 8).
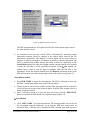
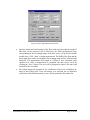
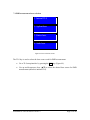
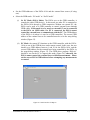
8. On power-up, the WinCE system will start and will automatically load the
measurement software. After an initialization splash screen the display will show
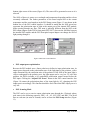
the interface pictured in Figure 4.
9. Follow the instructions in Sections 5-9 for PSGA-101A control and measurements.
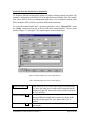
Figure 4 PSGA-101A PolaWise™ software interface screen
Document #: GP-UM-PSGA-101A-12
Page 13 of 86
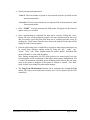
Major features of the main software interface screen:
This is a quick reference for the main software interface. Individual features and
functions are described in greater detail in the following sections.
Menu bar:
File: Contains options to save or load long-term measurement data, print the current
screen to a bitmap file, or to exit the control program.
Setup: Setup options for the polarization state generator (PSG), polarization state
analyzer (PSA), polarization extinction ratio measurement (PER) laser setup,
internal tunable laser (TLS), and GPIB.
Measurements: Measurement selection menu for PMD, PDL, PER, Mueller matrix, beat
length, and angle measurements, and for long-term polarization data recording.
Display: Restores the most recently used PMD/PDL measurement display screen, if it has
been hidden.
Soft keyboard (keyboard icon at bottom right corner of screen)
Most PSGA-101A functions can be controlled via mouse. However, there are some
instances in which the user may need to input information from a keyboard. The PSGA101 comes with an external keyboard which connects to the front panel of the instrument.
For more self-contained operation, the control program also includes a virtual keyboard
which can be accessed by clicking the keyboard icon at the bottom right corner of the
screen. This brings up a pull-up menu offering the choice of a small or large virtual
keyboard, as well as the option to hide the keyboard.
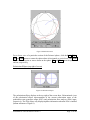
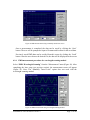
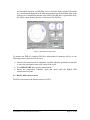
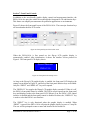
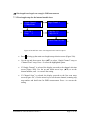
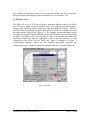
Poincaré sphere display (left half of the screen):
The Poincaré sphere display is a graphical representation of the polarization state of
either the PSG output light or the PSA input light, depending on whether “PSG” or
“PSA” is selected in the “Draw” box under the sphere. Click “Point” in the “Option”
box under the sphere to display individual polarization states as colored points. Click
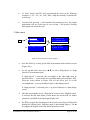
“Trace” to display a line connecting sequential points, as shown in Figure 5. Points on
the front half of the sphere are displayed in red, while points on the rear half of the sphere
are blue.
Document #: GP-UM-PSGA-101A-12
Page 14 of 86
Figure 5 Polarization traces
For a clearer view of a particular section of the Poincaré sphere, click the Left, Right,
Up, or Down buttons to rotate the sphere about its horizontal or vertical axis. The Clear
button erases all points or traces drawn on the sphere. ZIn and ZOut zoom the sphere in
and out, respectively.
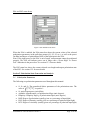
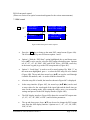
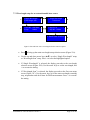
Polarization Ellipses (top right of screen)
Figure 6 Polarization ellipses
The polarization ellipse displays at the top right of the screen show 2-dimensional views
of the polarization ellipse representations of the current polarization states of the
polarization state generator output (PSG) and polarization state analyzer (PSA) input,
respectively. The PSA ellipse only displays/updates information when the PSA is enabled
(button at bottom of Figure 6).
Document #: GP-UM-PSGA-101A-12
Page 15 of 86
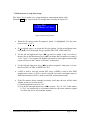
PSA and PSG status boxes
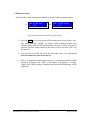
Figure 7 PSA and PSG status boxes
When the PSA is enabled, the PSA status box shows the current values of the selected
polarization parameters in the pull-down menus (S1, S2, S3, etc.), as well as the power
(in dBm) and degree of polarization (DOP) of the light input to the PSA.
Note: If the input power to the PSA is out of range, measurements cannot be performed
properly. The PSA will indicate power out of range with a “Power High” or “Power
Low” indication in the power box. See section 15.3 for more details.
The PSG status box shows the current selected wavelength and output polarization state
of the PSG. See section 15.2 for more details.
Section 5. Polarization State Generation and Analysis
5.1
Polarization Parameters
The following are polarization parameters used throughout this manual:
•
•
•
•
•
•
•
S1, S2 and S3: The normalized Stokes parameters of the polarization state. The
value of S12 + S 22 + S 32 is equal to 1.
S0: optical input power (unit: dBm)
Azimuth: Azimuth angle ψ of polarization ellipse (unit: degrees).
Ellipticity: Ellipticity angle χ of polarization ellipse (unit: degrees).
DOP: Degree of polarization (usually given as a percentage of input light)
DLP: Degree of linearity (usually given as a percentage of polarized input light)
DCP: Degree of circularity (usually given as a percentage of polarized input light)
Document #: GP-UM-PSGA-101A-12
Page 16 of 86
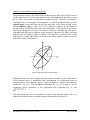
Graphical representations of polarization state
The polarization ellipse is the elliptical trace made by the tip of the electric field vector of
a light signal in the (XY) plane perpendicular to the light propagation direction z, where
the x, y and z axes define a right-handed coordinate system. Generally, the ellipse is
characterized by its orientation and elongation. A common parameterization uses the
azimuth angle ψ (the angle between the semi-major axis of the ellipse and the x-axis)
and the ellipticity angle χ = ±tan−1 (Emax / Emin), where Emax and Emin are the lengths of
the semi-major axis and the semi-minor axis, respectively. If the rotation of the electric
field vector tip appears clockwise to an observer facing the incoming light, the light is
right-hand polarized and its ellipticity angle is positive; otherwise, the light is left-hand
polarized and its ellipticity angle is negative. The direction of rotation (R/L) of the
polarization is usually indicated by an arrow at the bottom right or bottom left of the
polarization ellipse (see Figure 8).
y
χ
Εmin
Εmax
ψ
x
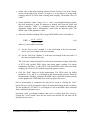
Figure 8 Right-handed Polarization Ellipse
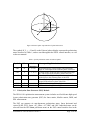
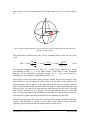
Polarization states can also be graphically represented on a sphere of unit radius known
as the Poincaré sphere. A polarization state corresponding to a polarization ellipse of
azimuth angle ψ and ellipticity angle χ can be mapped to a point P with spherical
coordinates (2ψ, 2χ, 1). The rectangular coordinates (S1, S2, S3) of point P are the
normalized Stokes parameters of the polarization state represented by P, with
S12 + S 22 + S 32 =1.
Any polarization state can be represented as a point on the Poincaré sphere; and every
point on the Poincaré sphere represents a unique polarization state (Figure 9).
Document #: GP-UM-PSGA-101A-12
Page 17 of 86
S3
P
2χ
S1
S2
2Ψ
Figure 9 Poincaré sphere representation of polarization states
The symbols H, V, +, -, R and L on the Poincaré sphere display represent the polarization
states described in Table 1, and are used throughout the PSGA control interface, as well
as the user manual:
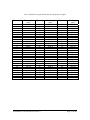
Table 1. Special polarization states on Poincaré sphere.
Symbols
Abbr.
LHP
H
( 1, 0, 0 )
LVP
V
( −1, 0, 0 )
+45
+
( 0, 1, 0 )
-45
-
( 0, −1, 0 )
RHC
LHC
R
L
( 0, 0, 1 )
( 0, 0,−1 )
5.2
Stokes
Corresponding Polarization States
Parameters
Horizontal linearly polarized light with polarization
angle 0° with respect to the reference plane of the PSA.
Vertical linearly polarized light with polarization angle
90° with respect to the reference plane of the PSA.
Linearly polarized light with polarization angle +45°
with respect to the reference plane of the PSA.
Linearly polarized light with polarization angle -45° with
respect to the reference plane of the PSA.
Right-hand circularly polarized light
Left-hand circularly polarized light
Polarization State Generator (PSG) Module
The PSGA-101A polarization measurement system includes an all solid-state high speed
6-state polarization state generator (PSG) for Jones matrix, Mueller matrix, PMD, and
PDL measurement.
The PSG can generate six non-degenerate polarization states: linear horizontal and
vertical (LHP, LVP), linear +45°, linear −45°, RHC and LHC. Individual states can be
selected from the PSG State pull-down menu on the PSG control interface box in the
Document #: GP-UM-PSGA-101A-12
Page 18 of 86
bottom right corner of the screen (Figure 10). The state will be generated as soon as it is
selected.
The SOPs of these six states are wavelength and temperature dependent and have been
accurately calibrated. The Stokes parameters of the actual output SOP at the current
temperature and the wavelength set in the PSG Setup screen (Figure 11) are shown in the
bottom line of the PSG control interface. It should be noted that the SOP given here
represents the polarization state of light at the output port of the internal PSG module,
before passing through any fiber. This state is generally different from the SOP at the
PSG output adapter on the PSGA front panel (PSG OUT), because the SM fiber between
the internal PSG module and the PSG front panel output adapter can change the SOP of
light passing through it.
Figure 10 PSG state control interface
•
PSG output power optimization
Because the PSG module uses a linear polarizer to define its input polarization state, its
output power depends on the polarization state of the light input to the polarizer, with a
range determined by the extinction ratio of the polarizer. If the SOP of the input light is
close to orthogonal to the polarizer axis, the light output can be very low. To solve this
problem, the PSGA includes a 90° controllable polarization rotator located before the
PSG input. Clicking the “Adjust PSG Power” button in the PSG control interface box
(Figure 10) rotates the polarization plane of the input light by 90°, changing the PSG
output power accordingly. This function should be used if the initial PSG output power is
very low.
•
PSG Scanning Mode
The PSG can be set to scan its output polarization state through the 6 Poincaré sphere
pole states in the following sequence: LHP, +45, −45, LVP, LHC and RHC. The dwell
time at each state (in units of seconds) can be set from the PSG Setup interface (Figure
11).
Document #: GP-UM-PSGA-101A-12
Page 19 of 86
Figure 11 PSG setup for scanning mode
Once the dwell time is set, choosing “scan” from the “State” menu (Figure 10) will start
the scan.
5.3
Polarization State Analyzer (PSA) Module
The polarization state analyzer (PSA) module inside the PSGA-101A can be used to
analyze polarization-related parameters/properties for free-space setups as well as fiber
guided light.
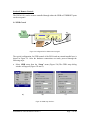
A special FC adapter with a collimator is supplied with the PSGA instrument (Figure 12).
It can be used with either FC/APC or FC/PC connectors. The slot at the top of the FC
adapter is for wide-key connectors, and the bottom slot is for narrow-key connectors.
This FC adapter can easily be removed for free space measurements. The diameter of a
free-space input light beam should be less than 1mm to ensure that the PSA’s detector
can collect all of the energy of the input light.
PSA
FC adaptor
with collimator
Figure 12 PSA module for free space and fiber guided light
Document #: GP-UM-PSGA-101A-12
Page 20 of 86
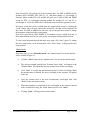
5.3.1
PSA interface
The PSA control/data display interface (Figure 13-Figure 14) consists of the
following:
• PSA setup window (accessed from Setup pull-down menu)
• Poincaré Sphere at the left of the main interface screen
• Polarization ellipse at the top right of the main interface screen
• PSA measurement parameter status box in the middle right of the main
interface screen
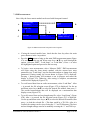
Figure 13 PSA primary interface
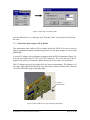
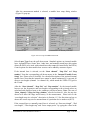
5.3.2
PSA Setup
The PSA has two operation modes: high precision and high speed. High precision mode
is the default operation mode. It provides maximum precision with a low sampling rate
(~10 samples/sec.), and does not require the wavelength of the input light to be specified.
High speed mode provides a high sampling rate (~ 40 samples/sec) with slightly lower
precision; however, the exact wavelength of the input light must be specified during setup.
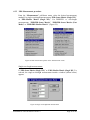
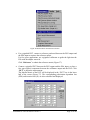
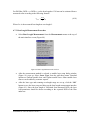
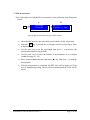
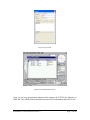
PSA Setup procedure
•
•
•
Select “PSA” from the Setup menu (Figure 14A). The “PSA Setup” dialog
window will pop up.
Select “high precision” or “high speed” mode in the “PSA Setup” window
(Figure 14B).
If high speed mode is selected, the wavelength of the input light should be set
for accurate measurement.
Document #: GP-UM-PSGA-101A-12
Page 21 of 86
A)
B)
Figure 14 PSA Setup interface
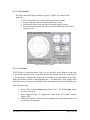
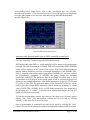
5.3.3
Polarization Parameter Analysis
Polarization-related parameters are analyzed and displayed in real time in the PSA
parameter status box in the middle right of the main screen (Figure 15). Select the
desired parameters from the pull-down menus, then click the “PSA Enable/Disable”
button to start/stop measurement. When the PSA is enabled, SOP information is also
displayed on the Poincaré sphere and the 2-D PSA polarization ellipse display.
Figure 15 Polarization parameters of input light
Document #: GP-UM-PSGA-101A-12
Page 22 of 86
5.3.4
Poincaré Sphere Display
The Poincaré Sphere display can be controlled using the on-screen buttons under the
sphere. Button functions are listed below.
Left/Right:
Rotates the sphere around the S3 axis in a
clockwise/counterclockwise direction.
Up/Down:
Rotates the sphere around the S2 axis in a
clockwise/counterclockwise direction.
Home:
Restores the sphere’s default perspective (orientation and size)
Clear:
Clears all points or traces from the sphere.
To zoom in on data on the Poincare sphere,
ZIn/ZOut
Zooms the sphere in/out.
PSA/PSG:
Selects the SOP data to be displayed on the Poincaré Sphere:
PSA: PSA input polarization
PSG: PSG output polarization
Point/Trace: Displays SOP data as individual or connected points.
Please note that any change to the Poincaré Sphere display during standard PSA
operation will clear the sphere. To maintain existing points on the sphere while
manipulating the sphere display, use the long-term measurement function (see section
6.5).
Document #: GP-UM-PSGA-101A-12
Page 23 of 86
Section 6. Measurements:
6.1 Polarization Mode Dispersion (PMD) Measurement
6.1.1
Introduction
In an ideal circularly symmetric fiber, light in any polarization state would propagate
with the same velocity. However, real fibers are not perfectly circular and are subject to
local stresses; consequently, propagating light is split into two local polarization modes
which travel at different velocities. The differential group delay (DGD) between the two
orthogonally polarized modes causes pulse spreading in digital systems and distortion in
analog systems.
General Photonics’ PSGA-101A polarization measurement system accurately
characterizes various aspects of PMD, including the wavelength dependence of the
differential group delay (DGD), the principal states of polarization (PSP), the second
order PMD, etc.
The PSGA-101A supports four PMD measurement methods: wavelength scanning, Jones
Matrix Eigenanalysis (JME), the generalized Mueller matrix method (MMM) and
Poincaré sphere analysis (PS). A fifth menu option is the fast Jones matrix method, which
provides quick measurement (with slightly reduced accuracy) for field applications. The
Jones matrix eigenanalysis and generalized Mueller matrix methods are the most
generally accurate and is recommended for most cases. The other methods are provided
primarily for comparison and reference.
Document #: GP-UM-PSGA-101A-12
Page 24 of 86
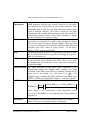
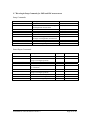
Table 2 Definitions and terms used in PMD measurement
In an ideal circularly symmetric fiber, light of any polarization state
would propagate with the same velocity. However, in real fibers,
local stresses and imperfections in the circular symmetry cause
propagating light to split into two local polarization modes which
travel at different velocities. This effect is known as the PMD
phenomenon. The resulting differential group delay between the two
orthogonally polarized modes causes pulse spreading in digital
systems and distortions in analog systems.
The principal states of polarization (PSPs) are the two orthogonal
PSP
input states of polarization for which output polarizations do not
vary when the optical frequency changes slightly. These two PSPs
are also the polarization states with the maximum (fast PSP) and
minimum (slow PSP) values of group velocity. In the PSGA
interface, “PSP” denotes the fast PSP.
Differential group delay (DGD) is the difference in delay between
DGD
the slow PSP and fast PSP at a specified wavelength. It is given in
units of picoseconds (ps).
Polarization mode dispersion (PMD) is defined as the linear average
PMD
or the root-mean square (RMS) of the DGD values over a given
wavelength range at a certain time, or over a given time window at a
certain wavelength.
PMD coefficient The PMD coefficient is the PMD value normalized to the
measurement length. For random mode coupling, the PMD
coefficient is the PMD value (PMDavg or PMDRMS) divided by the
square root of the length (L1/2) with units of ps / km ; For
negligible mode coupling, the PMD coefficient is the PMD value
(PMDavg or PMDRMS) divided by the length (L), with units of ps/km.
The second order PMD (SOPMD) at a given frequency is defined as:
SOPMD
PMD
Phenomenon
DGD(ω 2 )PSP f (ω 2 ) − DGD(ω1 )PSP f (ω1 )
dΩ(ω )
,
=
dω
ω 2 − ω1
where Ω(ω ) is the polarization mode dispersion vector,
ω=(ω1+ω2)/2, and PSPf(ωx) is the principal state of polarization at
frequency ωx.
SOPMD(ω)=
SOPMDRMS
The SOPMDRMS is the root-mean square (RMS) of the SOPMD
values over a given wavelength range at a certain time
Document #: GP-UM-PSGA-101A-12
Page 25 of 86
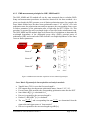
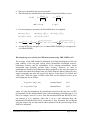
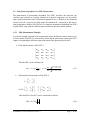
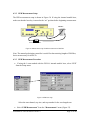
6.1.2. PMD measurement principles for JME, MMM and PS
The JME, MMM and PS methods all use the same measured data to calculate PMD.
Setup and measurement procedures are therefore identical for the three methods. At a
given wavelength, the PSG generates a set of distinct polarization states (for example, the
Jones Matrix method uses the three linear polarization states 0° 45° and 90°). For each
polarization state, the polarization state analyzer measures the corresponding Jones vector
or Stokes parameters of the polarization state of light after the DUT (Figure 16). This
procedure is repeated for each wavelength in the set specified in the measurement setup.
The JME, MMM and PS methods then use different sets of calculations to determine the
wavelength dependence of the differential group delay (DGD), principal states of
polarization (PSP) and second order PMD from the wavelength dependence of the Jones
vector or Stokes parameters.
TLS
PSG
PSA
DUT
⎡H x ⎤
⎢ ⎥
⎣⎢ H y ⎦⎥
or
o
⎡Vx ⎤
⎢ ⎥
⎣⎢V y ⎦⎥
or
o
⎡Qx ⎤
⎢ ⎥
⎣⎢Q y ⎦⎥
or
o
Linear 0
Linear 45
Linear 90
Jones
⎡ SH1 ⎤
⎢S ⎥
⎢ H2⎥
⎢⎣ S H 3 ⎥⎦
H
⎡ SV 1 ⎤
⎢S ⎥
⎢ V2⎥
⎣⎢ SV 3 ⎦⎥
V
⎡ SQ1 ⎤
⎥
⎢
⎢ SQ 2 ⎥
⎢ SQ 3 ⎥
⎦
⎣
Q
Stokes
Figure 16 PMD measurement data acquisition for Jones Matrix Eigenanalysis
Jones Matrix Eigenanalysis data acquisition and analysis methods:
•
•
•
•
•
•
Tunable laser (TLS) is set to the first wavelength λ1.
PSG outputs three non-degenerate polarization states: Linear 0°, 45°, 90°.
For each state, PSA measures the corresponding polarization state after the DUT.
Jones Matrix MJ(λ1) is calculated for λ1.
Process is repeated for the next wavelength λ2
Product Γ= MJ(λ2)MJ-1(λ1) is calculated.
•
The DGD⎜⎜
•
eigenvalues and eigenvectors of Jones matrix Γ
Process is repeated for the next wavelength to get MJ(λ3)
⎛ λ1 + λ 2
⎝ 2
⎞
⎟⎟
⎠
and corresponding fast PSP (
Document #: GP-UM-PSGA-101A-12
λ1 + λ 2
2
)
are determined from the
Page 26 of 86
•
⎛ λ + λ3
DGD⎜⎜ 2
⎝ 2
•
SOPMD(λ 2 =
⎛ λ + λ3
DGD⎜⎜ 2
⎝ 2
•
⎞
⎟⎟
⎠
and the corresponding fast PSP (
λ1 + λ 3
2
⎞
⎟⎟
⎠
is
)
and PSP (
determined
λ 2 + λ3
2
from
λ 2 + λ3
2
)
are calculated.
⎛ λ + λ2
DGD⎜⎜ 1
⎝ 2
⎞
⎟⎟
⎠
PSP (
,
λ1 + λ 2
2
)
,
)
DGDs are averaged over λ to obtain PMD, SOPMD(λ) is averaged over λ to
obtain SOPMD.
Generalized Mueller Matrix Method data acquisition and analysis methods:
•
•
•
•
•
•
•
•
•
•
Tunable laser (TLS) is set to the first wavelength λ1.
PSG outputs six non-degenerate polarization states: Linear 0°, ±45°, 90°, RHC
and LHC.
For each state, PSA measures the corresponding polarization state after the DUT.
Mueller Matrix M(λ1) of DUT is calculated (refer to section 6.4.1).
Process is repeated for the next wavelength λ2.
r λ1 + λ2
r
r
) = Ω + iΛ is calculated from M(λ1) and
The complex PMD vector W (
2
M(λ2).
r r r
r r
±Ω+Ω⊗Λ
⎛ λ + λ2 ⎞
r r
DGD⎜ 1
are calculated.
⎟ = Re( W • W ) and PSP =
Ω•Ω
⎝ 2 ⎠
Process is repeated for the next wavelength to get M(λ3 ).
λ2 + λ3
⎛ λ + λ3 ⎞
) are calculated.
⎟⎟ and the corresponding PSP (
DGD⎜⎜ 2
2
⎝ 2 ⎠
SOPMD(λ 2 =
⎛ λ + λ3
DGD⎜⎜ 2
⎝ 2
•
λ1 + λ 3
2
⎞
⎟⎟
⎠
)
is determined from DGD⎛⎜
and PSP (
⎝
λ 2 + λ3
2
λ1 + λ2 ⎞
2
⎟ ,
⎠
PSP (
λ1 + λ 2
2
)
,
).
DGDs are averaged over λ to obtain PMD, SOPMD(λ) is averaged over λ to
obtain SOPMD.
Poincaré Sphere Analysis data acquisition and analysis methods:
•
•
•
Tunable laser (TLS) is set to the first wavelength λ1.
PSG outputs three non-degenerate polarization states: Linear 0°, linear 45°, and
RHC.
r
r
r
PSA measures the corresponding polarization states H ( λ1), V ( λ1), Q ( λ1), after
DUT.
Document #: GP-UM-PSGA-101A-12
Page 27 of 86
•
•
Process is repeated for the next wavelength λ2
The following are calculated from
r measured normalized
r the
r Stokes vectors:
r
r r
r q×V r
r H×Q r
ν = r r ×q
q = r r ×H
h=H
q×V
H×Q
r r r
and c = h × q
•
r r r
c' = q × ν
For each frequency increment, the finite differences are computed:
r r
r
Δh = h (λ 2 ) − h (λ1 )
r r
r
Δc = c (λ 2 ) − c (λ1 )
λ 2 + λ1
1
Δω
r r
r
Δq = q (λ 2 ) − q (λ1 )
r r
r
Δc ' = c ' (λ 2 ) − c ' (λ1 )
⎡
1
⎢arcsin(
2
⎢⎣
r r
r
Δv = v (λ 2 ) − v (λ1 )
r
r
1 r2
1
(Δh + Δq 2 + Δc 2 ) ) + arcsin(
2
2
⎤
r
r
1 r2
(Δq + Δν 2 + Δc ' 2 ) )⎥
2
⎥⎦
•
DGD(
•
Average DGDs are averaged over λ to obtain PMD, SOPMD(λ) is averaged over
λ to obtain SOPMD
2
)=
Wavelength step size selection for PMD measurement using JME, MMM or PS
The accuracy of the JME method is influenced by drifting birefringence in the test
path, stability of the test path, optical source incremental wavelength accuracy,
polarimeter accuracy, and the repeatability of the stimulus polarizations. Larger
wavelength steps generally provide better accuracy. However, in order to
unambiguously measure the polarization change produced by the step, the rotation of
the output state about the principal state axis on the Poincaré sphere produced by any
single wavelength step must not exceed 180 degrees. In the region of 1550nm, this
“alias limit” limits the range of PMD values that can be measured with a given
wavelength step size as follows:
Δτ ( ps ) Δλ ≤ 4.0( ps ⋅ nm )
or Δτ ( ps )Δch ≤ 10 ps
(external lasers)
(6.1)
(internal laser)
(6.2)
where Δλ is the wavelength step for external lasers and Δch is the step size (# of ITU
grid channels) for the internal tunable laser (with a minimum wavelength step of ~0.4
nm). For example, when Δλ is set to 1nm, the maximum DGD that the PSGA-101A
can measure is 4 ps. Similarly, when Δch is set to 1 (the minimum step), the
maximum DGD that the PSGA-101A can measure is 10ps. In general, the user should
select the largest step size that satisfies these equations for the expected range of the
PMD to be measured.
Document #: GP-UM-PSGA-101A-12
Page 28 of 86
6.1.3 PMD measurement principle for wavelength scanning method
The setup for the wavelength scanning method is the same as for the other methods. The
difference is that the PSG maintains only one output polarization state during wavelength
scanning. The resulting SOP vs. wavelength curves measured by the PSA contain many
peaks and valleys. By counting the number of these extrema, the average DGD (PMD)
can be calculated
Wavelength scanning method data acquisition and analysis
•
•
•
•
•
PSG output is set to one of the six non-degenerate states.
The TLS is tuned to wavelength λ1.
PSA measures the SOP (S1, S2, S3) of DUT output.
The process is repeated to obtain S1(λ), S2(λ), and S3(λ) curves.
PMD is calculated using the following formula:
PMD ==
κ ( N e − 1)λa λb
,
2(λa − λb )c
(6.3)
where λa and λb are the positions of the first and last extrema of Si(λ), k is a
mode-coupling constant that equals 1.0 in the absence of strong mode coupling
and 0.824 in the limit of strong mode coupling, and Ne is the number of peaks and
valleys measured over the frequency range from λa to λb
Wavelength range selection for wavelength scanning method
The wavelength range over which the PMD measurement is performed should be
great enough to produce a statistically significant number of extrema. For optical
components without mode coupling, a basic measurement can be based on a
single cycle of amplitude change, or even a single peak and valley pair. Near
1550nm, the wavelength change required to span two peaks for a given
component is approximated by
7.8( ps ⋅ nm)
(6.4)
Δτ ( ps)
A component with a 1ps average differential group-delay produces peaks which
are spaced an average of 7.8 nm apart. For random mode-coupled devices, the
relationship is
Δλbetweenpeaks (nm) =
Δλbetweenpeaks (nm) =
Document #: GP-UM-PSGA-101A-12
6.5( ps ⋅ nm)
Δτ ( ps)
(6.5)
Page 29 of 86
“Delta” parameter selection
Once a wavelength-scanning response has been measured, it must be analyzed to
identify and count peaks and valleys (extrema). The parameter “Delta” specifies the
threshold value of magnitude change used to differentiate a peak from an adjacent
valley. For maximum accuracy, it must be small enough to differentiate legitimate
peaks and valleys, and large enough that fluctuations from noise are not identified
as extrema. The default value of this parameter is 0.05.
Calculation method selection
Two methods can be used for PMD calculation from the scanning data.
(i) For the “First to Last” method, λa in Equation 6.3 is the wavelength of the
first extremum, and λb is the wavelength of the last extremum
(ii) For the “Full Scan” method, λa in Equation 6.3 is the start wavelength of
the scan, and λb is the end wavelength of the scan.
The “Full scan” method should be used for the measurement of single mode fiber;
for optical components or PM fiber, the “First to Last” method can give better
accuracy.
Document #: GP-UM-PSGA-101A-12
Page 30 of 86
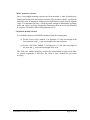
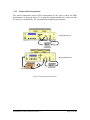
6.1.4 Setup for PMD measurement
The recommended PMD measurement setups using the PSGA-101A’s internal tunable
laser (TLA) and an external tunable light source (TLS) are shown in Figure 17a and b,
respectively. All fiber used in the measurement should be firmly fixed in place. Any fiber
movement will affect the polarization states and reduce the measurement accuracy. If
using the internal tunable laser, make sure that the laser key is turned to the “on” position.
DUT
A) Using internal TLA
DUT
TLS
GPIB
B) Using External TLS
Figure 17 PMD measurement setups
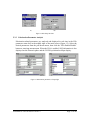
6.1.5 PMD measurement procedures for JME, MMM and PS methods
Select the preferred measurement method from the “Measurement” menu (Figure 18).
Figure 18 PMD measurement method selection
Document #: GP-UM-PSGA-101A-12
Page 31 of 86
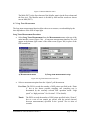
After the measurement method is selected, a tunable laser setup dialog window
(Figure 19) pops up.
a) Internal laser
b) External laser or manually tuned laser
Figure 19 Laser setup for PMD measurement
Select Laser Type from the pull-down menu. Standard options are internal tunable
laser, Agilent/HP laser, Santec laser, Ando laser, and manually tuned laser (this option
allows the PSGA to be used with external lasers that cannot be controlled by the PSGA).
Control options for other tunable laser sources can be added by customer request.
If the internal laser is selected, set the “Start channel”, “Step Size” and “Step
number” from the corresponding pull-down menus in the “Internal Tunable Laser
Setup” box. Please refer to Section 8 for a detailed description of the optional internal
tunable laser. Note that the internal laser cannot be tuned continuously; it can emit 89
discrete wavelengths (channel 1 to channel 89), which match the 50GHz ITU-grid in
the C-band.
After the “Start channel”, “Step Size” and “Step number” for the internal tunable
laser are set, the frequencies and wavelengths corresponding to the selected values are
calculated and displayed next to the parameter pull-down menus. Note: The sum of
“Start_channel + (Step_size*Step_number)” must be less than 89. Also, the step size
chosen will affect the range and accuracy of the measurement. Please refer to the
“wavelength step size selection” description in Section 6.1.2 for directions on how to
choose the correct step size for measurement of a particular device under test (DUT).
If the external laser or manually tuned laser is selected, set “Start wavelength”, “End
wavelength”, “Wavelength step” and “Laser output power” by typing the values in the
Document #: GP-UM-PSGA-101A-12
Page 32 of 86
corresponding boxes. Note: Please refer to the “wavelength step size selection”
description in Section 6.1.2 for directions on how to choose the correct wavelength step.
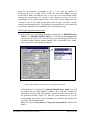
Click the “Ok” button to save the laser setup and bring up the PMD measurement
interface (Figure 20).
Figure 20 PMD measurement interface
Automatic mode (Internal tunable laser or PSGA-controlled external laser):
Click the “Start/Stop” button to begin the PMD measurement.
DGD and second order PMD vs. wavelength plots will be drawn as the measurement
proceeds. Once the measurement is finished, DGD and second order PMD (SOPMD)
values will be displayed at the bottom of the screen. If the Jones Matrix method or
Mueller Matrix method are used, the wavelength dependence of the SOPMD, PDL,
PSP, Ω// (absolute value of the parallel component of SOPMD), Ω⊥ (absolute value of
the perpendicular component of SOPMD) and phase change are measured
concurrently with DGD. The pull-down menu in the Graph box can be used to select
the parameter to be displayed in the second graph. If PSP is selected, the graph will
display the wavelength dependence of the Stokes parameters S1 (green), S2 (red) and
S3 (yellow) of the PSP. The pull-down menus in the Numerical Values box can be
used to select the average, RMS, standard deviation, maximum, minimum, or current
value of DGD, PDL, SOPMD, Ω//, Ω⊥ or PSP Stokes parameters to be displayed in
the adjoining box. If “current” is selected before measurement begins, the box will
update as each point is measured.
To hide the measurement window and return to the main screen Poincaré sphere
display, click “Hide”. The measurement window can be recovered by clicking
“Display” in the menu bar of the main screen.
Once a measurement is completed, the data can be saved by clicking the “Save”
button. The user will be prompted to input a file name and location for the saved data.
Document #: GP-UM-PSGA-101A-12
Page 33 of 86
Note: Saved files will include all of the measured data. For JME or MMM, the file
includes DGD, SOPMD, PDL, PSP, Ω//, Ω⊥ and phase change vs. wavelength. A
Poincaré Sphere method file will include the same set of data as JME and MMM
except for PDL. A wavelength scanning method file includes S1, S2, and S3 vs.
wavelength, as well as the PMD values calculated from each Stokes parameter curve.
Previously saved data can be recalled from the measurement screen by clicking the
“Load” button. Once the user chooses the desired file, the data will be displayed on
the screen. For JME or MMM files, the user can use the pull-down menu to change
the parameter displayed in the second graph.
Note: Files generated by JME, MMM, or PS methods can be recalled from any of
those measurement screens, but not from the wavelength scanning method screen.
To start a new measurement with the same laser setup, click “Start” again. To change
the laser setup before a new measurement, click “Laser Setup” to bring up the laser
setup window.
Manual mode:
If the laser type is set as “Manually tuned”, the “manual mode” box in the interface
will be enabled (Figure 21).
•
Click the “Start” button in the “manual mode” box to start the measurement.
•
The start wavelength entered from “External Laser Setup” will appear in the
“Manual Mode” box. Manually tune the external laser to this wavelength.
•
Click “Next” to execute the measurement process for this wavelength. When
the measurement is finished, the next wavelength in the sequence will appear
in the box.
•
Tune the external laser to the next measurement wavelength, then click
“Next” for the next measurement.
•
When measurement is completed for all wavelengths in the sequence entered
in the external laser setup, the “Next” button will revert to “Start”.
•
Clicking “Start” will begin a new measurement.
Document #: GP-UM-PSGA-101A-12
Page 34 of 86
Figure 21 PMD measurement using a manually tuned laser source
Once a measurement is completed, the data can be saved by clicking the “Save”
button. The user will be prompted to input a file name and location for the saved data.
Previously saved PMD data can be recalled from this screen by clicking the “Load”
button. Once the user chooses the desired file, the data will be displayed on the screen.
6.1.6 PMD measurement procedure for wavelength scanning method
Select “PMD: Wavelength Scanning” from the “Measurement” menu (Figure 18). After
completing the laser setup (see previous section), the measurement screen will appear
(Figure 22). Note: The “Manually Tuned Laser” option does not work with the
wavelength scanning method.
Figure 22 PMD measurement using wavelength scanning method
Document #: GP-UM-PSGA-101A-12
Page 35 of 86
•
Set the value of the mode-coupling constant k in the “K factor” box in the “Setup”
section on the right of the screen; k is equal to 1 in the absence of strong mode
coupling, and to 0.82 for the limit of strong mode coupling. The default value of k
is 0.82.
•
Set the parameter “delta” (range is 0~1). Once a wavelength-scanning response
has been measured, it must be analyzed to identify and count the peaks and
valleys (extrema). “Delta” is a minimum feature size parameter defining the
magnitude change used to differentiate a peak from an adjacent valley. The
default value of this parameter is 0.05.
•
Select the calculation method. The average DGD (PMD) can be calculated as:
PMD ==
κ ( N e − 1)λa λb
,
2(λa − λb )c
(6.6)
where Ne is the number of extrema.
(i) For the “First to Last” method, λa is the wavelength of the first extremum,
and λb is the wavelength of the last extremum
(ii) For the “Full Scan” method, λa is the start wavelength of the scan, and λb is
the end wavelength of the scan.
The “Full scan” method should be used for the measurement of single mode fiber
or DUTs with variable PMD values and strong mode coupling. For optical
components, PM fiber, or other DUTs with fixed PMD values and weak mode
coupling, the “First to Last” method can provide greater accuracy.
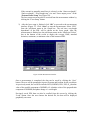
•
Click the “Start” button to begin measurement. The PSGA plots out Stokes
parameters S1, S2, and S3 vs. wavelength as the measurement proceeds. When the
measurement is finished, it displays the PMD values calculated from the extrema
in each graph in the “PMD Data” box at the top right of the screen.
Once a measurement is completed, the data can be saved by clicking the “Save”
button. The user will be prompted to input a file name and location for the saved data.
The file includes S1, S2, and S3 vs. wavelength, as well as the PMD values calculated
from each Stokes parameter curve.
Previously saved wavelength scanning data can be recalled from this screen by
clicking the “Load” button. Once the user chooses the desired file, the data will be
displayed on the screen.
Document #: GP-UM-PSGA-101A-12
Page 36 of 86
6.2 Polarization Dependent Loss (PDL) Measurement
The phenomenon of polarization dependent loss (PDL) describes the insertion loss
variation, gain variation or coupling variation of an optical component over all possible
input signal polarization states. Polarization dependent loss is defined as the maximum
insertion loss (IL) (expressed in dB) minus the minimum IL (expressed in dB) due to
input polarization variation. The PSGA-101A measures polarization dependent loss (PDL)
or gain (PDG) using either the Mueller matrix method or the Jones matrix method.
6.2.1 PDL Measurement Principle
At each wavelength specified in the measurement setup, the Mueller matrix (Section 6.4)
or Jones matrix of the DUT is measured by measuring the polarization states of the DUT
outputs corresponding to different input polarization states generated by the PSG.
•
If the Mueller matrix of the DUT is
⎡ m 00
⎢m
⎢ 10
⎢m 20
⎢
⎣ m 30
m 01
m11
m 02
m12
m 21
m 31
m 22
m 32
m 03 ⎤
m13 ⎥⎥
m 23 ⎥
⎥
m 33 ⎦
Then the PDL can be calculated as:
PDL = −10 × log(
•
2
2
2
m00 − m01
+ m02
+ m03
PMin
) = −10 × log
2
2
2
PMax
m00 + m01
+ m02
+ m03
(6.7)
If the measured Jones matrix of the DUT is
⎡J
J = ⎢ 11
⎣ J 21
⎡J
let M = ⎢ 11
⎣ J 21
J 12 ⎤
J 22 ⎥⎦
J 12 ⎤ ⎡ J 11*
⎢
J 22 ⎥⎦ ⎢⎣ J 12*
J *21 ⎤ ⎡ m11
⎥=
J *22 ⎥⎦ ⎢⎣m21
m12 ⎤
,
m22 ⎥⎦
Then the PDL of the DUT can be calculated as follows:
PDL = 10 * log
r1
r2
Document #: GP-UM-PSGA-101A-12
(6.8)
Page 37 of 86
Where
r1,2 =
m11 + m 22
m + m 22 2
± ( 11
) − m11m 22 + m12 m 21
2
2
are the eigenvalues of matrix M.
Differences between Mueller matrix and Jones matrix methods
If different polarization states with the same power pass through an optical device, the
output power will generally be polarization dependent because of the PDL of the device.
If power variations are measured for at least four non-degenerate polarization states, then
the PDL can be calculated using the Mueller matrix method. Because the Mueller matrix
method for PDL measurement is based on measurement of power variations, the
measurement accuracy is insensitive to polarization changes (for example, because of
fiber movement) between the PSG and PSA). However, any PSG output power variation
(due to fluctuation of laser output power, changes of polarization state along the fiber
between the laser and PSG, etc.) during testing will produce significant measurement
error. Therefore, accurate PDL measurement using the Mueller matrix method requires
that the laser source be highly stable and that the fiber between the laser source and the
PSG be firmly fixed in place.
If different polarization states with the same power pass through an optical device, the
relative angles between the input and the output polarization states will be different
because of PDL. If these angle changes are measured for at least three non-degenerate
polarization states, then the PDL can be calculated using the Jones Matrix method.
Because the Jones matrix method is based on measurement of angle variations, the
measurement accuracy is insensitive to PSG output power fluctuations. However, any
polarization disturbance in the fiber between the PSG and PSA will cause significant
measurement error. Therefore, accurate PDL measurement using the Jones matrix method
requires that the fiber between the PSG and PSA be fixed.
Because the Mueller matrix method (MMM) for PDL measurement is based on power
measurement, it can measure small PDL values with high accuracy, but has relatively
narrow dynamic range which is limited by the dynamic range of the detector. The Jones
matrix method (JME) is based on angle measurement, so it provides high dynamic range,
but its resolution is limited by the angle measurement resolution of the PSA. Therefore,
for maximum accuracy, the MMM should be used for measurement of small PDL values
and the JME for measurement of high PDL values.
Document #: GP-UM-PSGA-101A-12
Page 38 of 86
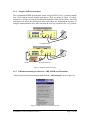
6.2.2 Setup for PDL measurement
The optical connections used for PDL measurement are the same as those for PMD
measurement, as shown in Figure 23. If using the internal tunable laser, make sure that
the laser key is turned to the “on” position before beginning measurement.
A) Using internal TLA
DUT
B) Using External TLS
DUT
TLS
GPIB
Figure 23 Setup for PDL measurement
Document #: GP-UM-PSGA-101A-12
Page 39 of 86
6.2.3 PDL Measurement procedure
From the “Measurements” pull-down menu, select the desired measurement
method. For single wavelength measurements:“PDL:Jones Matrix (Single WL)”
or “PDL:Mueller Matrix (Single WL)”. For PMD/PDL vs. wavelength
measurements: “PMD/PDL:Jones Matrix”, “PMD/PDL:Jones Matrix (Fast
Mode)” or “PMD/PDL:Mueller Matrix”. (Figure 24).
Figure 24 PDL measurement options on the “Measurement” menu
Single-wavelength measurements:
If “PDL:Jones Matrix (Single WL)” or “PDL:Mueller Matrix (Single WL)” is
selected, the single-wavelength measurement interface window (shown below)
appears.
Figure 25 Single wavelength PDL measurement.
Document #: GP-UM-PSGA-101A-12
Page 40 of 86
Input the measurement wavelength in the “λ” box and the number of
measurements to be averaged in the “count” box, then click “Start” to begin
measurement. Make sure that the laser is set to the correct wavelength before
starting the measurement (see section 8 for directions on how to set the
wavelength for the internal tunable laser). The results will be displayed in the
“current” (result of last single measurement) and “average” (average of results
from all measurements) boxes. The number of measurements to be averaged can
be chosen to compensate for instabilities in the measurement setup.
Wavelength-dependent measurement:
1) Laser setup: If a wavelength dependent measurement (“PMD/PDL:Jones
Matrix” or “PMD/PDL:Mueller Matrix”) is selected, a Laser Setup dialog
box will pop up (Figure 26). Select the laser type from the pull-down menu.
Available options include internal tunable laser, Agilent/HP laser, Santec
laser, Ando laser, and manually tuned laser.
Figure 26 Wavelength scanning (Laser) setup for PDL measurement
If “internal laser” is selected, the “Internal Tunable Laser Setup” box will
be enabled. Set the “Start channel” (channel 1-89), “Step Size” (number of
channels in each step) and “Step number” (number of steps in the scan) from
the pull-down menus (Figure 26). After the scan parameters are set, the
corresponding frequencies and wavelengths are calculated and displayed in
the boxes next to the parameters.
Note: The sum of “Start_channel + (Step_size*Step_number)” must be less
than 89.
Document #: GP-UM-PSGA-101A-12
Page 41 of 86
If the external or manually tuned laser is selected, set the “Start wavelength”,
“End wavelength”, “Wavelength step” size and “Laser output power” in the
“External Laser Setup” box (Figure 26).
The laser setup screen can also be accessed from the measurement window by
clicking the “Laser Setup” button.
2) After the laser setup is finished, click “OK” to proceed to the measurement
interface (Figure 27). Click “Start” to start the measurement. Select “PDL”
from the pull-down menu in the Graph box. The real time wavelength
dependence of the PDL will be shown on the lower graph. After the
measurement is finished, use the pull-down menus in the “Numerical Values”
box at the bottom of the screen to display the average, RMS, standard
deviation, maximum, or minimum value of the measured PDL.
Figure 27 PDL Measurement interface
Once a measurement is completed, the data can be saved by clicking the “Save”
button. The user will be prompted to input a file name and location for the saved data.
As previously noted, the saved file includes DGD, SOPMD, PDL, PSP, Ω// (absolute
value of the parallel component of SOPMD), Ω⊥ (absolute value of the perpendicular
component of SOPMD) and phase change vs. wavelength.
Previously saved PDL data can also be recalled from this screen by clicking the
“Load” button. Once the user chooses the desired file, the data will be displayed
graphically on-screen.
Document #: GP-UM-PSGA-101A-12
Page 42 of 86
6.3 Polarization Extinction Ratio (PER) Measurement:
To minimize polarization dependent effects, it is often desirable to maintain a constant
state of polarization as light propagates through an optical system. With regard to such
systems, polarization extinction ratio (PER), or polarization crosstalk, is a measure of the
degree to which the light is confined in the principal polarization mode. It is defined as
the ratio of the power in the principal polarization mode to the power in the orthogonal
polarization mode after propagation through the system, expressed in dB.
6.3.1 PER measurement principle
Polarization maintaining (PM) optical fibers have an optical (slow) axis defined by a
strong linear birefringence. If light input to an ideal PM fiber is polarized along the
fiber’s optical axis, the polarization state will be maintained during propagation through
the fiber. However, if it is misaligned, or is not fully polarized, the component polarized
along the slow axis propagates at a different speed than the component polarized along
the fast axis. Thus, the polarization state of the light changes with the relative phase delay
between the two components as it propagates through the fiber. For the case of a linearly
polarized light beam launched into a PM fiber with its polarization axis rotated by an
angle θ from the PM fiber’s slow axis, as shown in Figure 28, the extinction ratio due to
the misalignment can be calculated as
PER = −10log(tan2θ )
slow axis
(6.9)
Input Polarization
θ
fast axis
Figure 28 A representation of linearly polarized light misaligned by an angle θ from the slow axis of a PM
fiber
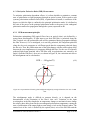
The misalignment angle is difficult to measure directly, as it depends on the
determination of the orientation of the fiber’s slow axis. Variations in the input
wavelength or in the fiber length due to temperature changes or mechanical stress change
the relative phase delay between the two orthogonal polarization components, causing the
state of polarization of the output light to rotate along a circle on the Poincaré sphere. The
rotation axis of the circle is defined by the optical (slow) axis of the PM fiber and the
Document #: GP-UM-PSGA-101A-12
Page 43 of 86
radius of the circle by the misalignment of the light to the slow axis, as shown in Figure
29.
S3
2Ψ
α
R
S2
S1
Figure 29 Poincaré Sphere illustration of polarization state rotation of output light from a PM fiber due to
thermal or mechanical stress
The polarization extinction ratio, then, can be calculated directly from the size of the
circle:
sin 2
α
2
2 ) = −10 log(1 − cos α ) = −10 log(1 − 1 − R )
(6.10)
2
1 + cos α
2 α
+
−
1
1
R
cos
2
For complete confinement in one mode, R → 0 (the circle collapses to a point),
corresponding to PER → ∞. At the other extreme, if the light is evenly distributed
between the two orthogonal polarization modes, R → 1 (the circle becomes a
circumference of the sphere), corresponding to PER → 0.
PER = −10 log(
In the PSGA system, the output light is directly coupled into the PSA through a free
space interface, so the rotation axis of the circle is on the plane of the equator of the
Poincaré sphere, and the angle Ψ is the angle between the slow axis and the reference
plate of the PSA. Because the key slot of the PSA adapter is aligned perpendicular to the
reference plate, the angle 90-Ψ represents the angle between the slow axis of the PM
fiber and the connector key. For example, Ψ=90° means that the slow axis of the PM
fiber is vertical and aligned to the alignment key direction; Ψ=0ο means that the slow axis
of the PM fiber is horizontal and perpendicular to the alignment key direction.
In practical measurement, the center of the circle generally deviates from the plane of the
equator. This deviation is caused by stress and/or other defects at the connector.
Generally, greater deviation from the equator indicates higher stress.
Document #: GP-UM-PSGA-101A-12
Page 44 of 86
6.3.2 PER Measurement Setup
The PER measurement setup is shown in Figure 30. If using the internal tunable laser,
make sure that the laser key is turned to the “on” position before beginning measurement.
PM fiber
Polarization Controller
Figure 30 Measurement setup for PER measurement of PM fiber
Note: The manual polarization controller is useful for characterizing lengths of PM fiber,
but is not necessary for all DUTs.
6.3.3 PER Measurement Procedure
•
If using the λ-scan method with the PSGA’s internal tunable laser, select “PER”
from the Setup menu:
Figure 31 PER laser setup
Select the start channel, step size, and step number for the wavelength scan.
•
Select “PER Measurement” from the “Measurements” menu (Figure 32).
Document #: GP-UM-PSGA-101A-12
Page 45 of 86
Figure 32 PER measurement selection
The PER measurement box will replace the PSG box in the bottom right corner of
the main interface screen.
•
As mentioned in the previous section, PER is determined by measuring output
polarization rotation caused by changes in the relative phase between the two
polarization components. The changes in relative phase can be caused either by
variation in input wavelength or by changes in the fiber’s optical path length. The
PSGA’s measurement method options are based on these two principles. In the
Stretch/Heat method, the input wavelength remains constant, and the user stretches
or heats the PM fiber to cause polarization rotation. In the λ scan method, the
tunable laser is used to scan the input wavelength, while the PM fiber is left
unchanged. Select the desired method from the Methods pull-down menu in the
PER measurement area in the bottom right corner of the main screen (Figure 32).
Stretch/Heat method
•
•
•
Press PER START to begin the measurement. The PSGA will begin to draw the
PM fiber’s output polarization state on the Poincaré sphere.
Gently stretch or heat a section of fiber near the PSA input port until at least half a
circle has been traced out on the Poincaré sphere. Hold the fiber straight while it is
being stretched or heated.
Once a sufficient section of a circle has been traced out, click the “PER STOP”
button to calculate the PER and the key alignment angle (Figure 33).
λ Scan Method
•
Click “PER START” to begin measurement. The internal tunable laser will scan
the wavelength using the parameters set up from the PER laser setup screen, as
described above. After the scan is finished, the PER, azimuth angle with respect to
Document #: GP-UM-PSGA-101A-12
Page 46 of 86
the horizontal direction, and PM fiber axis to which the light is aligned (slow/fast)
are calculated and displayed in the PER measurement box at the bottom right of the
main screen. It should be noted that if the PMD of the PM fiber is greater than 10ps,
the PSGA cannot identify the slow or fast axis of the PM fiber.
Figure 33 PER Measurement Results
To measure the PER of a length of PM fiber, independent of connector effects, etc. the
following iterative procedure can be used:
•
•
•
After the first measurement is completed, carefully adjust the polarization controller
to move the polarization state to the center of the circle.
Press PER START and repeat the measurement
Adjust the polarization controller again and repeat until the highest PER
measurement is found.
6.4 Mueller Matrix measurement
The PSGA can measure the Mueller matrix of a DUT.
Document #: GP-UM-PSGA-101A-12
Page 47 of 86
6.4.1 Principle of Mueller matrix measurement
TLS
PSG
PSA
DUT
Linear 0o
(S00, S10, S20, S30)
Linear 45o
(S01, S11, S21, S31)
Linear -45o
(S02, S12, S22, S32)
Linear 90o
(S03, S13, S23, S33)
LHC
(S04, S14, S24, S34)
(S05, S15, S25, S35)
RHC
Figure 34 Principle of Mueller matrix measurement
•
The PSG generates six non-degenerate states: Linear 0°, 45°, -45°, 90°, LHC and
RHC, in sequence.
•
The Stokes parameters (S1, S2, S3, S4, S5 and S6) of these six PSG output states
are calculated for wavelength λ according to PSG calibration data.
•
The PSA measures the corresponding output Stokes parameters (S1’, S2’, S3’,
S4’, S5’ and S6’) without DUT.
•
Reference matrix MRef is calculated from the calculated and measured Stokes
parameters using the following formula:
MRef=S’PSA•SPSGT•(SPSG•STPSG)-1
Where
SPSA=
⎛ '
⎜ S 01
'
⎜ S11
⎜ '
⎜ S 21
⎜S'
⎝ 31
'
S 02
'
S12
'
S 03
'
S13
'
S 04
'
S14
'
S 05
'
S15
'
S 22
'
S 23
'
S 24
'
S 25
'
S 32
'
S 33
'
S 34
'
S 35
' ⎞
S 06
⎟
'
⎟
S16
' ⎟
S 26 ⎟
' ⎟
S 36
⎠
=
and SPSG
⎛ S 01
⎜
⎜ S11
⎜
⎜ S 21
⎜S
⎝ 31
S 02
S 03
S 04
S 05
S12
S 22
S13
S 23
S14
S 24
S15
S 25
S32
S 33
S34
S 35
S 06 ⎞⎟
S16 ⎟
⎟
S 26 ⎟
S36 ⎟⎠
•
The DUT is placed between the PSG and PSA, and the procedure described above
is repeated to obtain matrix Mx.
•
The Mueller matrix of the DUT is calculated: MDUT=Mx*M-1Ref
Document #: GP-UM-PSGA-101A-12
Page 48 of 86
6.4.2 Measurement setup for Mueller matrix measurement
The setup for Mueller matrix measurement is shown in Figure 35. The light source can be
the internal laser or an external laser source. For free space measurement, the FC adapter
at the PSA input should be removed. A pigtailed collimator connected to the PSG output
should be used to generate a parallel light beam. Align the position and orientation of the
collimator to maximize the power received by the PSA. In order to obtain the actual
Mueller matrix of the DUT, a reference matrix without the DUT in the light path must
first be measured. Connections for reference matrix measurement are shown in red.
Reference
cable
A) For pigtailed DUT
DUT
PSA
PSG
DUT
collimator
B) Free space
measurement
Laser
Figure 35 Setup for Mueller matrix measurement
6.4.3 Test procedure for Mueller matrix measurement
•
Select Mueller Matrix Measurement from the Measurements menu at the top
of the main interface screen (Figure 36).
Document #: GP-UM-PSGA-101A-12
Page 49 of 86
Figure 36 Mueller Matrix measurement selection
•
For a pigtailed DUT, connect a reference patchcord between the PSG output and
the PSA input to measure the reference matrix.
For free space applications, use a pigtailed collimator to guide the light into the
PSA with the adapter removed.
Click “Reference” to obtain the reference matrix (Figure 37).
•
Connect a pigtailed DUT between the PSG output and the PSA input, or place a
free space optical component between the collimator output and the PSA. Click
“DUT” to begin the measurement.
The Mueller matrix of the DUT will be displayed in the “DUT” box in the lower
half of the screen (Figure 37). The corresponding polarization dependent loss
(PDL) and insertion loss (IL) are also calculated and displayed.
Document #: GP-UM-PSGA-101A-12
Page 50 of 86
Figure 37 Measured Mueller matrix
The M00 (DUT) is the first element of the Mueller matrix (in the first column and
the first row). The Mueller matrix is divided by M00 and the results are shown
next to M00 (DUT).
6.5 Long Term Measurement
The long term measurement function allows the user to measure, record and display the
time dependence of the SOP of input light.
Long Term Measurement Procedure
•
Select Long Term Measurement from the Measurements menu at the top of the
main interface screen (Figure 38a). A long-term measurement interface box will
appear at the bottom right corner of the main screen (Figure 38b) in place of the
PSG control box.
a) Measurement menu
b) Long-term measurement setup
Figure 38 Long Term Measurement selection
•
Select a measurement option from the “Option” pull-down menu.
Free Run: The PSGA records the number of SOP points specified in the “Point
#” box at the fastest possible sampling rate (sampling rate is
determined by the currently selected PSA operation mode- “high
speed” or “high precision”. See Section 5.3.2 for details).
Timed:
The PSGA records the number of SOP points specified in the “Point #”
box at a rate of one sample per period, with the period (interval
between measurements) specified in the “period” box in units of
seconds.
Document #: GP-UM-PSGA-101A-12
Page 51 of 86
•
Specify measurement parameters:
Point #: The total number of points to be measured (must be specified in both
measurement modes).
Period(s): The time interval between two adjacent SOP measurements in timed
measurement mode.
•
Click “START” to begin measurement. SOP points will appear on the Poincaré
sphere as they are recorded.
•
Once a measurement is completed, the data can be saved by clicking the “Save”
button. The user will be prompted to input a file name and location for the saved
data. Previously saved long-term SOP data can be recalled from this screen by
clicking the “Load” button. Once the user chooses the desired file, the data will be
displayed on the Poincaré sphere.
•
Poincaré sphere data from a completed or in-progress long-term measurement can
be viewed from different vantage points by using the “left,” “right,” “up,”
“down,” “ZIn,” and “ZOut” buttons under the sphere display. Recorded data
points will rotate or zoom with the sphere.
Note: During measurement, the PSA plots points at its normal speed, but only
recorded points will be maintained on the sphere during sphere manipulation. For
a “timed” measurement, depending on the sampling period chosen, this can cause
most of the points to disappear as the sphere is rotated or zoomed. “Free Run”
mode is better for tracking fast polarization changes.
•
The Long Term Measurement function can be terminated by clicking the Exit
button. The long term measurement interface box will be replaced by the PSG
control box.
Document #: GP-UM-PSGA-101A-12
Page 52 of 86
6.6 Angle Measurement
The PSGA-101A can measure the angle between specified points on the Poincaré sphere.
Angle Measurement Procedure
•
Select Angle Measurement from the Measurements menu at the top of the main
interface screen (Figure 39a). An Angle Measurement interface will appear at
the bottom right corner of the screen, replacing the PSG control box (Figure 39b).
a) Measurement menu
b) Sphere display with angle interface
c)
Figure 39 Angle Measurement selection
•
To mark the current SOP point on the Poincaré sphere, select a marker name
from the pull-down menu in the dialog box (Figure 39c), then click Set to mark
that point. A labeled marker will appear on the sphere, and the Stokes parameters
of the point will be displayed in the S1, S2, and S3 boxes in the Angle
Measurement area. Up to 10 separate points can be marked. Selecting the marker
name of a particular marked point from the pull-down menu in Figure 39c will
recall the Stokes parameters of that point.
•
To calculate the angle between two marked points, select the marker names of the
points between which the angle is to be calculated from the pull-down menus in
the “Angle” line (“A” and “B” in the example above). The angle between the
selected points will be calculated and displayed in the adjacent box.
•
Clicking Reset clears all markers.
Document #: GP-UM-PSGA-101A-12
Page 53 of 86
•
The Angle Measurement function can be terminated by clicking the Exit button.
The angle measurement interface box will be replaced by the PSG interface box.
6.7 Beat-length Measurement
Beat length is important because it indicates how well a fiber maintains polarization. It is
a measure of how fast the two orthogonal modes become decoupled and thus cease to
exchange energy. Fibers with short beat lengths preserve polarization more strongly than
those with long beat lengths. For bowtie-type PM fibers, beat lengths are typically only a
few millimeters, whereas for standard non-PM single-mode fibers, beat lengths are on the
order of tens of meters.
6.7.1 Principle of Beat Length
Beat length LB is defined as the ratio of the wavelength of the transmitted light λ to the
fiber’s phase birefringence Δn,
LB=
λ
(6.11)
Δn
However, the differential group delay (DGD) measured by the PSGA-101A system is
related to the group birefringence Δng, rather than to the phase birefringence
(see formula 6.12).
DGD=Δng L /c
(6.12)
where L is the propagation distance and c is the speed of light.
The relationship between phase and group birefringence is:
Δng = Δn − λ
dΔn
dλ
(6.14)
So the beat length can be calculated from the measured DGD:
LB=
λ
(6.15)
DGD * c
dΔn
+λ
L
dλ
If the chromatic dispersion equation of the fiber is
n2 = 1 +
B1λ2
B2λ2
B3λ2
+
+
λ2 − C1 λ2 − C2 λ2 − C3
then the beat length can be calculated from LB =
where
y = 1−
,
λ*y
DGD * c
L
(6.16)
(6.17)
⎤
1⎡ 2
B1λ4
B λ4
B λ4
) .
+ 2 2
+ 2 3
⎢n − 1 − ( 2
2 ⎥
2
2
n ⎢⎣
(λ − C1 )
(λ − C 2 )
(λ − C3 ) ⎥⎦
Document #: GP-UM-PSGA-101A-12
Page 54 of 86
For PM fiber, DGD1310 ≈ DGD1550, so the beat length at 1310 nm can be estimated from a
measured value according to the following formula
LB1310 =
1310
λ
LBλ
(6.18)
Where LBλ is the measured beat length at wavelength λ.
6.7.2 Beat Length Measurement Procedure
•
Select Beat Length Measurement from the Measurements menu at the top of
the main interface screen (Figure 40).
Figure 40 Beat Length Measurement selection
•
After the measurement method is selected, a tunable laser setup dialog window
(Figure 19) pops up. Select Laser Type from the pull-down menu. Standard
options are internal tunable laser and Agilent tunable laser. Other tunable laser
sources can be added by customer request.
•
After the laser type and scanning wavelength range are set up, click the “OK”
button to save the laser setup and bring up the beat length measurement interface
(Figure 41). Since the beat length is calculated from measured DGD, the laser
scan parameters should be chosen according to the expected DGD of the fiber
under test.
Document #: GP-UM-PSGA-101A-12
Page 55 of 86
Figure 41 Beat Length Measurement Interface
•
Input the length and serial number of the fiber under test. Note that the length of
fiber that can be measured will be limited by the DGD measurement range
corresponding to the wavelength range of the laser source (10 ps for the internal
tunable laser). Click “Start” to begin measurement. The PMD of the fiber and the
beat length at the center wavelength of the scanning range will be calculated and
displayed. The approximate beat length at 1310nm is also calculated using
equation 6.18. Once a measurement is completed, the data can be saved by
clicking the “Save” button. The user will be prompted to input a file name and
location for the saved data.
•
The default dispersion equation (6.16) coefficients used for the calculation are
those of fused silica glass. Users can change, save and load sets of dispersion
coefficients for different materials to more closely match the fiber under test.
Document #: GP-UM-PSGA-101A-12
Page 56 of 86
Section 7. Front Panel Control:
In addition to the user-friendly graphic display control and measurement interface, the
PSGA-101A also provides control access through the front panel LCD and function keys.
This feature can simplify measurements for particular applications or environments.
Figure 42 shows the front panel layout of the PSGA-101A. The ten major function keys
are located under the blue LCD screen.
Figure 42 Front panel layout of the PSGA-101A
When the PSGA-101A is first turned on, the flip-up LCD graphic display is
automatically enabled. After initialization, it shows the interface screen pictured in
Figure 4. The front panel LCD display shows:
General Photonics
PSGA V1.0
Figure 43 Front panel LCD startup screen
As long as the flip-up LCD graphic display is enabled, the front panel LCD displays the
startup screen shown in Figure 43, and most of the front panel function keys are disabled.
Only the “PRINT” and “DISPLAY” keys will respond.
The “DISPLAY” key toggles the flip-up LCD graphic display on and off. When it is off,
the PSGA’s front panel control is enabled. The PSGA accepts input from the front panel
keys and displays results to the front panel LCD. When it is on, the PSGA’s GUI control
interface is enabled and the front panel control is disabled. In short, the, “DISPLAY” key
is used to select the PSGA’s user interface.
The “PRINT” key is only functional when the graphic display is enabled. When
“PRINT” is pressed, the PSGA-101A will print the graphic display screen to a *.bmp file.
The user will be prompted to enter a name and location for the stored file.
Document #: GP-UM-PSGA-101A-12
Page 57 of 86
Front Panel Function Key Summary:
PSG: Brings up PSG control options
PSA: Brings up PSA control options
PER: Begin setup for PER measurement
PMD: Begin setup for PMD measurement
PDL: Begin setup for PDL measurement
PRINT: Prints currently displayed screen on flip-up graphic display to a bitmap file. Can
only be used with graphic display enabled.
STORE: Store current settings (PSG or laser settings) or measured data (PMD or PDL) to
a file.
λ: Select wavelength settings for PMD measurement.
TLS: Select laser source for PMD measurement
DISPLAY: Toggles PSGA between front panel and GUI user interfaces
▲
◄ ►: Arrow keys - used to scroll through menus or enter numerical parameters
▼
ENTER (key in center of the arrow keys): Used to select menu options or enter
parameters
Document #: GP-UM-PSGA-101A-12
Page 58 of 86
PSGA front panel control:
(Please see section 6 for optical connection diagrams for the various measurements.)
7.1 PSG control
PSG
A
B
1. PSG State: 0
2. Load Setup
Wavelength: 1550.00nm
Dwell Time: 1000ms
C
File Name: 1
S1: 1.000 S2: 0.000
S3: 0.001 State: 0
D
Figure 44 PSG front panel control sequence
•
Press the PSG key to bring up the main PSG control menu (Figure 44A).
The left arrow (◄) key moves between options 1 and 2.
•
Option 1: With the “PSG State” option highlighted, the up and down arrow
keys (▲▼) can be used to select the PSG output polarization state. Options
are: 0°, 45°, -45°, 90°, RHC, LHC, and SCAN. Press ↵ (ENTER- center key
in the arrow keypad) to go to the PSG setup interface (Figure 44C).
•
Option 2: “Load Setup” is used to recall a stored settings file. With “2” on
the main menu highlighted, press ↵ to select the PSG setup file to be loaded
(Figure 44B). The up and down arrow keys (▲▼) are used to scroll through
available file numbers, and ↵ is used to load the selected file.
•
After the setup file is loaded, the interface shown in Figure 44C is displayed.
•
In the setup interface (Figure 44C), the arrow keys (▲▼◄►) can be used
to enter values for the wavelength of the input light and the dwell time per
state for the scanning mode. After setting the values, press ↵ to execute the
settings and proceed to the SOP display interface (Figure 44D).
•
The SOP display interface (Figure 44D) shows the current PSG output state
(0°, 45°, -45°, 90°, RHC, or LHC ) and its Stokes parameters.
•
The up and down arrow keys (▲▼) can be used to change the PSG output
state from the SOP display interface. Options are: 0°, 45°, -45°, 90°, RHC,
LHC, SCAN.
Document #: GP-UM-PSGA-101A-12
Page 59 of 86
•
In “Scan” mode, the PSG will scan through the states in the following
sequence: 0°, 45°, -45°, 90°, LHC, RHC, using the currently set dwell time
at each step.
•
In Scan mode, pressing ↵ will terminate the scanning process. The output
polarization will stay in the state it was in when ↵ was pressed. Pressing
Enter again will restart the scan.
7.2 PSA control
PSA
1. High Speed
S1: -0.500 S2: 0.707
S3: -0.502 DOP: 99.99
C
Wavelength: 1550.00nm
Power: -0.60dBm
θ: -40.05 ψ: -90.9
D
A 2. High Precision
B
Figure 45 PSA front panel control sequence
•
Press the PSA key to bring up the PSA measurement mode selection screen
(Figure 45A)
•
Use the up and down arrow keys (▲▼) to select “High Speed” or “High
Precision” measurement mode.
If “High Speed” is selected, the wavelength of the input light must be
specified. Press ↵ to proceed to the wavelength setting screen (Figure 45B).
From the screen shown in Figure 45B, use the arrow keys to set the
wavelength and ↵ to accept it and proceed to a data display screen.
If “High precision” is selected, press ↵ to proceed directly to a data display
screen.
•
After the wavelength is set for “High Speed” mode or after “High Precision”
is selected, the first data display screen shows the current SOP (as Stokes
parameters) and DOP of the input light (Figure 45C).
•
The ▼ key toggles the data display to the second screen (Figure 45D) which
displays the optical power, ellipticity angle θ and azimuth angle ψ. The ▲
key toggles the display back to the Stokes parameter screen.
Document #: GP-UM-PSGA-101A-12
Page 60 of 86
7.3 PER measurement
Note: Only the λ scan measurement method can be used with front panel control.
A
PER: 20.2dB Start
θ: -12.1o
B
PER: 20.2dB Testing
θ: -12.1o
Figure 46 PER measurement front panel control sequence
•
Press the PER key to bring up the PER measurement screen (Figure 46A).
Any other processes currently in progress (PSG scanning, tunable laser
scanning, PSA, PMD or PDL measurement) will stop. If a PSG scan was in
progress, the PSG output remains in the state it was in when the “PER” key
was pressed.
•
Turn the laser key on the top left of the front panel to the “on” position (the
internal tunable laser must be turned on).
•
Press ↵ to begin the measurement using the λ scan method (default). While
testing is in progress, the “Start” in the display will change to “Testing”
(Figure 46B). When testing is complete, the measured PER and angle will be
displayed.
Document #: GP-UM-PSGA-101A-12
Page 61 of 86
7.4 PMD measurement
Note: Only the Jones matrix method can be used with front panel control.
A
B
C
1. Measure PMD
2. Load Data
Testing…
Stop
C
D
3. Load Setup
E
File Name: 1
File Name: 1
PMD: 1.555 ps
SOPMD: 20.123 ps2
F
Figure 47 PMD measurement front panel control sequence
•
If using the internal tunable laser, check that the laser key above the main
power button is in the “on position.
•
Press the PMD button to bring up the main PMD measurement menu (Figure
47A and B). Use the up and down arrow keys (▲▼) to scroll through the
options (“Measure PMD”, “Load Setup”, or “Load Data”). Press ↵ to select
the highlighted option and proceed to the next step.
•
To begin a new measurement, select “Measure PMD”. PMD measurement
will begin using the Jones matrix method, with the current laser setup
parameters (see “Load Setup” step for directions on how to change laser setup
parameters). During testing, the screen shown in Figure 47D is displayed.
Pressing ↵ during testing will terminate a test in progress and return the
display to Figure 47A. Otherwise, after testing is complete, measurement
results will be displayed (Figure 47F)
•
To recall stored data from an earlier measurement, select “Load Data”. After
↵ is pressed, the file selection screen (Figure 47E) is displayed. Use the up
and down arrow keys (▲▼) to select the desired file number, then press ↵.
The recalled measurement data will be displayed on a measurement data
display screen (Figure 47F).
•
To recall a stored laser and wavelength setup file, select “Load Setup” (Figure
47B). After ↵ is pressed, the file selection screen (Figure 47C) is displayed.
Use the up and down arrow keys (▲▼) to select the desired file number, then
press ↵ to load the selected file. (This data would be a TLS file. After it is
recalled, the settings can be viewed using the “λ” and TLS buttons.) The laser
and wavelength settings can also be manually set using the “λ” and TLS keys.
Document #: GP-UM-PSGA-101A-12
Page 62 of 86
7.5 PDL measurement
Note: Only single-wavelength PDL measurements can be performed using front panel
control.
A
B
PDL
Wavelength
1550.00 nm
PDL: 20.23
Avg Times: 12
Start
Figure 48 PDL measurement front panel control sequence
•
Check that the laser key above the main power button is in the “on position.
•
When the PDL key is pressed, the wavelength selection screen (Figure 48A)
is displayed.
•
Use the arrow keys to set the wavelength, then press ↵ to proceed to the
measurement interface (Figure 48B).
•
Use the arrow keys to select the number of measurements to be averaged
(within the range of 1~99).
•
Move cursor to Start using the right arrow (►) key, then press ↵ to start the
measurement.
•
After the measurement is completed, the PDL value will be displayed. If any
error is found during testing, the test will be terminated and the errors will be
shown.
Document #: GP-UM-PSGA-101A-12
Page 63 of 86
7.6 PMD measurement laser selection
1. Internal TLS
2. Agilent laser
3. Santec laser
4. Ando laser
Figure 49 Laser selection screens
The TLS key is used to select the laser source used for PMD measurement.
•
Go to TLS setup interface by pressing the TLS key (Figure 49).
•
Use up and down arrow keys (▲▼) to select the desired laser source for PMD
measurement (default is internal TLS).
Document #: GP-UM-PSGA-101A-12
Page 64 of 86
7.7 Wavelength/wavelength scan setup for PMD measurement
7.7.1 Wavelength setup for the internal tunable laser
A
1. Single Channel
2. Channel Scan
Single Channel: 1
B
C
1. Start Ch: 1
2. Step:
2
3. Step No.: 10
Stop Ch: 21
D
4. Dwell Time: 10.0 Sec.
E
Figure 50 Internal laser source wavelength selection control sequence
•
Press λ to bring up the main wavelength setup selection screen (Figure 50A).
•
Use the up and down arrow keys (▲▼) to select “Single Channel” setup or
“Channel Scan” setup. Press ↵ to select the highlighted option.
•
If “Single Channel” is selected, the display proceeds to the channel selection
screen (Figure 50B). Use the up and down arrow keys (▲▼) to set the
channel number, and ↵ to execute the setting.
•
If “Channel Scan” is selected, the display proceeds to the first scan setup
screen (Figure 50C). Use the arrow keys to set the start channel, scanning step,
step number and dwell time for PMD measurement. Press ↵ to execute the
setting.
Document #: GP-UM-PSGA-101A-12
Page 65 of 86
7.7.2 Wavelength setup for an external tunable laser source
A
1. Single Wavelength
2. Wavelength Scan
C
1. Start WL: 1540.00nm
2. Step:
1.00nm
Single Wavelength
1550.00 nm
3. Step No: 20
Stop WL: 1560nm
4. Dwell Time: 10.0 Sec.
B
D
E
Figure 51 External laser source wavelength selection control sequence
•
Press λ to bring up the main wavelength setup selection screen (Figure 51A).
•
Use the up and down arrow keys (▲▼) to select “Single Wavelength” setup
or “Wavelength Scan” setup. Press ↵ to select the highlighted option.
•
If “Single Wavelength” is selected, the display proceeds to the wavelength
selection screen (Figure 51B). Use the arrow keys to set the wavelength, and
↵ to execute the setting.
•
If “Wavelength Scan” is selected, the display proceeds to the first scan setup
screen (Figure 51C). Use the arrow keys to set the start wavelength, scanning
step, step number and dwell time for PMD measurement. Press ↵ to execute
the setting.
Document #: GP-UM-PSGA-101A-12
Page 66 of 86
7.8 Measurement or setup data storage
The “Store” key is used to save current settings or measurement data to a file.
When the Store key is pressed, the file storage menu is displayed (Figure 52).
1. Type :PSG
2. FileName: xx 3.Save
Figure 52 Data storage interface
•
When the file storage menu first appears, option 1 is highlighted. Use the arrow
keys to select 1, 2 or 3.
•
If 1 is selected, press ↵ to access the file type options. Use the up and down arrow
keys (▲▼) to scroll through file type options (PSG, PDL, PMD, and TLS).
•
Use the left and right arrow keys (◄►) to move to option 2, and ↵ to select it,
then use the up and down arrow keys (▲▼) to change the file number xx (range is
1~99). Press ↵ to accept the file number and return to menu option selection (the
cursor will move to the 2 before “FileName” on the menu.
•
Use the left and right arrow keys (◄►) to move to option 3, then press ↵ to save
the file xx.PSG, xx.PDL, xx.PMD or xx.TLS.
•
xx.PSG is used to store the current PSG setup; xx.PMD is used to store PMD
measurement results; xx.TLS is used to store the laser and wavelength setup for
PMD measurement; xx.PDL is used to store PDL measurement results.
•
If the file number chosen contains previously saved data, the user will be asked
whether or not to overwrite the file.
(i) Default position of cursor is “No”
(ii) Use the left and right arrow keys (◄►) to select “Yes” or “No”: If the answer
is “Yes”, the existing file is overwritten; otherwise, the cursor returns to option
2 to allow the user to select another number.
Document #: GP-UM-PSGA-101A-12
Page 67 of 86
Section 8. Internal Tunable Laser (Optional):
To facilitate different measurements using wavelength scanning related procedures, the
standard configuration of the PSGA-101A includes an internal tunable laser. The tunable
laser can be used by itself as an independent light source, or in conjunction with the other
PSGA modules (PSG and PSA) to perform different measurements.
To set up the internal tunable laser’s operation parameters, select “Internal TLS” under
the “Setup” menu in the menu bar at the top of the main control interface. The laser setup
window (Figure 53) will appear. The control options are described below.
Figure 53 Internal tunable laser source setup interface
Table 3 Internal tunable laser source control options
Light On/Light Off:
Current Channel Set
Current Channel Get
Turns Laser on or off. For the laser to turn on, both the laser
key above the main power switch on the front panel and the
“Light On/Light Off” button in this setup window must be in
the “on” position.
Sets the channel number (wavelength) of internal laser; the
corresponding wavelength and frequency are shown in the
text boxes to the right of the “Set” button after “Set” is
clicked.
Reads the current channel (wavelength/frequency) of internal
laser output.
Document #: GP-UM-PSGA-101A-12
Page 68 of 86
Cycle function keys:
Set Cycle
Set Dwell
Set Start
Set End
Used to set parameters for a wavelength scan
Sets the number of times to perform the scan; range is 1-999.
Sets the dwell time per state during a scan. Can only be used
when cycle action is set to “auto”; nnnn is 20-3600 ms
Sets the start channel of a sweep. nn: 1~89
Sets the end channel of a sweep. nn 1~89
Start
Sets the step size (number of channels per step). nn:1~89
One way: The scan starts at the designated start wavelength
and ends at the designated end wavelength. This process is
repeated the number of times set in the “Set Cycle” box.
Two way: A round-trip scan starting at the designated start
wavelength, proceeding to the end wavelength, and then
scanning back to the start wavelength. This process is
repeated the number of times set in the “Set Cycle” box.
Wavelength sweeps continuously according to the
parameters set in the Cycle parameter box.
Wavelength sweep is controlled manually
Starts channel (wavelength) sweep
Stop
Stops channel(wavelength) sweep
Pause
Pauses Channel(wavelength) sweep
Continue
Continues a paused channel (wavelength) sweep
Next
In manual scan mode, tunes the channel (wavelength) to the
next channel in the sequence dictated by the scan parameters
set in the Cycle parameter box.
Displays the current scan parameters
Set Step
Repeat option:
One way/Two way
Auto Cycle Mode
Manual Cycle Mode
Get Info.
Message Box
(last line in window)
Shows laser command response codes
*E00#: OK
*E01#: command error
*E13#: parameter setting error: the start and end channel
settings are not compatible with the step size.
*E14#: command conflict. For example: Start used during a
scan
*E15#: TLA is not ready for output. Command should be resent
The output wavelengths of the internal tunable laser source match the 50GHz ITU-grid.
Corresponding channel numbers and wavelengths are listed in Table 4.
Document #: GP-UM-PSGA-101A-12
Page 69 of 86
Table 4 Tunable laser output channels and corresponding wavelengths
Channel #
Wavelength
(nm)
Channel #
Wavelength
(nm)
Channel #
Wavelength
(nm)
1
2
3
4
5
6
7
8
9
10
11
12
13
14
15
16
17
18
19
20
21
22
23
24
25
26
27
28
29
30
1528.77
1529.16
1529.55
1529.94
1530.33
1530.72
1531.12
1531.51
1531.90
1532.29
1532.68
1533.07
1533.47
1533.86
1534.25
1534.64
1535.04
1535.43
1535.82
1536.22
1536.61
1537.00
1537.40
1537.79
1538.19
1538.58
1538.98
1539.37
1539.77
1540.16
31
32
33
34
35
36
37
38
39
40
41
42
43
44
45
46
47
48
49
50
51
52
53
54
55
56
57
58
59
60
1540.56
1540.95
1541.35
1541.75
1542.14
1542.54
1542.94
1543.33
1543.73
1544.13
1544.53
1544.92
1545.32
1545.72
1546.12
1546.52
1546.92
1547.32
1547.72
1548.11
1548.51
1548.91
1549.32
1549.72
1550.12
1550.52
1550.92
1551.32
1551.72
1552.12
61
62
63
64
65
66
67
68
69
70
71
72
73
74
75
76
77
78
79
80
81
82
83
84
85
86
87
88
89
1552.52
1552.93
1553.33
1553.73
1554.13
1554.54
1554.94
1555.34
1555.75
1556.15
1556.55
1556.96
1557.36
1557.77
1558.17
1558.58
1558.98
1559.39
1559.79
1560.20
1560.61
1561.01
1561.42
1561.83
1562.23
1562.64
1563.05
1563.45
1563.86
Document #: GP-UM-PSGA-101A-12
Page 70 of 86
Section 9. Remote Control:
The PSGA-101A can be remote controlled through either the GPIB or ETHERNET ports
on the rear panel.
9.1 GPIB Control
PC
DUT
TLS
Figure 54 Configuration for GPIB control using PC
The typical configuration for GPIB control of the PSGA and an external tunable laser is
shown in Figure 54. After the hardware connections are made, proceed through the
following steps:
•
Select GPIB setup from the “Setup” menu (Figure 55a).The GPIB setup dialog
window will appear (Figure 55b and c).
a)
b)
c)
Figure 55 GPIB setup interface
Document #: GP-UM-PSGA-101A-12
Page 71 of 86
•
•
Set the GPIB addresses of the PSGA-101A and the external laser source (if using
one).
Select the GPIB mode: “PC mode” or “No PC mode”.
(i)
No PC Mode (PSGA Mode): The PSGA acts as the GPIB controller; it
controls the other GPIB devices. In this mode, no other PC is connected to
the PSGA-101A through a GPIB connection. Without an external PC, the
PSGA can be used as a GPIB controller to control external lasers through
GPIB cables. If this mode is to be used, no external PC can be connected
to the PSGA via GPIB cable; if a PC is connected, the PSGA cannot
control the external laser or communicate with the PC. The GPIB address
of the PSGA is 0 (when it is used as a GPIB controller). The correct GPIB
address of the external laser to be controlled must be set in the setup dialog
window (Figure 55).
(ii)
PC Mode: the remote PC functions as the GPIB controller, with the PSGA101A as one of the GPIB devices under remote control. In this case, the user
should set a GPIB address between 1 and 30 for the PSGA-101A, and the
correct GPIB address for the external laser being controlled by the PSGA, in
the setup dialog window (Figure 55). The GPIB driver program “IRQ.exe”
should be run on the PC to support this mode (Figure 56), otherwise, the
PSGA cannot control the external laser to finish measurements. Please
set the correct PSGA GPIB address before attempting any measurements
or control.
Figure 56 Control interface of IRQ.exe
Document #: GP-UM-PSGA-101A-12
Page 72 of 86
After setting up the proper connections and operation modes, the user can perform
different measurements using the control commands given in Sections 9.3-9.9.
9.2 Ethernet Control
The PSGA-101A uses a TCP Server/Client to implement Ethernet control. The PSGA
has a TCP server which can receive requests from a TCP client and send back responses.
During setup, the PSGA’s Ethernet hardware connection should be in place. (There is a
network socket located on the rear panel of the PSGA). Click the PCI information icon at
the right bottom of the tool bar (Figure 57). The resulting network information dialog
box shows the current IP address and other network information. The user can then input
the PSGA’s IP address in the Server IP edit box of the client program and establish the
connection (Figure 58). Once the connection is set up, the user can use it to send
commands to the PSGA. On the PSGA end, when a command is received, a
communication interface shows up and detailed information regarding the
communication type, command content and command response is returned (Figure 59).
Figure 57 IP Setup
Document #: GP-UM-PSGA-101A-12
Page 73 of 86
Figure 58 TCP Client
Figure 59 Communication Interface
Users can use any programming language that supports the TCP/IP (for Ethernet) or
IEEE 488.2 (for GPIB) communication protocols to send commands to the PSGA-101A.
Document #: GP-UM-PSGA-101A-12
Page 74 of 86
Note: For commands that include a parameter such as a wavelength, there should be
exactly one space between the command body and the parameter.
For example, PSG:WAV 1500.00#.
Omitting the space or adding multiple spaces may result in an error message.
9.3 PSG GPIB/Ethernet Commands
Setup Commands
Control Command
*PSG:STA <state>#
*PSG:DWL ff.ff#
*PSG:WAV ffff.ff#
*PSG:ADPOW#
Description
Sets the PSG output polarization state.
<state> = RHC|LHC|LHP|LVP|45|-45|SCAN
Eg. PSG:STA 45# (set PSG output state to +45°)
Sets PSG dwell time (all values in sec.)
Unused digits do not need to be filled.
Example: PSG:DWL 1 (set dwell time to 1 sec)
Range: >0.1s
Sets PSG wavelength (all values in nm)
Unused digits do not need to be filled.
Example: PSG:WAV 1500.00#
Range: 1440nm~1620nm
Toggles 90° polarization rotator setting. Used to
increase PSG output power when initial input
polarization state is close to orthogonal to alignment
polarizer axis.
Error Response
E00, E01, E02
E00, E01, E02
E06
E00, E01, E02,
E06
E00, E01, E02
Status Report Commands
Report Command
*PSG:WAV?
Description
Returns PSG wavelength
*PSG:STA?
Returns current state
*PSG:STK?
Returns Stokes parameters for
PSG output polarization state
Returns dwell time setting
*PSG:DWL?
Document #: GP-UM-PSGA-101A-12
Returned Value
WAV ffff.ff
(unit = nm)
Example: WAV 1550.00
PSG RHC|LHC|0|90|45|-45|SCAN
etc.
STK sf.fff,sf.fff,sf.fff
Example: STK 1.000,-0.003,0.002
Example: PSG:DWL 1.0
(unit = s)
Error
E01
E01
E01
E01
Page 75 of 86
9.4 PSA GPIB/Ethernet Commands:
Setup Commands
Control Command
*PSA:ENA <setting>#
Description
PSA enable/disable
<setting> = ON | OFF
Example: PSA:ENA ON#
*PSA:MTD n #
Sets the PSA measurement mode.
PSA:MTD 0# | PSA:MTD 1#
0: high speed; 1: high precision. Default: 1
Sets PSA wavelength (all values in nm)
Example: PSA:WAV 1500.00#
to set wavelength to 1500.00 nm
Range: 1440~1620
*PSA:WAV ffff.ff#
Error Response
E00
E02: if the <setting>
parameter is omitted or is
something other than ON or
OFF
E00
E02: if n is omitted or is
something other than 0 or 1
E00,E01,E02,E06
Status Report Commands
Report Command
*PSA:ENA?
*PSA:STK?
*PSA:POW [dBm]|[mw]?
Description
Queries whether PSA is
enabled or disabled
Returns the current
measured Stokes
parameters
Returns input power
*PSA:PKG [dBm]|[mw]?
Returns Power and
Stokes parameters
*PSA:DOP?
Returns DOP of input
light
Returns azimuth angle θ
of input light
Returns ellipticity angle
φ of input light
Returns Stokes
parameter S1, S2 or S3
Returns the measurement
mode
Returns current
wavelength
*PSA:THA?
*PSA:PHI?
*PSA:S1|S2|S3?
*PSA:MTD?
*PSA:WAV?
Response
ENA ON|OFF
Error
STK sf.fff,sf.fff,sf.fff
E08,E09
POW sff.ff dBm
POW ff.fffff MW
PKG sff.fffff [DBM]|[MW],
sf.fff,sf.fff,sf.fff, sf.fff
(Format: Power,s1,s2,s3, DOP)
DOP f.fff
E08,E09
E08,E09
E08,E09
THA sff.f
E08,E09
PHI sff.f
E08,E09
S{1|2|3} sf.fff
E08,E09
0:high speed;1: high precision
E08,E09
WAV ffff.ff
Note: Parameters or units in brackets [] are optional. If they are omitted, the default value
will be used. For the commands in this table, the default unit is dBm.
Document #: GP-UM-PSGA-101A-12
Page 76 of 86
9.5 PMD/PDL scan GPIB/Ethernet Commands
Setup Commands
Control Command
*PMD:MTD n#
*PMD:TLS n#
*PMD:BGN#
*PMD:END#
*PMD:NEX#
*PMD:DWL ff.f#
Description
Sets the PMD measurement method.
n = measurement option:
0: Jones matrix eigenanalysis
1: PSA method
2: Mueller Matrix
3: Wavelength Scanning Method
Sets the type of tunable laser to be used for PMD
measurement.
n = laser option:
0: manual mode;
1: internal TLS;
2: Agilent TLS
Starts PMD measurement
Stops PMD measurement
Error
E00
E02: if n is omitted or is a
value other than 0, 1,2 or 3.
Begins next measurement for manual mode.
Sets the laser delay in seconds(e.g. 10.0)
This command used only for external laser.
(Range: 0~99s)
E00
E00
Document #: GP-UM-PSGA-101A-12
E00,E02,E06
E00,E70,E71,E72
E00
Page 77 of 86
Status Report Commands
Report Command
Description
Response
Error
*PMD:RDY?
Queries whether PMD data are
available
*PMD:SCN?
For the wavelength scanning
method, returns PMD values
calculated from variations in
s1, s2 and s3, respectively
Returns the number of
wavelengths/ channels included in
the measurement
Returns the nnnnth measured DGD
Range: nnnn ≤ mmmm-1
(see *PMD: NUM?)
0: available
1: not ready
Error code: see section 9.9
ffff.fff,ffff.fff,ffff.fff
E08, E09, E50, E51,
E52, E53, E54, E55,
E56
E50,E51,E52
*PMD:NUM?
*PMD:DGD nnnn?
*PMD:TWO nnnn?
*PMD:PSP nnnn?
*PMD: AVG?
*PMD: RMS?
*PMD:DEV?
*PMD:MAX?
*PMD:MIN?
*PMD:TWO:AVG?
*PMD:MTD?
Returns the nnnnth measured
second order PMD.
Range: nnnn ≤ mmmm-2
(see *PMD: NUM?)
Returns the nnnnth measured PSP.
Range: nnnn ≤ mmmm-1
(see *PMD: NUM?)
Returns the average DGD over
measured wavelength range
Returns the RMS DGD over
measured wavelength range
Returns the standard deviation of
DGD over measured wavelength
range
Returns the MAX DGD over
measured wavelength range
Returns the MIN DGD over
measured wavelength range
Returns the RMS second order
PMD over measured wavelength
range.
Queries the PMD measurement
method
mmmm
WL ffff.ff, DGD fff.fff
Note: λ returned is the λ
corresponding to the nnnnth
measured DGD.
WL ffff.ff SODGD ffff.fff
Note: λ returned is the λ
corresponding to the nnnnth
measured SODGD.
WL ffff.ff ,f.fff,f.fff,f.fff
(λ and Stokes parameters for
nnnnth PSP)
ffff.fff
E06
E06
ffff.fff
ffff.fff
ffff.fff
ffff.fff
ffff.fff
0: Jones matrix eigenanalysis
1: PSA method
2: Mueller Matrix
3: Wavelength scanning
WL ffff.ff, PDL fff.fff
Note: λ returned is the λ
corresponding to the nnnnth
measured PDL.
ffff.fff
*PMD:PDL nnnn?
Returns the nnnnth measured PDL
Range: nnnn ≤ mmmm
(see *PMD: NUM?)
*PMD: PDL:AVG?
Returns the average PDL over
measured wavelength range
*PMD:PDL:DEV?
Returns the standard deviation of
PDL over measured wavelength
range
ffff.fff
*PMD:PDL:MAX?
Returns the MAX PDL over
measured wavelength range
ffff.fff
*PMD:PDL:MIN?
Returns the MIN PDL over
measured wavelength range
ffff.fff
Document #: GP-UM-PSGA-101A-12
E06
E06
Page 78 of 86
9.6 PDL single wavelength measurement GPIB/Ethernet Commands
Setup Commands
Control Command
*PDL:MTD n#
*PDL:BGN#
*PDL:END#
Description
Sets the measurement method.
0: Jones matrix method
1: Mueller matrix method
Starts PDL measurement
Stops PDL measurement
Error
E00,E02, E04
E00
E00
Status Report Commands
Report Command
*PDL:RDY?
*PDL?
Description
Queries whether PDL data are
available
Returns the PDL value.
This command is only available in
single wavelength mode.
Document #: GP-UM-PSGA-101A-12
Response
0: available
1: not ready
ff.ff
Error
E08,E09,E61, E62
E64
Page 79 of 86
9.7 Wavelength Setup Commands for PMD and PDL measurement
Setup Commands
Control Command
Description
Internal Tunable Laser
Error
*MEA:CHN:SIN nn#
Sets laser channel to nn. Used for single
wavelength PDL measurement.
Sets the start channel for a scan
Sets the end channel for a scan
E00,E02,E06
*MEA:CHN:LWR nn#
*MEA:CHN:UPR nn#
*MEA:CHN:STP nn#
Sets the step size (# of channels) for a scan
External Laser
Sets laser wavelength to ffff.ff nm. Used
for single wavelength PDL measurement.
Sets the start wavelength for a scan
Sets the end wavelength for a scan
Sets the wavelength step size for a scan
*MEA:WAL:SIN ffff.ff#
*MEA:WAL:LWR ffff.ff#
*MEA:WAL:UPR ffff.ff#
*MEA:WAL:STP ffff.ff#
E00,E02,E06
E00,E02,E06
E00,E02,E06
E00,E02,E06
E00,E02,E06
E00,E02,E06
E00,E02,E06
Status Report Commands
Report Command
*MEA:CHN:SIN?
*MEA:CHN:LWR?
*MEA:CHN:UPR?
*MEA:CHN:STP?
*MEA:WAL:SIN?
*MEA:WAL:LWR?
*MEA:WAL:UPR?
*MEA:WAL:STP?
Description
Internal Tunable Laser
Returns current channel number
(single wavelength operation)
Returns the start channel number
Returns the end channel number
Returns the step size
(# of channels)
External Laser
Returns current wavelength (in nm)
(single wavelength operation)
Returns the start wavelength (nm)
Returns the end wavelength(nm)
Returns the wavelength step size (nm)
Document #: GP-UM-PSGA-101A-12
Response
Error
nn
nn
nn
nn
ffff.fff
ffff.ff
ffff.ff
ffff.ff
Page 80 of 86
9.8 Internal tunable laser commands
Command
*POW?
*TLS:REG hhhhhh?
*TLS:CHN nn#
Description
Returns the laser output power in dBm.
Query the TLS register;
hhhhhh is the register, data1, and data2.
For example, to determine the status of register
0x32 when data1 is 0x00 and data2 is 0x00, the
correct command is *TLS:REG 320000?
Sets the channel of the laser source. nn=0~88
*TLS:CHN?
Returns the current channel number. This
command is available for sweep mode
*TLS:FRQ?
*TLS:WAV?
*TLS:STA n#
Returns the current frequency of laser source
Returns the current wavelength of laser source
Switch the laser source on or off
0: laser off; 1: laser on ;
Queries the laser state.
0: laser off.
1: laser on;
2: laser not available
*TLS:STA?
*TLS:SWP:MOD n#
*TLS:SWP:MOD?
*TLS:SWP:CYC nnn#
Sets the sweep mode.
0: manual mode.
1: auto mode.
Query the current operation mode
Sets the number of scan cycles to be executed.
Range:1≤ nnn ≤ 999; if nnn >999 or nnn<1, the
number of cycles will be defined to be infinite
(INF), and the laser will continue scanning until
manually stopped.
Response
*POW 2.55#
Returns the status of
register: hh hh hh hh.
Refer to OIF-ITLAMSA for the meaning
of the data.
*E00#: OK
*E01#: undefined
command
*E06#:parameter out
of range
*CHN 12#
*E01#: undefined
command
*STA 0#: laser off
*STA 1#: laser on
*STA 2#: laser not
available
*MOD 0/1#
Sample commands:
*TLS:SWP:CYC nnn#
*TLS:SWP:CYC INF#
*TLS:SWP:CYC?
Returns the number of scan cycles set.
*TLS:SWP:DWE nnnn#
Sets the dwell time per step for auto sweep mode
Can only be used in auto mode;
Range for nnnn is 20-3600 ms
*CYC 0#: cycle is
infinite
Sample command:
*TLS:SWP:DWE 100#
*TLS:SWP:DWE?
*TLS:SWP:REP n#
Returns the dwell time per step (auto sweep mode)
Sets the repeat mode.
N=0 or1
0: One way. Every sweep cycle starts at the start
wavelength and ends at the end wavelength
1: Round trip: Each sweep cycle starts at the start
wavelength, scans to the end wavelength, then
scans back to the start wavelength.
Document #: GP-UM-PSGA-101A-12
Page 81 of 86
*TLS:SWP:REP?
Returns the current repeat mode.
*TLS:SWP:BGN nn#
Sets the start channel for a sweep. nn: 0~88
*0#; one way
*1#: round trip
Sample commands:
*TLS:SWP:BGN?
*TLS:SWP:END nn#
*TLS:SWP:END?
*TLS:SWP:STE nn#
*TLS:SWP:STE?
*TLS:SWP:STA n#
*TLS:SWP:BGN 0#
*TLS:SWP:BGN 88#
Returns the currently set sweep start channel
Sets the end channel for a sweep. nn: 0~88
Returns the currently set sweep end channel
Sets the step size (# of channels).
nn:1~88
Returns the step size (# of channels)
Stops, starts, pauses or continues a paused channel
sweep
Options for n:
0: stop
1:start
2: pause
3: continue
*TLS:SWP:STA?
*TLS:SWP:ssss#
*TLS:RST#
*TLS:WAV nn?
*TLS:FRQ nn?
*TLS:CHN:MAX?
Returns the sweep status.
0: Sweep is not running; 1:Sweep in progress
ssss: next. In manual mode, advances to the next
wavelength in the sequence.
*E00#: OK
*E01#: command
error
*E13#: parameter
setting error; the start
and end channels are
not compatible with
the step size.
*E14#: commands
conflict; e.g. “stop”
can be used only if a
scan is in progress,
“start” can be used
only if a scan is
stopped or paused,
“pause” can be used
only if a scan is in
progress; “continue”
can be used only if a
scan is paused.
*E15#: TLA is not
ready for output.
Command should be
re-sent
*E00#: OK
*E01#: command
error
*E14#: commands
conflict; this
command can only be
used in manual
sweep.
Resets laser source- all settings are reset to default
values.
Returns the wavelength of the channel nn.
Returns the frequency of the channel nn
Returns the number of the highest available
channel.
Document #: GP-UM-PSGA-101A-12
Page 82 of 86
9.9 Error Definitions
E00
E01
E02
E03
E04
E05
E06
E07
E08
E09
E10
E11
E12
E13
E14
E15
E50
E51
E52
E53
E54
E56
E60
E61
E62
E64
E65
E70
E71
E72
No error (State OK)
Undefined Command
Missing or incorrect parameter
Invalid syntax found in command string
string of characters too long (>buffer limit)
parameter has too many digits after the decimal point
parameter outside the allowed range
Failed Self Test
Light power too high
Light power too low
Incorrect operating wavelength
(Outside operating wavelength range)
Error loading stored values
Unable to store state
Parameter setting error; the start and end channels are not compatible
with the step size. Response to *TLS:SWP:STA n# command
Command conflicts with another command already in operation
TLA is not ready for output. Command should be re-sent
Wavelength scan PMD measurement failure
Requested command only applies in wavelength scan mode.
Current PMD measurement method is not wavelength scan method
Wavelength Scan initialization failure
Poincaré Sphere Analysis PMD measurement failure
Mueller Matrix PMD measurement failure
Jones Matrix PMD measurement failure
PDL measurement initialization failure
Mueller Matrix PDL measurement failure
Jones Matrix PDL measurement failure
Measurement mode is not single wavelength mode
Measurement mode is not wavelength scanning mode
Incorrect wavelength setup
Incorrect channel setup
Wavelength scan PMD measurement cannot use manual laser mode
Document #: GP-UM-PSGA-101A-12
Page 83 of 86
Section 10. Technical Support and Factory Service Information:
10.1 Technical Support
General Photonics is committed to high quality standards and customer satisfaction. For
any questions regarding the quality and use of the PSGA-101A, or future suggestions,
please contact General Photonics Corporation at (909)-590-5473 (telephone) or (909)902-5536 (fax), or by e-mail at [email protected]. General Photonics will
respond to all customer questions within 24 hours during regular business hours. General
Photonics can also be contacted by mail at:
General Photonics
5228 Edison Avenue
Chino, California 91710
USA
Document #: GP-UM-PSGA-101A-12
Page 84 of 86
10.2 Factory Service Information
The PSGA-101A Polarization Measurement System contains no user serviceable parts.
To obtain information regarding factory service, contact General Photonics Corporation
or your General Photonics representatives/distributors. Please have the following
information available:
1.
Instrument model number and serial number
2.
Description of the problem.
If the instrument is to be returned to General Photonics Corporation, you will be given a
RMA Number, which you should reference in your shipping documents. Please fill out a
copy of the service form, located on the following page, and have the information ready
when contacting General Photonics Corporation. Return the completed service form with
the instrument.
Related product warranty information can be found on the second page of the user
manual.
Document #: GP-UM-PSGA-101A-12
Page 85 of 86
Service Form
Name_________________________________
Return Authorization # _________________________
(Please obtain RMA# prior to return of item)
Company _________________________________________________________
Address ______________________________
Date _______________________________________
Country _______________________________
Phone Number _______________________________
P.O. Number ___________________________
FAX Number _________________________________
Item(s) Being Returned:
Model # _______________________________
Serial # _____________________________________
Description
___________________________________________________________________________________
___________________________________________________________________________________
___________________________________________________________________________________
___________________________________________________________________________________
___________________________________________________________________________________
Reason for return of goods (please list any specific problems):
_____________________________________________________________________
_____________________________________________________________________
_____________________________________________________________________
_____________________________________________________________________
_____________________________________________________________________
_____________________________________________________________________
_____________________________________________________________________
_____________________________________________________________________
_____________________________________________________________________
_____________________________________________________________________
_____________________________________________________________________
_____________________________________________________________________
_____________________________________________________________________
_____________________________________________________________________
_____________________________________________________________________
_____________________________________________________________________
_____________________________________________________________________
Document #: GP-UM-PSGA-101A-12
Page 86 of 86