1
Unfair Advantage 1. Overview 1.1. Introduction Welcome to Unfair Advantage. This is a revolutionary new data retrieval/management/analysis system for investors with personal use applications that puts the world's most complete and accurate financial database at your finger tips. From effortless data management to automatic error corrections, innovative analysis and trading system certification, Unfair Advantage is unrivaled. See Navigating Through UA for a map of program features. The main functions of Unfair Advantage are: 1) Unparalleled historical scope of world futures markets reaching backward to the pre-1950s, covering every conceivable commodity product (including options) and an inventory of stocks, funds and indices from the U.S., U.K., Canadian and other world financial markets. Commitment of Traders information is also available through UA. All of these data are immediately accessible to every user, without a need to download historical archives. You select the databases for use as part of the installation process. 2) Updating - This feature adds current market data to the historical database provided on your initial CDROM and stored on your computer's hard drive. From there, any data file can be made available for charting or other types of analysis. Downloaded information is distributed daily to a database file, from which the other formats are developed for use. Daily updates of the database are handled through the Internet using your own Web Browser and Internet Service Provider. CSI also maintains a backup dial-in link over standard phone lines which can be used at any time. Each update retrieves daily summary prices on all markets within your subscription category. These can include all current contracts, options and cash prices for CSI's U.S. commodity database, CSI's overseas commodity database, commitment of traders data and/or CSI's stock database. Replacement files of historical data are also available online to protect users from inadvertent data corruption that might stem from communication failures. 3) Portfolio Management - Unfair Advantage's portfolio system keeps all charts and data files updated and available at the click of a mouse. Contracts or stocks of interest are listed in your portfolio so that they can be viewed or accessed instantly. Your portfolio can be customized to your specific needs. Individual contracts and customized continuous computed contract series are always available. Users who wish to analyze data with third-party analysis programs can do so at any time by specifying the required formats for various portfolio applications. Developers can use a built-in API to access all data with fast, formatless simplicity. Commercial users may, at a higher price, enjoy even greater flexibility through a read DLL (API) that offers quick access to information on thousands of the most current world markets. 4) Charting/Analysis - You'll love the functionality and ease of Unfair Advantage's charting package. Supercompressed or vividly detailed charts can be viewed instantly on your choice of markets. Charts may be annotated with comments such as trade records or important events. This release offers bar and candlestick charts with volume, open interest and cash. An expanding list of technical indicators includes trend lines, COT indicators, stochastics, moving averages, RSI, spreads, basis and seasonal index studies. Charts may be printed or saved as a clipboard image for pasting into documents. 5) The included MultiMarket Analyzer can manage trading opportunities through a mathematical statistics perspective and offers unique and profitable commodity and stock trading situations. The unique Trading System Performance Evaluator (TSPE) can assess your account funding requirements, your likelihood of User's Reference Manual Page 1 Unfair Advantage obtaining profitable performance and help to certify whether it is possible to repeat any simulated or actual trading experience. 6) A Trader's Accountant package, capable of addressing a portfolio of products quoted in mixed currencies, will be included in subsequent versions of Unfair Advantage. Both TSPE and the Trader's Accountant are available to users who pay the full Unfair Advantage license fee. Thank you for your order. Enjoy! 1.2. Unfair Advantage's Advantages What do YAHOO, MICROSOFT, ALTAVISTATM, PRODIGY, GO2NET, AOL'S NETSCAPE and scores of other on-line service providers have in common? THEY ALL GET THEIR MARKET DATA FROM CSI! WHY CSI? Top Internet firms demand error-free info, consistent on-time delivery, broad scope and unparalleled longevity. CSI was named "the best" for data accuracy by Futures Magazine in a recent independent study, soundly defeating visible firms like Reuters, Bridge/CRB, Omega Research, the supplier to CompuServe, and all others tested. Excellence in data is mandatory, but CSI's Unfair Advantage(UA) software might obsolete Omega's TradeStation. UA offers: • An economist's dream system derived from an advanced mathematical statistics base. • Analytical capital preservation software to certify your system before you trade. • Access to historical data reserves on world markets through an OLE API, • Charting tools, all above & 500,000+ years of stock, fund, index, futures & futures options data, and • Office accounting support coming soon at no extra cost. The personal user of Unfair Advantage should view the products as one might regard an encyclopedia. An encyclopedia provides plenty of depth on complex topics for reference purposes, but very few owners will, in a life time, read all volumes from cover to cover. Likewise with UA, it would be rare for a trader to access all or even a majority of the markets of the world each day, unless he is engaging in a Commercial, or nonpersonal-for-profit purpose. 1.3. Hardware Requirements Hardware Requirements Page 2 User's Reference Manual Unfair Advantage Unfair Advantage is a 32-bit Windows application. It requires: • • • • • • • • , Windows NT Windows 95 or Windows 98 operating system A Pentium-powered PC computer with speeds of 200Mz or faster CD-ROM drive* At least 32MB of RAM A VGA monitor A mouse or comparable pointing device A modem or direct network access 60 MB of free disk space (for commodities), 165 MB (for stocks) and 15 MB (for options - UA comes with no more than 2 years of option history). The commodity database currently grows by about 650 KB/month. The stock database grows by 4.7 MB/month. *Some UA software is shipped on CDR disks, which may not be compatible with high-speed CD drives. If you have a 36X or faster CD-ROM drive and experience difficulties with software installation, please contact CSI technical support to discuss other alternatives such as sending a different type of CD or downloading the software. Communication Requirements • Internet Access is recommended • Direct-dial (standard phone line) access is available Because Unfair Advantage uses the Internet for data retrieval, you'll need to open an account with an Internet Service Provider for your regular updates. Chances are, whatever direct Internet Service Provider you use will be compatible with Unfair Advantage. Direct Internet Service providers typically use Netscape Navigator™ or Microsoft's Internet Explorer™ for accessing the Web. These browsers may be required for dedicated line access if your system includes a firewall. If you do not yet have an Internet connection, you may proceed with data retrieval through a direct-dial phone call to CSI's host with your modem. The user, NOT CSI, is responsible for all on-line access charges and/or long-distance phone charges associated with retrieving data. If you do not already have access to the Internet through an on-line service, and plan to use the Internet, now is the time to order a startup kit from the company of your choice. 1.4. Locked Database/Disk Termination Unfair Advantage comes to you with a "locked database." This means that you cannot access the data for charting or analysis until it is "unlocked." The process of unlocking the database is simple: collect a daily update from CSI. Please read on for a few more pages and you will learn how to make that first daily update. Because the database on your CD-ROM could not capture the market statistics that transpired during shipment, the first thing you'll want to do after installation is bring your database current. This assures that your files are up to date and that the software is unlocked and fully functional. You MUST install all desired databases from the CD before making your first update and you MUST update your files with a complete distribution immediately upon installation. User's Reference Manual Page 3 Unfair Advantage The Unfair Advantage database should be updated at least once every month to keep the software working. Failure to update within a two (2) month span during your current subscription may result in the temporary loss of license to use the database and additional expenses. If this occurs, the database will be corrupted by an irreparable elapsed-time gap and a replacement CD must be ordered from CSI and installed to restore the software's functionality. 1.5. About Updates & Portfolios Each update session retrieves the most recent day and a refurbished repeat of the previous day updated to assure completeness of the prior day's information. All missing days of trading activity since your last update, for a period covering up to two months, will also be included. An update transmission can also include automatic error corrections and new information to be added to the factsheets. Updates of the commodity database typically take no more than two minutes per day of data. Stock updates take significantly longer. The Unfair Advantage database must be updated at least once every month to keep the software working properly. Unfair Advantage allows you to define a portfolio of those commodity contracts and stocks you'll want to view on a regular basis. Typically, normal commodity contracts and stock files listed in your portfolio are appended with new data each day. An alternative to appending is to rewrite a file from scratch using the compressed data in the UA database. Files are written and rewritten as needed to create continuous contracts and to adjust continuous contracts for contract rollovers and possible changes or corrections to the data series. Your first portfolio will be built from scratch during the distribution process, so please allow several minutes for your initial portfolio build. Subsequently, your adjusted continuous contracts will be rebuilt automatically whenever contract rollovers occur. You may select an individual file or group of files for manual rebuilding by right-clicking its entry in your portfolio list and clicking either "Rewrite File Immediately" or "Rewrite file on next update." This would be necessary to reformulate a contract after you change its specifications in your portfolio or after you recollect history for a given file. You may also disable automatic appending through the Options menu, which would cause all contracts to be rewritten on every update (NOT RECOMMENDED!). When your portfolio holds files for export to alternate formats (ASCII, MS, CSIM or QT), the export files are automatically maintained by UA during the data distribution process. 1.6. Using UA with third-party software Unfair Advantage includes a simple interface for easy compatibility with your favorite investment program. It can easily write files to the CSI (QuickTrieve) format, MetaStock format, the CSIM format (a CSIengineered alternative for compatibility with MetaStock) and ASCII format. Desired formats may be selected for each contract or stock under Export Options of UA's "Selecting Data Series" screens. The Data Options screens let you customize CSI Format Options and CSIM/MS Format Options. For ASCII Page 4 User's Reference Manual Unfair Advantage files, you can customize ASCII file names, ASCII Field Layout and ASCII Miscellaneous (header line and handling of holidays). This manual includes a chapter on Third-Party software with tips and suggestions for seamless compatibility. 1.7. Demo Version A limited scope Demonstration Version of the software may be downloaded at no charge from the CSI website at www.csidata.com. The Demonstration version contains full history for: •Live Cattle (LC) #2 •Wellpoint Health Networks Inc (WLP) #1003 •American Re Corp (ARN) #1004 •Beta Well Services (BWS) #1005 •Developers Diversified Reality Corp (DDR) #1006 •Nine West Group (NIN) #1007 •Carramerica Realty Corp (CRE) #1008 •Leviathan Gas Pipeline Pref Un (LEVP) #1009 Abbreviated history is provided for the following markets: •Hang Seng Index (HSI) #119 •Soybeans (S) #17 •Swiss Franc (SF) #25 •Gold (GC) #30 •Sugar(#11) World (SB) #20 •Eurodollar (ED) #141 •S&P (SP) #149 and •Light Crude Oil (CL) #188 Users of the Demonstration Version may also access daily updates on the above series via the Internet for a limited period of time. Registration is required. 1.8. Ordering Unfair Advantage The fully functional Unfair Advantage program and database are available exclusively from Commodity Systems, Inc (CSI). Demonstration and limited capacity versions may be available from other sources. Visit CSI's Website at www.csidata.com for full details and online ordering information or call CSI marketing at: 1-800-274-4727 (Toll Free) or (561) 392-8663 Write to: CSI 200 W. Palmetto Park Rd. User's Reference Manual Page 5 Unfair Advantage Boca Raton, FL 33432 USA Fax: (561) 392-1379 The complete Unfair Advantage database is quite extensive, making on-line delivery impractical. The full database is shipped on CD along with the Unfair Advantage software. 1.9. Customer Support CSI offers support for Unfair Advantage users in many ways: 1) This manual can be read online or printed for handy reference. To read the manual, click the Initiate menu, then click "View Online Manual." Throughout the UA program, you can view interactive help screens by placing your mouse on the desired screen or prompt and pressing F1. 2) Current Frequently Asked Questions (with answers) and notices are posted on the CSI website at www.csidata.com. These, along with the Tech Talk column of our monthly newsletter (also on the web) often provide a quick solution to simple problems. 3) Periodic upgrades are made available, usually at no charge, on our website. Downloading a software upgrade on the CSI website at www.csidata.com can sometimes solve problems that have already been discovered and fixed by the CSI software development team. Each upgrade includes a description of current capabilities, as well as known problems with the release. 4) Background information is at your finger tips. Unfair Advantage's Online Factsheets include footnotes that explain data anomalies that might cause concern. Check the factsheets to answer most questions about historical data. 5) We offer an e-mail technical support system for questions and comments that are not urgent, that come up outside of office hours, or that may require time to research. Contact our service staff at [email protected]. These e-mails are usually answered within the same day or the following two business days. 6) Our friendly, knowledgeable technical support staff is available for telephone support from 8:30 a.m. to 9:30 p.m. (eastern time) Monday - Friday, except on major holidays. There is no charge for contacting our service staff. Our programming staff strives to identify and correct any error associated with our software, but we need enough information to reproduce a problem before we can fix it. Please gather the information below before contacting customer service about a possible software error: • • • • • • • Your User ID Your Windows Version Your UA version number The exact wording of any error message The name of active window at the time of the problem The conditions when the error occurred A list of steps that lead to the problem • A detailed description of what has been tried so far. The Customer Support Telephone Number is (561) 392-8663. Page 6 User's Reference Manual Unfair Advantage We ask that our customers use CSI support services in the order presented above, with exceptions as needed for urgent situations. Please use the reference materials provided and consult our website for remedies before contacting the support staff for assistance. Use e-mail for reporting non-urgent programming bugs. In this way, we can provide the best service possible to all our customers, and assure that our staff is available for you when you need us most. User's Reference Manual Page 7 Unfair Advantage 2. Getting Started 2.1. Installing Unfair Advantage 2.1.1. Loading the Software Traders are raving about the functionality and ease of use afforded by CSI's Unfair Advantage software. It all begins with loading the software and appropriate database on your computer, then follows up with updating and analysis. Please note that everything supplied on the Unfair Advantage CD-ROM is compressed and must be installed on your computer before it can be used. The "Installing Unfair Advantage" chapter leads you through the process. To begin installing Unfair Advantage, simply power up your computer and, with no other programs running, insert the Unfair Advantage CD ROM and close the drive. Most computers are configured to automatically launch the CD and begin the installation routine. If the CD does not launch automatically, you'll need to launch the installation routine as follows: Right-click the Start button, then click Explore. Scroll through the All Folders window to find and click on your CD drive (probably D:, E:, F: or G:). From the 'Contents of drive' listing, double-click on the program InstSwit.exe and the installation process will begin with selection of the version. If you are re-installing Unfair Advantage from a CD ROM, please uninstall any previous versions of UA prior to installing your new software. After uninstalling, restart your computer before installing from the CD. DO NOT uninstall when UPGRADING from the website. Next, you'll select the version to install. 2.1.2. Selecting the version to install When the Unfair Advantage CD first launches on your computer, the Install Switch screen displays offering the option of installing the current recommended version, a Demo version and perhaps a Beta Test version of an upcoming release: The recommended choice (1.75.9 in above example) is presented first on the list. The sequence of recommended and Beta versions will slowly progress to higher version numbers as the product matures, functionality improves and features are added. Page 8 User's Reference Manual Unfair Advantage If a Beta (test) version of UA is offered, it should be selected ONLY if you are already quite familiar with Unfair Advantage and are willing to accept greater risk of possible software failures. The Beta version gives customers the benefit of leading-edge advances, but at the cost of possibly reduced reliability and stability. Beta test subscribers must be willing to document problems and transmit feedback to the CSI staff via email. The Demo Version is comparable to the one available from the CSI website. Feel free to use the Demo version for a limited test of the system. If you have already subscribed to CSI for daily updates with Unfair Advantage, please limit your testing with the Demo to no more than two weeks from the time you received the CD. You must begin using the complete UA system within one month of shipment to avoid possible disk termination. Upon selecting the version, you must acknowledge CSI's copyright before selecting with the installation directory. 2.1.3. Selecting the Installation Directory This program MUST be stored in its own directory (such as C:\UA), not directly in the root directory (C:\). Use any valid drive for storing the UA software. We strongly recommend using C:\UA (the default) as the drive and directory. DO NOT store UA in a directory with other programs! Please do not attempt to network this product. Our license agreement prohibits networking. Your choice of installation directory becomes important when and if you ever decide to un-install Unfair Advantage. The uninstall routine automatically deletes all files within the directory selected here. Installing UA in its own directory also protects all your software from damage caused by common filenames within the different programs. Upon selecting the directory, click OK, and the UA files will be decompressed and copied to your hard drive. The copying process may be lengthy (five to ten minutes) and is followed by the Unfair Advantage program group displaying. The installation routine automatically proceeds with Database Selection. 2.1.4. Choosing the database(s) & Portfolio to install The database to be installed refers to the historical data that will be stored on your computer's hard drive. Although the UA CD holds all history on all markets, your system will only be able to access and maintain the markets that are installed on your hard drive, and that correspond to your subscription category from CSI. CSI offers different subscription categories to accommodate the specific needs of our customers. The User's Reference Manual Page 9 Unfair Advantage subscription categories and their prices are listed on CSI's website at www.csidata.com. You should install the database that corresponds to your subscription category. If you subscribed to CSI for commodities only (either domestic or world), you should select just Commodity History. Other options are for Stock and Mutual Fund History, or for Both, including commodities, stocks and funds. The option of None is never appropriate for a new subscriber. It may be useful for current subscribers upon re-installing software if the database is current and has been preserved through a backup procedure. If you do not install a necessary database upon installation of the software, you can return to this screen and install it later, but only within the first month after receiving the software. If you wish to install a database after that time, you'll need to order a new CD from CSI. This is necessary because the database you might add will need to be brought current and a new CD is the only practical way to accomplish this. Installation of the database(s) might take up to ten minutes, depending upon the database(s) selected and the speed of your computer. See "Selecting the Portfolio to Install" (below) for information on completing this screen. As this manual goes to press, CSI charges for several categories of service, including "North American" an "World" commodity coverage, U.S. and foreign stocks and U.S. and foreign options. Pricing varies by content and depth of market coverage. YOU MUST MAKE PRIOR ARRANGEMENTS WITH THE CSI STAFF IN ORDER TO RETRIEVE STOCK DATA!! If you have installed the stock database and plan to maintain it with daily updates, you should arrange for stock updates BEFORE your first download. Please call the CSI Bookkeeping Department at 1561-392-8663 to arrange for stocks, if you haven't already done so. Selecting the Portfolio to Install Your portfolio is the list of normal, computed and/or continuous contracts or stocks to be followed on a regular basis. It typically holds the nearby current contracts of several commodities, plus computed contracts such as adjusted continuous and cash. A stock trader's portfolio would list all stocks of interest. Page 10 User's Reference Manual Unfair Advantage To facilitate a quick start with Unfair Advantage, the software comes with a few standard portfolios. Feel free to use any one of the portfolios provided with your original CD if it meets your needs. You'll note that a few compatible software programs have provided us with specialized portfolios for you to choose from. Current options include: None, Standard CSI Demo, Stock Index Component Portfolio, One Day at a Time, Vantage Point, and One Day at a Time AND Vantage Point. The choice of "None" might be appropriate if you have saved a portfolio from a previous installation, want to import a portfolio or if you prefer to enter a custom portfolio from scratch. We recommend the Standard CSI Demo for your initial installation.You may want to start with a sample portfolio and later modify it to accommodate your own data requirements. Select the portfolio of your choice, then click OK. Don't be too concerned about getting your portfolio exactly right at the beginning. It can be modified at any time, and contracts and stocks that are not in your portfolio can still be viewed through UA. CSI maintains a current portfolio file for each of the above, (and possibly more, in the future) on the CSI website. A warning box displays after installation is complete asking you to reboot your computer: Be sure to shut down and restart your computer (through the Start menu) after the installation is complete. We have found that rebooting the system at this point greatly reduces the possibility of software failures User's Reference Manual Page 11 Unfair Advantage caused by conflicting DLLs, making it well worth the effort. Remember to shut down and restart your computer whenever you install new software from CSI. This applies to software received on CD as well as upgrades downloaded from the website. 2.2. Using UA for the First Time 2.2.1. Launching Unfair Advantage To start Unfair Advantage, click your PC's Start button, then choose Programs, CSI Unfair Advantage and finally, click Launch New UA, as shown below. (This is an example of a typical desk top. Your computer will show a different list of programs, with CSI Unfair Advantage as one of the choices.) Use the same procedure for subsequent startups. Page 12 User's Reference Manual Unfair Advantage 2.2.2. User ID and User Number The first time you launch Unfair Advantage, the following displays: Your User ID is a three-letter code and your User Number is a five-digit number, both of which are included prominently in your CD ROM case. Enter the User ID, then press <Tab> to move the User Number box. Type your number, then click OK. You may edit these entries while running UA by pulling down the Options menu and clicking Data Options. They are located on the "Account" tab. You are responsible for all accesses on your private account, so be sure to safeguard your User ID and User Number. They represent the security measures preventing others from charging data collection against your CSI account, which is limited to a liberal number of days of data downloading per month. Because it would be possible for one user to grant service to an acquantence by loaning his installation CD-ROM, we attempt to control access frequency to protect CSI from unauthorized service usage. 2.2.3. Data Presentation Before you can get started with data retrieval and analysis, UA requires that you select your desired presentation of settlement prices that occur outside the day's trading range (for commodities). Many traders make the mistake of assuming that the settlement price quoted by the exchanges is the same as the last or closing price. This is not necessarily so. Many contracts, particularly at the mercantile exchanges are "settled" by a committee of exchange officials after the close of the markets. The settlement price is commonly used as proxy for the closing price in simple bar-chart analysis. When markets are settled outside the trading range, it is a common practice (although not necessarily recommended) to adjust the high or low to match the settlement. Unlike all known competitive data services, UA lets users make an informed decision on how to present data. During your initial installation, you are asked your choice for "Making close in high/low range:" User's Reference Manual Page 13 Unfair Advantage • As published: This option provides files and charts with the actual open, high, low and settlement, even when the settlement is outside the trading range. When the settlement committee decides, after the close, that the settlement should be at a level where no trading occurred, charts can show a no-trading gap between the actual high/low bar and outlier settlement price. Appropriately programmed analysis software can make maximum use of available information through this choice. Please note that some CSI-compatible analysis software CANNOT process closes outside the trading range. If you experience unexpected results with another analysis product using "As published" settlements, consider changing to Modify High/Low. • Modify High/Low (the default, for a typical open-high-low-close bar): This option makes the close price (settlement) fall within the high/low range by adjusting the range. It produces files and charts with possible adjustments to highs and lows when the settlement is outside the trading range. A traditional open, high, low, close bar chart results. By taking this option, you may produce an artificial trading range, which includes an area where no trading occurred. Because some analysis programs require this data presentation, we made it the default setting. • Modify Close: This option makes the close price (settlement) fall within the high/low range by changing out-of-range settlements. It produces files and charts where the closes (settlements) may be modified if the settlement price lies outside the daily trading range. In the event that the settlement lies outside of the high-low range, the settlement may be adjusted to match the high or low which is closest to its value. This technique ignores the settlement price, but preserves an accurate view of the market's trading range. Settlement accounting users would not obtain an accurate view of a portfolio's value using this option. Click your choice, then OK. This is the last preliminary screen for your initial start-up. These screens will not display again. You can change your choice in the future and set other important options regarding the rounding of your data by selecting Data Options from the Options menu, clicking the Rounding/Ranging tab and clicking your choice. 2.2.4. Navigating through UA After answering the initial questions to customize your setup and, thereafter, whenever you launch the program, the Unfair Advantage screen displays: Page 14 User's Reference Manual Unfair Advantage Across the top are topics for pull-down menus (Initiate, Portfolio, Chart Tools, Options, Window and Help). You can click on any of these for an additional list of options. Below the list of menu topics is a toolbar that provides an alternate method of navigating through the software. Each button on the toolbar represents a different aspect of using UA. They are: Download Quotes New Chart Send Data to Third Party Software Generate Database Snapshot Print Chart This set of toolbar icons applies only to the active UA chart User's Reference Manual Page 15 Unfair Advantage Compress Chart Date Range Expand Chart Date Range Chart Crosshair Change Indicators on Chart Chart Tools Factsheets Place your mouse over any of the icons (without clicking) to display these descriptions, then click on your choice. On the left side of the above screen a portfolio is shown. If you chose to install the software without a portfolio, then this portion of the screen may be blank. See Portfolio Overview for information on creating a custom portfolio to meet your needs. The right-hand window will display charts and tables, once they have been selected. Although UA is designed to let you display any item in the database, you can't do so until you have unlocked your database by collecting an update. See Downloading Quotes for instructions. Throughout the UA program, you can view interactive help screens by placing your mouse on the desired screen or prompt and pressing F1. See Troubleshooting for help and tips if you have a problem. 2.2.5. Downloading Quotes The required settings for downloading quotes depend upon your desired method of access. Unfair Advantage is shipped configured for Internet access. If you are a regular Internet user, you may be able to quickly get online without any additional customization as described below. If these instructions are insufficient for your Internet applications, or if you wish to use Direct Dial or Browser access, please see the detailed instructions in the Downloading Data chapter. For fast-track Internet access: With your web browser online* in the background and the Unfair Advantage screen displaying, click the Download New Quotes icon on the toolbar. If all goes well, the Download Data Communication Settings screen will display with an "Internet Download" confirmation box superimposed as shown below: Page 16 User's Reference Manual Unfair Advantage Assuming you entered your User ID and Customer Number correctly and you have not waited beyond the two-month time window for updates since the database was last updated (see the date at lower right), then Unfair Advantage will have all the necessary information to bring your full database current. The time required for your first download will depend upon the number of days to be updated and the scope of your database. A lengthy data series of a month or more, especially if both commodities and stocks are updated, may take two hours or more. Please be patient and allow UA to complete its download and distribution. Once the data is stored on your hard drive, you'll have quick, easy access to the entire history of all your markets. You can avoid lengthy updates in the future by keeping your database relatively current through regular updates. UA automatically proceeds to data distribution after a retrieval session. *If your web browser is configured to automatically connect to the Internet whenever a URL address is requested, you may be able to skip the step of manually getting online. To see if this works for you, click the Download New Quotes icon without first connecting to the Internet. After a few seconds of attempting to find the CSI URL, your usual Internet connection screen will display. Depending upon your communications software, you may have to click "Connect" or "OK" to initiate the dialup connection, or this may happen automatically. Either way, once the connection is established, the "Internet Download" screen will display, but it may be hidden behind your home page. Feel free to minimize the home page screen to view the full Unfair Advantage process. 2.2.6. Data Distribution Data distribution is the process of appending all the current data received in your download transmission to the compressed database stored on your computer's hard drive. It is a necessary step in maintaining a sound database. The software comes to you configured to automatically proceed with this step without further prompting if either Internet or Direct Dial Access is used. User's Reference Manual Page 17 Unfair Advantage If you configured UA for "Browser" access, you'll need to initiate data distribution manually through the Initiate menu. (Click the Initiate menu, then click "Manual Database Distribute.") By default, the distribution screen chronicles UA's progress as in the example below. You'll note it shows the date for each day processed (in a 4-digit year, month and day format) and identifies the actions taken for that day. The screen will show each trading day updated, from the date of your last update through to the most recent day available. "Applying daily price updates" displays while UA is appending existing files. If you are downloading stock data, a daily summary of advancing and declining issues can also display. It is important that you DO NOT INTERRUPT or CANCEL distribution! Doing so will result in a redundant update of the same data on your next download, and possible double-access surcharges. A Distribution Screen: If you do not wish to view this screen on future updates, you can turn it off through the Daily Distribution tab of Data Options, from the Options menu. The option of whether or not advancing and declining stock information displays is on the same screen. 2.2.7. News Headlines By default, UA quickly takes you to the News Headlines page of CSI's website after data distribution. If you are interested in the stories mentioned there, simply click on the links to view. Page 18 User's Reference Manual Unfair Advantage If you would prefer to skip this step in future updates, turn the option off through the Daily Distribution tab of Data Options, from the Options menu. This feature involves accessing the CSI website for the latest headlines, so if it is selected in Daily Distribution Options, the software will attempt to contact the website during the distribution process. This may involve an automatic Internet connection when manual Database Distribution is selected from the Initiate menu (without requesting an update). 2.2.8. Error Corrections and Revisions By default, Unfair Advantage displays all corrections and revisions made to the database after daily data distribution. They are stored in a Notepad file called UA\ARCHIVES\update.adm. This file can include revisions to factsheet specifications as well as prices, volume, open interest, etc. It must be closed when you are finished viewing it. Stock split ratios, changes to the Events Calendar and changes to the fact sheets that are transmitted will eventually be held in various files (all ending in .adm), which are located in the UA\Archives directory. If you do not wish to view corrections and revisions after distribution, simply turn this feature off through the Daily Distribution screen in Data Options, from the Options menu. 2.2.9. After Your First Update Once you have unlocked the Unfair Advantage database by collecting and distributing your first update, you will have access to the full history provided with UA, as well as the current updates you just received. For your first update, you probably started with one of the standard portfolios provided by software vendors or with our own Sample Portfolio. The portfolio listing displays at the left side of the Unfair Advantage screen: User's Reference Manual Page 19 Unfair Advantage Double-click any of the contracts or stocks listed there to view your first chart. 2.2.10. Viewing Sample Data 2.2.10.1. First Chart The first contract in the UA Sample Portfolio involves the commodity Corn. We can tell by the symbol 'C'. (The remainder of the filename in the "symbol" column describes the file, as explained in Data Resources.) Double-clicking a contract's entry on the portfolio list brings up its chart: Page 20 User's Reference Manual Unfair Advantage This is quite a chart! Notice it begins in 1950 and continues on through 1999. This is clearly not a single futures contract, but what sort of series is it? We can tell by viewing the chart Properties. 2.2.10.2. Chart Properties You can view the properties of a file in your portfolio before or after a chart is displayed by simply rightclicking it on your portfolio list and then clicking Properties as shown: User's Reference Manual Page 21 Unfair Advantage The screen that was used to create the portfolio item in the first place displays. It gives all details about the series, including the type of contract (computed or normal month), the type of adjustment method used for continuous series, whether or not detrending was used, the date range, chart periodicity, applicable file formats and more. Page 22 User's Reference Manual Unfair Advantage The above screen tells us that this is a back-adjusted contract, rolling from one contract to the next based upon changes in open interest. All of these options are explained fully in the Portfolio chapter. Click [Cancel] to return to your chart or use this opportunity to make any desired changes. 2.2.10.3. Chart Manipulations UA offers a full complement of charting capabilities, as described in the Charting Chapter. These basic functions will get you acquainted with UA's charts: Use the toolbar above the chart to: Expand Date Range in Chart - This feature increases the spacing of the price bars, allowing you to see more details on your chart. Each time you click the button, the chart itself expands, but the time period visible on the screen gets smaller. Check the calendar at the bottom of the chart to see the date range currently displayed and use the scroll bar see the rest of the chart. Contract Date Range in Chart - This reverses the above process, contracting the data into a smaller, more compact form. Very contracted charts may have considerable overlap, which tends to obscure pricing details and studies. Crosshair - Click this button to add a crosshair pointer to your screen. Use your mouse to position the pointer on any date displayed on the chart. A data window showing complete numerical market data for the corresponding day also displays. Click the button again to remove the crosshair and data window. Change Indicators - Click this button to add studies to your chart. Those offered here include: Seasonal Index, Moving Average, Relative Strength Index, Stochastic and Basis. Use up to two studies, which may be added or deleted through this feature. Choose None for no studies. Chart Tools - Click this button to add a Trendline, Annotation, Rectangle or Ellipse. Print - Click this button to print your chart or table. See Printer Options to define the printer selection, paper feed and orientation. Chart/Table - From the tabs at the bottom of the screen, select your choice of chart or numerical table to display data. The table gives access to UA's data editor for manually entering price changes or additions. Contract Selector - Click the right button (below chart) to display the next chart on your portfolio list. Use these buttons to scroll through the portfolio. You can add charts to your screen by double-clicking them in the portfolio list. Click on the "Window" menu at the top of the Unfair Advantage screen for a list of options for your charting window. It allows you to select User's Reference Manual Page 23 Unfair Advantage the chart to view or rearrange charts or to display them as tiled or cascaded. Additional charting is available through Unfair Advantage's MultiMarket Analyzer module and Trading System Performance Evaluator (TSPE), which can be launched through the "Initiate" menu. Third-party software analysis is also possible with data retrieved and maintained through Unfair Advantage. 2.2.10.4. Viewing with Third Party Software The UA Sample Portfolio includes several commodity contracts to be prepared in the CSIM format (an alternate format for use with MetaStock). If you use MetaStock or another program that reads this format, you may view the files without changing format specifications. If your third party software needs CSI, MS/CSIM format or ASCII format files, click any one of the contracts in your portfolio, then right-click your mouse button. Click "Change Format" from the menu, then click your desired format as shown: Repeat the format selection for each file you wish to view for this sample demonstration. When all desired contracts have had their formats adjusted, click on any item in your portfolio and then rightclick your mouse. This time, click "Select All" as shown: Everything in the sample portfolio will be selected. Right-click your mouse again, then click "Rewrite File Immediately" from the menu. (This is equivalent to the "Build" feature on previous versions.) UA will write all files to disk as specified in your portfolio. See File and Chart Naming Conventions for details on interpreting the resulting files. Page 24 User's Reference Manual Unfair Advantage The files will be placed in the folders specified in your portfolio. To see where your files will be located, rightclick any contract or stock in your portfolio listing and then click "Properties." The File Export Options area (at right side of screen) identifies the folder, format, etc., as shown: Once you have learned where to find your new files, you'll be ready to leave UA and begin analysis with your third-party program. An alternate method of writing any file in your portfolio to an export format file is to click the "Send to third-party software" icon on the UA toolbar. This also brings up the "Properties" screen, where you can adjust the export options (above), and write the export format files. You may exit UA by clicking the Initiate menu and then clicking "Exit," or simply click the close box in the upper right hand corner of your screen. Launch your analysis software normally and begin analysis with market data proven through an independent study conducted by Futures Magazine to be the cleanest in the world. You might also consider UA's additional analysis features included in the MultiMarket Analyzer and Trading System Performance Evaluator. User's Reference Manual Page 25 Unfair Advantage 3. Downloading Data 3.1. Downloading Overview UA performs two types of data download. It can either retrieve a daily update of current prices or download a "History Refresh." The Downloading Data chapter of this manual describes both and includes the following sub-chapters: • Communication Options, which explains Internet, Browser and Direct Dial access for daily updates, as well as the AutoScheduler, Dates for Inclusion, User ID and User Number. Most of these features apply to both daily updates and occasional historical data downloads. • History Refresh, which is used on rare occasions to repair damaged historical data files. • Data Options Affecting Downloads, which can impact account options, daily distibutions, control files and launching third party software. • The Downloading Data chapter also explains Data Distribution, Database Usage, Updating Export Format Files (MetaStock, ASCII & CSI), Account Status and the UA Snapshot. Daily Updates Retrieving daily updates should be considered routine maintenance for your market analysis system. Retrieving updates is important because: • • • • • Your first update unlocks the database for analysis Subsequent updates keep your database current for timely analysis Regular updates are required to prevent future lockouts and loss of license Updates may contain corrections, revisions and continuity adjustments to your historical data Distribution of daily updates activates rebuilding and recalculations of continuous files as needed. Your communications options, including User ID and User Number, method of access (Internet, Direct Dial or Browser) and various software preferences are controlled by settings on the Options menu. Once your method of access is selected and Communications Options are customized, updating the database is as simple as 1,2,3.: 1) Get online (this step may be skipped for direct-dial access or if your ISP software automatically connects); 2) Request an update by either: • clicking the first (telephone) icon on the UA toolbar • or clicking the Initiate menu and selecting Update Database 3) Monitor the daily update and data distribution process (if using "Browser," start the Distribution through the Initiate menu). After the update, you'll probably want to proceed with analysis, either through UA's charting features, UA's MultiMarket Analyzer or a third party analysis system. Following analysis, we suggest you use TSPE to obtain certification of any proposed trading methodology. Page 26 User's Reference Manual Unfair Advantage The time required for your daily update will depend primarily upon your modem speed, the scope of your update (whether or not stocks are included) and the number of days retrieved in a single transmission. To minimize the time required for any single download, we recommend you retrieve an update each day. This will allow you to avoid the lengthy downloads required when the database is updated sporadically. UA offers many Data Options that affect data collection, distribution and storage. Please check the Data Options Affecting Downloads topic for more information. History Refresh The database files on your hard drive hold raw data for all commodities (and stocks, if installed) within UA. If one or more of these files becomes corrupted (through hardware failures or improper updating) the affected file(s) should be replaced through the History Refresh feature. Please note that this is a time-consuming process. We do not recommend replacing more than a few files at a time with this feature. See Navigating Through UA for additional program features. See Troubleshooting "Downloading Issues" for tips. 3.2. Communications Options 3.2.1. Communications Overview Your method of access for daily updates is determined through UA's Communications Options screen (shown below). They can be customized, reviewed and edited through the Options menu. User's Reference Manual Page 27 Unfair Advantage The content at the left of this screen (the Internet, Direct Dial and Browser tabs) will vary, depending upon the method of access you select. Each of the tabs on the Download Data Communications Settings screen controls the settings for particular method of access. The tab left showing when you click [Save changes] will become your default method of access. The Communications Options screens contain several features that are common to all methods of access. They are: • • • • • 3.2.2. AutoScheduler User ID & User Number Earliest Date for Inclusion in Update Save Changes (to use on future updates) Download Now (to begin a retrieval session with the current settings) AutoScheduler UA allows scheduled, automatic data retrieval sessions through the AutoSchedule timer on the update screens. The default entry, "disabled," results in no automatic retrieval sessions occurring. To arrange for automatic data retrieval, click the Communications Options from the Options menu. The AutoScheduler (at the right side of the screen) is the same for all methods of access: The AutoSchedule timer lets you schedule up to two retrieval sessions each day. Enter the time of data retrieval in place of "Disabled" for your first desired daily update. Use standard time notation (in the above example, five minutes past eight in the evening is shown as 8:05 PM). If a second automatic retrieval* is desired, click on the lower box (showing "disabled" in this example) and enter the time of that access. Consult CSI's Data Posting Schedule to discern the best time for your daily access. Click the checkbox next to "Wait for weekday" to have UA avoid calling on weekends. This entry is particularly important for users calling via direct dial who must pay for each telephone call. Failure to check the "Wait for weekday" box could cause UA to attempt access many, many times over the course of the weekend. Click [Save Changes] to record your selection. To activate the scheduled retrieval session(s), every day at some point before the selected retrieval time, start the UA program and leave your computer powered up. For best results, either leave your computer or use another program (with UA running in the background) at the scheduled access time. The autoschedule feature may not work properly if UA is in use for analysis or other functions at the selected retrieval time. Each retrieval session will occur at the selected time, provided the method of access is available. This means that a direct-dial line must be available for direct dial access, or a connection to the internet must be established before an Internet download can take place. Page 28 User's Reference Manual Unfair Advantage If UA is not running at the scheduled retrieval time and the update is missed, a data retrieval session will be attempted automatically the next time you start the program. However, if you have already manually updated for the current day by the time the autoschedule time arrives, UA will not attempt a second access. *A basic subscription to the CSI data retrieval service allows for one access daily. Additional charges apply for multiple daily accesses. Visit the CSI website for details. 3.2.3. Dates for Inclusion in Update Unfair Advantage can retrieve up to two months of daily pricing for the entire database in a single daily update transmission. A typical transmission includes: • a repeat of the last day updated* • all days that transpired between the last update and the current date UA automatically maintains a record of the dates that should be retrieved and shows the earliest date to be requested in the lower right corner of the Download Data Communications Settings screen. On rare occasions, you may need to change this date to manually override the automatic date selection. Typically, this is only necessary to recover from an incomplete or corrupted transmission, or to fill a gap caused by hardware failures. Re-collecting data that has been successfully received previously can result in multiple-access surcharges on your CSI account. To change the first date to be updated, pull down the Options menu and click Communications Options. The date box is located below your User ID and User number at the lower right. The date is shown as the four-digit year, followed by two-digit month, followed by the two-digit day. The example above shows the year 1999, the Month 12 (Dec.) and the day 07. You must use this same YYYYMMDD format for entering your desired first date for updating. Example: January 20, 2000 would be entered as 20000120. *The redundant update of the first day is a safety net to assure integrity of volume and open interest and fill in any market that may not have been available at the time of your last update. When selecting a date, we recommend you use the same convention and request the date before the last day updated in your database. If your database is outdated by more than two months, your database is probably locked and the software is likely non-functional. Please contact CSI to order a replacement CD. User's Reference Manual Page 29 Unfair Advantage 3.2.4. User ID & Number Your User ID is a three-letter code and your User Number is a five-digit number, both of which were included prominently in your CD ROM case. You were prompted to enter these codes when you installed UA, and your entries display in the lower right corner of the Download Data Communications Settings screen each time you update your database. This combination of codes (UID and 12345 in the example) represents the security measures preventing others from charging data collection against your CSI account. These codes should be protected to avoid unauthorized accesses, for which you are financially responsible. In cases of security violations or other concerns that may require CSI to issue new account codes, you may edit these entries either through the Communications Options screen (above) or by clicking the "Account" tab on the Data Options screen. Both are available through the Options menu. To edit, enter the User ID supplied by CSI in the top box, then press <Tab> or click your mouse in the lower box and enter the number there. You must click [Save Changes] to make your changes permanent. 3.2.5. Internet Access 3.2.5.1. Internet Access Overview Internet Access is the preferred method of data retrieval with UA. It is fast, economical means of data delivery that is accessible to users all over the world. CSI's efficient method of data delivery avoids time-wasting net surfing and tedious data requests. The UA software automatically transmits detailed information on the time period and data categories needed, allowing the CSI host computer to quickly transmit the information to your computer. Page 30 User's Reference Manual Unfair Advantage The user, not CSI, is responsible for all connection charges associated with data retrieval from CSI. If you do not yet have access to the Internet, please contact the Internet Service Provider (ISP) of your choice and arrange for service as soon as possible. When an internet service is available to you, you should customize the settings for access. 3.2.5.2. Customizing Internet Access UA is shipped configured for Internet access using your own Internet Service Provider (ISP). If you'll be accessing via the Internet, chances are good that you will not need to make any changes here. Each of the Server boxes and Port Numbers on this screen is optimized for accessing CSI's host computer. Please do not change them unless you are asked to do so by CSI. If you are instructed to make a change by the CSI staff, click the Internet tab on the Communications Options screen (through the Options menu) to view the screen below. Enter changes as directed. Server Name: ua.csidata.com Both the Server name and Secondary Server name are set by CSI and should NOT be changed. Port 80: On a Web server or HTTPD (Hypertext Transport Protocol daemon), port 80 is the port that the server "listens to" or expects to receive from a Web client, assuming that the default was taken when the server was configured or set up. A port can be specified in the range from 0-65536 on the NCSA server. However, the server administrator configures the server so that only one port number can be recognized. By default, the port number for a Web server is 80. Experimental services may sometimes be run at port 8080. Proxy Server: (Optional) A server that sits between a client application, such as a Web browser, and a real server. It intercepts all requests to the real server to see if it can fulfill the requests itself. If not, it forwards the request to the real server. The use of a proxy server can interfere with UA downloads, so it is not User's Reference Manual Page 31 Unfair Advantage recommended. Proxy servers have two main purposes: • Improve Performance: Proxy servers can dramatically improve performance for groups of users. This is because it saves the results of all requests for a certain amount of time. Consider the case where both user X and user Y access the World Wide Web through a proxy server. First user X requests a certain Web page, which we'll call Page 1. Sometime later, user Y requests the same page. Instead of forwarding the request to the Web server where Page 1 resides, which can be a time-consuming operation, the proxy server simply returns the Page 1 that it already fetched for user X. Since the proxy server is often on the same network as the user, this is a much faster operation. Real proxy servers support hundreds or thousands of users. The major online services such as Compuserve and America Online, for example, employ an array of proxy servers. • Filter Requests: Proxy servers can also be used to filter requests. For example, a company might use a proxy server to prevent its employees from accessing a specific set of Web sites. Reset: This resets your connection to the server and can salvage an otherwise unsuccessful download attempt. This screen also lets you customize your retrieval session through the AutoSchedule Timer, User ID and Number and Dates for Inclusion in Update. Whichever method of access left on the screen is the one used for data retrieval. Click [Save Changes] before leaving this screen. Once these settings have been customized, you may begin your retrieval sessions directly from the UA toolbar or the Initiate menu. To begin an Internet retrieval session, get online through your ISP, then click [Download Now] at the bottom this screen. If you experience a problem with the download, but are still online, click the [Reset] button to reset your connection to the server. 3.2.5.3. Getting Online For best results with data retrieval, we recommend you get online with your ISP before directing UA to download quotes.* Here's how: Without exiting Unfair Advantage, go to your Windows Start Menu and launch your browser for Internet access as you normally would. Once online, use the task bar to return to Unfair Advantage by clicking the New UA button: This brings you back to the Unfair Advantage screen, where you can proceed with regular Internet access. *If your web browser is configured to automatically connect to the Internet whenever a URL address is requested, you may be able to skip the step of getting online manually. To see if this works for you, click the Download New Quotes icon without first connecting to the Internet. After a few seconds of attempting to find the CSI URL, your usual Internet connection screen will display. Page 32 User's Reference Manual Unfair Advantage Depending upon your communications software, you may have to click "Connect" or "OK" to initiate the dialup connection, or this may happen automatically. Either way, once the connection is established, the "Internet Download" screen will display, but it may be hidden behind your home page. Feel free to minimize the home page screen to view the full Unfair Advantage process if desired. 3.2.5.4. Regular Internet Access Once your software has been configured for Internet access and your computer is online, you can begin a daily update in either of two ways: • On the toolbar (Download New Quotes) • Through the Initiate menu (Update Database) • From the "Internet" tab of Communications Options (Download Now) If all goes well, the Download Data Communication Settings screen will display with an "Internet Download" confirmation box superimposed as shown below: Assuming you entered your User ID and Customer Number correctly and you have not waited beyond the two-month time window for updates since the database was last updated (see the date at lower right), then Unfair Advantage will have all the necessary information to bring your full database current. UA automatically proceeds to data distribution after a retrieval session. If your Internet retrieval session fails, consider using a direct-dial backup. User's Reference Manual Page 33 Unfair Advantage 3.2.6. Direct Dial Access 3.2.6.1. Direct Dial Overview If you are unable or unwilling to use Internet access (the default option), you may retrieve data in a modemassisted, direct-dial phone call. This method is less favored for updates, as it usually involves a long-distance telephone bill. The user, not CSI, is responsible for any telephone charges associated with data retrieval from CSI. You should customize the direct dial options to begin. 3.2.6.2. Customizing Direct Dial Options To customize your software for Direct Dial access, click the "Direct Dial" tab from the Communications Options screen (through the Options menu) as shown: Review the Direct Dial dialog box entries to make sure they agree with your hardware configuration and dialing preferences: Phone number - The phone number shown (probably 1-561-368-5306) is the CSI computer's current telephone number. You may need to make any of the following changes or others as your situation requires. (This entry can hold up to 64 characters): Phone number tips: • Prefix a 9 to dial out on a PBX phone system; • Remove the 1 - 561 if it is a local call; • Add international dialing codes; Page 34 User's Reference Manual Unfair Advantage • • • • Insert a W to pause when needed (required by some older PBX systems); Add calling card numbers to charge the call to a different phone; Disable call waiting with *70 (or your local code) and a few Ws (to pause); Click the arrow at the right of the phone number to display alternate phone numbers in the rotary system. Select any one of these if the default number doesn't work for you. Communications Port - This refers to your modem's configuration within Windows. You can find out your Com Port by clicking your Start menu, going to Settings, then Control Panel. Double-click the Modems icon, and then click Properties for your modem. The Com Port will display. Baud rate - This is the speed of data retrieval. Click on the arrow to the right of the text box and select the fastest baud rate your modem supports. Click [Reset] if needed to restore the default settings. This screen also lets you customize your retrieval session through the AutoSchedule Timer, User ID and Number and Dates for Inclusion in Update. Whichever method of access left on the screen is the one used for data retrieval. Click [Save Changes] before leaving this screen. Once these settings have been customized, you may begin your retrieval sessions directly from the UA toolbar or the Initiate menu. To begin a Direct Dial retrieval session, make sure your phone line is available and click [Download Now] at the bottom of the screen. See the Regular Direct Dial Access topic for information on calling for data on a daily basis. 3.2.6.3. Regular Direct Dial Access Once your software has been configured for Direct Dial access, you can begin a daily update in either of two ways: • On the toolbar (Download New Quotes) • Through the Initiate menu (Update Database) • From the "Direct Dial" tab of Communications Options (Download Now) The communications dialog begins: User's Reference Manual Page 35 Unfair Advantage The download proceeds with a screen describing the process (exact appearance may vary, depending upon your computer's configuration). UA automatically proceeds to data distribution after a retrieval session. 3.2.6.4. Backup Access Through Direct Dial Direct Dial makes a good backup for when your own Internet server is down. Simply click the Direct Dial tab on Communication Options (from the Options menu), make sure your settings are correct, and click [Download Now]. Direct Dial access is the only one of the three retrieval methods that can access CSI's backup computer system if you call when the main system is experiencing down time or routine maintenance. If you are unable to retrieve an update through the Internet, even when your Internet connection seems to be working, direct dial might be a viable alternative. The user, not CSI, is responsible for any long distance telephone charges associated with data retrieval from CSI. 3.2.7. Browser 3.2.7.1. Browser Overview The Browser Communications option is for those who already have accounts with older proxy Internet services and who do not wish to change to a direct Internet service provider. Users of direct Internet services may use the Browser option if desired. It is the same as Direct Internet Access, except that it includes the log on procedure, and is less automated. This method of access requires more user input for retrieving and storing data than the other methods. Once your Browser Options have been customized, the following must be done with each update: 1) Get online 2) Download quotes 3) Save file 4) Monitor data transfer 5) Distribute Daily Update Page 36 User's Reference Manual Unfair Advantage A Note To Proxy Server Users: Please note that proxy servers are not recommended for updating more than one daily update at a time. We have found that, when used with Unfair Advantage for downloading lengthy files, proxy servers tend to degrade the data transfer speed and to terminate the link before the transfer is complete. 3.2.7.2. Getting Online with a Browser For best results with data retrieval, we recommend you get online with your Internet server before each update session.* Here's how: Without exiting Unfair Advantage, go to your Windows Start Menu and launch your browser for Internet access as you normally would. Once online, use the task bar to return to Unfair Advantage by clicking the New UA button: This brings you back to the Unfair Advantage screen, where you can proceed with Browser access. *If your web browser is configured to automatically connect to the Internet whenever a URL address is requested, you may be able to skip the step of getting online manually. To see if this works for you, click the Download New Quotes icon without first connecting to the Internet. After a few seconds of attempting to find the CSI URL, your usual Internet connection screen will display. Depending upon your communications software, you may have to click "Connect" or "OK" to initiate the dialup connection, or this may happen automatically. Either way, once the connection is established, the "Internet Download" screen will display, but it may be hidden behind your home page. Feel free to minimize the home page screen to view the full Unfair Advantage process if desired. 3.2.7.3. Customizing Browser Options Customizing your Browser for updates requires that you test the connection to the Internet, so get online before attempting to Customize Browser Options. To customize Browser Options, click the "Browser" tab from the Communications Options screen (through the Options menu) as shown: User's Reference Manual Page 37 Unfair Advantage The Browser download screen needs input from you on what UA should do when you click [Download Now]. The prompt reads: When I push the download button please... You have two choices: • Ask browser to fetch URL ("http://www.csidata.com/…") • Just paste URL ("http://www.csidata.com/…") to the clipboard The default response is Ask browser to fetch URL ("http://www.csidata.com/…"). We recommend you use this option (if possible) because it is the more automatic of the two choices. If you have already established your Internet connection (you are online) or if your computer will automatically connect to the Internet when a URL address is requested, test this method by clicking [Download Now]. If all goes well, the update will proceed as described in the Regular Browser Updates chapter. If the "Ask browser to fetch URL..." choice doesn't initiate a data retrieval session, you'll need to use the second option, "just paste the URL on your clipboard." For this option, first select it by clicking the 6 symbol and choosing "Just paste URL..." from the menu. Next click [Download Now]. This WILL NOT start a download. A few extra keystrokes will be required each day to begin your retrieval sessions. See the Regular Browser Updates chapter for instructions on how to proceed. Server Name: ua.csidata.com Both the Server name and Secondary Server name are set by CSI and should NOT be changed. Reset: This resets your connection to the server and can salvage an otherwise unsuccessful download Page 38 User's Reference Manual Unfair Advantage attempt. This screen also lets you customize your retrieval session through the AutoSchedule Timer, User ID and Number and Dates for Inclusion in Update. Whichever method of access left on the screen is the one used for data retrieval. Click [Save Changes] before leaving this screen. Once these settings have been customized, you may begin your retrieval sessions directly from the UA toolbar or the Initiate menu. 3.2.7.4. Regular Browser Updates Once your software has been configured for Browser access and your computer is online, you can begin a daily update in either of two ways: • On the toolbar (Download New Quotes) • Through the Initiate menu (Update Database) • From the "Browser" tab of Communications Options (Download Now) If the simplest browser option: Ask browser to fetch URL ("http://www.csidata.com/…") worked for you, then the retrieval session should proceed immediately and you'll be asked your preferences for saving the file. If your selected browser option was: Just paste URL ("http://www.csidata.com/…") to the clipboard, then you have more work to do. Use the getting online instructions, but do not return to the UA screen. Instead, at your Internet Home Page, place the cursor in the Address text box (or URL Address box) and click. This will select the text as shown in the example below, which was made using Microsoft's Internet Explorer: Next, hold down the <Ctrl> key on your computer's keyboard and press the letter V. This pastes the necessary information for your update into the URL Address box: Press <Enter> to proceed with data retrieval. Next you'll be asked about saving the file. 3.2.7.5. Saving the Update File When UA contacts the CSI host computer and requests the file for download, you must respond by selecting the proper dispensation of the file. The File Download prompt will display: User's Reference Manual Page 39 Unfair Advantage Do NOT open the file. Make sure "Save this file to disk" is selected and click OK. If you are not using Internet Explorer, your screen will be similar to this and offer similar options. The exact wording is not important; just make sure you Save the file! Upon indicating that you want to save the file, a Save As screen asking for the file name and location displays: You must save your file with the filename: uadaily.pl Don't be concerned with the file extension (the characters after the period in the filename) or file type, which may be changed automatically by your browser. These have no impact on UA. For example, although the download file is originally called uadaily.pl, it is OK to save it as uadaily.sui or whatever name appears in the Page 40 User's Reference Manual Unfair Advantage dialog box, as long as the first part says uadaily. The folder for saving the file is important! Your browser may attempt to save the file in the briefcase, desk top or other inappropriate location on your drive. If this occurs, click the arrow symbol at the right of the default directory to drop down a menu of other locations. Double-click the drive letter of your hard drive (probably C:) and look for the \UA folder. When you find the UA folder, double-click it to produce the proper screen for saving your file (above). Click "Save" to begin the download. You may be warned that you are overwriting an existing file. That's not normally a problem.* Just click OK. The data transfer begins. *Unfair Advantage overwrites the daily transmission file (uadaily.pl) each day to make efficient use of your computer's disk space. If you have a specific reason to save an update file (UA does not require this), you may do so by renaming it after data distribution. A unique filename is required for each file that is to be saved. 3.2.7.6. Data Transfer When accessing via the browser method, you get a report on how much data has been transmitted and exactly where it is going. When the download is complete (as indicated by a screen message), click [Close]. Do NOT open the file or folder. You can automate this step for future updates by clicking the box to "Close this dialog box when download completes." After the data transfer using Browser access, you must manually distribute the data to your compressed files. 3.2.7.7. Manual Data Distribution After a Browser update, or at other times when distribution does not complete normally, it is necessary to manually initiate the daily data distribution process. To begin, click the Initiate menu on the main UA screen and then click Manual Database Distribution. See "Data Distribution" for an explanation of th process. If you feel UA has had a complete data retrieval session, but an abnormal termination of distribution, you might be able to fix any resulting problems by manually redistributing the data. It is not necessary to download the same day's again to rewrite all your files. You can use this manual distribution option any time to rewrite all files to current specification and rebuild your stock scanning file. 3.3. History Refresh 3.3.1. History Refresh Overview UA's compressed database files on your hard drive can become corrupted through hardware failures or improper updating. If this happens to your database, you can replace the affected files through this feature. Before you begin, you'll want to confirm that the file or files have actually been corrupted. User's Reference Manual Page 41 Unfair Advantage Once you are sure the files are corrupted, and once you have ascertained that you only need a few files, you should begin the History Refresh download. If you need more than a few files, you should order a new UA CD-ROM from CSI. The new CD will include a complete, updated database, as well as any program upgrades. There is a nominal fee for a new CD-ROM, but there is no charge for receiving a refreshed history file online. 3.3.2. Confirming Corruption of a File Manual Confirmation of File Corruption To determine if a file is corrupted, simply attempt to chart it as a simple (non-computed) contract through UA. If the chart will not display, or if it is visibly distorted, the file is probably corrupted. The failure of computed contracts to chart is not necessarily the result of file corruption and should be reported to CSI. If you believe that a data file in your database has been corrupted, you may download the entire history for that commodity or stock (the cdb or sdb file, respectively) from CSI through the History Refresh feature. Automatic DB Integrity Search You can check your entire database for most types of corruption through UA's Database Integrity Search. To use, click the Initiate menu, then click "DB Integrity Search. The following displays: Select Commodities or Stocks, then click [Search]. If all goes well, UA will report that no corruptions were found in the last year of your database. If corruptions are found, you can print your list or download a refreshed history file by clicking the appropriate buttons. DO NOT DOWNLOAD A LARGE NUMBER OF COMMODITIES! If your database suffers from large-scale corruption, you should order a new CD from CSI. 3.3.3. The History Refresh Download This manual method of refreshing history files is used to selectively download a few specific markets that may be corrupted. See "Confirming Corruption of a File" for an alternate automatic technique. "History Refresh" is generally done through the Internet, so get online before proceeding (This step is not Page 42 User's Reference Manual Unfair Advantage necessary for Direct Dial access.) To download a historical file, click the Initiate menu, then click "Refresh History." You will be asked to wait while the symbol lists are built. When the symbol lists are complete, the following displays: Each commodity selected for refreshing is checked. The commodities in your current portfolio are checked automatically. It is unlikely that you would want to download a full history on a large portfolio list, so you'll probably want to click [Deselect All] and then click the check box for only those markets to be refreshed. Remember, it takes a long time to download the full history of a commodity, so this should only be used for a few markets. If you need more, order a new CD! Do not change the "From:" and "To:" entries unless directed to by CSI or you have a specific reason for doing so. These are the correct paths for data retrieval and storage. When you have selected all the commodities to be refreshed, click the down arrow symbol next to the "Market Type" box to drop down a brief menu. From there you can select stocks, if desired. Repeat the selection process for your stocks and click [Download]. When the download is complete, UA says, "Successfully Refreshed History." User's Reference Manual Page 43 Unfair Advantage 3.4. Data Options Affecting Downloads 3.4.1. Overview Click "Options" above the UA toolbar to pull down the Options menu. It offers two categories of options: Data options and Communications Options. The Data Options Screens offer several functions that affect daily updates, including: • • • • Account Options Daily Distribution Updating Control Files Launching 3rd Party Software Communications Options are discussed in the Communications Options chapter. 3.4.2. Account Options Click the Account tab on the Data Options screen to view the following: Entries include: User ID - A three-letter code assigned by CSI and provided in writing with your software. You were prompted to enter this code when you installed UA. The User ID can be changed here as directed by CSI. User Number - A five-digit number assigned by CSI and provided along with your User ID. Together, these two codes represent the security system preventing unauthorized use of your CSI account. This was also Page 44 User's Reference Manual Unfair Advantage entered into UA during installation, and can be changed here if needed (rarely). The Account Status at the bottom of the screen shows your settings on the CSI host computer and is based upon your subscription category. They are updated when you download quotes from CSI and cannot be manually edited. 3.4.3. Daily Distribution Data Distribution normally occurs automatically after each update session, except when Browser Access is used. If you prefer to reduce this level of automation, you may make changes here. This screen also controls whether or not reports about the data received will be displayed. Click the Daily Distribution tab on the Data Options screen to view the following: Prompt between download and distribution - This feature reduces automatic distribution by requiring that the user answer a prompt before data is distributed. One reason to select this option is to give you an opportunity to manually disconnect the online connection before distribution begins -- which might be useful if you pay for online time by the minute. Prompt between each day's distribution - This option was included in UA specifically to accommodate a software program that analyzes data "One day at a time." This feature eliminates the bulk processing of multiple days of data, and requires that the user answer a prompt before each day is distributed. Append to Data Files When Possible - (Recommended) UA's original architecture called for rebuilding all User's Reference Manual Page 45 Unfair Advantage files from the compressed database each time charts or data files were accessed. This assured that every file contained the most accurate, up-to-date information possible, but consumed a great deal of time with each access. More recent versions of the software will append most charts and files without rebuilding if this option is selected. While file appending is the typical methodology in the industry, UA offers several features which others can not provide, and for which appending is not possible. Therefore, some files will still be rebuilt on a daily basis, or on the five consecutive days following contract roll-forward, even if this box is checked. These include: Weekly and monthly files (as they cannot be accurately maintained through appending); Individual Futures Groups (when they roll so that the full history for the incoming contract is available); Backadjusted data series (when they roll or when the backward looking roll-date moves); Certain ASCII files (which lack the necessary data fields) and any file in a format other than CSI, MetaStock or ASCII. If this option is not selected, all files will be rebuilt with every data distribution, taking up to two minutes per file. This would waste a great deal of time unnecessarily. Exception: Appended files do not reflect the new data received in a History Refresh. After Refreshing a History File (downloading a replacement history), you should rewrite your files instead of appending them. Turn this option off for your first distribution after refreshing a history file. It can be turned back on after a complete distribution with file rebuilding. Display after update Display Daily news through web browser - When checked, this option forces UA to go to the "News Headlines" page of the CSI website during the data distribution process. The news page includes clickable links to view financial articles on the web. The articles included here represent a sampling of relatively current news, and is not intended to substitute for a comprehensive news service. Note that when this is option is checked, UA may attempt to connect to the CSI website during manual distribution when your computer is off-line. Display Update Report After Distribution - The Update report shows all error corrections and revisions delivered to the UA database during the distribution. The file (update.adm) is presented in Notepad format. The report displays after distribution when this option is selected. Display Advance/Decline after stock distribution - When stocks are downloaded, CSI transmits a data set including general market advance/decline and related information. Click the box to display this information. An example is provided in the online manual. Display a message when done - When this option is checked, the following displays after each distribution session. You can turn this feature off by un-checking the box here or in the message itself. Page 46 User's Reference Manual Unfair Advantage After Daily Distribution is Complete Execute the Command: This last entry on the Data Distribution screen lets you automatically launch another program after distributing daily updates through UA. This feature is useful for traders who use a third-party analysis program to analyze data retrieved through UA. To use, enter the command line of the appropriate program in the text box. A command line includes the drive designator for the desired program (probably c: or d:), the program's directory name and the name of the executable file (ending in .exe) that starts the program. Each section of the command line is separated by a backslash (\). For example, you would enter C:\QUICK\QT.EXE to launch CSI's QuickTrieve program. 3.4.4. Updating Control Files Control files include the Factsheets, which detail all data available from CSI, and the Alert Calendar, which reports exchange holidays around the world. These files are automatically maintained by CSI, with new additions and changes transmitted along with your daily updates. You can control the handling of these files here. Click the Updating Control Files tab on the Data Options screen to view the following: User's Reference Manual Page 47 Unfair Advantage Factsheet Changes - Your options for handling changes to the factsheet are: Automatic (to accept all changes without notice), Warn First (to give you the option of accepting changes) and Skip All (to disregard all changes). Whether or not you use the automated procedure for changing factsheets, it is important that they be maintained accurately. Your database integrity requires that factsheet changes be incorporated into the database. In most cases, we recommend Automatic handling of factsheet changes. This assures that contract specifications, such as new units of measure, contract size, etc. will be correctly interpreted by UA. Warn First might be useful if you have customized some features in the factsheet and want to preserve a copy before loading the new file. Skip All would be appropriate only for those users who manually maintain factsheet files by individually editing values. See Editing Control Files for information on manually changing values and for preserving a copy of the file. 3.4.5. Launching 3rd Party Software Users of third-party analysis software may want to exit UA Automatically after data distribution, and immediately begin using another program for analysis. Unfair Advantage offers this function through the "Data Distribution" Tab on of Data Options: Page 48 User's Reference Manual Unfair Advantage The bottom prompt, "After Daily Distribution is complete, Execute the command:____________________________________________ Enter the drive and path name for the analysis program of your choice. 3.5. Data Distribution Data distribution is a two-step process of 1) appending, correcting and adjusting the current data received in your download transmission to the compressed database stored on your computer's hard drive and 2) rewriting all export format files specified in your portfolio. It is a necessary step in maintaining a sound database. If Stock Scanning is selected in Data Options, the distribution will include a scan of all stocks and the creation of a file to be used in sorting or filtering your stock listing. The software comes to you configured to automatically proceed with this step without further prompting if either Internet or Direct Dial Access is used. If you reconfigure UA for Browser access, you'll need to initiate data distribution manually through the Initiate menu after each update. (Click the Initiate menu, then click "Manual Database Distribute.") By default, the distribution screen chronicles UA's progress as in the example below. You'll note it shows the date for each day processed (in a 4-digit year, month and day format) and identifies the actions taken for that day. The screen will show each trading day updated, from the date of your last update through to the most recent day available. If you are downloading stock data, a daily summary of advancing and declining issues can also display. It is important that you DO NOT INTERRUPT or CANCEL distribution! Doing so will result in a redundant update of the same data on your next download, and possible double-access surcharges. A Distribution Screen: User's Reference Manual Page 49 Unfair Advantage If you do not wish to view this screen on future updates, you can turn it off through the Daily Distribution tab of Data Options, from the Options menu. The option of whether or not advancing and declining stock information displays is on the same screen. 3.6. Database Usage Just below the UA portfolio/chart window is the "Database Usage" display (not shown), which reports on usage statistics for futures, stocks and options, inclusive of an inventory on drive letter usage. This information is passes to the CSI host computer to monitor license compliance and may influence billing reports. Hold your mouse over the display for a detailed summary of the content. Consult the UA license agreement for a summary of content. 3.7. Updating Export Format Files Export Format Files are the files created by Unfair Advantage for analysis with third-party software such as MetaStock, TradeStation, One Day at a Time, spread sheets, etc. During the data distribution process, Unfair Advantage automatically writes the export format files specified in your portfolio to disk. You may choose to manually write files as specified in your portfolio by selecting "Rewrite File Immediately" from the Portfolio menu. 3.8. Account Status Your CSI account status is verified on the software with each daily update. To check on your status, click "Options" to pull down the Options menu, then select Data Options. Click the Account tab to view your status (at bottom of screen). The features are: Locked - UA is shipped with a locked database. If checked, your database is inaccessible through UA. Collect an update to correct. If updating does not unlock the database and it has been more than two months since your last update, you'll need to order a new CD from CSI. Page 50 User's Reference Manual Unfair Advantage API Enabled - UA's Application Programmer's Interface provides a formatless format for easy manipulation of downloaded data outside of the UA environment. Click the Developer's Interface and Developer's Document from the UA program group on your Start menu for more details on this feature. If API enabled is not checked and you would like to use this feature, please contact CSI Marketing at 1800-274-4727. TU Account - If checked, this indicates you are using a limited-access test account. Domestic Futures - If checked, your daily updates include all futures, commodity and cash markets in North America, as listed on the CSI Fact Sheets. US Stocks - If checked, your daily updates will include all US stocks, funds and indices. Domestic Options - If checked, your daily updates include all available options for U.S. futures and stocks, as listed on the CSI Fact Sheets. VP Account - Vantage Point customer. Foreign Futures - If checked, your daily updates will include both domestic futures and all foreign futures/commodity and cash commodity markets listed in the Overseas Factsheets. Foreign Stocks - If checked, your daily updates will include those foreign stocks, indices and funds included in the CSI Database. Consult the Fact Sheets for a complete list. Foreign Options - If checked, your daily update will include all non-U.S. options in the CSI database. TR Account - Special Account. If you believe any status item is in error, or wish to make a change, please contact CSI marketing at 1-800274-4727 or 561-392-8663; E-mail: [email protected]. Before calling, be sure to collect a daily update to make sure you have the most current information. 3.9. Snapshot The snapshot is a great way to check out your positions in the market and to get a quick overview of market activity. This feature can also make an export file of your daily summary. To view a listing of your most recent update (current data), click the Snapshot button on the main toolbar or pull down the Initiate menu and click "snapshot." The following displays: User's Reference Manual Page 51 Unfair Advantage Sort by: Exchange, CSI Number, Symbol or Name - This determines the order of the data displayed in your snapshot. Scope: Portfolio Only or All Commodities - With this prompt, you tell UA if it should present pricing data for everything in your portfolio or, on a larger scale, present data on all contracts and/or options in the database. Depth: Show nearest 99 contracts (per commodity) - This feature lets you exclude very far-out contracts form your Snapshot listing. Include cash prices and options (if they are part of your on-site database) as desired. When options are included, you can limit the number of nearby series. Miscellaneous: Show all contract details initially: You have the option of showing all contracts or a given commodity or displaying a compressed list of just the first contract per commodity. When this option is not chosen, you get the compressed list, which you can expand by clicking on the one contract that is showing for a given commodity. Account for stock splits and dividends: When this option is chosen, UA uses the control file information received with the download to adjust the net change for splits and dividends. It slows the process considerably. Click [Build] to create your snapshot. The screen looks much like the following example: Page 52 User's Reference Manual Unfair Advantage Click on the first entry for any market to expand or collapse the list below it. The caret figure seen in many prices indicates the divider between whole and fractional values. For example, the Corn example at the top of the screen shows an open cash price of 186^4. Since grains are held in the database in eights, this value represents 186 4/8. Additional options on the snapshot screen are: Print: To make a hard-copy printout. (Note - this is only supported if the scope of your snapshot is "Portfolio.") Copy: To copy today's report to your computer's clipboard for pasting into another document. (This feature is only supported if the scope of your snapshot is "Portfolio." To engage the Copy command when "All Commodities" is selected, please contact CSI marketing for details on cost, etc.) Click Close to exit the snapshot. User's Reference Manual Page 53 Unfair Advantage 4. Your Portfolio 4.1. Portfolio Overview UA lets you enter all the contracts, stocks options, cash series, COT data sets, etc. you will be viewing regularly into a portfolio, which is simply a list of your favorite markets. Your portfolio can include your choices of normal, continuous and computed contracts, cash series and stocks. Your portfolio should include everything you'll want to see in chart form through UA or through third-party analysis software in various formats. By identifying the contracts or stocks of interest to you in a portfolio, you can save a considerable amount of time and effort in your daily analysis because your markets of interest will be appended each day. UA lets you control all important parameters used to configure the contracts or stocks in your portfolio and allows you to review or change these entries at any time. This feature is particularly useful when designing your own custom trading system with computed continuous series. Market analysis based on such contracts should never involve a data series built with unknown parameters. Unfair Advantage makes you an active and informed participant in your market study. Although the portfolio system lets you store your desired markets for easy access, it does not limit access to non-portfolio data. You can chart and/or write files on anything in the UA database*, whether or not it is listed in your portfolio. You probably selected one of Unfair Advantage's sample or pre-set portfolios when you installed the software, so you're probably starting with something in the portfolio window (at left, below). However, it is possible to have no portfolio at all. Page 54 User's Reference Manual Unfair Advantage The Stock Scanner Alternative A handy alternative for stock traders is UA's Stock Scanner, which automatically lists all stocks for charting or other analysis. This module allows you to sort and filter stocks according to your choice of price or volume fluctuation, or on study results. See the Stock Scanner chapter for details. Users of the Stock Scanner can bypass the standard portfolio feature, or use the Stock Scanner to select stocks for inclusion in your portfolio. Special note for MultiMarket Analyzer users: The MultiMarket Analyzer is a UA analysis module that analyzes many markets simultaneously in search of multiple over- or underpriced market opportunities or intermarket spread opportunities. It reads the compressed UA database directly and is not impacted by the markets introduced into your portfolio. *The markets available for viewing and the software available for analysis may be restricted based upon your subscription category with CSI. See your Account Status for details on what is available to you. For full use of The MultiMarket Analyzer, The Trading System Performance Evaluator and The Trader's Accountant, users are required to pay the full UA license fee. Portfolio manipulation begins with the Portfolio Menu, which can be accessed from the main menu at the top of your screen, or by right-clicking any item in your portfolio. See Navigating Through UA for additional program features. User's Reference Manual Page 55 Unfair Advantage 4.2. Portfolio Menu Your portfolio is controlled through the Portfolio menu (second from left, click to view). Use this menu to: • Insert (add new series to your new or existing portfolio) • Import Portfolio (use an existing portfolio from another UA or that you previously saved) • Edit (change the properties of a portfolio item) • Rewrite file immediately (write an export format file to disk now) • Rewrite file on next distribution (write an export format file to disk later) • Delete (remove an item from portfolio) • Remove Studies from series • Chart Series (display as UA chart) • Select All (select all portfolio items for next action) • Find in Portfolio (use to locate a series on your portfolio list • Print Portfolio (to make a hard copy listing of your portfolio) • Change Format (choose between chart, ASCII, MS, CSIM and QT) • Change Period (make file/chart Daily, Weekly or Monthly intervals) • Change Auto Updating (set your preference for automatic or manual updates) Page 56 User's Reference Manual Unfair Advantage A very similar menu will display if you click on any item in your portfolio and then right-click your mouse. Use whichever method is most convenient for you. Portfolio customization usually begins with either Inserting a Market or Importing a Portfolio. Please see the appropriate topic for instructions. See Navigating Through UA for additional program features. 4.3. Inserting a Portfolio Item 4.3.1. Overview of Inserting a Market Whether or not a portfolio exists within your UA, you can add contracts and stocks through the "Insert" option on the Portfolio menu. If your Unfair Advantage screen shows no portfolio list in the left-hand window, you can either create a portfolio by inserting your choices or by importing a UA portfolio from a previous version. Use these instructions to add contracts, cash series, stocks or miscellaneous financial data such as Commitment of Traders information into a new or existing portfolio. First click "Portfolio" on the main UA screen to view the Portfolio menu.From there, click "Insert" as shown below: You'll be prompted to select a data series, and then identify all the parameters that apply to your selected commodity or stock. The options are fully explained throughout this chapter, starting with "Selecting Markets." If you'll be using a third-party analysis program, be sure to pay extra attention to the File Export Options on the data selection screen. When one series is complete, repeat the process until the complete portfolio has been identified. Keep in mind that you may add and delete items in your portfolio through this menu selection at any time. User's Reference Manual Page 57 Unfair Advantage 4.3.2. Selecting Markets Whether you are creating a new portfolio, adding to a portfolio or selecting a contract for charting, the process of selecting a data series is the same. It starts with selecting a market or markets: Market Type: At the top of this screen, you first select whether you want to add (or chart) a commodity, stock (fund) or miscellaneous series. Click the down arrow to the right of the text box (showing commodities) to make your selection. The choices are: • Commodities - You'll need to select markets (corn, wheat, etc.), contract months to include, as well as date range and export options (at the right and lower portions of this screen). • Stocks - You'll just need to enter or select markets, plus the date range and export options (at the right and lower portions of this screen). • Miscellaneous - This is a variety of non-standard market data. Included here are cash series, Commitment of Traders, various government issues and broad indices, such as the Dow Jones Industrial Average. Markets: If you know the exchange symbol(s) for the market(s) you want to select, you may type them in the box. Use a comma and space between each entry. For example, you could request corn and wheat by typing: C, W in the box. For Intel, General Electric and Ford, the entry would be: INTC, GE, F Page 58 User's Reference Manual Unfair Advantage To select commodities from a list, click the (browse) button at the right of the "Markets" box to display the UA factsheet with a full selection of available markets. The example below is for commodities: Click the box under the "Se" heading (for select) each market you wish to add. The following features of this screen may help you in your selection: The Sort Order determines how the list will be constructed. The above example shows a sort by CSI Number. Other options include: Name, symbol, exchange, pricing unit and many others. Click the down arrow for a complete list (scroll to the bottom to see all choices). If you know the CSI number, symbol, name, or whatever is selected under "Sort Order," you can go directly to that market by typing the appropriate CSI number, name, symbol, etc. in the "Locate" box. If you aren't sure of these values, you can simply use the scroll arrows to locate the first market you wish to add to your portfolio or chart. Note: The box below the commodity or stock list (empty in above example) shows footnotes from the CSI factsheets. This is important information regarding anything from changes in contract specifications to nontrading days or other factors that may be relevant to your analysis. Footnotes are conveniently displayed at this time to avoid confusion or concern later. Please take a moment to read them. You may select more than one commodity at a time, but please do so carefully. Keep in mind that each commodity selected on this screen will be subject to your selections on subsequent screens with regard to quantity of contracts to display, computed contract selection, detrending, etc. Click OK to go back to the original selection screen, where you will select the Contract Months to Include, detrending preferences, date range and (for portfolio entries) file export options. You may also select your choice of Raw, Individual Futures Group, Nth Nearest Futures, Back Adjusted, Perpetual Contract Data, Gann Contracts and Cash. You'll finish identifying the contract specifications for one commodity or group of commodities before repeating the procedure for the next group of markets to be handled in a like manner. User's Reference Manual Page 59 Unfair Advantage 4.3.3. Contract Months to Include Upon selecting a commodity data series for inclusion in your portfolio or for charting, your first optional input is the Contract Months to Include: This option displays the delivery months that will be included for a given commodity to be used in whatever computed contracts (raw, back-adjusted, Perpetual Contract data, etc.) that you select. Note: This entry gives UA a list of months to choose from. It does NOT include those months in your portfolio automatically. Most users will not need to adjust this entry. The default selections (those marked with an X) are the delivery months UA's factsheets identify as "normal" trading months. These are the active contracts that are normally traded. They are the ones listed as "V" (for valid) in the Active Months field of the factsheets. Other options may be available. For example, the factsheets may list some months as "S" (for switching month). If you want to add other months besides the active ones, click the box over the month, or click [All] at the right. The option of [None] is also available for those markets on which only the cash price will be followed. However, it is not necessary to click [None] in that case. Other uses for the [None] option may develop later. When multiple commodities are selected together, all normal, active contracts will be selected automatically, and you will not have the option of identifying alternative months. This entry is not relevant for stocks. 4.3.4. Detrend Method Every contract or stock that is selected for charting or inclusion in a portfolio can be detrended. Why Detrend? Detrending is a manipulation that attempts to remove long-position biases and other distortions that can occur in long-term analysis. It is a useful procedure for all types of continuous files. Please note that due to the effects of inflation and deflation, back-adjusted and forward-adjusted files can produce negative values. The same adjusted price series may, in fact, go negative in both back- and forward-adjusted files, depending on the rate of ascent or descent. The tendency to go negative may be reduced or eliminated when data is detrended. However, detrending will not guarantee that adjusted data will be elevated out of negative territory. Detrending is only one way that a user might minimize the likelihood that the back-adjusted historical past will fall into negative territory. UA detrends linearly from the first day of a time series through the second to last day on file or through the last day of the second to last contract. The detrending approach always focuses upon the very first (most distant) day of the historical series and either the day before the last day or the last day of the second most current contract. Either of these two selected end points and the first point determine a precise interval on the y price axis. The number of trading days that transpired from the first (most distant) point and the chosen end point determines the number of Page 60 User's Reference Manual Unfair Advantage units (days) by which the entire series will be elevated or decreased, as the case might be, and leads to the slope calculation. Detrending may be appropriate to condition a data series for analytical use within UA or with third-party software. The transformation of all historical data into today's terms is a convenient analytical tool. Detrending options are: • Not Detrended - Select for no detrending. • Second Contract - Select to detrend the portion of the series that lies earlier than the final (most current) contract segment of the adjusted series. • Second Day - Select to detrend right up to the day before the current day of the final contract. When used for cash series, detrending always affects all data except the balance of the final calendar quarter. Click the Detrend Method box and make your choice to effectively present all history in current-dollar terms. 4.3.5. Date Range A "date range" option appears at the bottom of the screen for every portfolio entry and chart request made through UA. The default date range is from "as available" to "as available." These settings let UA create the longest, most detailed charts and files possible for your selected time series. For most applications, these dates should be left as they are. There are valid reasons for studying a specific, isolated time period, however, which is why we give you the option of identifying a date range. Enter the desired start and ending dates using a four-digit year, month and day format. For example, December 17, 1999 would be entered as: 19991217. January 15, 2000 would be entered as: 20000115. 4.3.6. Update Automatically At the lower right-hand corner of the data selection screen is an option to "Update Automatically," which corresponds to the "Change Auto Updating" feature on the Portfolio menu. In general, we recommend that you leave the "Update Automatically" feature enabled (set to "automatic") so that UA will automatically write and maintain all files as needed. We offer the option of disabling the automatic updates for those users who want to save time or have specialized applications. An example: One customer included in his portfolio many stocks assigned to a unique data directory (folder) that he did not want to view or update on a regular basis. His intent was to create a historical record of those stocks that ended on a given date. By disabling Auto Updates (unchecking the "Update Automatically" box") when adding these stocks to his portfolio, he was able to avoid the sometimes lengthy process of appending files and applying adjustments for splits and dividends to those stocks each day. Since these stocks are in his portfolio, he retains the option of manually writing charts and files with current information at any time by selecting them from the portfolio menu and selecting one of the "Write File" options. User's Reference Manual Page 61 Unfair Advantage It is important to understand that, even when Auto Updates are disabled, Unfair Advantage's compressed database continues to collect and store ongoing daily updates and necessary information to adjust stocks for splits and dividends. This information is simply not transferred to export format files and pre-constructed UA chart files. 4.3.7. Contract Selection 4.3.7.1. Raw Pricing 4.3.7.1.1. Adding Raw Price Series Raw Pricing refers to normal, unadjusted, non-continuous data series for specific commodity contracts that are included in your portfolio or selected for charting. Upon selecting the commodity and determining which contract months will be included, a list of all available contracts displays: Click each contract you wish to include in your portfolio. Selected contracts are marked with an "x." Be sure to select your detrend preferences, date range and export options (for portfolio) before clicking OK to finish your selection. Page 62 User's Reference Manual Unfair Advantage 4.3.7.2. Individual Futures Group 4.3.7.2.1. IFG Overview The Individual Futures Group (IFG) is a popular choice for portfolios as well as charting because it includes a revolving selection of the most active contracts. It is important to note that the act of removing a contact from your portfolio through the Individual Futures Group can also result in the removal of any corresponding export format files from your hard drive. If you want export format data files to be deleted from your hard drive as they are removed from the Individual Futures Group list, go to the General tab on Data Options and make sure the option, "Delete Expiring Contracts for Individual Futures Group" is checked. Naturally, if you don't want IFG export files automatically deleted, make sure the prompt is NOT checked! The user options for Individual Futures Group are shown here: You'll need to select the appropriate response for each of the following: • Contracts • Rolling Be sure to select your detrend preferences, date range and export options (for portfolio) before clicking OK to finish your selection. 4.3.7.2.2. IFG Contracts When creating an Individual Futures Group, click the down arrow symbol to the right of the text box, then select from one to ten contracts to be automatically included in your portfolio or displayed as a chart. A larger value may be typed into the box, as desired. As contracts grow near (or nearer) to their expiration month, they move into the window for inclusion in the Individual Futures Group, which is determined by this value. An Individual Futures group might include all contracts, the five nearest contracts, or perhaps just the nearest one or two. User's Reference Manual Page 63 Unfair Advantage Individual Futures Group is a no-maintenance alternative to selecting Raw Prices. Cash Click the box beside "Include Cash" to add an additional series, which would be the cash price series. 4.3.7.2.3. IFG Rolling When creating an Individual Futures Group, you must identify the parameters for adding and removing contracts from your portfolio. Day from start of month - Enter the date of the expiration month when the contract that is closest to delivery should be omitted from your list. For example, 1 means the contract should be dropped on the first day of the month. 15 means that the lead contract is dropped on the 15th of the month. Months Prior - This points to which month the "day from start of month" (above) refers. 0 indicates no months prior, so the date listed above is in the expiration month. Use 1 for the month before the expiration month, 2 for two months prior, etc. 4.3.7.3. Nth Nearest Future 4.3.7.3.1. Nearest Future Overview This is a single, continuous series built from whichever contract was or is in a specified sequence from delivery. The contracts from which the program selects are based upon user input with respect to the rollover date. The user options for Nth Nearest Future contracts are shown here: You'll need to select the appropriate response for each of the following: • Roll Trigger Page 64 User's Reference Manual Unfair Advantage • Roll Timing • How Many Out • Confirmation Signals Be sure to select your detrend preferences, date range and export options (for portfolio) before clicking OK to finish your selection. 4.3.7.3.2. Roll Trigger This input determines when UA switches from one month to the next in creating continuous series. You may choose between using volume and/or open interest or a specific date as explained below. Additional rolling criteria will be set by the "Roll Timing" option, below. • Open Interest - Click here to exclude the nearest contract when heaviest open interest shifts to the subsequent delivery month. • Volume - Click here to exclude the nearest contract when heaviest volume shifts to the subsequent delivery month. • Open Interest and Volume - Click here to exclude the nearest contract when BOTH heaviest open interest AND heaviest volume simultaneously shift to the subsequent delivery month. • Open Interest or Volume - Click here to exclude the nearest contract when EITHER heaviest open interest OR heaviest volume shifts to the subsequent delivery month. • Day - This option lets your computed contract roll from one contract to the next on a specific day of the month. Click here and type the day of the month you wish rollforward to occur. Enter the roll-forward date (1 to 31) within the rollover month. Use 31 to roll on the last trading day. This prompt coordinates with another prompt (at right). Start/End of Month - The default rolling criterion is for the day of the month (above) to be calibrated to the beginning of the month. An alternate rolling option is to select End of Month here, and enter the number of days prior to the end of the month to change contracts in the box at left. When "End of Month" is selected, enter the number of calendar days before the month is over that you want to roll out of a contract (1 to 28). Think of this as an inverted calendar. Enter 1 for the last day of the month, 2 for the next-to-last day, etc. This option is useful for traders who want to avoid risking delivery of a commodity by rolling out of a contract on the first notice day, which is often calibrated relative to the end of the month. • Months Prior - In the box to the left of this prompt, enter the number of months prior to the contract's expiration month when rolling should occur. Enter 0 for rolling within the expiration month, 1 for one month prior, etc. • Strictly by Expiration - Click here to keep the lead contract in your continuous series until expiration of the appropriate contract. • To calibrate an early roll date relative to the expiration date, enter the number of days before expiration for the rollover to occur. The "expiration date" used for an early rollover is based on the typical expiration date for the specific commodity, and may not be accurate at all times. User's Reference Manual Page 65 Unfair Advantage 4.3.7.3.3. Roll Timing This refers to when the near contract is dropped and replaced by the next in various continuous, computed contracts. Your choices are: • Anticipate - With this choice, the last close of the expiring contract is posted on the day before your specified rollforward date. The first opening price of the new lead contract appears in the series on the specified rollforward date. • Aligned with Price Data - With this choice, the last close of the expiring contract is posted on the day of the specified rollforward. The first open of the new contract is posted the day after the specified rollforward date. • When Known - With this choice, the final close of the expiring contract appears the day after the specified rollforward date and the first open of the new contract appears two days after the specified rollforward. 4.3.7.3.4. How Many Out When creating an Nth Nearest Futures Contract, this entry determines the value of N. For example, to create a first-nearest future contract (that is always showing the contract closest to delivery, within your rollover constraints) select 1. To always view the second-nearest contract, select 2, and so on. The default value is 2, but you may change it as desired, not exceeding nine contracts forward. The value you select must not represent more than the maximum number of contracts trading at any given time for the commodity being studied. 4.3.7.3.5. Confirmation Signals This feature is useful when rolling is based on changes in volume and/or open interest for Nth Nearest and Back-Adjusted files. It lets you avoid an early change based on arbitrary fluctuations. Your choices are: • Roll on First Trigger - switch contracts the first time the specified action occurs. This is the appropriate choice when using the standard back adjuster, which views the market backward in time to decide which contracts to report. • Roll on Second Consecutive Trigger - switch contract the second time IN A ROW the specified action occurs, • Roll on Third Consecutive Trigger - same as above, on third time. • Roll on Fourth Consecutive Trigger - same as above, on fourth time. 4.3.7.4. Back Adjusted 4.3.7.4.1. Back Adjusted Overview This is a continuous series built from contracts whose prices have been adjusted (either backward or forward) to eliminate the gaps between expiring and newly active contracts. The idea of adjusted contracts involves Page 66 User's Reference Manual Unfair Advantage concatenating historical contracts of a given commodity into the past, while applying adjustments to smooth transitions between delivery months. The user options for Back (and forward) Adjusted contracts are shown here: You'll need to select the appropriate response for each of the following: • Roll Trigger (Same as Nth Nearest Future, except that, when using back-adjusted continuous files with volume and/or open interest as roll triggers, the resulting series will depend upon whether the raw data series is viewed forward or backward in time. The "Standard" (Fortran) back adjuster views a given market backward in time when it builds a back-adjusted file. The "C++" back adjuster views a given market forward in time. In certain circumstances, the results of these two methods will be different. You can decide which back adjuster to use through the Back Adjusting tab of Data Options.) • Roll Timing (Same as Nth Nearest Future, except that the "Anticipate" choice is not available for adjusted series because current-day volume and open interest cannot be anticipated.) • Representative Pricing • Accumulation Method • Confirmation Signals (Same as Nth Nearest Future, except that rolling on any trigger other than the first requires use of the C++ program for building adjusted continuous series. See Data Options - Back Adjusting to switch the back adjustment program.) Be sure to select your detrend preferences, date range and export options (for portfolio) before clicking OK to complete the selection. 4.3.7.4.2. Representative Pricing Representative Pricing was called "splicing" in earlier versions of Unfair Advantage because it refers to how the old and new contracts are spliced together. In adjusted continuous series, UA uses the closing and/or opening price differential on the roll-forward day to adjust and therefore splice the prices into the past. User's Reference Manual Page 67 Unfair Advantage Looking backward in time, the new contract price minus the past contract price on roll-from day represents the delta price difference that is added to the past contract prices to form the O-H-L-C of all prices into the past. This applies to the past contract beginning with the roll-from date and extending backward in time. This way, considering the new and past contract pair, the new contract prices remain unaffected by the backadjustment splicing process. There is no rigid rule about capturing the old and new contract price differential on roll-to day versus roll-from day. Although UA offers several options in calculating the delta value, we believe the best approach lies with using the close-to-open differentials, which (without checking) are the same (roll-from and roll-to specification differences not withstanding). In this approach, you would span the roll-from and roll-to contracts on successive days, thereby preserving the natural price gap that occurs from one day to the next. UA offers further precision in permitting a preservation of the natural gap between the old and the new contracts as either the old-contract gap or the preferred new-contract gap. This option, unavailable anywhere else in the industry, forces the past data to blend together on roll-forward day without compromising the transition from one contract to the next. With this option, the effects of overnight influences on the market are not lost on the day the contract splicing takes place. Your options are: • Close old contract, close new contract - Here the close of the new lead contract is compared with the same-day close of the former lead contract and the price difference is applied to all historical data such that the new prices are seamlessly appended to earlier data without a gap. • Open old contract, open new contract - Same as close-to-close (above), except that the same-day open prices are used. • Close old contract, open new contract - This formula compares the open price of the new lead contract with the previous day's close price of the former lead contract and applies the difference to all historical data, such that new data can be added without a gap. A more refined close-to-open adjustment is available through the last two options. • Close - open with old gap reintroduced - With this option, past (from-contract) history is adjusted so that the old contract close equates to the old contract open, such that the close-to-open gap of successive days of the old contract are preserved. The result accurately reflects the old contract when bridging the two-day period from contract to contract. • Close - open with new gap reintroduced (preferred) - With this option, past (from-contract) history is adjusted so that the new contract close equates to the new contract open, such that the close-to-open gap of successive days of the new contract are preserved. The result accurately reflects the new contract when bridging the two-day period from contract to contract. This is the preferred choice because it represents the best future contract to emulate. 4.3.7.4.3. Accumulation Method The Accumulation Method was called "Adjustment Method" in previous versions of UA. When Back-Adjust is selected for the contract type while creating a portfolio entry or selecting a contract for charting, three options are available fro the accumulation method. They are: • Back adjust - Back-adjusting involves concatenating historical contracts of a given commodity and Page 68 User's Reference Manual Unfair Advantage making price adjustments to smooth the transitions. This adjustment requires applying the raw change in price of the earlier contract with respect to the price of the current (or later) contract. For example, say your series is rolling backward through the quarterly contracts of December, September, June and March of a given calendar year for your commodity. If the price of the December contract were 100 and the price of September were 95 on roll-backward day, this traditional back-adjuster would elevate all prices for the September contract by five. This would be maintained as a delta of five to be added to all past data, beginning with the September contract, on the day before rolling from the December contract. Back-adjusted contracts have a tendency to have their values dip below zero, which can present problems with a variety of analytical programs. If this should be a problem for you, consider using the "Proportional Adjustment (below), detrending, or the Raise Negative Series option. The first two of these will reduce the possibility of negative values in your back-adjusted files, and "Raise Negative Series" will absolutely remove the possibility of negative values in the resulting series. • Forward adjust - A forward-adjusted data series, like a back-adjusted series, involves concatenating historical contracts of a given commodity and making price adjustments to smooth the transitions. In a forward-adjusted contract, however, the prices of the current contract are changed to eliminate the gap between the current and recently expired contract. An important aspect to remember about forwardadjusted contracts is that current prices do not represent actual values for today's markets. • Proportional adjust - This is an enhancement of the original back and forward adjust options. With it, UA will, at your option, proportionately adjust the history of a commodity by percentage or ratio terms, in addition to splicing contracts by adding or subtracting their relative differences into the past. Proportionally adjusted series prepared through ratio multiplications are unlikely to go negative, so there is seldom a need to elevate a series out of negative territory. Contracts are joined by increasing or decreasing successively further distant contracts by a percentage to raise or lower the entire history by the same proportion. Rounding problems, caused by attempts to preserve tick differentials of reported prices, could occasionally push a given series into negative territory. Because the proportional adjustment yields a much milder descending slope of long-term prices into the past, there is much less long-side trading bias that can be captured from the data. An unbiased result that offers realism should be much preferred over a highly profitable and unbelievable result that holds more contributions from inflation than from any perceived trading style or expertise. The idea of proportionally adjusted contracts requires applying the percentage change in price of the earlier contract with respect to the price of the current (or later) contract. Consider the above example where a five-cent difference in price between successive December and September contracts resulted in a fivecent adjustment to all past data with the traditional back adjuster. In a proportionately adjusted series, the fixed delta of five would represent a factor of 5/100 or 105% of the September price for all data in the September contract. This process would repeat at the same percentage for every contract boundary until the series ended. The Proportional back-adjustment principles offered here were inspired by Thomas Stridman, who discussed the idea in his article "Data Pros and Cons" in the June, 1998 issue of Futures Magazine. UA offers two methods of calculating back- and forward-adjusted series. They are both explained in Bob Pelletier's essay on computed contracts. To select the Back Adjuster method used, go to the Back Adjuster tab under Data Options. User's Reference Manual Page 69 Unfair Advantage 4.3.7.4.4. Negative Values in Adjusted Files It should be noted that back- and forward-adjusted contracts can include negative numbers, which may not be acceptable data for a given analysis program. Negative prices cannot be accommodated in the CSI (QuickTrieve) format, but can be handled in the MetaStock (or CSIM) format. Regardless of the format, the analytical software used should be programmed to recognize negative numbers if adjusted data is selected. Negative values may be reduced or eliminated using Propertional Adjustment, detrending, or the Raise Negative Series option. 4.3.7.5. Perpetual Contract® Data 4.3.7.5.1. Perpetual Contract Data Overview Perpetual Contract® data is a proprietary CSI concept that many traders find very helpful as both an analytic and trading aid. It is intended as an indicator of market movement, not as an explicit price indicator. This time series can be calculated in two different ways: The original formula uses Time Weighting and represents a weighted average of the two contracts of the same commodity that lie adjacent to a given period-forward point in time, avoiding the volatile expiring market period and the quiet illiquid period of a contract's history. The alternative Perpetual Contract series uses Open Interest Weighting to blend all contracts, with emphasis on those with the greatest open interest. Either way, Perpetual Contract Data can continuously focus on the center of market volume and liquidity, and effectively take the market's pulse over an indefinite period. Unlike nearest future contracts, this computed contract has no abrupt jumps or drops in price. Use this concept to study a market's characteristics over time without concern for contract expiration or the following of complex contract roll-forward rules. The user options for Perpetual Contract Data are shown here: Page 70 User's Reference Manual Unfair Advantage You'll need to select the appropriate response for each of the following: • Date • Months Forward to View Market • Weighting Be sure to select your detrend preferences, date range and export options (for portfolio) before clicking OK to complete the selection. Perpetual Contract is a Registered Service Mark of Commodity Systems, Inc. 4.3.7.5.2. Perpetual Contract Rollforward Date These two entries for the Rollforward Date in Perpetual Contract data determine when the contract that is closest to expiration (of the pair) is dropped from the formula and is replaced with the next farther-out contract. The "Date" only applies when Trading Day Weighting is used. Day From Start of Month: This entry determines the specific date when your Perpetual Contract series will drop the lead contract and add a more distant contract for calculating the time-weighted moving average. In the box to the right of this prompt, enter the roll-forward date (1 to 31) within the rollover month. Use 31 to roll on the last trading day. The month in which this date falls is determined by the next prompt. Months Prior: In the box to the right of this prompt, enter the number of months prior to the contract's expiration month when rolling should occur. Enter 0 for rolling within the expiration month, 1 for one month prior, etc. Use 0 (along with 31, above) for the last trading day. Since Perpetual Contract Data is intended to avoid the volatile period at the end of a contract's life, it is common to use an early rollover date such as the first day of the expiration date (1 for Day and 0 for Months Prior) or, even better, to roll on the tenth day of the month prior to the delivery month (10 for Day and 1 for Months Prior). 4.3.7.5.3. Months Forward to View Market When creating Time Weighted Perpetual Contract data, a time-weighted average is produced, using the prices of the contracts that expire before and after the ever-changing date that lies a fixed number of months in the future. This prompt determines how many months ahead that ever-changing date will be. Your entry should be greater than or equal to the maximum gap (in months) between successive delivery months for this market. Three months ahead is the usual distance for measuring most commodities, financials and indices, because most have contract expirations at least as often as every two or three months. A two-month forward view of the market may be appropriate for commodities that expire every month or two such as the energy products, live cattle or hogs and perhaps some precious metals. If a commodity has a large gap between successive delivery months, such as Pork Bellies (Aug. to Feb.), the months ahead to view the market should be increased to reflect that gap. Using a value that is less than the maximum gap between successive contracts will result in some portions of the series representing nearestfuture data, as opposed to Perpetual Contract data. This entry will be disregarded if Open Interest Weighting is selected. User's Reference Manual Page 71 Unfair Advantage 4.3.7.5.4. Weighting In Perpetual Contract Data Time Weighting: The original formula for Perpetual Contract Data uses a time-weighted average of the prices of two contracts of the same commodity. When Time Weighting is selected, the standard procedure is used. The Rollforward "Date" and "Months Forward to View Market" selected on the Perpetual Contract Selection screen will apply. Open Interest Weighting: An alternate strategy for calculating a Perpetual Contract data series is to use an open-interest weighted average of all active trading months. To use the alternate formula which weights prices of all active contracts based on open interest, click the down arrow at the right of the text box, then click Open Interest Weighting. When this choice is taken, neither the roll date nor the months ahead to view market options will be taken into account. 4.3.7.6. Gann Contracts 4.3.7.6.1. Gann Data Overview This is a continuous series built from a single delivery month of a commodity over years of trading (a file of all May Wheat contracts over time, for example). The desired month and roll-forward criteria must be specified when adding this type of series to your portfolio. Please keep in mind that each individual contract will occupy a 12-month segment of the data, so each contract must trade at least 12 months. When Gann data series are produced as text files, they will be represented by individual delivery month codes identifying the specific delivery month included in the series. The contract specifications that apply to Gann contracts are shown here: You'll need to select the appropriate response for each of the following: • Date • Delivery Month to Concatenate Be sure to select your detrend preferences, date range and export options (for portfolio) before clicking OK to Page 72 User's Reference Manual Unfair Advantage complete the selection. 4.3.7.6.2. Gann Date Day From Month Start: This option lets your Gann contract series roll from one contract to the next on a specific day of the month. In the box to the right of this prompt, enter the roll-forward date (1 to 31) within the rollover month. Use 31 to roll on the last trading day. This date is within the rollforward month specified below. Months Prior: In the box to the right of this prompt, enter the number of months prior to the contract's expiration month when rolling should occur. Enter 0 for rolling within the expiration month, 1 for one month prior, etc. Use 0 for the last trading day. Gann contracts typically roll upon expiration, for which Day 31 and Months Prior 0 would be entered. You might prefer a more consistent date such as the first day of the expiration month (1 Day and Months Prior 0). 4.3.7.6.3. Delivery Month to Concatenate This selection identifies the one delivery month to be included in your Gann series. Click the down arrow symbol to the right of the text box and select the single delivery month to be used. It will cycle through the different delivery years. If contracts of the commodity you selected trade for less than 12 months each, your Gann file will contain periods where no data is supplied. UA will roll into the same contract month for each subsequent delivery year (March rolls into March; May rolls into May, etc.). 4.3.7.7. Cash Contracts 4.3.7.7.1. Adding Cash Contracts Cash contracts are available for many, but not all commodities. Often just one daily cash price is offered. Cash prices can be included as a separate choice by so requesting here, or you can automatically add cash (nearest future, if no cash is available) for all your commodities through the Cash/Saturdays screen in Data Options. Some cash series are available as reported, and others are available on the day after reported. Please check the factsheets, including footnotes, for details on availability and timeliness. A screen with no selections displays, as are no user options for cash series. Be sure to select your detrend preferences, date range and export options (for portfolio) before clicking OK to complete the selection. 4.3.8. File Export Options 4.3.8.1. File Export Overview When creating or editing a portfolio, the entries at the right side of the screen deal with File Export Options. File export options apply to the files UA writes to your disk for analysis with third party software. It is not User's Reference Manual Page 73 Unfair Advantage necessary to write files to disk for analysis through UA or other programs designed specifically to read UA's compressed files. Most analytical software, such as MetaStock and Omega's TradeStation and many others, require customization through the prompts shown below: You'll need to select the appropriate response for each of the following: • • • • Folder File Format (CSI, CSIM, MS Format or ASCII) Separator (Ascii only) Periodicity To assist with easy compatibility, we have compiled what we believe are the most appropriate settings for some of the popular CSI-compatible programs: Omega Research (TradeStation) MetaStock See the Third-Party Software Tips chapter for details. Be sure to complete the selections on the left portion of your screen dealing with contract selection before clicking OK. Account Status for details on what is available to you. For full use of The MultiMarket Analyzer, The Trading System Performance Evaluator and The Trader's Accountant, users are required to pay the full UA license fee. Portfolio manipulation begins with the Portfolio Menu, which can be accessed from the main menu at the top of your screen, or by right-clicking any item in your portfolio. Page 74 User's Reference Manual Unfair Advantage See Navigating Through UA for additional program features. 4.3.8.2. Folder Selection The folder listed under File Export Options is the directory on your hard drive where your exported data files will be stored. Your choice of directory should be based upon the needs and capabilities of the third-party software you'll be using for analysis. If you will be using UA with an existing software program, you'll probably want to use your current folder (the one where you normally store data). For a new program, check the documentation to see what directory name(s) may be required. If your analysis software does not specify a required directory structure, you can devise one of your own to accommodate simple data management. For example, you might simply keep all your markets together in the default directory (UA\FILES). You might keep different commodities in different folders for sorting purposes. The structure of UA accommodates the identification of multiple directories classified as perhaps grains, energy, financials, indices, currencies, foods, livestock, etc. or whatever grouping will meet your needs. For example: UA\FILES\GRAINS, UA\FILES\METALS, etc. To choose a folder, simply type its name into the Folder box. If you enter the name of a folder that doesn't exist, UA will create the folder for you. To select an existing folder on your drive, click the directory system to find the desired folder. (browse) button and browse through your computer's Sorting in Folders by Data Format It is not unlikely that you might keep data in multiple formats (to be selected next), which may or may not be appropriately stored in the same folder. For example, say you are using MetaStock, which uses MS or CSIM format data and recommends storing data in a directory called MS\DATA, but you are also storing data in ASCII files for analysis with your spread sheet. Can both file formats be stored together? Yes, they can be stored together. The ASCII files will have different filenames from the MS or CSIM format files (which end in .DAT and .DOP). Therefore, the files will not overwrite each other and will probably not cause any problems. By the way, CSI format files have yet another unique file extension (.DTA), so they can also be stored in the same directory. Should they be separated? Perhaps. You may find it more convenient to keep all your ASCII files together in a separate folder. That way you won't have to sort through the MetaStock files that you won't be using when you do your spread sheet analysis. You'll find that your drive is neater and better organized if you keep files in different formats in separate directories. How do you separate directories by format? This requires multiple portfolio entries for the same commodity or group of commodities - one for each different directory you'll be using. For example, you might start by creating a Live Cattle Nearest Futures Group portfolio entry in MetaStock format to be stored in the MS\DATA folder. When that entry is complete click OK, and then repeat the entry in the CSI format to be stored in the \QT\DATA\MEATS folder. User's Reference Manual Page 75 Unfair Advantage 4.3.8.3. Export File Formats 4.3.8.3.1. File Format Overview An important feature of the File Export Options (when identifying your portfolio) is the Data File Format. Your choices are: • • • • CSI CSIM MS (MetaStock) ASCII You'll want to select each format required by your various analysis programs. 4.3.8.3.2. CSI (QuickTrieve) Format The CSI (QuickTrieve) format is widely used by the makers of investment software because it was originally the only format supported by CSI. This made it the only way to access the industry's cleanest, most comprehensive database. Although other options are now available, the CSI format remains a flexible, viable means of storing market data for analysis. Continued compatibility with the CSI format requires that developers remain current with possible format changes posted on the CSI website. The CSI format uses a master file called QMASTER for each directory which identifies the content of the individual data files. The file naming process assigns names as: F001.DTA where the first character is always an F, and the next three characters are a right-adjusted number from 1 to 120, which identifies the file record number (not the CSI commodity or stock number). The extension .DTA identifies this as a CSI format file. UA will write and maintain all CSI format files listed in your portfolio. If the UA Sample portfolio (which uses the SAMPDATA folder) were to hold two CSI format files, an exploration of the folder would reveal: 4.3.8.3.3. CSIM and MetaStock (MS) Format The MS (MetaStock) and CSIM formats are almost identical file formats which can be used interchangeably by MetaStock analysis software and other programs that use the same format. Both formats employ a master file called MASTER for each directory which identifies the content of the Page 76 User's Reference Manual Unfair Advantage individual data files. This information will be used by your third-party software to identify the files for charting and analysis. There are two data files for each contract. The file-naming process assigns names as: F1.DAT and F1.DOP, where the first character is always an F, followed by an integer from 1 to 200, which identifies the file record number (not the CSI commodity or stock number). The extensions identify these as MS or CSIM format files. If the UA Sample portfolio (which uses the SAMPDATA folder) were to hold two MS or CSIM format files, an exploration of the folder would reveal: Many long-term CSI customers have previously used our QuickTrieve software to store data in the MetaStock format. Unfair Advantage offers improved compatibility and more flexible file creation options, such as customized Perpetual Contract data, nearest future contracts, etc. 4.3.8.3.4. ASCII Format Overview When creating or editing a UA portfolio, the File Export Options offer several choices of formats, including ASCII. ASCII (text) files present data in alphanumeric characters that can be read by people and computers. If you plan to process UA data in ASCII files with third-party analysis or spread sheet programs, click the ASCII radio button under File Export Options. The next entry, "Separator" also applies to ASCII files, as does "Include Century." With these, you can determine if your data fields will be separated by commas, spaces, etc. and whether or not the century will be included in dates. Upon completing your portfolio entries, you should also review and customize UA's ASCII file options. A quick check of the reference material provided with your analysis software should help you customize the files for optimal performance. The Data Options you'll want to customize are: • ASCII Field Layout • ASCII Filenames • ASCII Misc. Note: The CSI (QuickTrieve) format and the MS (MetaStock) format are binary formats, NOT ASCII formats. User's Reference Manual Page 77 Unfair Advantage The makers of some UA-compatible programs have supplied CSI with the necessary information to preestablish compatibility. Ask your system developer for details. Separator When adding a portfolio item to UA, the File Export Options portion of the screen includes a "Separator" prompt, as shown: The Separator is used exclusively in writing ASCII format data files, where it determines what will be used to separate the fields (open, high, low, etc.). Click the symbol to the right of the text box to reveal your choices: Make your choice according to your preference or the requirements of your analytical, spread sheet or publishing software. Most third-party programs can use comma separated files. Include Century When adding a portfolio item to UA, the File Export Options portion of the screen includes an "Include Century" prompt. This option is used exclusively in writing ASCII format data files. It determines whether the year will be represented in two digits (without century) or four digits (with century). We recommend the century be included to preserve data integrity in cross-century analysis. Example of date without century 991201 (December 1, 1999) Example of date with century: 19991201 (December 1, 1999) Of course, this is a Y2K issue. Some software written in the 20th century is unable to handle a four-digit year presentation. Page 78 User's Reference Manual Unfair Advantage 4.3.8.4. Periodicity When adding a portfolio item to UA, the File Export Options portion of the screen includes a "Periodicity" prompt, as shown (at bottom): This prompt controls the data intervals (bar frequency) of the data in your files. Your choices are D (for daily), W (for weekly) and M (for monthly). • A DAILY series will hold the daily open, high, low, close, volume and open interest. • A WEEKLY series will hold Monday's open, the high and low for the week, Friday's close, weekly volume and Friday's open interest. • A MONTHLY series will hold the open from the first business day of the month, the high and low for the month and the close from the last business day of the month. Monthly volume figures normally represent the average daily volume. The total volume for the month can be used if it will not be larger than 9,999,999. The open interest shown is for the last day of the month. 4.3.8.5. Writing Exported Files Each time you click OK to add an export format file to your portfolio, you'll have the option of writing the file to disk immediately. You may do so, but you will save time if you wait until all portfolio items have been added, and then write all files to disk together. UA attempts to automatically maintain your export format files by completely re-creating each current file whenever changes are made that affect their history. This assures that all appropriate corrections, revisions and adjustments are present in all your data files. However, there may be times when changes made to your User's Reference Manual Page 79 Unfair Advantage portfolio do not trigger this automatic process. To manually initiate the process of writing all your export format files to disk, simply click any file in UA's portfolio listing, right-click your mouse button, and then click "Select All." Right-click your mouse button again, and select "Rewrite File immediately" from the menu. If you prefer to have UA wait for your next data distribution to rebuild the files, select "Rewrite File on next distribution." You may write an individual file to disk by clicking on it from your portfolio list, then right-clicking the mouse and selecting "Rewrite File immediately" or "Rewrite File on next distribution" from the menu. Use the "Rewrite File" option on the Portfolio menu if you prefer. An alternate method of writing any file in your portfolio to an export format file is to select the file(s), then click the "Send to third-party software" icon on the UA toolbar. This also brings up the same selection screen used in creating the portfolio initially. From there you can adjust the export options as desired and write the export format files. You may exit UA by clicking the Initiate menu and then clicking "Exit," or simply by clicking the close box in the upper right hand corner of your screen. Launch your analysis software normally and begin your analysis work. 4.4. Importing a Portfolio The specific list of commodities with their respective contracts, stocks and funds included in your portfolio is stored in a file called portfile.adm (in the ua\archives directory). This file is created and automatically maintained by Unfair Advantage. There may be times when you want to import an existing Unfair Advantage portfolio. The imported portfolio may be one that you created and saved using another version of UA (v 1.75 or higher), or perhaps a portfolio that a friend, colleague or software developer created for you. When you import a portfolio, it overwrites any existing portfolio within your UA\Archives directory. If you have a portfolio you want to keep (or may want to refer to again), we strongly recommend you rename it (perhaps portfile.ad2) before importing the new portfolio. Be sure you don't overwrite or confuse the file you'll be importing with the one you are preserving now. To import an existing portfolio, pull down the Portfolio menu (click it) and then click Import Portfolio as shown here: Page 80 User's Reference Manual Unfair Advantage A screen similar to the following displays: User's Reference Manual Page 81 Unfair Advantage You'll note that this is a listing of the files within your UA directory. The portfile.adm file being used by your UA is stored in Archives folder shown here. To import another portfolio file, you'll need to browse through your hard drive to locate the appropriate file. To find a portfolio file UA automatically saved during an upgrade, look for portfile.bak or portfile.mig in the UA\ARCHIVES directory. Click the down arrow button to the right of the "Look in" box, then select your hard drive as shown: When the list of folders on your drive displays, select the one holding the portfile.adm file you wish to use. It is likely in the Temp folder, where it might have been stored during a backup or following a download from the Internet. When you find the portfile.adm file you wish to import, click on it, then click [Open]. The following displays: At this time, you should go through the portfolio list to assure it holds the contracts you had anticipated. If all looks well, click [Accept]. If there appears to be a problem with the new portfolio, click [Decline] to cancel the importing process. In case of an unsuccessful import, please transmit the files requested by the next Error Message screen, and call CSI as indicated. After a successful portfolio import, your new portfolio will display in the UA portfolio window. Page 82 User's Reference Manual Unfair Advantage 4.5. Downloading a Portfolio During the installation of Unfair Advantage, you were given the option of selecting a pre-defined portfolio for creation in your UA system. Regardless of which portfolio you selected at that time, you may go to the CSI website to download the most current version of any of the available portfolios. Visit the Unfair Advantage Website at: http://www.csidata.com/UA/uax.html THE PORTFOLIO YOU DOWNLOAD WILL OVERWRITE ANY EXISTING PORTFOLIO YOU ARE NOW USING, SO PROCEED ONLY IF YOU WANT TO PERMANENTLY REPLACE YOUR CURRENT PORTFOLIO! Scroll to the following screen to see your options: Click the portfolio of your choice. You'll be asked if you want to save or open the file. Choose SAVE. The Save As dialog will display, asking where the file should be stored. Save it to the UA\ARCHIVES directory, and proceed with the download as directed. Once the new portfolio has been downloaded and saved, it must be imported before it will be recognized by CSI. Click "Import Portfolio" from the Portfolio menu, and the content of the UA directory will display. Doubleclick the ARCHIVES folder, and then click [SAVE]. When you return to the UA screen, the new portfolio will display in the left window. The list of available portfolios may grow as time goes by, so check this site any time you use a new CSIcompatible program. If your third-party software vendor recommends a specific portfolio of markets, encourage them to work with CSI in listing it here. User's Reference Manual Page 83 Unfair Advantage 4.6. Editing Your Portfolio UA makes it easy to change the content of your portfolio by editing the properties of any item listed there. Simply click on the commodity or stock entry in your portfolio list that you want to change. Then use one of the following two methods to edit your choice. 1) Right-click your mouse to bring up the following menu, where you'll click "Edit" or "Properties." or 2) After clicking the market you want to edit, click the portfolio menu to bring up a similar list of choices, from which you will choose "Edit." The Data Selection screen used to create the portfolio entry displays. See the specific entries under Selecting a Data Series for an explanation of your choices. 4.7. Rewrite File Immediately Why rewrite a file? With UA's portfolio system, files may be automatically rewritten to implement changes in contract specifications, stock splits, etc. Any time you manually edit the database, make a change to a portfolio item, or change various Data Options within UA, the software will automatically rewrite the affected export format files. A change in Data Options will affect all portfolio items and cause each portfolio file to be rewritten on the next download. A change or correction to a particular file will only cause that one file to be rewritten. In the absence of such changes and rollover conditions, all files will be appended rather than rebuilt, which takes less time. Writing a file can take up to one minute per contract, so this rewriting feature is used only as needed to maintain your specific portfolio and data integrity. Page 84 User's Reference Manual Unfair Advantage If you make any of the above changes and would like them to be implemented right away, use the Portfolio Menu's "Rewrite File Immediately" feature. This menu option results in the selected file or files being written to disk immediately. For more about rewriting files, see the Writing Exported Files topic in the File Export Options chapter. 4.8. Rewrite File on next distribution This feature was formerly called "Flag for Rebuild." The process of writing a file or portfolio refers to creating fresh UA charts and writing fresh export format files. You might want to rewrite one or more portfolio items after making changes to your portfolio. An example of when you might rewrite a file would be after changing the roll timing settings on a Back-Adjusted series. This feature rewrites files as you direct, but it waits to do so until your next data distribution. To rewrite an item from your portfolio, first click on the entry in your portfolio list. Then use one of the following two methods for rebuilding. 1) Click the Portfolio menu to bring up a list of choices, from which you will choose "Rewrite File on next distribution," or 2) After clicking the file you want to rewrite, right-click your mouse to bring up a menu, where you'll click "Rewrite File on next distribution." Either way, the following displays: Click [Yes] to prepare UA to rewrite your selected files the next time data distribution occurs (typically after your next update). Rewriting Multiple Portfolio Entries You may rewrite multiple items from your portfolio list simultaneously IF they are listed consecutively or IF you want to rewrite everything in the portfolio. Here's how: To rewrite consecutive items in your portfolio list, first click on the first item to be rewritten. Press and hold down the <shift> key, while clicking on the last item to be rebuilt. All items between your first and last selections, inclusive, will be selected. Use either of the right-click or Portfolio menu methods described above to rewrite the files. You will be asked to confirm the rebuilding of your files. To rewrite all items in a portfolio, click any single item, then right-click your mouse and click "Select All" from the menu. Right-click again and then click "Rewrite File on next distribution." User's Reference Manual Page 85 Unfair Advantage 4.9. Deleting an Item From Your Portfolio Keep your portfolio lean and mean by deleting contracts you don't wish to view on a regular basis. This reduces the time required to update your portfolio each day. Items that are removed from your portfolio still exist in the UA compressed database, from which they are available for chart and file creation as long as you are an active UA subscriber. They can be re-added to your portfolio at any time. This process also deletes corresponding export format data files from your hard drive (CSI, MS, CSIM and ASCII format files). To delete an item from your portfolio, first click on the commodity or stock entry in your portfolio list that you want to delete. Then use one of the following two methods for deletion. 1) Right-click your mouse to bring up a menu of choices (see "Editing Your Portfolio, above), where you'll click "Delete." You'll be asked to confirm your choice before the item is deleted. 2) After clicking the market you want to delete, click the Portfolio menu to bring up a similar list of choices, from which you will choose "Delete." Deleting Multiple Portfolio Entries You may delete multiple items from your portfolio list simultaneously IF they are listed consecutively or IF you want to delete everything in the portfolio. Here's how: To delete consecutive items in your portfolio list, first click on the first item to be deleted. Press and hold down the <shift> key, while clicking on the last item to be deleted. All items between your first and last selections, inclusive, will be selected. Use either of the right-click or Portfolio menu methods described above to delete the files. You will be asked to confirm the deletion of X number of files. To delete all items in a portfolio, click any single item, then right-click your mouse and click "Select All" from the menu. Right-click again and then click "Delete." Note: Contracts that are included in your portfolio through the Individual Futures Group settings can be deleted from your hard drive automatically as they roll out of the IFG window. Go to the General tab on Data Options, "Delete Expiring Contracts for Individual Futures Group" to set your preference. Failure to automatically delete expired contracts will waste disk space; a deleted contract can be re-written at any time from your compressed historical database. 4.10. Remove Studies from Series Any time add studies to a UA chart through the "Change Indicators on Chart" icon on the toolbar, you can delete them by reversing the procedure. If a chart is closed with studies remaining, they will be included the next time you recall the chart during this UA session. While it is not normally a problem to close a chart without first removing studies, those studies will be redrawn if the same chart is displayed again during the charting session. To remove studies from the charts you have closed, click "Remove Studies from Series" from the Portfolio Page 86 User's Reference Manual Unfair Advantage menu before selecting the series for charting. This feature will not remove studies from charts currently displayed on your screen. 4.11. Chart (on Portfolio Menu) Click "Chart" from the Portfolio menu to create a graphic image of the item or items selected on your portfolio list. Alternate methods to chart a portfolio selection are: • Double-click any item in the portfolio list • Select one or more items in the portfolio list, right-click you mouse, then choose "Chart" from the list. See UA Charts for more information on creating and manipulating charts. 4.12. Find in Portfolio Depending upon the size and complexity of your portfolio, you may need help locating a particular item listed there. With a wide range of sorting options, this feature makes it easy. Pull down the Portfolio menu or right-click any item in your portfolio to bring up the menu of options. Click "Find in portfolio" to display the following screen: Sort By - Click the down arrow to the right of the Sort By box for the option of sorting by Symbol, directory, description, exchange, format, filename, period, delivery month, study1, study2, AutoUpdate, current contract, previous contract, last rolled (date). Starts With/Contains - Click your choice of searching based on the first letter or number (starts with) or searching for a string included in the sort field (contains). Use the [Restart Find] to begin or refine your search, or [Find next] to begin your search or scroll through all search results. User's Reference Manual Page 87 Unfair Advantage 4.13. Printing Your Portfolio To make a hard copy printout of your portfolio, click the Portfolio menu, then click "Print Portfolio." Your settings in Printer Options will be used to print your portfolio listing. The printout includes the Symbol, Directory, Description, Exchange, Format, Filename, Period, Delivery (contract type), Study 1 and Study 2 for each item. 4.14. Change Format The format of the items in your portfolio determines what export format files will be created and maintained by UA. The choice of format(s) is selected when an item is added to the portfolio and can be changed along with other options through the contract selection screen. The "Change Format" option on the Portfolio menu gives you a quick way to change formats without getting into the more complicated selection screen, but it isn't quite as versatile. To change a format, click the portfolio item you want to change, then click the portfolio Menu (or right click). Click "Change Format" from the menu. The following displays: Choose the ONE format you want to use. (The full selection screen allows for multiple formats; this does not.) Keep in mind that if you change from one export file format (ASCII, CSI, CSIM or MS) to another, UA will delete data file on your hard drive in the format you are switching out of. If you would prefer to change formats with a greater variety of choices, see the File Format Overview. 4.15. Change Period The periodicity (reporting frequency) of the items in your portfolio determines whether your charts and export format files will be created as daily, weekly or monthly files. The choice of "Period" is selected when an item is added to the portfolio and can be changed along with other options through the contract selection screen. The "Change Period" option on the Portfolio menu gives you a quick way to change reporting frequency without getting into the more complicated selection screen. To change a chart or file's periodicity, click the portfolio item you want to change, then click the portfolio Menu (or right click). Click "Change Period" from the menu. The following displays: Page 88 User's Reference Manual Unfair Advantage Click your choice, keeping in mind that most software can create weekly and monthly files from daily data, but that daily files cannot be reverse engineered from weekly and monthly files. Your changes will be visible immediately on a UA chart. You'll need to rewrite your export format file to make this change take effect there. 4.16. Change Auto Updating See the "Update Automatically" topic in the Inserting a Portfolio Item chapter. 4.17. Backing Up & Restoring a Portfolio A customized Unfair Advantage portfolio is a beautiful thing. It can hold the key to your unique trading strategies, complete with your own user-defined continuous series for individualized analysis. A comprehensive portfolio can represent perhaps an hour or more of time spent defining a unique set of markets and parameters. Why wouldn't you want to preserve a backup copy -- just in case something happens to your active portfolio? Reasons to back up your portfolio: • • • • • In case of file corruption In case of unwanted changes by the user In case a new UA installation requires deletion of your working portfolio In case a UA upgrade damages your portfolio To use as an alternate portfolio Making a Portfolio Backup If you have customized your portfolio and any of the above scenarios leaves you with no portfolio (or an unwanted one) you'll probably want to restore your backup copy of your portfolio listing. Doing so will eliminate the need to re-enter your list of files and charts and, perhaps more importantly, specifications for the custom computed contracts you wish to view. Of course, this process requires that you first backed up your existing portfolio, as described here, before deleting or overwriting it, or before the damage occurred. Any time you back up your entire \UA directory, your portfolio is included automatically. If your latest \UA backup was made since any portfolio changes, it is probably not necessary to make a separate portfolio backup. See Backing Up UA for instructions on backing up the full Unfair Advantage system. You can save a copy of your portfolio file separately with these steps: 1. Right-click your computer's START button, then click "Explore." In the left window of your screen, scroll to the \UA folder. 2. Double-click the \UA folder to reveal the \ARCHIVES folder within , which you should double-click to view a list of files (on right side of your screen). User's Reference Manual Page 89 Unfair Advantage 3. Click the portfile.adm file, then click the Edit menu at the top of your screen. From that menu, click "Copy." 4. Navigating back in the left window of your screen, click the \TEMP folder. If your TEMP folder holds your last UA backup (in the \OLDUA directory), we recommend you place your current portfolio with your previous backup of the entire software system. To do so, double-click the \OLDUA folder, then double-click ARCHIVES. 5. Go to the Edit menu and click "Paste." When properly done, this operation creates a duplicate copy of your portfile.adm file in your \OLDUA\ARCHIVES directory, just as it would be if you had backup up the entire UA system. An alternate method is to store the portfile.adm file in another directory of your choice. To do so, in step 4, instead of going to the OLDUA folder, select the directory where you want to place your backup portfolio file. Restoring a Portfolio Follow these steps to restore your backup portfolio file. If your portfolio was backed up as part of your last full Unfair Advantage (\UA) backup, or you stored your latest portfolio backup within your \UA backup, you can restore that copy as follows: 1. Right-click your computer's START button and click "Explore." 2. Navigate through the left window to the TEMP folder. Click the Temp folder to reveal its contents, then double-click the OLDUA folder. From there, click the ARCHIVES folder and, finally, click the portfile.adm file. 3. Go to the Edit menu and click "Copy." 4. Back in the left window of your directory tree, click your UA folder. From there, click ARCHIVES. 5. Go back to the Edit menu and click "Paste." You may be asked if you want to overwrite an existing file. Answer YES. This should restore your previous portfolio to the current UA directory. If your portfolio was backed up separately (not part of a full \UA backup), use the steps above, but in Step 2, navigate to the folder where your backup portfolio file was stored (probably \TEMP). An alternate method of restoring a preserved portfolio is to use UA's "Import portfolio" option on the Portfolio menu. 4.18. Automatic Portfolio Backups Whenever a new release of UA is installed, the software automatically renames your portfolio file from portfile.adm to portfile.mig or portfile.bak under the UA\Archives directory. If you did not back up your portfolio as directed, or if there was a problem with the portfolio you saved, you may be able to import your old portfolio, finding it under one of the names listed above. Page 90 User's Reference Manual Unfair Advantage See "Importing a Portfolio," above, for instructions. 4.19. Data Options Affecting Portfolio Items 4.19.1. Overview Unfair Advantage is a versatile tool for data management and analysis which offers many options to meet the needs of our diverse customers. The following options (from the Options menu) may be adjusted to affect changes to the items in your portfolio: From Data Options: • Delete Expiring Contracts For Individual Futures Group (on General tab) • Memory Cache Size (on General tab) • Choose Market From List • Retrieving Cash Prices (on Cash/Saturday tab) • Include Saturdays (on Cash/Saturdays tab) • Raise Negative Series (on Back Adjusting tab) • Back Adjuster (on Back Adjusting tab) Unfair Advantage will automatically rewrite export format files when adjustments are made to any of these options that affect existing data files. 4.19.2. Retrieving Cash Prices The Data Options choice on the Options menu offers several features that directly affect your UA portfolio, including those listed on the Cash/Saturday tab as shown: User's Reference Manual Page 91 Unfair Advantage Retrieving cash prices is NOT RECOMMENDED! The cash price is available for most commodities in two ways: 1) as a single (closing) price in the same record as the open, high, low and close prices of the corresponding futures contract, as provided for here, and 2) as a separate record including the open, high, low and closing cash prices. Check this box to include the single closing cash price along with the daily futures prices for every contract. This option adds considerably to data distribution time. A faster alternative is to add a "cash" contract for the selected commodities to your portfolio. Note: When cash prices are included with futures in this way, nearest-future data for the underlying commodity may be substituted for cash at times when the cash price is not available. This would most likely occur for commodities that have a later start date for cash than for futures. 4.19.3. Include Saturdays Also on the Cash/Saturdays tab (see above) of Data Options is the prompt for including Saturday data. Page 92 User's Reference Manual Unfair Advantage The option to "Retrieve Saturday Trading Data" applies only to ASCII files written by UA. Most world markets do not include Saturday trading data at this time, and few, if any, trading systems can process this information. Check the box (click it) if any available Saturday data on file should be included in your exported ASCII files. 4.19.4. Back Adjuster The Data Options choice on the Options menu offers several features that directly affect your UA portfolio, including those listed on the Back Adjusting tab as shown: User's Reference Manual Page 93 Unfair Advantage The lower half of this screen gives the option of using the C++ Back Adjuster and gives a brief explanation. Here is more background on the two choices: The "back adjuster" refers to the algorithm used to select contracts in back-adjusted continuous files when rolling on volume and/or open interest is selected. UA offers two methods for back-adjusting data. The original (standard) method is written in FORTRAN and the newer (alternate) method is written in C++. Both back adjusters adopt the rule that no regression will take place. In other words when the market is viewed backwards in time as with the standard back adjuster, successive delivery months will have to be earlier in date; if the market is viewed forward in time, as with the alternate back adjuster, successive delivery months will have to be later in date. The cotton market provides a good example of how the standard back adjuster compiles its historical series by viewing the data backward in time and the alternate back adjuster views the markets forward in time. In the cotton market, after traders are finished with the May contract, there is a tendency to take a position in the December cotton contract because volume and open interest for the December contract often exceed the volume and open interest of the intervening July and October contracts. Open interest and volume tell us that December is favored over the October and July contracts which lie between May and December. The July and October contracts do not capture the interest of most traders until a couple of months from their respective expiration dates. Because the alternate back adjuster does not regress to an earlier delivery month, the December delivery month remains in force, even though traders may favor the July or October deliveries when those intermediate contracts get closer to expiration. What this means to the alternate (C++) back adjuster is that once the May contract approaches its final delivery day, the open interest and volume are likely to favor the December contract. This occurs as early as April or May of the same year. Hence rolling takes place from May to December, leaving out the effects of both July and October, contrary to the trading preferences of the average cotton trader. In the case of the standard (Fortran) back adjuster, which views the market from the most recent information Page 94 User's Reference Manual Unfair Advantage backward in time, the December cotton contract is introduced first. From there, a backward rolling will sometimes favor the October contract, but will usually roll backward to the July contract because the May contract may have already expired. Because of this, the standard back adjuster will step from contract to contract backward in time, picking up the new contract which is dictated by maximum open interest or volume or both. Another minor difference between the standard and alternate C++ back adjusters is that the alternate version requires two or more days of confirmation on volume and open interest before invoking any action to roll forward. Because the user has the option to roll when both volume and open interest effects are confirmed, the standard back adjuster requires only one day of confirmation. A summary of differences between the standard and alternate back adjuster is included in Bob Pelletier's essay, "Computed Contracts: Their Meaning, Purpose and Application" (see Back-and Forward-Adjusted Contracts) in this manual. Check this box (click it) to use only the alternate C++ adjuster. There are some instances when, due to new program features, the C++ (alternate) back adjuster will be used, even if this box is unchecked. 4.19.5. Raise Negative Series The Data Options choice on the Options menu offers several features that directly affect your UA portfolio, including those listed on the Back Adjusting tab as shown: The upper half of this screen gives the option to, "Add a fixed amount to make non-negative." This refers, of course, to negative values created through the creation of adjusted continuous data files. Back- and forward-adjusted continuous contracts can regress to negative values into the past. This is one of two options allowing you to avoid negative numbers. The resulting data (including current contract prices) will be adjusted upward by the absolute value of the maximum dip below zero + 1,000 points. User's Reference Manual Page 95 Unfair Advantage Consider using the detrend option before adopting this choice. Check the box (click it) if desired. In a commodity such as crude oil, which produces negative back-adjusted prices into the past, this option will force recent prices to appear as much as double the current price. 4.19.6. Delete Expiring Contracts For Individual Futures Group The Data Options choice on the Options menu offers several features that directly affect your UA portfolio, including those listed on the General tab as shown: At the top of this screen, the Delete Expiring Contracts for Individual Futures Group option helps streamline your portfolio, assuring that it contains only those active contracts you may be following. The Individual Futures Group (IFG) includes a revolving selection of active current contracts for your selected commodities. As contracts grow near (or nearer) to their expiration month, they move into the userdefined window for inclusion in the Individual Futures Group. An Individual Futures group might include all contracts, the five nearest contracts, or perhaps just the nearest two. You decide how many near contracts to include when you add the item to your portfolio. This setting causes UA to DELETE contracts from both your UA portfolio and from export format files stored on your hard drive. For example, let's say your MS\MSDATA directory holds data for the 09/2000 Corn contract, which is part of the Nearest Futures Group. On the day the 09/2000 contract expires or rolls out of the updating window for your Nearest Futures Group, the 09/2000 contract will be deleted from your MS\MSDATA directory. Of course, you can have UA recreate the file, but the current file will be gone for the time being. If you want to build and maintain an archive of expired contracts in your export format files, do not select this Page 96 User's Reference Manual Unfair Advantage option! 4.19.7. Choose Market from List When adding a new contract, stock or miscellaneous data series to your UA portfolio, the selection screen first appears with the "Market Type" set for "Commodities, and and empty "Market" box at the top of the screen. You can change the "Market Type" as needed, and can type in symbols (corresponding to the "Market Type") for desired markets. If you prefer to select your markets from the factsheet list (for commodities, stocks or miscellaneous), you can click the [...] (browse) button next to the "Market" box to display the appropriate list. This option gives you another alternative to the above scenario. When "Choose Market from List" is selected on the General Options tab, UA will automatically display the commodity factsheet every time the Portfolio selection screen displays. 4.19.8. Include Inactive Stocks By default, UA will disregard inactive stocks in your portfolio and in Stock Scanning. This means that UA will not waste your time writing and re-writing export format files, or creating charts for stocks that no longer trade. UA offers the option of including inactive stocks in your portfolio and stock scans through the "Stocks" tab of Data Options (through the Options menu). If you would like to include inactive stocks in your analysis, click the Data Option "Stocks" tab as shown, then click the box in front of "Include inactive stocks." Click the box again (uncheck it) to deactivate this feature. User's Reference Manual Page 97 Unfair Advantage 5. Stock Scanner 5.1. Stock Scanner Overview Responding to customer demand to view equities and mutual funds according to customized sorting and filtering criteria, we added a stock scanner capability to UA. Customers may now effortlessly identify the various rules and pre-supplied analysis indicators to be used in filtering the UA stock database. The resulting output enables the construction of a historical database held on disk for immediate analysis with UA or thirdparty software. The use of UA's Stock Scanner involves two distinct processes. The first is the creation of the stock scanning file as part of data distribution. Through one of UA's Data Options, you set your preference for automatic creation of the scanning file (or not). You can also set your preferences for the number of days to be included in the scan, whether or not stock splits and dividends will be taken into account, and the exchanges to be included. The list of available stocks, for example, could include all stocks in the database or just on the NYSE, or just Mutual Funds, or NASDAQ, etc., as desired. These conventions allow you to create a custom scanning file when needed, and to avoid the process when not desired. When Data Options are set to "Maintain Stock Scanning File," a fresh scan file will be created each time a daily update is retrieved from CSI and distributed to your compressed database, and whenever the update is manually redistributed. You can also manually rebuild the stock scan file without a complete database distribution, even if your data options are not set to automatically maintain the stock screening file. This is done through the Initiate menu. The second part of the Stock Scanning process involves defining the scan/filter criteria through UA's Initiate menu. The user is invited to sort or filter the list of stocks in various ways to isolate the desired stock list. Parameters include price and volume figures, daily range and an extensive list of technical indicators. The Stock Scanner can filter out high or low volume equities, stocks priced above or below a particular price level, etc. For example, the user might filter the database inventory using Welles Wilder's RSI with a window size of 10 days, listing only those stocks whose RSI value is greater than 90. This exercise might reduce 25,000 stocks down to a short list of five or ten. These stocks may be 1) viewed immediately as UA charts, 2) added to your portfolio for regular tracking and/or 3) exported to data files for analysis with third-party software as desired. The file that holds the universe of stocks created during the distribution process is called C:\UA\Archives\stkscn.bin. This file is available for immediate investigative use by third-party programs to explore auxiliary filtering strategies. The Stock Scanner may be most valuable to analysts writing their own software in Fortran, C++, Basic, etc. and reading the C:\UA\Archives\stkscn.bin file. This is a REAL*8 file holding various stocks by number that have been extracted from the master compressed database. You have almost unlimited capability to define a huge database of perhaps hundreds of days of data in uncompressed form. The Stock Scanner is an alternate method of selecting stocks for charting or third-party analysis. It can be used in lieu of a standard portfolio or in conjunction with one. The scanner offers many options for screening and sorting stocks, including price, volume and an assortment of technical indicators. You can run consecutive filters on the stock list to narrow the selection of stocks for analysis. Page 98 User's Reference Manual Unfair Advantage The stock scanning list can be used just like the portfolio list for charting stocks and for writing export format files to disk. To use the Stock Scanner, you must first turn the option on through the Stock Scanning screen of Data Options and allow the file to be built during your next data distribution or by initiating a manual stock scan. Only then, after building a current stock scan file, should you launch the stock scanner. 5.2. Stock Scanning Options To use the Stock Scanner (on the Initiate menu), you must first make sure UA is set to maintain a stock screening file. Turn the option on through the Stock Scanning screen of Data Options as shown: User's Reference Manual Page 99 Unfair Advantage Maintain Stock Screening File: It looks as if When checked, UA automatically creates a screening file (\UA\ARCHIVES\stkscn.bin) during data distribution after each update and when "Manual Database Distribute" is chosen from the Initiate menu. The screening is done very quickly, but may take a minute or two if you have a slower computer. The resulting file can reveal vital information and can greatly expedite analysis. If you are bothered by the amount of time required for screening the stock database, you might want to leave this option off, and turn it back on only when it is needed. The Stock Screening file may be used by system developers to facilitate custom screening for proprietary applications. Include ____ Days: This determines the number of days available for calculations such as moving averages, oscillators and such that will be used for filtering stocks. During the actual screening process, this value is the upper limit for all time thresholds, window sizes, moving average periods, etc. The more days you include in the scanning file, the more time will be required for creating this file during data distribution, and the more space will be consumed on your hard drive when writing the output file. A twenty-five day scan of the full stock database consumes about 8MB of hard disk space. Adjust for splits, capital gains and dividends: This is a useful feature for weeding out price fluctuations caused by stock splits, capital gains and dividends. We recommend its use, although it will increase the time required for screening the database. Exchanges: Check every exchange you want to use in your stock screening. Note that all NASDAQ stocks are classified as OTC, and mutual funds and indices are listed as separate categories. Even when stock screening is selected through Data Options, you must still activate the actual screening or sorting process through the Initiate menu. Page 100 User's Reference Manual Unfair Advantage 5.3. Manual Stock Scan Rebuild Any time you change your Stock Scanning options (such as the number of days or exchanges to include), the changes will only be visible after you rebuild the stock scanning file. You can manually rebuild the stock scanning file by selecting this option from the Initiate menu. If your Data Options are set to "Maintain Stock Screening File," your stock screening file will also be rebuilt during your next data distribution (either manual or automatic after an update). Either of these will make your current Stock Scanning options effective immediately. 5.4. Launching Stock Scanner Before launching Stock Scanner, you must set the Stock Scanning Options on the Data Options screen. In order to do a current stock scan, your database must hold current market data from CSI. Please make sure the most recent daily update has been retrieved from CSI before proceeding. Launch the Stock Scanner by clicking UA's Initiate menu and selecting "Stock Scanner." 5.5. Sort vs. Filter Upon selecting Stock Scanner from the Initiate menu, a list of stocks displays. UA lets you sort or filter stocks by clicking your choice from the bottom of the screen: Sort: This determines the order of presentation of your stocks. All stocks from the exchanges you selected in Data Options will be included in the sorted list. In addition to the sort parameters listed on the menu, you can also sort the stocks by clicking the headings at the top of any column. Filter: When stocks are filtered, the parameters you define are used to exclude certain stocks from the list. You might use the filter to weed out all stocks with very high prices or unfavorable technical indicators. User's Reference Manual Page 101 Unfair Advantage Upon selecting either [Sort] or [Filter], the "Sort by" or "Filter by" screen displays (they are very similar). The example below shows a filtering where only those stocks priced less than $10 per share would be included in the list. They are sorted in decreasing price order (as indicated): The result of the above filtering and sorting exercise would be: Note that all stock prices are less than ten, and they are presented in decreasing order. (This was a search on just NYSE stocks. You can adjust the markets to include on the Stock Scanning Options screen.) See the Sort/Filter Parameters chapter (starting with "Last") for details on completing the "Sort/Filter by" Page 102 User's Reference Manual Unfair Advantage screen. 5.6. Screening Thousands of Stocks Stock screening is all the rage in investment software these days. With perhaps 25,000 stocks to consider on a daily basis, the active stock trader can't begin to explore the countless opportunities at hand without the help of modern technology. Tools are clearly needed to filter out unsuitable picks, leaving time to fully investigate the more promising investments. Responding to customer demand to view equities and mutual funds according to customized sorting and filtering criteria, we added a stock scanner capability to UA. Customers may now effortlessly identify the various rules and pre-supplied analysis indicators to be used in filtering the UA stock database. The resulting output enables the construction of a historical database held on disk for immediate analysis with UA or thirdparty software. The use of UA's Stock Scanner involves two distinct processes. The first is the creation of the stock scanning file as part of data distribution. Through one of UA's Data Options, you set your preference for automatic creation of the scanning file (or not). You can also set your preferences for the number of days to be included in the scan, whether or not stock splits and dividends will be taken into account, and the exchanges to be included. The list of available stocks, for example, could include all stocks in the database or just on the NYSE, or just Mutual Funds, or NASDAQ, etc., as desired. These conventions allow you to create a custom scanning file when needed, and to avoid the process when not desired. When Data Options are set to "Maintain Stock Scanning File," a fresh scan file will be created each time a daily update is retrieved from CSI and distributed to your compressed database, and whenever the update is manually redistributed. The second part of the Stock Scanning process involves defining the scan/filter criteria. The user is invited to sort or filter the list of stocks in various ways to isolate the desired stock list. Parameters include price and volume figures, daily range and an extensive list of technical indicators. The Stock Scanner can filter out high or low volume equities, stocks priced above or below a particular price level, etc. For example, the user might filter the database inventory using Welles Wilder's RSI with a window size of 10 days, listing only those stocks whose RSI value is greater than 90. This exercise might reduce 25,000 stocks down to a short list of five or ten. These stocks may be viewed immediately as UA charts, added to your portfolio for regular tracking and/or exported to data files for analysis with third-party software as desired. The file that holds the universe of stocks created during the distribution process is called C:\UA\Archives\stkscn.bin. This file is available for immediate investigative use by third-party programs to explore auxiliary filtering strategies. The Stock Scanner may be most valuable to analysts writing their own software in Fortran, C++, Basic, etc. and reading the C:\UA\Archives\stkscn.bin file. This is a REAL*8 file holding various stocks by number that have been extracted from the master compressed database. You have almost unlimited capability to define a huge database of up to 100 days of data in uncompressed form. CSI's Stock Scanner is a versatile tool that should help to isolate opportunities and reduce the spectrum of options to very few alternatives. We hope it meets the needs of our customers in this important aspect of equity analysis. We look forward to your feedback as to the usefulness of this product and suggestions for enhancements that may make it even better. User's Reference Manual Page 103 Unfair Advantage 5.7. Sort/Filter Parameters (studies) 5.7.1. Last (sort/filter) The "Last" sort/filter option lets you sort or filter stocks based on the last day's price (open, high, low or close) or the last day's volume. Use this feature to narrow the list of stocks to your desired price range or to find stocks with desirable volume figures. No additional parameters are required for sorting by last price or volume, but you'll need to enter the desired sort/filter field ("of close"), as well as the sort order ("Decreasing sort") and, if you will be filtering your stock listing, you'll fill in the "Show only when" entries. Details on these options follow this list of sorting parameters. When all required fields have been selected, click [Sort] or [Filter]. 5.7.2. Previous (sort/filter) The "Previous" sort/filter option lets you sort or filter stocks based on the previous to last day's price (open, high, low or close) or the previous to last day's volume. Use this feature to narrow the list of stocks to your desired price range or to find stocks with desirable volume figures. No additional parameters are required for sorting by previous price or volume, but you'll need to enter the desired sort/filter field ("of close"), as well as the sort order ("Decreasing sort") and, if you will be filtering your stock listing, you'll fill in the "Show only when" entries. Details on these options follow this list of sorting parameters. When all required fields have been selected, click [Sort] or [Filter]. 5.7.3. Moving Average (sort/filter) A moving average is a mathematical attempt to smooth fluctuations in price or volume, Open Interest or other types of data. It is typically used to compare current values with recent values. For screening purposes, it lets you screen stocks based on an . average price (or volume), as opposed to just the last one or two days. The "Moving Average" sort/filter option lets you sort or filter stocks based on the current moving average value of the price (open, high, low or close) or a moving average of recent volume. Use this feature to narrow the list of stocks to your desired price range or to find stocks with desirable volume figures. The simple moving average used here is the average of a price field (usually the closing price) over a given period. This is the sum of the prices over the period divided by number of days in the period. Each day the average is re-calculated using the same number of observations by adding one new reading and deleting the first reading for the period. Hence, the average is moving. One additional parameter is required for sorting by moving average: Window Size: This is the number of days on which the moving average will be based. The smaller the span selected, the closer to the most recent prices (or volumes) the average will be. Your input must be less than the "Days to include" selected for scanning in Data Options. Moving averages (greater than 1) always lag the market. Page 104 User's Reference Manual Unfair Advantage You'll also need to enter the desired sort/filter field ("of Close"), as well as the sort order ("Decreasing sort") and, if you will be filtering your stock listing, you'll fill in the "Show only when" entries. Details on these options follow this list of sorting parameters. When all required fields have been selected, click [Sort] or [Filter]. 5.7.4. Exponential Moving Average (sort/filter) The Exponential Moving Average used here is similar to the [Simple] Moving Average, but it adds greater emphasis to later data. This type of average applies a percentage of the most recent price to the previous day's moving average value. Exponential moving averages are considered by many to give better trading signals than simple moving averages. Results for screening purposes, however, will be similar. Half Life: This is the number of days it takes for the exponential weighting factor (multiplier) to degrade to one-half of its original value, hence, its half life. The smaller the span selected, the closer to the most recent prices (or volumes) the average will be. Your input must be less than the "Days to include" selected for scanning in Data Options. Moving averages (greater than 1) always lag the market. You'll also need to enter the desired sort/filter field ("of Close"), as well as the sort order ("Decreasing sort") and, if you will be filtering your stock listing, you'll fill in the "Show only when" entries. Details on these options follow this list of sorting parameters. When all required fields have been selected, click [Sort] or [Filter]. 5.7.5. Momentum (sort/filter) Divergence between price and the momentum index is often a warning that a price correction is imminent. This phenomena makes a screening for very high or low momentum values an interesting exercise. Peaks and troughs in the oscillator may be interpreted as overbought and oversold indicators, respectively, but this is not an iron-clad trading indicator. Momentum values can fluctuate widely throughout a strong bull or bear market, without forecasting a break in the price trend. Momentum makes a good screening tool, to be used as an alert, not as a trading signal by itself. One additional parameter is required for sorting by Momentum: Window Size: This is the number of days on which the Momentum study will be based. 10 seems to be the most widely accepted period length for short-term cycle analysis. The smaller the time period used, the more volatile the indicator will be. Your input must be less than the "Days to include" selected for scanning in Data Options. No additional parameters are required for sorting by previous price or volume, but you'll need to enter the desired sort/filter field ("of Close"), as well as the sort order ("Decreasing sort") and, if you will be filtering your stock listing, you'll fill in the "Show only when" entries. Details on these options follow this list of sorting parameters. When all required fields have been selected, click [Sort] or [Filter]. User's Reference Manual Page 105 Unfair Advantage 5.7.6. RSI (sort/filter) The Relative Strength Index, developed by J. Welles Wilder, determines market movement measured as the rate of change. It attempts to correct perceived shortcomings of the standard Momentum study. The only user parameter for this study is the Period 1 Length. The default response of 14 is most commonly used. RSI values oscillate between zero and 100. 5.7.7. Fast Stochastic (sort/filter) The Stochastic process measures the latest close in relation to the price range over a given period. High values indicate the closing price is near the daily high. Low values indicate a close near the day's low. Values are considered most significant when they are between 5 and 15 or between 85 and 90. In technical analysis, it is the crossover of the index itself and the %D line that suggests trading signals. Since stochastic analysis tends to give sell signals while a market is still rising and buy signals while a market is still falling, it has been suggested by several analysts that stochastic signals be used only in the direction of the current trend. Because peaks and troughs of this index may be tipoffs to trading opportunities, Stochastic may be a good screening tool (subject to additional analysis). Stochastic uses two parameters: Calculation Period (%K): This is the number of recent days used for sampling. Five is commonly used. You may enter any number of days as desired, keeping in mind that your input must be less than the "Days to include" selected for scanning in Data Options. Average Period (%D): This is the number of days to be used in calculating a moving average of the raw stochastic. The purpose of the average is to smooth the index, reducing whipsaw signals. The lower the number, the more sensitive the index. Stochastic is always calculated using the close and the daily range, so you won't enter a calculation field. You can adjust the sort order ("Decreasing sort") and, if you will be filtering your stock listing, you'll fill in the "Show only when" entries. Details on these options follow this list of sorting parameters. When all required fields have been selected, click [Sort] or [Filter]. The Stochastic indicator was developed by Dr. George C. Lane. He discussed it in the June, 1984 issue of Technical Analysis of Stocks & Commodities. It is also included in most general books on technical analysis. 5.7.8. Slow Stochastic (sort/filter) The Stochastic process measures the latest close in relation to the price range over a given period. High values indicate the closing price is near the daily high. Low values indicate a close near the day's low. Values are considered most significant when they are between 5 and 15 or between 85 and 90. In technical analysis, it is the crossover of the index itself and the %D line that suggests trading signals. A slow stochastic is very similar to a fast stochastic, but with additional dampening. Page 106 User's Reference Manual Unfair Advantage Since stochastic analysis tends to give sell signals while a market is still rising and buy signals while a market is still falling, it has been suggested by several analysts that stochastic signals be used only in the direction of the current trend. Because peaks and troughs of this index may be tipoffs to trading opportunities, Stochastic may be a good screening tool (subject to additional analysis). Stochastic uses two parameters: Calculation Period (%K): This is the number of recent days used for sampling. Five is commonly used. You may enter any number of days as desired, keeping in mind that your input must be less than the "Days to include" selected for scanning in Data Options. Average Period (%D): This is the number of days to be used in calculating a moving average of the raw stochastic. The purpose of the average is to smooth the index, reducing whipsaw signals. The lower the number, the more sensitive the index. Stochastic is always calculated using the close and the daily range, so you won't enter a calculation field. You can adjust the sort order ("Decreasing sort") and, if you will be filtering your stock listing, you'll fill in the "Show only when" entries. Details on these options follow this list of sorting parameters. When all required fields have been selected, click [Sort] or [Filter]. The Stochastic indicator was developed by Dr. George C. Lane. He discussed it in the June, 1984 issue of Technical Analysis of Stocks & Commodities. It is also included in most general books on technical analysis. 5.7.9. Williams AD Oscillator (sort/filter) The Williams Accumulation/Distribution Oscillator shows market strength and sentiment as an oscillator that fluctuates between 0 and 1.0. It performs three comparisons to determine accumulation and distribution. This study is typically used to find market turning points through divergence analysis. It does not generate trading signals by itself. Very high or low readings in this oscillator may be useful in screening for oscillator peaks and troughs. The user input for the Williams AD Oscillator is: Window Size: Enter a value that represents the number of days that make up a full cycle for this market. 14, 28 and 56 days are typical cycle lengths, so any one of these might be a good choice. Your input must be less than the "Days to include" selected for scanning in Data Options. Williams AD Oscillator is always calculated using the closing price, so your input is not needed for field selection. You may want to adjust the sort order ("Decreasing sort") and, if you will be filtering your stock listing, you'll fill in the "Show only when" entries. Details on these options follow this list of sorting parameters. When all required fields have been selected, click [Sort] or [Filter]. Larry Williams, a successful and well-known commodity trader, is this system's developer. User's Reference Manual Page 107 Unfair Advantage 5.7.10. Williams %R (sort/filter) Williams %R (percent of range) is used to identify overbought and oversold situations. It is similar to Stochastics in that it measures the latest close in relation to the price range over a given period. The Williams %R value oscillates between 0 and 1.00. Divergence analysis tends to work well with this indicator. When price and the indicator move in different directions, price often reverses itself, following the lead of the Williams %R. Like On-Balance Volume, this study's value is typically found in measuring indicator direction, as opposed to raw values. This makes filtering with Williams %R difficult, but it might be useful for identifying peaks and troughs in the index. Williams %R requires just one input: Window Size: The normal cycle length for the market works best here. Since it has been found that most markets have cycles of 14, 28 and 56 days, any one of these choices is a good place to start, keeping in mind that your input must be less than the "Days to include" selected for scanning in Data Options. Williams %R is always calculated using the closing price and range, so your input is not needed for field selection. You may want to adjust the sort order ("Decreasing sort") and, if you will be filtering your stock listing, you'll fill in the "Show only when" entries. Details on these options follow this list of sorting parameters. When all required fields have been selected, click [Sort] or [Filter]. Larry Williams, a successful and well-known commodity trader, is this system's developer. 5.7.11. Ultimate Oscillator (sort/filter) A complete write-up of this study is not available at this time. The three user inputs are: Period 1: Default = 7 Period 2: Default = 14 Period 3: Default = 28 Adjust these settings as desired, based on your knowledge of this indicator. The Ultimate Oscillator is always calculated using the closing price, so your input is not needed for field selection. You may want to adjust the sort order ("Decreasing sort") and, if you will be filtering your stock listing, you'll fill in the "Show only when" entries. Details on these options follow this list of sorting parameters. When all required fields have been selected, click [Sort] or [Filter]. 5.7.12. Market Director Indicator (sort/filter) A complete write-up of this study is not available at this time. Page 108 User's Reference Manual Unfair Advantage The two user inputs are: Period 1 Period 2 Adjust these settings as desired, based on your knowledge of this indicator. Results of this study may include both positive and negative values. You'll also need to enter the desired sort/filter field ("of Close"), as well as the sort order ("Decreasing sort") and, if you will be filtering your stock listing, you'll fill in the "Show only when" entries. Details on these options follow this list of sorting parameters. When all required fields have been selected, click [Sort] or [Filter]. 5.7.13. Average True Range (sort/filter) The Average True Range is an average of the daily price range for a given stock during the sampled period. It can help you spot volatile stocks, especially when combined with other filters to narrow your search to a specific price level. On-Balance Volume requires one parameter: Window Size: This refers to the number of days in the file that you would like used in the Average True Range calculation. Your input must be less than the "Days to include" selected for scanning in Data Options. Average True Range is always calculated using the high and low prices, so your input is not needed for field selection. You'll need to select the desired sort order ("Decreasing sort") and, if you will be filtering your stock listing, you'll fill in the "Show only when" entries. Details on these options follow this list of sorting parameters. When all required fields have been selected, click [Sort] or [Filter]. You can further sort or filter the above list of stocks by repeating the process with new parameters. Keep in mind that filtering processes are cumulative. 5.7.14. On-Balance Volume (sort/filter) On Balance Volume (OBV) represents cumulative volume with market direction factored in. It helps the analyst discern trends in trading volume. OBV is calculated by adding volume to a base value on days when the net price change is positive. Volume is subtracted when the net price change is negative. OBV is subject to very large values, which may be positive or negative. In general, the OBV line moves in the same direction as the price trend. Divergence is often an early warning of an impending price reversal. A change in the OBV trend is often viewed as confirming indicator for changes in price trend. Since it is the direction of the OBV trend, not the raw value, that is usually considered significant, this study may be of dubious value in screening stocks. On-Balance Volume requires one parameter be set: Window Size: This refers to the number of days in the file that you would like used in the OBV calculation. User's Reference Manual Page 109 Unfair Advantage When used for technical analysis, this study typically encompasses the entire data file. However, for screening purposes, the maximum available through your Stock Scanning options will suffice. Your input must be less than the "Days to include" selected for scanning in Data Options. OBV is always calculated using volume and the closing price. You'll need to select the desired sort order ("Decreasing sort") and, if you will be filtering your stock listing, you'll fill in the "Show only when" entries. Details on these options follow this list of sorting parameters. When all required fields have been selected, click [Sort] or [Filter]. On-Balance Volume is always calculated using the closing price and volume, so your input is not needed for field selection. For Filtering, you'll have an additional option of "Show only when." This option filters out all stocks except those stocks whose last field is greater than (>), less than (<), equal to (=), greater than or equal to (>=) or less than or equal to (<=) the value you enter in the bottom box. Your resulting stock list order will be presented in either descending or ascending order, depending upon your selection. These results will be sorted by On-Balance Volume values. You can further sort or filter the above list of stocks by repeating the process with new parameters. Keep in mind that filtering processes are cumulative. 5.7.15. Exchange (sort/filter) Use this option to Sort your data by exchange. Only those exchanges selected on the Stock Scanning tab of Data Options are available for sorting through the Stock Scanner. No additional options are active for sorting by exchange. If your list holds more than one exchange, click [Sort] to view a sorted list. Do not use "Exchange" as a filtering tool. It will return zero results. 5.8. Sort/Filter Fields Open, High, Low or Close Field Upon selecting the "Sort/Filter by" type and entering any applicable parameter(s), you must select the field to be used for the screening. Choose the desired sort/filter field by clicking the down arrow symbol at the right of the "of close" box. The following displays: Page 110 User's Reference Manual Unfair Advantage The close field is commonly used for most types of analysis, but you may have your own reasons for choosing other fields. Sorting by volume is also an option, which is discussed below. This option is not available for every sorting and filtering exercise. In those cases, UA will select the appropriate field(s). Volume Field Upon selecting the "Sort/Filter by" type and entering any applicable parameter(s), you must select the field to be used for the screening. Choose the desired sort/filter field by clicking the down arrow symbol at the right of the "of close" box. For many sorting and filtering exercises, you'll want to select the Volume field. When volume is used, please be aware that UA quotes stock volume in hundreds of shares. This means you would move the decimal point two places to the right to get the true volume of shares traded. For example 31000.00 would represent a true value of 3,100,000.00 shares. The truncation of volume figures is of little or no consequence in sorting your stocks, but it can affect the Filter options used to screen your database. 5.9. Sort Order Decreasing or Increasing Upon selecting the field (open, high. low, close or volume) you must select the sorting order to be used in displaying your stock list. The default presentation is Decreasing. Below is an example of a decreasing list (sorted by Moving User's Reference Manual Page 111 Unfair Advantage Average): "Increasing" order and no order ("None") are also sorting options. You can change the order of the above table by clicking on any heading. Whatever heading you select will become the new sort order. 5.10. Filter Options & Examples Show Only When When using the Stock Scanner to filter your stock database, you must select the filtering options as indicated at the bottom of the screen: Page 112 User's Reference Manual Unfair Advantage The "Show only when" option lets you filter out all stocks except those whose sorting parameters result in a value that is greater than (>), less than (<), equal to (=), greater than or equal to (>=) or less than or equal to (<=) the value you enter in the box at right. These two entries work together, so you must consider each when selecting either one. What responses are appropriate? That depends upon the filtering parameter and sort/filter field used for the screening, and on your filtering objective. See Filtering Examples for some ideas. When your filters have been selected, click [Filter]. Your resulting stock list order will be sorted by your chosen parameters and presented in either decreasing or increasing order, depending upon your selection. You can further sort or filter your list of stocks by repeating the process with new parameters. Keep in mind that filtering processes are cumulative. To begin a new filtering run on the full scanned database, close the Stock Scanner window and start Stock Scanner again from the Initiate window. Stock Scanner Examples Here are some scenarios of how Stock Scanning filters might be used: When using the "Last," "Previous" or "Average" volume as the sort/filter parameter, it is likely that your results will be large values. Keeping in mind that volume figures are truncated by two decimal places, you'll need to select and enter a volume figure that will be significant to you. For example, to screen for high volume stocks, you might ask for stocks with volume greater than (>) 20000 (two million in untruncated volume). For low volume stocks, you might filter stocks with volume less than (<) 100 (ten thousand in untruncated volume). When using an oscillator such as RSI, momentum, stochastics, Williams %R, etc. whose values range from zero to 100, a different set of filters would be appropriate. To find peaks in the oscillator, you might ask for all values greater than or equal to (>=) 80. For troughs, perhaps less than or equal to (<=), say, 20. Filtering can easily involve raw or averaged stock prices, where only prices above or below a given level are User's Reference Manual Page 113 Unfair Advantage accepted. The Average True Range allows for some interesting filtering opportunities. For example, you might use this filter to find all stocks with an Average True Range of, say 5. This brings up an extensive listing of stocks, many of whom have very high prices. A five-point range is not significant in Berkshire Hathaway (priced around $50,000 per share). It would, however, be significant in a stock priced at, say 100. If you were to run a successive filter of all stocks with a moving average of closing prices of less than or equal to 100, then you would have a much smaller listing of stocks with a daily true range of 5% or more. Now this might be useful for the trader who seeks volatility! The possibilities are limitless with the combination of filters offered by UA. When using the Williams AD Oscillator and Williams %R, your filter must accommodate a range that oscillates between zero and 1.0. 5.11. Save, Load & Print Scan The Stock Scanner produces a great list of stocks, filtered and sorted to your specifications. To save the list for future reference, click [Save] from the bottom of the scan screen. A SAVE AS screen displays, showing the folders in your UA directory. The text box asks for: File Name: Enter any name you think will help you identify this scan when you want to retrieve it for use within Stock Scanner. The file extension (.scr) will be added automatically. Save as type: UA Stock Scanner (you can't change this) Your file will be added directly to the \UA directory, where it can be easily retrieved with Stock Scanner's [Load] feature (below). Load Scan Any stock scan that has been saved using Stock Scanner's [Save] feature can be recalled for use during the same or later UA session. To load a saved scan, click [Load] at the bottom of the Stock Scan screen. A standard OPEN FILE dialog displays showing the folders and files within your UA directory. Each of the scanned files you saved will be listed there. (You can tell them by the .scr extension.) Doubleclick the desired file, or click it and then click [Open]. The selected scan results will display within the Stock Scanner window, just as if the program had produced the list from a current scan. As with any stock scan list, you can re-sort and re-filter through the stock scanner, or you can double-click any stock to display as a UA chart. Keep in mind that results of saved scans are not updated, so you may be looking at outdated information. Print Scan You can make a tabular printout of your Stock Scan, which will appear very much as you see it on your Page 114 User's Reference Manual Unfair Advantage screen. Click [Print] at the bottom of the scan screen to begin printing using your computer's default printer setup. Be careful what you ask for! Depending upon your printer type, this feature might print sixty lines or so per page. A full sorting of the full database could involve thousands of stocks and hundreds of pages. 5.12. Changing Stock Scanning Options If you change your Stock Scanning options after UA distributes your daily update, the changes will only be visible after your next data distribution. You can manually rebuild the stock scanning file or re-distribute your last daily update (without re-collecting the data) by clicking the Initiate menu and selecting "Manual Stock Scan Rebuild" or "Manual Database Distribute," respectively. Either of these will make your current Stock Scanning options effective immediately. User's Reference Manual Page 115 Unfair Advantage 6. UA Charts 6.1. Basic Charting 6.1.1. Charting Overview Charting is an important Unfair Advantage feature which lets you quickly see what is happening in the markets of interest to you. After your initial retrieval session, you can view the charts that are listed in the sample portfolio or your own custom portfolio, and you can view charts that you make on demand. You can also analyze the data files specified in your portfolio with compatible software of your choice, but only after the files have been created through UA. You must unlock your database by downloading and fully distributing a day of data before you can create any charts! See the Creating a Chart topic for instructions, or you may want to learn by example with our "Step-By-Step Charti Creation." This Basic Charting chapter covers everything from adjusting the date range in your chart, to using crosshairs to discover numerical values, to viewing table data, to adjusting screen size and windows, to switching on-screen charts. See that appropriate chapters for other charting features such as Chart Tools and Choosing/Changing Studies, Data Options that Affect Charting and the Right-Click Menu. Another way to view quantities of stocks is to use UA's Stock Scanner. UA's MultiMarket Analyzer (MMA) offers an alternate method for viewing and analyzing data. We recommend you try all three techniques to see which work best for you in different situations. A number of user-defined Data Options may affect your UA charts. We suggest you review these before you begin, or if unexpected results appear in your UA charts. See Navigating Through UA for additional program features. 6.1.2. Step-By-Step Chart Creation Although there are several ways to make a chart with Unfair Advantage, here we present step-by-step directions using one technique. This article originally appeared in the May, 2000 CSI Technical Journal, The Quick Route to UA Charting (A Navigational Guide) The newest version of Unfair Advantage® has a somewhat different look and feel from earlier versions. Many users love it, but some find the transition frustrating. I understand (often practice) the principle of learning new software through trial and error, and offer the following brief tutorial for those who are struggling along. I think it may provide some helpful insights to get you through the initial steps quickly and easily as you navigate through this more powerful version. First, let's recognize that UA offers a few ways to create charts for easy viewing, including the "Charting" icon on the toolbar and selecting a predefined market from a portfolio. As many customers have discovered, using the "Charting" icon is the simplest way to quickly throw a chart onto your screen, but it is not necessarily the best way to display multiple data series. This story will explain by example the process of Page 116 User's Reference Manual Unfair Advantage adding a group of commodity contracts to a portfolio, then displaying them as charts. Because of the increased complexity of a back-adjusted contract, our example will involve that particular computation. This example could just as easily have involved stocks, which may be added in the same way. We'll also explore some of the options available through UA that may or may not be appropriate for your individual situation. 1) To begin the process, click on the "Portfolio" menu; then click "Insert." The "Selecting Data Series" screen will display. Right-click the arrow beside the "Market Type" box at the top of the screen, and then select "Commodities." Other possible options are "Stocks" or "Miscellaneous." Next, click on the browse button (three dots) to the right of the "Markets" box. Factsheet information will appear in the center of the screen with a list of all commodities. If you had selected stocks or miscellaneous from the "Market Type" box, the corresponding factsheet would be substituted. As you'll see, the "Markets" selection box (at right) remains empty until you manually enter the markets to chart, or until you select them from the factsheet below. For this demonstration, we'll select from the factsheet. 2) At the left side of the commodity factsheet, under the heading, 'Se" (for Select), is a column of boxes. Click the box beside each of the markets that you would like to chart with the same parameters for delivery months or a particular computed contract. For example, if you want a back-adjusted series with a specific set of rolling parameters for one group of commodities (as in our example), they should be entered together. If you want just the three lead delivery months for a second group of commodities, they may be selected together as well, but in a separate selection process from the first set of markets. We suggest requesting (clicking on the boxes for) commodity #3, Cocoa, and commodity #10, Coffee for our example. You could select many more. It is unlikely that you will breach any restrictive portfolio limit. Note: This is where using the "Insert" feature on the Portfolio menu differs from using the "Chart" icon on the toolbar. Since charts are immediately created for each contract selected as a chart, the charting limit of 12 applies. When charts are added to your portfolio, you can specify the parameters for unlimited charts, and then quickly scroll through them individually, without running into the charting limit. 3) When all desired commodities have been selected, click [OK]. You'll note that the "Markets" box at the upper right of your screen now shows the commodities you selected (CC, KC for cocoa and coffee, in our example) and the factsheet list has been replaced with tabbed selection choices for identifying the desired methods of presentation. 4) Select your preferred choice of delivery month or computed contract by clicking on the appropriate tab. The choices are: Raw (normal contracts), IFG (Individual Futures Group), Nearest Futures, Back-adjusted, Cash, Option, Perpetual Contract® Data and Gann. For this example, we suggest you click the "BackAdjusted" tab. 5) Selecting Parameters for a Back-Adjusted Contract: A back-adjusted contract visits various commodity delivery months in reverse date sequence in an attempt to simulate continuous statistical market behavior far into the past. Therefore, many considerations come into play when building this type of computed series. Contracts are spliced together into a single series based upon a targeted relative date or trading volume and/or open interest as contracts reach a level of maturity over time. Derived from the individual contract input series, cumulative price adjustments are made that force the resulting series to appear in chart form as a single never-expiring contract. Obvious jumps or drops in price are avoided through this procedure. You'll need to understand the following UA terms to customize your back-adjusted series: Roll Trigger: This term identifies the basis upon which individual raw contracts will be concatenated over time. When viewing a commodity forward in time, the nearest contract to delivery may be continually User's Reference Manual Page 117 Unfair Advantage represented in the resulting back-adjusted series. The roll-trigger chosen is based upon either 1) a given date relative to raw contract expiration, or 2) the relative level of volume and/or open interest readings of the affected contracts. Note: If the chosen Roll Trigger involves the Date selection (ignoring the volume and/or open interest choices), then the exact date and month of expected rolling must be entered. If you select volume or open interest as the roll trigger, any additional roll dates you may enter will not apply. Strictly by days before expiration: We considered the first Roll-Trigger group of "Rolling by volume and/or open interest," and the second group "Rolling by Date." If you check "Strictly by days before expiration," then the historical series will roll the number of days specified (at right) before a then-current contract expires. This option will not affect the very last contract (the current contract nearest to the most recent date) in line because there is no easy way to know when the current contract will expire. The user must know when it is appropriate to exit the current contract being traded. Naturally, selecting a roll "Strictly by days before expiration" will negate any requirement to supply information on the Roll Timing question (below). Roll Timing: When Volume and/or Open Interest are used for the Roll Trigger, the Roll Timing entry must be selected It is necessary to factor in the release timing of volume and/or open interest reports that will influence the selection process of forward rolling. This entry is not relevant when the Roll Trigger involves a date. Representative Prices: Once a contract rollover occurs, a cumulative adjustment must be made to the prices of earlier successive contracts. The adjustment will absorb the price difference of back contracts vs. near contracts and apply the difference to all of the prices of the earlier price series. This will force the historical data into a smooth continuous series that will seamlessly blend with the prices of the current contract. Each time a new earlier contract is blended into the series, the delta effects will change as price jumps or drops are eliminated and accounted for across contract boundaries. As an example, suppose UA will splice together a June '99 and September '99 contract when the June contract expires. On the given June roll-forward date, the June contract may be priced at, say, 10 cents per pound less than the September contract on the same date. To force the resulting series to hold a smooth back-adjusted transition, all of the data prior to the rollforward date would be increased by 10 cents. In defining representative prices, you must select how the delta price is to be computed. The choices include taking the difference between 1) the close of the old contract and the close of the new contract for the same day, 2) the close of the old contract and the open of the new contract on the next day, 3) the open of the old contract and the open of the new contract on the same day, 4) the close of the old contract and the open of the new contract with the old contract gap preserved, or 5) the close of the old contract and the open of the new contract with the new contract gap preserved. Accumulation Method: You may choose to express the resulting series as a back-adjusted series, a forwardadjusted series or a proportionally adjusted series. The back-adjusted series preserves the current contract prices and adjusts all earlier series according the application of the roll trigger and the user's Representative Price choices. To prepare a forward-adjusted price series, the back-adjusted logic is engaged, but the cumulative delta effects are added back in, (after the fact), forcing the very first (earliest) contract to reflect actual values and leaving later contract series to be adjusted. This selection is sometimes used when backadjusted series result in unwanted negative prices early in the distant past. The proportionately adjusted series, also known as ratio adjusted series, are actually back-adjusted prices which are adjusted, not by a cumulative delta quantity, but by a multiplicative approach which preserves positive prices into the past in a relational perspective. Confirmation Signal: UA offers two distinct back-adjustment engines. The standard back adjuster (written in Fortran) views the market backward in time to achieve a back-adjusted result. The Alternate back adjuster (written in C++) does its work by viewing market statistics forward in time. The choice of back adjuster is set Page 118 User's Reference Manual Unfair Advantage through UA's Options menu (Data Options, Back Adjusting tab). The standard back-adjuster is used for most calculations unless "Use only the C++ Back Adjuster" is selected under Data Options. However, if you request confirmation on the second or later incidence, the C++ back adjuster will supersede. When the standard back adjuster is used, there is no need to require more than one day of confirmation of any roll trigger. This is because any oscillating effects that may be caused by erratic volume and open interest behavior have likely dissipated well before any doubts materialize about rolling into a weak contract. When using the C++ (alternate) back-adjuster with volume and/or open interest as the roll trigger, it is likely that more than one day of confirmation will be required to determine if changes in activity are unlikely to be temporary. If you are using volume and/or open interest as a means of managing roll timing with the C++ back adjuster, you have a choice of waiting for more conclusive confirmation. In this event, the confirmation signal requires several days. A maximum of four days is allowed. 6) At this point in our example, we have specified back-adjusted contracts for two commodities, which will be added to the portfolio. To complete the addition, check out the additional prompts on the screen to see which, if any apply to your desired application. Do you also want to detrend the data? If so, click the down arrow next to the "Detrend Method" box below and make your selection. Check the Date Range. The default presentation is to view all available history for a commodity in a computed contract. If you want to view a shorter time period (which will save on computational time), click the down arrow next to "as available" and select a start date. You can edit the value to any date you want. Look at the right-hand side of the screen. The "File Format" entries there are very important. If all you want to do is view UA charts, make sure NO export formats (CSI, CSIM, MS, ASCII) are checked. They will just waste time and space on your drive. BUT, if you want to also view the data with one or more other software programs, DO check all formats that apply. UA will automatically write and maintain data files for each export format file you check here. This makes it easy to analyze UA data with third-party programs. (When ASCII format is used, a comma separator with century is most commonly recommended.) 7) Once you have selected all the appropriate options for the commodities of choice, click [OK]. The UA screen displays with your current portfolio at left. Your new additions are at the top of the list. You can repeat this process with additional markets and contracts, or get right to viewing your charts. 8) To view the first chart, just double-click it from the portfolio list. To view the next one on the list, click the [>>>] (next) button at the bottom of the screen. When you scroll through your portfolio this way, only one chart will be active at a time and the charting limit will never be a problem. It is possible to have multiple charting windows open (double-click additional series to add), which you can manage through the Windows menu. Keep in mind that no more than 12 charts (or so) should ever be open at once. That is basically all there is to creating a list of contracts for review and displaying them as UA charts. The beauty of the portfolio system is that once you have defined the portfolio, you can view updated charts tomorrow without re-entering your selections. Keep in mind that anything in your portfolio can be easily deleted, and you can start with a fresh portfolio each day, if desired. This brief explanation is provided as background, to provide some insight into how UA operates and what is expected as input. Last month's CSI Technical Journal gave step-by-step instructions for quickly viewing thousands of stocks. You may benefit from a review of that article on our website at www.csidata.com. If you feel you need additional help with the program or if you notice minor presentation changes in the menuing, I recommend exploring the on-line manual for more information, or calling our technical support staff with your specific questions. User's Reference Manual Page 119 Unfair Advantage 6.1.3. Creating a Chart There are four basic methods for creating a chart with UA. They are: A) charting one or more items in your portfolio, B) charting through the "New Chart" icon C) charting a stock from the Stock Scanner listing and D) charting from the all-inclusive database as defined by the inventory listed in CSI's factsheets. For commodity data, charting directly from your portfolio is generally preferred. The portfolio allows you to do the work of defining the series once, and then stores the information for all future charting sessions. If you want to chart a commodity that is not in your portfolio, we recommend that you add it to your portfolio, which will create the chart and then save the settings for next time. You are not required to do so, however. A) Charting a portfolio item To chart a single item from your portfolio, first click the desired commodity or stock entry on the list. Then use one of the following three methods for charting. a) Double-click the entry. A chart displays. b) Right-click your mouse to bring up the following menu, where you'll click "Chart." A chart displays. c) After clicking the market you want to chart, click the Portfolio menu to bring up a similar list of choices, from which you will choose "Chart." A chart displays. Charting Multiple Portfolio Items You may chart multiple items from your portfolio list simultaneously IF they are listed consecutively, IF you want to chart everything in the portfolio, or IF you are recalling charts that have already been displayed in this session and held in memory. All of these criteria are subject to the charting limit (usually 12) set in Memory Cache Size (on General tab of Data Options). To chart consecutive items in your portfolio list, click on the first item to be charted. Then press and hold down the <shift> key while clicking on the last item to be charted. All items between your first and last selections, inclusive, will be selected. Use either of the right-click or Portfolio menu methods described above to chart the files. Your first chart will display. Use the Windows menu to select your desired Page 120 User's Reference Manual Unfair Advantage presentation of multiple charts. To chart all items in a portfolio, click any single item, then right-click your mouse and click "Select All" from the menu. Right-click again and then click "Chart." If your portfolio holds more items than the limit for Memory Cache Size (set in Data Options), a warning will display and the limit will be imposed. B) Charting through the "New Chart" icon or menu item UA lets you chart anything from the compressed database that is available under your CSI subscription category, whether or not it is listed in your portfolio. Once you get started, making a chart from scratch uses exactly the same process as adding an item to your portfolio. To begin click the "New Chart, Full" icon on the UA toolbar (second from left) or click the Portfolio menu, followed by "New": Please see "Overview of Inserting a Market" in the Portfolio chapter and follow the subsequent instructions for selecting the market and data series to be displayed. Your chart will display with a "Save to Portfolio" button at the bottom: We recommend you click this button if you'll want to display the series again. Additional prompts regarding the start date and export file formats will display. Click OK to take the default start date, or change if desired. It is not necessary to use any export formats for UA charting. C) Charting a Stock from the Stock Scanner listing After running UA's Stock Scanner (through the Initiate Menu), a listing of sorted and/or filtered stocks displays. Double-click any stock on the list to display it as a UA chart. D) Charting from the factsheets Click the Factsheet icon to display a list of all commodities. If stocks are desired, select Stock and Mutual Funds from the "Market Type" selection box. For Commitment of Traders data or other series not listed above, select "Miscellaneous." From the list of commodities, stocks or miscellaneous series, DOUBLE-CLICK the market you wish to chart. Your chart files will be built in the background, and will be visible when you dismiss the factsheet screen. 6.1.4. Adjusting Date Range on Screen UA offers two options for changing the date range on a chart once it has been created. Click your choice from the toolbar above your chart, or use the Chart Tools Menu as described below: User's Reference Manual Page 121 Unfair Advantage Expand Date Range in Chart - This feature increases the spacing of the price bars, allowing you to see more details on your chart. Each time you click the button, the chart itself expands, but the time period visible on the screen gets smaller. Use the scroll bar at the bottom to see the rest of the chart. This feature is the same as the "Zoom In" selection on the Chart Tools Menu. Contract Date Range in Chart - This reverses the above process, contracting the data into a smaller, more compact form. Very contracted charts may have considerable overlap, which tends to obscure pricing details and studies. This feature is the same as the "Zoom Out" selection on the Chart Tools Menu. Repeat the Zoom In/Zoom out or Expand/Compress process as needed to achieve the desired charting range. Keep in mind that you can also adjust the date range of a chart during the creation process. 6.1.5. Chart Crosshairs with Readout UA offers a couple of ways to view numeric data for the market in your chart. You can either View Table Data or use the Crosshair with readout box to select numerical data for viewing. Click the crosshair button from the toolbar above your chart or select "Crosshair" from UA's Chart Tools menu: Use your mouse to position the pointer on any date displayed on the chart. A data window showing complete numerical market data for the corresponding day also displays. Click the button again to remove the crosshair and data window. The Crosshairs Readout: Page 122 User's Reference Manual Unfair Advantage The data in this window corresponds to the placement of the cursor. 6.1.6. Viewing Table Data At the bottom of your UA chart is a pair of tabs offering "Chart" and "Table." The default presentation is of a chart, but you can easily view a numerical table of the data on your screen by clicking the "Table" tab. The table view looks something like this: The caret figure seen in many prices indicates the divider between whole and fractional values. For example, the first Corn prices on this screen show an open cash price of 199^4. Since corn has a conversion factor of - User's Reference Manual Page 123 Unfair Advantage 1 it is represented in eights. This value represents 199 4/8. Use the scroll arrows to view the entire file, as desired. You can switch back to the chart by clicking the [Chart] tab. This UA table is used for manually editing prices, if desired. See Editing the Database for instructions. 6.1.7. Adjusting Screen Size & Charting Windows The entire UA screen is expandable. You may add to or delete from the left and right screen areas by moving the common partition. To view more elements of the portfolio, click on the divider between the portfolio window and the charting window with your mouse. Hold the mouse button down while dragging the divider to the desired position. Release the mouse button to drop the divider in place: You may expand the chart area by placing your mouse on the divider and dragging the boundary in to the left: Page 124 User's Reference Manual Unfair Advantage Charting Windows The default presentation of a UA chart is to have one chart fill the charting window. When multiple charts have been selected for charting, or after a second chart has been displayed, you can display multiple charts simultaneously. You may select the way multiple charts are arranged on your screen by clicking on your choice from the pulldown WINDOW menu as shown: User's Reference Manual Page 125 Unfair Advantage This menu offers your choices of presentation, plus a list of all charts that are currently available for charting. These are charts that you have just view, as well as charts that have been created and have not yet been viewed. The maximum number of charts included here is determined by the Memory Cache Size setting (on the General Tab of Data Options). This number typically does not exceed 12. Below is an example of tiled charts. UA will attempt to display all available charts on the same screen, so this presentation works best with four or fewer charts available. Below is an example of cascading charts. In the cascaded form, the last contract created is on top of the pile of charts. Page 126 User's Reference Manual Unfair Advantage Use these standard Windows buttons found at the upper right of each chart to minimize (left button), resize to full or partial screen (middle button) and close (right button). Click on the border of any chart to bring it to the front of the pile for viewing. When a chart is minimized, UA creates a clickable button (see below) at the bottom of the screen identifying the data series. Double-click to restore the chart, or click once for various charting options. 6.1.8. Switching Charts Once a UA chart is displayed on your screen, you can view a different chart in any of the following ways: A) Scrolling through your portfolio At the bottom of any chart that was created from your portfolio is a set of portfolio scrolling arrows: Click the arrow at right to advance to the next contract or stock on your portfolio list or (once you have displayed one or more charts) click the left arrow to scroll backward through your charts. Note that when charts are selected this way, they do not count toward your charting limit (set on the General tab of Data Options). Each new chart replaces the previous one on your screen, but recently displayed charts can be quickly redrawn by scrolling back to them. The number of charts that can be quickly recreated is also set on the General tab of Data Options. (See cached in-memory series.) B) Selecting another series from your portfolio You are not required to view every chart in your portfolio during any given charting session. To select an individual series for charting, simply double-click it on the portfolio list. Alternately, you can click on it and either right-click your mouse or click the Portfolio menu. This brings up a menu of options from which you should click "Chart." The new chart displays and is added to any previous charts that have not been closed. Charting series in this way will build a list of charts for viewing either individually or in groups as controlled through the "Windows" menu. These charts are subject to the charting limit and cached in-memory settings on the General tab of Data Options. Once the charting limit is reached, you must close one or more charts before more charts can be created. Click the at the upper right corner of the chart to close it. C) Selecting an open chart User's Reference Manual Page 127 Unfair Advantage You might have more charts available for viewing than are displayed on your screen. This would be the case if you chose "Select All" before directing UA to chart your data. It could also be the case if you add charts as described in method b) above. Click the "Windows" menu, where you can choose an individual contract or stock to chart, or select from the display options including tiling or cascading your charts. D) Creating a new chart from outside your portfolio Just as you had the option of creating your first chart from outside your portfolio, you may add other charts in the same way. Making a chart from scratch uses exactly the same process as adding an item to your portfolio. To begin click the "New Chart, Full" icon on the UA toolbar (second from left): See the "Overview of Inserting a Market" in the Portfolio chapter and follow the subsequent instructions for selecting the market and data series to be displayed. 6.2. Chart Tools 6.2.1. Chart Tools Overview At any time when a UA chart is displayed on your screen, you may add shapes, lines and notations through the Chart Tools menu. Click the Chart Tools icon on the toolbar to display the following menu: Choose from: • • • • Trend Line Annotation Rectangle Ellipse Click your right mouse button from any chart for an additional list of chart manipulations. Account Status for details on what is available to you. For full use of The MultiMarket Analyzer, The Trading System Performance Evaluator and The Trader's Accountant, users are required to pay the full UA license fee. Portfolio manipulation begins with the Portfolio Menu, which can be accessed from the main menu at the top Page 128 User's Reference Manual Unfair Advantage of your screen, or by right-clicking any item in your portfolio. See Navigating Through UA for additional program features. 6.2.2. Trend Line Add one or more trend lines to any UA chart by clicking the Chart Tools icon and clicking "Trend Line." Although it may seem as if nothing has changed, your next mouse click will define the starting point of a trend line on your chart. Click on whatever point is to be the starting point, then, with the mouse button still held down, move your mouse to draw the line to its terminus. Release the mouse button on the ending point to finish off your trend line. Repeat the entire process to draw additional trend lines. Each will be drawn in a different color. To erase trend lines, right-click your mouse, then click "Clear Annotations." 6.2.3. Annotation Write notes on your UA chart by clicking the Chart Tools icon and clicking "Annotation." Your next mouse click will determine the placement of a text box on your chart. Click on whatever point is to be the starting point, then, with the mouse button still held down, move your mouse to draw the line to its terminus. Release the mouse button on the ending point to finish off your trend line. Repeat the entire process to draw additional trend lines. Each will be drawn in a different color. To erase trend lines, right-click your mouse, then click "Clear Annotations." 6.2.4. Rectangle You can add rectangles to any UA chart to add visibility to chart formations. Start by clicking the Chart Tools icon and clicking "Rectangle." Although it may seem as if nothing has changed, your next mouse click will define the starting point of a rectangle on your chart. Click on whatever point is to be the starting point, then, with the mouse button still held down, move your mouse to expand the rectangle to the desired size and shape. Release the mouse button to finish off the rectangle. Repeat the entire process to draw additional rectangles, as desired. Each will be drawn in a different color. To erase all rectangles, right-click your mouse, then click "Clear Annotations." 6.2.5. Ellipse Like the rectangle, the ellipse is a geometric shape used by some chartists to evaluate chart formations. You can add ellipses to your UA chart by clicking the Chart Tools icon and clicking "Ellipse." Your next mouse User's Reference Manual Page 129 Unfair Advantage click will define the starting point of an ellipse on your chart. Click on whatever point is to be the starting point, then, with the mouse button still held down, move your mouse to expand the ellipse to the desired size and shape. Release the mouse button to finish off the ellipse. Repeat the entire process to draw additional ellipse, as desired. Each will be drawn in a different color. To erase all ellipses, right-click your mouse, then click "Clear Annotations." 6.3. Choosing/Changing Studies 6.3.1. Chart Studies Overview UA allows you to select up to two studies (indicators) to display on your current chart. The studies you add to one chart will automatically be displayed on each subsequent chart, until your choice is changed again through this feature. To add a study to an existing chart, click the "Change Indicators on Chart" icon on the tool bar. This brings up the "Choosing Studies" window, shown below: Click the down arrow symbol to the right of the upper selection box to see the choice of indicators for "Study 1." The same choices, shown below, will be available for "Study 2" as well. Page 130 User's Reference Manual Unfair Advantage The current list of indicators includes: • • • • • • • None Briese's COT Index (Commitment of Traders) Seasonal Index Moving Average RSI Stochastic Basis Click you choice from the drop-down menu to display a new set of options, including (at right): To superimpose the study on the price chart, click Upper Chart. When studies are displayed this way, they use the scale on the left and the price chart uses the scale on the right. To use the Lower Chart, the area normally used for Volume and Open Interest, click Lower chart. Both Study 1 and Study 2 may be displayed on the same chart. The remaining parameters vary depending on the study, as described under the individual indicators in this chapter. A brief description of available studies is included. This manual is not intended as a trading guide, so we make no attempt to fully explain each type of analysis. 6.3.2. Briese's Commitment of Traders Many successful traders rely on Commitment of Traders data to keep tabs on the market interests of larger traders and hedgers, whose activities often influence future price performance. We are very pleased to offer a Commitment of Traders Data feed on all of the CFTC-regulated commodities (over 50 markets) as part of the CSI database. The CFTC's Commitment of Traders data are compiled and released by the U.S. government once every two weeks. Each bi-weekly report offers two sets of data points spaced one week apart. The most recent set of data points represents the prior week ending on the prior day, which would typically be a Tuesday, and the earlier half of the set represents a late report of the immediately preceding week ending on the preceding Tuesday. By reporting every two weeks on trader commitments, the CFTC reduces their costs, at the expense of a current report for the earlier half of the reported two weeks of data. The report details the gross long and short open interest contract level for large speculators, commercial hedgers and small traders for each given market. The C.O.T. data CSI provides through Unfair Advantage are compiled from Steve Briese's website which reports not only the above raw CFTC statistics, but alos a calculated index which ranges from 0 to 100 based upon a scheme of weighting that accounts for the small, large and commercial classifications. A high reading of the index weighs heavily in favor of the long side market interests, and a low index reading favors the sell side interests. The value is high when commercial interests are large against small trader interests, and the value is low when commercial interests are short against small trader interests. Our data set includes Steve Briese's index computations, as well as the CFTC's raw released information User's Reference Manual Page 131 Unfair Advantage with, in some cases, adjustments for obvious errors in the CFTC's report. These reports are available every other Friday, with any corrections for the earlier week and the new government-computed statistics. UA users should consult the C.O.T. data and Briese's index to help assess a given market's probable future direction, and avoid any attempt to go against the large speculator and commercial interests. Commitment of Traders data are part of CSI's "Miscellaneous" database, where they can be analyzed and viewed as individual time series. These data can also be displayed as a study on any UA chart of the corresponding commodity's price series. To add these data to your portfolio or make a chart of COT data as an independent series, begin as you would for creating any series, as explained in the "Creating a Chart" or "Overview of Inserting a Market" topics. Briefly, you'll just select "Miscellaneous" for Market Type and click the [...] (browse) button to display the full list of miscellaneous markets. You might want to sort by "Exchange" as shown below. Note that all miscellaneous series are identified with 2000 series CSI numbers. Scroll to the Briese index series, which currently cover the range of 2400 to 2468 or the CFTC data, which occupy the range 2500 to 2568. Each market's symbol is clearly identified within the listed name. Select all the C.O.T. series you would like to include in your portfolio or chart (charting has a limit of 10 or 12), and click [OK]. The subsequent screen shows that no additional input is needed for this series (it is automatically "cash"), but you may select additional file formats and periodicity (weekly is preferred, but not essential) as desired. Click [OK] when all your requirements have been selected. If you used UA's "create a chart feature" to select your C.O.T. series, the chart(s) will display immediately. If you used the "Portfolio/Insert" feature, your selection(s) will be added to your portfolio list, where you may double-click any new entry to display. COT Chart Manipulation & Interpretation Page 132 User's Reference Manual Unfair Advantage To add COT data to a chart of any continuous price series (for which COT is available) simply make a chart of the underlying commodity, click the "Change Indicator on Chart" button on the toolbar, and select "Briese's COT Index." You may opt to display the data superimposed in the price window or the lower volume and open interest chart window. While viewing a chart of C.O.T. data, numerical values for the COT Index may be viewed by clicking the crosshairs button on the toolbar. Click the "Table" tab at the bottom of the chart to view exclusively numerical data. Below is an example of a continuous price series with COT data added as a study, using the "Crosshair" feature to display numerical values. • The dark blue line represents commercial hedger Index (value 18). This is the most important indicator. • The aqua (upper) line represents large Speculators Index (value 82). This is the second most valuable indicator. User's Reference Manual Page 133 Unfair Advantage • The gray line represents small Trader Index (value 44). This is the least significant indicator. File Format for Briese's % COT Index When storing Briese's COT Indices, the Open is either 1 or 2 depending on which week of the biweekly schedule the data is for. The High is the Large Speculator Index; the Low is the Commercial Hedger Index; the Close is the Small Trader Index, and all other fields are zero. To clarify the Open, if it is 1, then the data are up to one week out of date. If the value is 2, then the data are up to two weeks old when reported. The date shown will be the "report date" (not the date it is released) for the series. UA customers receive the data on the release date which, barring holidays and flawed data, is a couple of days after the last "report date" designated with a "1." The calculation for Briese's Index is proprietary. Unfair Advantage Example: Soybeans COT Index file # 2412 19991026 Week 2 large speculator=82, Commercial=18,Small Trader=44 File Format for CFTC COT Data When storing the raw CFTC C.O.T. data, the Open and High contain the total Large Speculator's long and short positions, respectively; the Low and Close contain the total Commercial Hedger long and short positions, respectively; and, the Volume and Open Interest fields contain the total Small Trader long and Page 134 User's Reference Manual Unfair Advantage short positions, respectively. COT Data file used for calculating the above COT Index: For more information on C.O.T. data and their use, you might want to subscribe to Steve Briese's Bullish Review (phone 888-423-4950). Every two weeks, Steve reports on dozens of government-regulated commodity markets. He supplies charts of market behavior, inclusive of his index, and commentary on future price performance prospects derived from the C.O.T. data. 6.3.3. Seasonal Index Seasonal Indices are a compilation of daily seasonal values for individual commodities. A seasonal index rating is calculated for each of the average 251 trading days per year using the vast data resources that are provided with Unfair Advantage. Some of the resulting indices are virtually mirror images of the recent past, while others reflect only subtle seasonal effects. Seasonal indices offer a way to combine seasonal information on commodity data with daily chart analysis to promote a better understanding of price movement. The seasonal index represents a + or - 3 sigma confidence interval over time. It reflects and reports upon the entire history of the series given as input in a cumulative manner. In the non-amplified form, the index is painted a day at a time as more input contributes to the seasonal pattern. The index may become more and more dampened as more information is supplied. There is no attempt to use the final year in the seasonal waveform to explain the past. In other words, the seasonal wave for of, say, a 20 year series can be used as an input to forecast future events or simulate past events without bias where any then-current reading does User's Reference Manual Page 135 Unfair Advantage not and cannot affect earlier seasonal patterns. Improved results may appear when longer term computed input is prepared using the "detrend" option. Here is an example of a Seasonal Index chart drawn from the detrended live cattle series (Upper Chart). Don't attempt a seasonal index calculation unless your input time series holds more than one full year of data. When years of substantial history are supplied, the cumulative general waveform tends to prevail all of the time. The resulting waveform becomes more and more characteristic of the commodity as more data is processed. We recommend this study be performed on at least ten years of daily data and then displayed as a weekly or monthly chart. If a computed contract is used as input, it must not contain ANY negative values. The suggested usage of seasonal indices is to look for coincident peaks and troughs between the market and the index. When peaks coincide or when troughs coincide, the risk of loss on a trading position should be at its minimum. For some traders this may translate into an opportunity to take a heavier position. It is not recommended that seasonal indices be used as the sole basis for trading. They should only be used in conjunction with other confirming market factors. Amplify: The only user-defined parameter in the seasonal index computation is amplification. This makes the seasonal waveform easier to conceptualize and amplifies seasonal effects. Unfortunately, by selecting amplification, the significance of the seasonal effects will be distorted because the measured significance of the sigma readings will be lost. 6.3.4. Moving Average A moving average is a mathematical attempt to smooth fluctuations in price. It is the mean average of a price field (in this case, the close) over a given period. This is the sum of the prices over the period divided by the number of samples in the study. Each day the average is re-calculated using the same number of observations by adding one new reading and deleting the first reading for the period. Hence, the average is moving. This study is used to compare current values with one or more smoothed values. Page 136 User's Reference Manual Unfair Advantage Ours is a moving average crossover study, which displays averages based on three intervals of your choice. This example shows a study with 5-, 10- and 15-day moving averages. The user-defined parameters are the three moving average intervals, defined as the 1st Period, 2nd Period and 3rd Period. If fewer than three averages are desired, you must repeat a period value in the unused text box(es). Interpretation: A rising moving average is associated with a rising market and a falling moving average is associated with a falling market. Since moving averages lag behind the market, some trend-followers buy when price rises above the moving average and sell when price falls below the moving average. Other traders use multiple moving averages to generate trading signals from dual or triple-average crossovers. Buy signals occur when the shorter moving average crosses over the longer moving average. Sell signals require the reverse. Moving average crossover dynamics explain hindsight momentum changes in the market studied. 6.3.5. RSI The Relative Strength Index, developed by J. Welles Wilder, determines market movement measured as the rate of change. It attempts to correct perceived shortcomings of the standard Momentum study. The only user parameter for this study is the Period 1 Length. The default response of 14 is most commonly used. Here is an example: User's Reference Manual Page 137 Unfair Advantage Since, in our example, the RSI is superimposed on the bar chart, its scale is on the left. The price scale is always on the right. 6.3.6. Stochastic The stochastic method of market analysis is an attempt to identify turning points. It is based on the premise that as prices increase, daily closes move closer to the upper end of the price range for the given time period. As prices fall, closes move closer to the bottom of the price range. Two lines are used in the stochastic process. One, called the K line, which is usually presented as a solid line, indicates, on a percentage basis, the relationship of recent closes to the price range. The second line, called %D and usually presented as a dashed line, represents a three-day moving average of the K line. The %D line is similar to the K line, but is considered to be a dampened indicator. Think of the K line as a measurement of price velocity and the D line as a measurement of price acceleration. The user-defined parameters are: •K - Enter the sample period. If, for example, you are using a daily chart, the default response of 11 indicates that the study looks for the relationship of closes to the range in eleven-day periods. If the same value were used on a weekly chart, the study period would be 11 weeks. •%D - Enter the period to use for the moving average which dampens the K results. We use a simple stochastic, as opposed to weighted or exponential. The formula we apply produces a "fast" stochastic, as further dampening is not permitted. An example follows: Page 138 User's Reference Manual Unfair Advantage Interpretation: In general, trading opportunities are based on divergence between price and the %D line. Actual signals are indicated when the divergence between price and the %D is followed by the crossing of the K and %D lines. A buy signal is generated when the dashed %D line crosses below the solid K line. A sell signal is generated when the %D line crosses above the K line. Traditional thought holds that buy signals are considered most significant when they occur at index levels between 5 and 15. Sell signals are most significant when they occur at index levels between 85 and 90. Crossings are considered more significant if both lines are moving in the same direction. Stochastics have a tendency to give sell signals while a market is still rising and buy signals while a market is still falling. For this reason, it has been suggested by several analysts that stochastic signals be used only in the direction of the current trend. This indicator was developed by Dr. George C. Lane. He discusses this indicator in the June, 1984 issue of Technical Analysis of Stocks and Commodities. It is also included in many general books on technical analysis. 6.3.7. Basis The Basis is the difference between the cash market and the futures market price for a given commodity. The cash market is not necessarily related to the futures exchange, although it can be. In some cases, the cash price for a commodity is set by a stockyard, an over-the-counter market or even by unrelated grain elevators in an area where the commodity is produced. CSI quotes cash prices for most, but not all commodities. If a cash price is available, the cash premium can be displayed when Basis is selected from the Study menu. Lag day cash prices, which are one day delayed, are provided for some commodities. Check the footnotes of the fact sheets for information on non-standard cash price data. User's Reference Manual Page 139 Unfair Advantage 6.4. Data Options that Affect Charting 6.4.1. Charting Options Overview The "Options" menu offers three categories of options: Data Options, Communications Options and Printer Options The Data Options Screens offer several functions that affect charting, including: • • • • • Memory Cache Size Making Close in High/Low Range Force Tick Integrity Display as Decimal Show Mutual Fund Loading See Printer Options for information on selecting a printer and chart orientation. See Navigating Through UA for additional program features. 6.4.2. Memory Cache Size The Data Options choice on the Options menu offers several features that directly affect charting with UA, including some listed on the General tab as shown: Near the top of this screen are two options that apply to UA charting capabilities. Page 140 User's Reference Manual Unfair Advantage The "Limit to ___ Charts" prompt sets the number of charts UA will create simultaneously from your portfolio list. Although generally only one chart is displayed at any time, more can be viewed simultaneously through options on the Window Menu. Even when charts are displayed individually, having them pre-created lets you quickly flip through them without having to wait for chart creation. Based on the above arguments for a large limit, one might arbitrarily set the number very high to avoid hitting the threshold. That would be a mistake! The recommended (and default) entry is 12. Because Windows resources are scarce and charting places a heavy burden on these resources, limiting the number of charts reduces your chances of experiencing performance degradation and program failure. If you feel your computer can handle a higher number, you might experiment with higher values. If your computer becomes sluggish or has system failures during charting, reduce this value. You'll see the charting maximum at work if you select all items in your portfolio, and then click "Chart." The number of charts created will be limited to the number set here, and a warning screen will say so. However, if you always scroll through your charts one at a time (without pre-selecting multiple contracts), you'll never notice this limit in effect. The "Limit to ___ cached in-memory series" determines how many recently viewed charts will be available for immediate re-call. Like the chart limit, this feature is designed to save you from system degradation caused by charts using excessive memory. We recommend using the default value of 12. This may be increased if your computer can handle more charts without any problems. In some cases, a lower number may improve system operation. Neither of the limits discusses here affect the creation of data files for analysis with other charting programs. Click OK to save all your changes. 6.4.3. Making Close in High/Low Range This feature controls the handling of the high, low and close values in cases where the settlement price lies outside the day's trading range. The circumstances under which this might occur are discussed thoroughly in "Data Presentation" in the Getting Started chapter. This option is controlled through the "Rounding/Ranging" tab of Data Options (from the Options menu), as shown below: User's Reference Manual Page 141 Unfair Advantage We'll review your choices here: • As published: This option provides files and charts with the actual open, high, low and settlement, even when the settlement is outside the trading range. When the settlement committee decides, after the close, that the settlement should be at a level where no trading occurred, charts can show a no-trading gap between the actual high/low bar and outlier settlement price. Appropriately programmed analysis software can make maximum use of available information through this choice. Please note that some CSI-compatible analysis software CANNOT process closes outside the trading range. If you experience unexpected results with another analysis product using "As published" settlements, consider changing to Modify High/Low. • Modify High/Low (the default, for a typical open-high-low-close bar): This option makes the close price (settlement) fall within the high/low range by adjusting the range. It produces files and charts with possible adjustments to highs and lows when the settlement is outside the trading range. A traditional open, high, low, close bar chart results. By taking this option, you may produce an artificial trading range, which includes an area where no trading occurred. Some analysis programs require this data presentation. • Modify Close: This option makes the close price (settlement) fall within the high/low range by changing out-of-range settlements. It produces files and charts where the closes (settlements) may be modified if the settlement price lies outside the daily trading range. In the event that the settlement lies outside of the high-low range, the settlement may be adjusted to match the high or low which is closest to its value. This technique ignores the settlement price, but preserves an accurate view of the market's trading range. Settlement accounting users would not obtain an accurate view of a portfolio's value using this option. Click your choice, then OK. As noted above, this option affects data files that are exported to third-party software as well as charting and analysis within UA. Page 142 User's Reference Manual Unfair Advantage Click OK to save all your changes. 6.4.4. Force Tick Integrity Although commodity contracts trade in specified tick increments, it is possible that the data provided by CSI or adjusted by UA may be quoted in different increments. This can occur as the result of historical database adjustments or due to the averaging that occurs when markets are quoted with a split open. This option is controlled through the "Rounding/Ranging" tab of Data Options (from the Options menu), as shown below. Changes made here will affect export format files as well as files charted with UA. • Round values to nearest tick: This option forces the calculated values of back-adjusted price reports as well as standard contract data to conform to exchange sanctioned minimum tick values. We recommend this option be used when output values are in decimal form. Where possible, CSI reports opening futures prices as the midpoint of the opening range. Click your choice, then OK. As noted above, this option affects data files that are exported to third-party software as well as charting and analysis within UA. 6.4.5. Display as Decimal As every trader knows, stock and commodity prices may be quoted in decimals, eights, sixteenths, thirtyseconds or some other increment as determined by the exchanges. UA allows you to display all prices in decimal form for easy comparison and to avoid unwieldy integers. User's Reference Manual Page 143 Unfair Advantage This option is controlled through a prompt at the bottom of the "Displaying Data" tab of Data Options (from the Options menu), as shown below. Changes made here will affect export format files as well as files plotted with UA. • Check the "Display as Decimal" box (click it) to have all charts, tables and export format files use decimal values. As noted on the UA screen, "Rounding to Nearest Tick" on the Rounding/Ranging tab should be used with this selection. See Force Tick Integrity for details. 6.4.6. Show Mutual Fund Loading This feature applies to mutual funds only, and applies only to those funds that are "loaded." This feature does not apply to stocks or to no load mutual funds. This option is controlled through the "Rounding/Ranging" tab of Data Options (from the Options menu), as shown below: Page 144 User's Reference Manual Unfair Advantage • Show Loading: Loading is the extra cost some mutual fund companies pass on to consumers at the time of purchase or sale. UA gives you the option of including the load or not. If desired, click "Show Loading" from the above selection screen. Click OK to save your changes. As noted above, this option affects data files that are exported to third-party software as well as charting and analysis within UA. 6.5. Printer Options 6.5.1. Customizing Printer Options By default, UA will print charts and tables using the printer specified in Windows. To change this selection within UA or change other printing specifications, pull down the Options menu and click "Printer Options." The "Printer Options" selection gives a choice of using the non-default printer, paper size, paper feed and User's Reference Manual Page 145 Unfair Advantage orientation as shown: This is a standard Windows print dialog. Make your selections and click OK. Your choices here will be used in printing UA charts through the print button on the UA toolbar, or when "print" is selected from the Portfolio or Right-Click menus. The orientation is ignored when printing chart tables. 6.6. Right-Click Menu 6.6.1. Right-Click Overview Whenever a UA chart is on your screen, clicking your right (not left) mouse button brings up a menu of additional chart manipulations as shown: Page 146 User's Reference Manual Unfair Advantage Click on your choice define how UA will: Display Volume Display Open Interest Set Bar Frequency Draw a Grid Draw Over Y Scale Display Bars Copy Image to Clipboard Clear Annotations 6.6.2. Display Volume With a UA chart on the screen, if you right-click your mouse button and click "Volume," you can determine which set of volume figures will display for futures contracts and options. Your choices are: Total - Total volume is the volume for all delivery months of the same commodity. For example, if six futures contracts (delivery months) were trading simultaneously for a given market (e.g. January, March, May, July September and November contracts), the total volume would reflect the combine volume for all six contracts, even when the price series in your chart reflects trading for a single delivery month. Individual - Individual volume is the volume for the one contract month (e.g. June) whose price series is displayed on your chart. Net - The "net" option for volume displays the net change in volume from one day, week or month to the next, depending upon reporting frequency, without regard for the actual volume figures. Note: UA can display none, one, two or all three of these volume presentations. Click your choice(s). Selected entries will be checked. 6.6.3. Display Open Interest Right-click your mouse button and click "Open Interest" from a UA chart to determine which set of Open Interest figures will display for futures contracts and options. Your choices are: Total - Total open interest is the open interest for all delivery months of the same commodity, just as explained for Volume. Individual - Individual open interest is the open interest for the one contract month (e.g. June) whose price User's Reference Manual Page 147 Unfair Advantage series is displayed on your chart. Note: UA can display none, one or both of these open interest presentations. Click your choice(s). Selected entries will be checked. 6.6.4. Set Bar Frequency You can change the reporting frequency of your current UA chart by right-clicking your mouse and selecting "Bar Frequency." This is the same as "Periodicity" in other UA menus. Select your choice of price bar presentation from: • Daily (Daily reporting) • Weekly (Monday's open, high and low for week, Friday's close) • Monthly (First day's open, high and low for month, last day's close) 6.6.5. Draw a Grid Once you have displayed a chart with UA, you can use a grid to add horizontal lines to your chart. Many people feel these improve the visibility of price movement. Right-click your mouse and click "Grid" to bring up the following options: • • • • 6.6.6. None - Normal chart with no grid lines Points - Dotted horizontal lines Lines - Solid horizontal lines Regions - Shaded horizontal regions Draw Over Y Scale For maximum graphic output, you can draw price bars over the scale at the right of the screen (the Y scale). If you wish to do so, first create a UA chart, then right-click your mouse. Click "Draw over Y scale" to activate. This feature toggles on and off, so repeat the procedure to return to normal presentation. 6.6.7. Display Bars UA allows you to change the presentation of price bars with a few simple clicks of your mouse. From any UA chart, right-click your mouse and move to "Display Bars As" to display the following choices: • Close Only - one dot per reporting interval • High Low Close - standard bar chart without opens • Open High Low Close - most detailed bar chart • Candlestick - charts present price data in a different form from a standard bar chart. To produce a candlestick chart, we plot daily high and low prices as a vertical bar. Open and closing prices are plotted as dashes crossing the high/low bar. These dashes are connected by vertical lines which create a box. The Page 148 User's Reference Manual Unfair Advantage resulting formation resembles a candlestick that burns from both ends. If the closing price is higher than the open price, the box is empty. If the closing price is lower than the open price, the box is shaded (solid). Traders have developed colorful terms to describe candlestick chart formations, including spinning tops, hanging man, dark cloud cover, etc. These formations, alone and in combination with others, identify market posture as bullish or bearish and give reversal signals. 6.6.8. Copy Image to Clipboard Unfair Advantage lets you make a clipboard image of the active chart, which you may then paste into a document or save as a graphic image. To copy a chart to your clipboard, click the right mouse button, then click "Copy Image to Clipboard." The image will be stored on your clipboard only until it is overwritten by the next image or text you place on the clipboard, or until you shut down your computer, whichever comes first. To use place your chart into a document or graphics program, simply click the "paste" button within your application program or hold down your keyboards [Ctrl] key and type the letter V. Either of these techniques will past the chart into your current application. 6.6.9. Clear Annotations After you add text or charting tools such as trend lines, ellipses, etc. to your chart, you can easily remove them by right-clicking your mouse and clicking "Clear Annotations." User's Reference Manual Page 149 Unfair Advantage 7. MultiMarket Analyzer (MMA) 7.1. MMA Limitations for Trial Users MultiMarket Analyzer is provided as a courtesy to UA subscribers who have paid the full Unfair Advantage license fee. All others may use MMA a maximum of ten times on a trial basis. If you have not paid the full UA license fee, you will be limited to 10 uses of MMA. Don't waste them! See Launching MMA to get started. If you are a trial user of UA or if you have not paid the full UA license fee, your MMA will become nonfunctional after ten uses. You may restore full MMA capabilities by upgrading to a regular UA subscription. Contact CSI marketing for details at (561) 392-8663 or (800) 274-4727. We reserve the right to change this policy at any time. 7.2. Launching MMA The MultiMarket Analyzer is launched in either of two ways: 1) When Unfair Advantage is already running (perhaps after updating the database), click the Initiate menu, then click "Multi-Market Analyzer." 2) When UA is not already running, from your Windows Start menu, go to Programs, then CSI Unfair Advantage, then click MultiMarket Analyzer as shown: MMA includes a complete submanual, which starts with "MMA Contents." 7.3. MMA Contents Introduction - Introduction to the Multi-Market Analyzer. Page 150 User's Reference Manual Unfair Advantage Choose Markets - Selecting the markets to analyze Choose Series - Selecting the series to analyze Choose Lags - Additional analysis options View Correlation Coefficient Table - Relationships between the markets Factor Analysis - Eliminate redundant factors Current Inter-Market Situation - Potential trades Historical Validation - Visualizing the results Developing A Trading Strategy - Using the indicators Glossary - Definitions of terms References - Where to learn more Reformatted From Multi-Market Analyzer On Line Help by Steven Davis and M. Edward Borasky, Borasky Research. Click "Help" on the MMA Introduction screen for the full MMA Manual. 7.4. MMA Introduction CSI's Unfair Advantage builds an unprecedented foundation for inter-market analysis by providing virtually every market in the world. CSI's new Multi-Market Analyzer provides a set of new and unique indicators. These indicators describe the market situation, not by staring at the same chart day after day, but by determining the underlying economics and the current market forces. The Multi-Market Analyzer (MMA) uses sophisticated statistical and economic analysis techniques normally found only in specialized packages. The aim of MMA is to make these techniques available to all fully licensed Unfair Advantage users. Press "Next" on the MMA introduction screen to begin by choosing markets. Reformatted From Multi-Market Analyzer On Line Help by Steven Davis and M. Edward Borasky, Borasky Research. Click "Help" on the MMA Introduction screen for the full MMA Manual. 7.5. MMA Choose Markets After dismissing the welcome screen, you are asked which markets to include in the analysis. User's Reference Manual Page 151 Unfair Advantage When selecting markets you should consider the following facts: 1) Analysis will only be done on the inclusive date range: the date range in common to all selected markets. 2) The selected markets must be economically related for the predictions to be valuable. 3) Only select as many markets as your computer's memory can hold. Generally each market will consume about 300k of computer memory. Ten markets will occupy 3 megabytes. The control at the top allows you to choose from either stocks or commodities. Clicking on a column will cause the list to be sorted on that column. Each click after that will reverse the sort order. Clicking the check box at the left causes the stock or commodity to be selected; its symbol will appear in the selection list. A second click will uncheck it and remove it from the list. You can also type symbols directly in the list, separated by either spaces or commas and in either upper or lower case. If you run the same analysis every day, it is easiest just to have the selected symbols available in a text file and use the Windows Copy and Paste functions (Ctrl-C and Ctrl-V) to enter the list. Normally a user will enter a Market Type of commodities, then select a few from the displayed list that are believed to be economically related. The commodity symbols will appear in the "Selected" window. Next, the user may change the market type to "Stock" and choose more markets that may be economically related to the commodities already chosen. The stock symbols will be added to the "Selected" window where stocks and commodities commingle with each other in an economic sense. Which markets you choose will depend on your trading style, of course. For an example, we will focus on agricultural futures contracts. We've chosen ten very liquid contracts: C (Corn), O (Oats), S (Soybeans), W (Wheat), LC (Live Cattle), LH (Lean Hogs), CC (Cocoa), KC (Coffee), SB (World Sugar #11) and CT (Cotton), and we believe there is sufficient reason to combine these markets in a single exercise. Press the "Next " button to continue by choosing a series. Page 152 User's Reference Manual Unfair Advantage Reformatted From Multi-Market Analyzer On Line Help by Steven Davis, CSI and M. Edward Borasky, Borasky Research. Click "Help" on the MMA Introduction screen for the full MMA Manual. 7.6. MMA Choose Series After selecting the markets to analyze, you are asked which continuous time series you would like to use. We recommend a detrended weekly Perpetual Contract® Data Series. Without going though the advanced options (not initially available) you can select whether or not to detrend, daily, weekly or monthly sampling of the data, and indicate if back adjustment is preferred. Why do we recommend weekly data? We are making judgments based on inter-market relationships that take time to evolve. A one-day rise in the corn price relative to the soybean price will neither change supply nor demand. Monthly data tends to be too slow to show trend changes, and has too few samples of data to get trustworthy results. Weekly data will also speed up the calculations from an estimated daily frequency. Notice that the inclusive date range has been calculated for you. If you wish to include data outside of that range, you must remove or exchange the limiting data series to obtain common data for the date range preferred. In our example, the earliest common start date is displayed as "19720816 (KC)". This is because the KC series (coffee) begins on August 15, 1972. If we want to start earlier, we must discard the KC series contribution or exchange it with a series that goes back further. If you do not see a symbol listed, it is because all of our selected series begin or end, as appropriate, on the same date. You may have to reduce the date range so that historical relationships in the data persist today. For example, the Green Revolution changed the level and character of the agricultural markets, so including earlier data is likely to worsen our results. We do recommend applying our detrending facility, but the investigator must still compromise between having a consistent economic period and having enough data to get a meaningful result. For more information on time series analysis and forecasting, see [Chatfield 1989] and [Abraham Ledolter 1983]. User's Reference Manual Page 153 Unfair Advantage After selecting the options, press the "Next " button to continue by choosing lags. Reformatted From Multi-Market Analyzer On Line Help by Steven Davis, CSI and M. Edward Borasky, Borasky Research. Click "Help" on the MMA Introduction screen for the full MMA Manual. 7.7. MMA Choose Lags Now that you have the series chosen, you are given some advanced options. For beginning users, these options are rarely used, but here is how they work: Lagging one or more series is sometimes necessary. The Hog and Corn markets are highly related, but much more so if you account for production time as well as production costs. Farmers would rather have some return on investment than none. So even if the price of corn goes up, hog farmers will typically continue raising their current hogs. But if the corn prices go high enough, hog farmers might slaughter more hogs than intended, pushing the hog prices down. It is only in the new crop of hogs that the old crop corn prices are directly felt. Thus in studying hog and corn prices, a lag to the corn prices might be used to understand or explain the hog prices. A series may be replaced or supplemented with its seasonal index. The seasonal index employed is a 32-bit port of the one available under Unfair Advantage as written by Bob Pelletier. When using a seasonal index on daily data, a lag of, say, 240 trading days would be equivalent to a 10-trading-day forward forecast of expected seasonal influence or "pull" in the market because the final year of a seasonal index is a copy of the developed cumulative index over time. If you included an index market to get the index, a check box is provided so that you can include the cash price series instead of or in addition to the Back Adjusted or Perpetual Contract series previously chosen. A word of warning, however, the date range presented and validated is based on the futures data. The cash Page 154 User's Reference Manual Unfair Advantage data may have a different range. If the cash series is not present through out the date range, the gap is treated as a series of holidays and is filled in with the last price. Once you have set the options in this screen, press the "Next" button to continue. Setup is complete at this point; Multi-Market Analyzer will now do a correlation and factor analysis, which may take some time before getting to the next screen, "Factor Analysis". For more information on time series analysis and forecasting, see [Chatfield 1989] and [Abraham Ledolter 1983]. Reformatted From Multi-Market Analyzer On Line Help by Steven Davis, CSI and M. Edward Borasky, Borasky Research. Click "Help" on the MMA Introduction screen for the full MMA Manual. 7.8. MMA View Correlation Coefficient When the Factor Analysis screen displays, press the "Raw Correlation" button to see the correlation coefficients. The correlation coefficients displayed here are statistical measures of how each market relates to the others. A correlation coefficient has two parts: the sign and the magnitude. The magnitude, also known as the absolute value, ranges from zero to one and indicates the strength of the relationship. The sign, positive or negative, indicates the direction. A value of 1.0 is perfect positive correlation – the first market and the User's Reference Manual Page 155 Unfair Advantage second market move up and down together in unison. Of course, each market is perfectly correlated with itself, which is why you see 1.0 on the main diagonal from top left to bottom right. Two markets that move perfectly opposite to each other – one goes up and the other goes down – have a correlation coefficient of –1.0, perfect negative correlation. This is very rare. A correlation coefficient of zero indicates no relationship at all – also very rare. A very crude rule of thumb for the strength of relationship based on the absolute value (drop the minus sign for negative coefficients) is ([Williams1968], page 134): 0.00 – 0.20: slight; almost negligible relationship 0.20 – 0.40: low correlation; definite but small relationship 0.40 – 0.70: moderate correlation; substantial relationship 0.70 – 0.90: high correlation; marked relationship 0.90 – 1.00: very high correlation; very dependable relationship Armed with these definitions, what does the correlation between two markets mean to a trader? In general, unless you are trading very specific spreads or arbitrages, you want to be as diversified as possible and avoid taking positions at the same time in highly correlated markets. For example, if you're a trend follower, you will find that highly correlated markets enter trends together, giving entry signals typically the same day or within a day or two. Taking all of these highly correlated signals is equivalent to pyramiding – amplifying your risk. If you are trading futures to diversify a total portfolio, which might include real estate, stocks and bonds, you will achieve better diversification if you ignore stock index futures like SP, bond futures like US and other contracts that are highly correlated. This is why we've chosen agricultural futures for our example – historically they show low-magnitude correlations with stocks, bond and real estate. The underlying development intent of MMA is to help the user-analyst to explore opportunities where correlated markets depart from each other and develop opportunities where by buying one and selling the other, the correlated pair will return to a satisfactory level of equilibrium. One other note of caution: in some books you will see recommendations to take simultaneous positions in markets with high negative correlation as a way to reduce risk. Technically this is correct if you are taking a long position in both markets, as would normally be the case for common stocks. But in the futures markets, you can take either a long position or a short position with equal ease. Given a pair of futures contracts with high negative correlation, a trend-following system would very likely recommend a long position in one market and a short position in the other market. As noted above, this is equivalent to an amplification of risk. For futures trend following, diversification is achieved by using markets with low-magnitude correlation coefficients – near zero with either sign. Let's look at this table with the correlation coefficients sorted by magnitude: High Page 156 User's Reference Manual Unfair Advantage Moderate Low Slight At the top of the list, we find that corn is highly correlated with wheat and soybeans. Thus, if you were following the three markets with a trend-following system and got a signal to go short or long in one of them, chances are the other two would give signals in the same direction the same day or soon after. To maintain User's Reference Manual Page 157 Unfair Advantage diversification, you would not want to take all of the signals. You might consider using the first signal from the group of three as a setup, entering a trade in one of them when the other two followed, confirming the trend. Also at the top of the table, coffee and cocoa are highly correlated with each other. However, their correlations with corn are low, so if you were holding a position in corn when you got a signal in KC or CC or both, you would be diversifying by taking one signal from the pair. The other fact to be noted about high-correlation pairs is that they define where opportunities for inter-crop spreads are found. Such spreads, long in one contract and short in another highly correlated contract, are considered low risk and qualify in some cases for reduced margins. We will have more to say about intercrop spreads later. Looking at the bottom of the list, we see that sugar (SB), cocoa (CC) and coffee (KC) have only slight or low correlations with many of the other commodities. This makes them ideal for diversification and means they are worth following. When you are finished looking at the correlation coefficients, press the "Close" button to return to the "Factor Analysis" screen. For more information on correlation and diversification in the futures markets, see [Balsara 1992], chapter 4. Reformatted From Multi-Market Analyzer On Line Help by Steven Davis, CSI and M. Edward Borasky, Borasky Research. Click "Help" on the MMA Introduction screen for the full MMA Manual. 7.9. Page 158 MMA Factor Analysis User's Reference Manual Unfair Advantage Factor analysis is a statistical technique that helps understand the structure of a set of variables and how they relate to each other. Suppose, for example, we had monthly returns of 500 stocks and wanted to simplify the data set. One way to do this is to assume that each stock return is a linear combination of factors. That is, each stock's return can be written as an equation Ri = C1i * F1 + C2i * F2 + C3i * F3 + … + Cni * Fn where Ri is the return of the i-th stock, C1i, C2i, etc. are the coefficients, n is the number of factors and F1, F2, etc. are the factors. Although it is possible to compute as many factors as there are stocks, in this case 500, the realities of economics are that the number of useful factors will typically be much smaller. Typically there will be one factor representing the overall market and one factor for each market sector represented in the stocks that were analyzed. One would then look at a table of factor loadings for the first few factors, see which stocks were most highly loaded in each factor, and from a knowledge of what those stocks had in common, gain understanding of what the factors mean. In our example, instead of 500 stock returns we have chosen ten detrended futures contract prices. The factor loadings as computed by a statistical package are: So factor 1 is very highly correlated with C, highly correlated with O, S, W and CT and moderately correlated with LC, LH, CC and SB. Factor 2 is highly correlated with CC and KC and moderately negatively correlated with SB. No more high correlations remain. Going to six factors exhausts the list of moderate correlations. How should we interpret these factors? Factor 1 can be interpreted as being a proxy for the common supply and demand influences that affect most agricultural commodities, but especially corn, oats, wheat, soybeans and cotton. Factor 2 is very different from factor 1; it shows supply and demand influences on coffee, sugar and cocoa not captured by factor 1. Factor 3 shows supply and demand influences on live cattle and lean hogs not captured by the first two factors, and so on. The mathematical process of factor analysis is very similar to what happens when an astronomer passes white light from a star through a spectroscope. The spectroscope shows a number of lines of varying color and intensity. In our case, the factors are the colors and the numbers in the left-hand column are the intensities. There are three ways we can use the factor analysis, depending on our trading approach: We can just leave all the factors checked and go on with the analysis. This corresponds to using all of the information in the market data provided, and is usually what we do. We can de-select some of the lower-intensity factors. They provide less information than the high-intensity User's Reference Manual Page 159 Unfair Advantage factors. De-selecting them will reduce the amount of computer time needed to perform the remaining analysis at the cost of some accuracy. A rough rule of thumb is to go from bottom up, adding the intensities until the sum is somewhere between 5 and 10 percent. In this example, we would de-select the bottom three or four factors. This should only be necessary with a large number of input markets; the small case we are dealing with here does not require it. If we were interested only in a specific market or pair of markets, we could de-select the factors that were only slightly loaded in those markets. For example, suppose we were interested only in sugar. Ignoring factors with slight loadings, less that 0.2 in magnitude, leaves factors 1, 2, 3, 4, 5 and 6. As with the previous case, we are trading slightly lower accuracy for reduced computing time and this is not necessary for the current example. It should be noted that using only these factors will give highly misleading results for any market except sugar. In most cases, the default – leaving all factors selected – is appropriate and that is what we will do on this example. For more information on factor analysis, see [Williams1968], chapter 12 and [RaymentJoreskog1996. Once you have de-selected the factors you wish to ignore, if any, press the "Next" button to move to the current inter-market situation. Again, this may take some time as the Multi-Market Analyzer is computing proprietary indicators based on the factors selected. Reformatted From Multi-Market Analyzer On Line Help by Steven Davis, CSI and M. Edward Borasky, Borasky Research. Click "Help" on the MMA Introduction screen for the full MMA Manual. 7.10. MMA More on Factor Analysis These paragraphs, offered by Bob Pelletier, were derived from a conversation with Steven Davis to stimulate additional thought -Another view of the Factor Analysis table might be that lower order factors 1, 2, 3, & 4 identify markets with high cell scores that are correlated, hence markets that qualify for outright long or short positions, and the higher order factors, say 7, 8, 9 and 10 represent spread opportunities. The cell scores of larger positive factors identify candidate long positions in the historical past and the large negative cell score factors identify short positions. Under these rules, factor 10 in our example suggests profits could have been captured by trading two corn contracts against one contract each of soybeans and wheat. All other cell scores for factor 10 appear to suggest nominal effects and, for that reason, might be ignored. The suggested inclusion to spread corn against wheat and soybeans has to do with the magnitude of the respective cell factors of these three markets versus the seven other nominal cell factors of the balance under factor 10. Please review the Davis Unstretched Index results to determine the long short legs of the spread. Kachigan's Multivariate Statistical Analysis, p. 236 - 270, suggests that it might "be somewhat illogical to retain a factor that contains even less information than an original input variable." This would be the case for factor 10, which explains less than one percent of the variances in the data. However, we believe it would be OK to review and act upon low variance items, given the promising objectivity of the price data (as compared with personality traits) and the relative magnitude differences between the factor 10 loadings. The intermarket movement of correlated market products is imprecise because all of the information that affects them cannot be totally known. Weather, marketing, supply and demand and many other factors cannot be completely quantified. Fortunately, however, thanks to Unfair Advantage's enormous data repository of related markets, many elements of the equation are known through economically related products that coexist in a related environment. Page 160 User's Reference Manual Unfair Advantage 7.11. MMA Current Inter-Market Situation The Multi-Market Analyzer next computes the proprietary Davis Stretch Index, the Davis Unstretched Indicator and the Davis Market Leadership Index to give us a sense of the current market situation. Davis Stretch Index The Davis Stretch Index (DSI) is an economic indicator that is designed to help identify a non-harmonious market mix and market opportunities that are a part of a larger correlated subset. The basic original premise for the original development of MMA was to identify economic and statistical opportunities for investment and the DSI represents one of many tools for satisfying that requirement. The stock and commodity markets represent an imperfect environment for analytical opportunity because all of the forces that bear upon the markets cannot be completely identified. It is true that many of the external forces that drive our economy are present through market price data and governmental input, but factors such as weather, marketing, supply and demand, war, international commerce and many others are not readily available and quantifiable. Fortunately, however thanks to the wide scope of Unfair Advantage's (UA's) database reserves, many of the related markets and symptoms can be found in UA's data resources. If all of the pertinent economic factors were available for review including those unpublished elements listed above, then any trade one might wish to enter through the markets would be strictly a gamble that would have as its purpose an attempt to predict the future more perfectly than what would be possible by any analyst. The elements of MMA are designed to get the most out of the data that is actually available through mathematical means and suggest opportunities where markets are violating the statistical properties of equilibrium. The DSI can identify from a historical learning perspective where markets should be priced if they followed historical norms. It can answer the question, for example, "Are live cattle prices high or low with respect to live hogs, corn, wheat, oats, and crude oil?" Notice that products which are related to the development of cattle are included in our example. Hogs are a substitute for cattle, and wheat, oats and corn are substitute feeds, and crude oil will power the farm equipment. MMA's correlation matrix and factor User's Reference Manual Page 161 Unfair Advantage analysis already introduced, would be used to help identify the opportunities for exploring market harmony. The DSI is a standard deviation or variance calculation designed to measure market harmony. A reading should generally lie in the range of plus to minus 3 sigma. Markets which exhibit an overall reading at the extremes are exhibiting non-harmonious behavior, whereas a reading close to zero suggests that the markets are behaving as they have in the past and are considered harmonious and within the bounds of equilibrium. Opportunities for profit are generally confined to the higher sigma readings. One should exercise caution when considering a reading much above 3 sigma because this could suggest a change in behavior not encountered in the past and may very well represent a new development that could discredit traditional norms. In the above example shown above, the overall DSI is shown at 2.758 which is in the realm of nonequilibrium and indicates that an opportunity may readily exist. Davis Unstretched Indicator The Davis Unstretched Index (DUI) tells you, for each market, where its price would have to go if all of the other prices remain at their current levels. Suppose you were analyzing corn, soybeans, and live cattle. If the corn prices are very high and the live cattle prices are very high, the "Unstretched" price for soybeans will be very high as it tries to accommodate both the corn price and the live cattle price without regard to its own economics. The Davis Unstretched Indicator measures how far each market would separately have to move to absorb all of the underlying market forces itself. It predicts the price of each market based solely upon the movement of the other markets. This set of indicators for all markets should explain which markets led to the misalignment suggested by the Davis Stretch Index. Don't be too surprised if the Davis Unstretched Indicator is several large points away from the current price for some markets. The markets, as a whole, will tend towards equilibrium, with each market doing some of the accommodating. The problem for the trader is to predict which market or markets will do the moving. In the real world, it is unlikely that any one of these markets will make up all the price difference to return the relationships to the norm. More commonly, each market moves a little toward the center until equilibrium returns. If, however, the spread between Davis Unstretched Indicator and the actual price widened or closed abruptly at an abnormal peak in the Davis Stretch Index, then perhaps the market factors didn't just stretch, but they snapped. That is, the underlying economics changed. In this event, try reducing your date range to exclude this event and see if the spread between the Davis Unstretched Indicator and the actual price is more consistent. A word of warning: These indicators work best with a fair number of markets. At least three must be specified and more are preferred. A spread trader might look for the pair of commodities with the biggest total discrepancy between the Davis Unstretched Indicator and the current price level. Confirm a spread opportunity by consulting the correlation table to determine how closely the two market opportunities are correlated. If the correlation table shows a high or very high reading of, say 0.70 or higher, then this may represent an excellent opportunity for speculative profit. In our example, corn is overpriced relative to its Davis Unstretched Indicator. Wheat and soybeans are underpriced, indicating potential spreads of long W or S against short C. Live cattle are overpriced and lean hogs underpriced, indicating potential for a short LC / long LH spread. Coffee is overpriced and cocoa is underpriced, indicating potential for a short KC / long CC spread. Davis Elasticity Index The Davis Elasticity Index is not currently implemented; please ignore it. Davis Market Leadership Index Page 162 User's Reference Manual Unfair Advantage The Davis Market Leadership Index is the piece that completes the puzzle. The Davis Stretch Index tells us that some markets are going to move. The Davis Unstretched Indicator tells us what would happen to a market's price if it followed the other markets. But not every market follows, some lead. The Davis Market Leadership Index measures in bars the recent historical tendency for the Davis Unstretched Indicator to lead or follow the market. That is, if the input markets were weekly series, the index will be in units of weeks. Large positive values mean that in recent past, the market tended to get ahead of the market changes. A negative value means that the market recently has been slow to accommodate economic changes. A value near zero means that the market, in recent history, has promptly fully discounted all factors. Press "Next" to view a graphical screen with the historical plot of the indicators. Reformatted From Multi-Market Analyzer On Line Help by Steven Davis, CSI and M. Edward Borasky, Borasky Research. Click "Help" on the MMA Introduction screen for the full MMA Manual. 7.12. MMA Historical Validation This screen is a very flexible chart screen. First, in the upper right corner, there are four buttons. The one on User's Reference Manual Page 163 Unfair Advantage the left expands the scale of the chart horizontally. The next one compresses the scale horizontally; this button is inactive in this screen currently because the whole data period is displayed. The next button turns on a tracking crosshair, and the last one prints the current chart. Below these buttons, you can select which variables you want to plot. "Index" at the top is the Davis Stretch Index. Below that, the other indicators for each market are available. When the screen first comes up, the first market selected is displayed, so if you know going into the analysis that you are interested in a specific market, you can enter that one first. If you want to do your own off-line analysis, Multi-Market Analyzer creates a file with all of the information in this screen. The file is called "mmanalyzer.csv" and is located in the main Unfair Advantage directory, usually "C:\UA". As the name suggests, the file is in comma-separated value (CSV) format and can be imported directly into most spread sheets, databases and statistical packages. For more information, see the Unfair Advantage Developer Document on CSI's web site. Let's look at a plot of corn versus its Davis Unstretched Indicator. Except for a relatively brief period in 1998, for the past two years the Davis Unstretched Indicator has been visibly below the actual price, indicating an overpriced condition as it does at the time of this writing (December 12, 1999). It should be noted that the turns in the Davis Unstretched Index in this case are more or less coincident with turns in the price of corn itself. That is, there is no clearly visible lead or lag, so it does Page 164 User's Reference Manual Unfair Advantage not appear to be a good predictor of corn prices by itself. Let's add in the soybean data, since we saw a potential long soybeans / short corn spread on the previous screen: We can see that there have been a few times when corn and soybeans diverged visibly, but for the most part they moved together, primarily downwards in the past two years. The overpricing of corn relative to soybeans we see today began early this year according to this chart and corrected itself briefly around the beginning of th the 4 quarter. Without knowing any of the other factors – fundamentals, seasonality and so forth – it would be risky to put on this trade based on the MMA indicators alone. Let's look at one more chart, this time for cocoa (CC). User's Reference Manual Page 165 Unfair Advantage What is interesting here is that, unlike corn and soybeans, cocoa does appear to be led by its Davis Unstretched Indicator. That is, upturns and downturns in the price are preceded by upturns and downturns in the indicator. Again, without knowing more, it would be risky to trade just on this basis, but a long CC position does appear to be suggested by this chart. Read on to learn more about developing a trading strategy. Reformatted From Multi-Market Analyzer On Line Help by Steven Davis, CSI and M. Edward Borasky, Borasky Research. Click "Help" on the MMA Introduction screen for the full MMA Manual. Some colors were changed here to accommodate printing in the Unfair Advantage user's manual. 7.13. MMA Developing A Trading Strategy Developing a trading strategy is a complex art and science; it is impossible to cover the whole topic here. However, we can recommend three excellent books on the subject. [Kaufman 1998], [LeBeau Lucas 1992] and [Pardo 1992]. Briefly, there are three main trading strategies: • Trend following • Counter-trend trading Page 166 User's Reference Manual Unfair Advantage • Arbitrage and spreads Counter-trend systems and arbitrage are relatively short-term in nature; counter-trend traders and arbitragers typically hold positions for a few hours to a few days. Since the Multi-Market Analyzer works with long-term relationships, on the order of years, we will not cover using MMA for counter-trend trading or arbitrage. Let's look at spreads first. As we saw earlier, the Davis Stretch Index and the Davis Unstretched Indicator for a collection of markets can be used to locate potential profitable spreads. As a rough rule of thumb, if the Davis Stretch Index is greater than 2.0 and two markets are highly correlated (correlation coefficient of 0.70 or higher), look for spread opportunities in the directions given by the Davis Unstretched Indicators for the two markets. So let's look at the Current Inter-Market Situation again. The Davis Stretch Index is 2.758, comfortably above 2.0. Looking at the correlation table, we see there are six market pairs with high correlation. We've already looked at corn versus soybeans; let's look at corn versus wheat. As with corn and soybeans, there are no obvious trades indicated by this chart. Before leaving spreads, let's look at coffee versus cocoa: User's Reference Manual Page 167 Unfair Advantage When you look at this chart, a pattern starts to emerge. Notice that the turns in the Davis Unstretched Indicator for coffee track the turns in the price of cocoa and vice versa! You can see this effect in the other charts of highly correlated pairs, but it's more obvious here because KC and CC are less correlated with the other markets in our input set. It should be noted that coffee is a very volatile and risky market in dollar terms; for example, in November of 1999, the March 2000 coffee contract ranged from 104.5 cents a pound to 137 cents a pound. The coffee contract is for 37,500 pounds, which means that a single contract varied over a range of $12,187.50 during the month! Cocoa, by contrast, ranged from $812 per tonne to $935 per tonne. The cocoa contract is for ten tonnes, making the November range only $1230. A cocoa / coffee spread will be tricky given this disparity in dollar risk and is not recommended. Moving on to trend following, we see that one possible way to use MMA is to find a market where the Davis Unstretched Indicator tends to turn before the price turns, as it has for cocoa. Another possibility is to use the difference between a market's price and its Davis Unstretched Indicator as an overbought/oversold indicator, taking a position when the price begins to move in the direction indicated and closing the trade when the two lines meet. As with any trading system, we emphasize that backtesting is mandatory and some forward testing is recommended before risking real money on any trading idea. And once an idea tests out and is put into use, it must be monitored carefully and quickly abandoned if it no longer works as expected. Reformatted From Multi-Market Analyzer On Line Help by Steven Davis, CSI and M. Edward Borasky, Page 168 User's Reference Manual Unfair Advantage Borasky Research. Click "Help" on the MMA Introduction screen for the full MMA Manual. 7.14. MMA Balancing Contract Spread Risk Many of the substantive trades that might be invoked or suggested through MMA involve trading one or more contracts against another, or one or more commodities against one or more others. Since MMA explores differences in price behavior on a statistical basis using statistical standard deviations from a norm, the user should attempt to normalize such risk by maintaining an equivalent dollar risk between products. This will lessen the chance that a very high priced product will overwhelm the spread trade and it will reduce the risk of over-exposing one leg of the spread compared to the other. You will not want to find yourself in an unbalanced spread. To avoid such a situation, compute the dollar value of the members of the spread, taking into account the hoped-for possible market movement and the reported directional correlated experience of the markets, and attempt to match up the dollar value of opposing positions. In a large trading exercise involving more than one pair of markets, regular adjustments may be necessary over a prolonged trading experience as the markets evolve over time. There is a very high risk in trading, and all users of CSI products should obtain competent advice before entering trading situations. Please read over all of the material presented in this manual and attempt to paper trade various scenarios before assuming any real at-risk market involvement. We at CSI wish you the best in your trading activities. We have worked very diligently to provide you with the best possible chance to explore market opportunities both through MMA and through our Trading System Performance Evaluation software. We welcome your comments and questions. 7.15. MMA Glossary Arbitrage A condition of mispricing between two markets that offers an opportunity for riskless profits and is expected to disappear rapidly. An example arbitrage: suppose gold is selling in Chicago for $300 an ounce and in New York for $320 an ounce. Suppose also that it only costs $1 an ounce to ship gold from Chicago to New York. One could buy gold in Chicago and sell gold short in New York simultaneously, for a riskless arbitrage profit of $19 an ounce. Arbitrage opportunities like this are rare and last only briefly most of the time. In fact, the absence of arbitrage opportunities is the foundation of modern finance theory; see [Elton Gruber 1984]. Correlation Analysis A statistical procedure that computes the correlation coefficients for a set of input variables. Each pair of variables has a correlation coefficient. The output of a correlation analysis is usually a correlation matrix, a table of the coefficients in a square array. Correlation Coefficient A statistical measure of the direction and magnitude that one variable moves when a second variable moves upwards. If variable A moves up when variable B moves up, A and B are positively correlated and the coefficient will be positive. If variable A moves down when variable B moves up, A and B are negatively correlated and the coefficient will be negative. If A moves up and B doesn't move at all, the variables are uncorrelated (independent) and the coefficient is zero. Counter-Trend Trading A trading strategy that attempts to profit from short-term moves in reaction against the major trend of a market. Most counter-trend strategies use oscillators or momentum indicators to User's Reference Manual Page 169 Unfair Advantage locate times when a market is overbought in an uptrend or oversold in a downtrend, then taking a position counter to the trend. Cyclic A component of a time series that oscillates up and down over the course of a number of months or years, usually with a period of greater than a year. The most common cyclic component in economic time series is the so-called business cycle. Deseasonalize Remove the seasonal component from a time series, leaving the trend, cyclic and irregular components. Detrend components. Remove the trend component from a time series, leaving the seasonal, cyclic and irregular Factor A statistically derived artificial variable that is a linear combination of the original given variables. Factors are computed by either principal component analysis or factor analysis. Factor Analysis A statistical procedure for reducing the dimensionality of a dataset by approximating the given variables as linear combinations of factors than are uncorrelated with each other. Factor analysis is very similar to principal component analysis and can also be found in most statistical packages. In fact, the underlying computations are often identical and the major difference is in how the results are presented and interpreted. In principal component analysis, the emphasis is on the reduction of dimensionality and the factors are almost always uncorrelated with each other. In factor analysis, the emphasis is on understanding what the factors mean in terms of the original problem, and factors may be rotated and may actually be correlated with each other if that leads to a greater understanding of the problem. See [Rayment Joreskog 1996] for more details. Factor Loadings The correlation coefficients between the original input variables and the factors derived by a factor analysis. Irregular The component that remains after the trend, cyclic and seasonal components have been removed from a time series. Monthly Return The total gain or loss from a stock over a month, expressed as a percentage change, including both price changes and dividend payments. Example: suppose you bought 100 shares of Consolidated Factor Loadings (CFL) on the first trading day of January at $100 a share. In January, CFL paid a dividend of 10 cents a share and on the first trading day of February, the price of CFL is $110. Your $10,000 investment is now worth $11,010, including the dividend. The monthly return is 11010/10000 – 1, or 10.1% Principal Component Analysis A statistical procedure for reducing the dimensionality of a dataset by approximating the given variables as linear combinations of factors than are uncorrelated with each other. A large number of input variables will usually yield a much smaller set of factors. Most statistical packages provide principal components analysis. Seasonal The component of a time series that varies with the calendar seasons. That is, it is a repetitive component with a period of one year. Seasonal Index of its other components. An index which shows the seasonal component of a time series independent Spread Opposing market positions entered simultaneously in two or more markets or contracts. Example spreads: A long futures contract in July Corn and a short futures contract in December Corn. This is a calendar spread. The trader would profit if the price difference, July minus December, increased and Page 170 User's Reference Manual Unfair Advantage would lose if it decreased. A long futures contract in December Corn and a short futures contract in December Soybeans. This is an intercrop spread. The trader would profit if corn prices rose relative to soybeans and lose if corn prices dropped relative to soybeans. A long position in soybeans and a short position in soybean meal and soybean oil. This is called a "crush spread". Spread traders, like arbitrage traders, attempt to profit from relative mispricings in markets, but the mispricings are less clearly defined than they are in an arbitrage, and usually last longer before coming to a balance. Spreads are often believed to be less risky than outright long or short positions, but they are also less profitable. Time Series A collection of data points indexed by time. CSI financial market data are indexed by trading day, but other economic time series are often indexed by week, month, quarter or year. Time Series Decomposition The process of decomposing a time series into components. In classical time series analysis, a time series is represented as the sum or product of four components: trend, seasonal, cyclic and irregular. Decomposition is the process of determining the components from a time series. Trend In time series analysis, a trend is a long-term movement in a single direction, up or down. A trend may be linear – a straight line – or curvilinear – a curve. In technical analysis of markets, a trend may exist on any time scale. So the two usages of the term are similar but not exactly the same. Trend Following A trading strategy that attempts to profit from major long-term moves in a market. Trend-following systems typically use indicators like moving averages or channel breakouts to locate when a major up move or down move is occurring. The basic principle is, as the name implies, following the market. A trend-following system usually enters after a trend has established itself, thus missing the initial turning point. A trend-following system may exit on small turns opposite the trend and re-enter should the trend resume, or it may wait until the turn has established itself as a trend in the opposite direction before exiting. Reformatted From Multi-Market Analyzer On Line Help by Steven Davis, CSI and M. Edward Borasky, Borasky Research. Click "Help" on the MMA Introduction screen for the full MMA Manual. 7.16. MMA References For more information on statistical procedures, see: ViSta - The Visual Statistics System (includes a free statistics and visualization package) and StatSoft Inc. -- Free Statistics Textbook [AbrahamLedolter1983] Abraham, Bovas, Ledolter, Johannes (1983), Statistical Methods for Forecasting, John Wiley and Sons, New York, ISBN 0-471-86764-0. [Balsara1992] Balsara, Nauzer J. (1992), Money Management Strategies for Futures Traders, John Wiley and Sons, New York, ISBN 0-471-52215-5 [Chatfield1989] Chatfield, C. (1989), The Analysis of Time Series, Chapman and Hall, London, UK, ISBN 0412-31820-2. [EltonGruber1984] Elton, Edwin J., Gruber, Martin J. (1984), Modern Portfolio Theory and Investment nd Analysis, 2 Edition, John Wiley and Sons, New York, ISBN 0-471-87482-5 [Kaufman1998] Kaufman, Perry J. (1998), Trading Systems and Methods, 3rd Edition, John Wiley and Sons, User's Reference Manual Page 171 Unfair Advantage New York, ISBN 0-471-14879-2 [LeBeauLucas1992] LeBeau, Charles and Lucas, David (1992), Technical Traders Guide to Computer Analysis of the Futures Market, Irwin Professional Publishing, Burr Ridge, Illinois, ISBN 1-55623-468-6 [Murphy1991] Murphy, John J. (1991), Intermarket Technical Analysis, John Wiley and Sons, New York, ISBN 0-471-52433-6 [Pardo1992] Pardo, Robert (1992), Design, Testing, and Optimization of Trading Systems, John Wiley and Sons, Inc., New York, ISBN 0-471-55446-4 [RaymentJöreskog1996] Rayment, Richard, Jöreskog, K., G. (1996), Applied Factor Analysis in the Natural Sciences, Cambridge University Press, New York, ISBN 0-521-57556-7 [Williams1968] Williams, Frederick (1968), Reasoning With Statistics, Holt, Rinehart and Winston, New York. Reformatted From Multi-Market Analyzer On Line Help by Steven Davis, CSI and M. Edward Borasky, Borasky Research. Click "Help" on the MMA Introduction screen for the full MMA Manual, which includes links to these many of these references. Page 172 User's Reference Manual Unfair Advantage 8. Trading System Performance Evaluator 8.1. TSPE Overview 8.1.1. TSPE Introduction The modern investor is bombarded with offers of trading systems, managed accounts and newsletters. Everyone seems to have a proven way to make money. What all of these ventures have in common is a performance record. These records are usually characterized by claims of substantial profit. All claims, whether supported by simulated hindsight profits or actual trading performance, can be statistically analyzed and rated with the Trading System Performance Evaluator (TSPE). At last, every system or approach can be evaluated against a standard set of rules. In some cases, when the promoter is willing to share his performance record, that record can be evaluated before the product or service is purchased. Our Trading System Performance Evaluator (TSPE) does not generate trading signals or suggest market posture. Instead, it certifies the results derived from your trading system and helps you understand your prospects for sustained success. By analyzing the profit and loss record (P&L) of any simulation exercise, TSPE helps investors avoid illconceived trading systems that have little hope of producing regular profits. TSPE is a Monte Carlo simulation, which, through the assumption of trade independence, computes the capital requirement necessary to achieve a predetermined goal at a specified level of confidence. TSPE is provided as a courtesy to UA subscribers who have paid the full Unfair Advantage license fee. Other users may use TSPE a maximum of ten times on a trial basis, and may upgrade by contacting CSI and paying any balance due on the license fee. We reserve the right to change this policy at any time. TSPE Objective TSPE's objective is to find the probability that a proposed dollar goal can reasonably be achieved with a given capital stake, and to compute the expected level of goal satisfaction. In offering TSPE, CSI is interested in both uncovering the more promising trading systems or track records and in warning investors against committing funds to improperly conceived methods. TSPE's Methodology The approach used by TSPE draws upon forecasting theory and random simulation to assess performance. TSPE will take any profit and loss (P&L) input record and determine whether a similar result can be repeated by chance with randomly-drawn samples from the original P&L set. TSPE randomizes a representative sample of profits and losses produced from the user-supplied trading system(s) and from this, a typical record of the overall trading account is created. The account's randomized profits and losses are logged as though they were actual trades. TSPE simulates thousands of trading sessions for the system(s) under evaluation. Each session continues until: User's Reference Manual Page 173 Unfair Advantage 1. Residual capital is insufficient to meet the exchange-imposed dollar margin requirement or; 2. The dollar goal is met. TSPE repeats this process for a range of capital levels, keeping track of the percentage of winning sessions for each. The winning percentage for each capital level is presented as the probability of reaching the goal. The statistical terms for the techniques used are "sampling with replacement" and "Monte Carlo Simulation." These are two of the few methods capable of solving this type of problem. TSPE's Simulation Technique TSPE is a Monte Carlo simulation similar to that which is commonly used in the development of military systems hardware. In a large-scale system such as a fighter aircraft, the model would likely include design specifications such as performance and reliability requirements. These simulations require the selection of random events that would trigger the degradation of a system's operational performance in certain would-be situations. The operational performance is tested as if it were occurring in real life by experiencing system failures and measuring system effectiveness. In military applications, Monte Carlo simulation is used to find problems in the design/development stage. It helps contractors avoid costly revisions and corrections in post-design reality. When applied to trading systems or promoter track records, it can uncover otherwise unforeseen problems, assumptions or weaknesses before capital is risked in actual trading. Correcting For Developer Biases Before the Monte Carlo simulation takes place, profits are degraded and losses are inflated by a factor to correct for sample size, and if appropriate, user control. Since actual trading performance is less prone to error than a P&L string computed from hindsight evaluation, only sample-size corrections are necessary for actual trade data. For an input derived from hindsight simulated trading, the number of user-control parameters introduced must be taken into account to force the additional degradation on each member of the P&L string. Two methods are used to degrade results. Both techniques decrease profits and amplify losses. The first produces a mild adjustment with a procedure called the Akaike correction. The second approach, the CSI correction, uses a more severe correction which increases losses and decreases profits more substantially. This moreserious adjustment should be considered when the user wishes to produce the most conservative result possible. Correction is always more severe for hindsight analysis because through user-control parameters, profits are inflated through a knowledge of the past. The magnitude of the correction is directly proportional to the parameter count and inversely proportional to sample size. The TSPE Model A TSPE simulation requires a model that describes the process to be analyzed. In market analysis, a simple model is the P&L string from simulated or actual market trading. The P&L distribution derived over an extended and representative period of time is used because it explicitly shows how cumulative profits and losses combine to produce likely trading events. Other components to the market model include assumptions about slippage, commissions, margin costs and the number of controlling parameters which were used to produce the input P&L string. The Importance of Trade Independence Page 174 User's Reference Manual Unfair Advantage All P&L strings are assumed to be independent from one another, and each string is assumed to hold uncorrelated, independent outcomes. Trade independence is so crucial to the evaluation process that we do not recommend using TSPE to evaluate any system where the exact trade sequence is dependent. Any mechanical trading approach that uses the result of one trade to determine the size of subsequent positions suffers from a lack of independence. A simple martingale approach where bets are doubled (or increased) following losses is an example of a dependent process that TSPE can't analyze. The Importance of an Adequate Sample Size Sample size is implicitly supplied as the quantity of P&L inputs in a data set. Although statistical sampling theory accepts that 30 samples drawn from a normally-distributed population will be representative of the population undergoing measurement, we recommend at least 50 P&L inputs. This is because the typical prudent investor cuts his losses and lets his profits run. As investors, we literally bank on having occasional large profits and many small losses. In order to have a normally-distributed P&L curve, the investor would have to log as many big losses as big profits. Fortunately, this is not normally the case, so the typical trader's distributional curve is skewed heavily to the left. The quantity of trades in a P&L input is very important in a TSPE evaluation, where a large quantity of trades restricts the degradation to actual experience. Any system with many trades that shows a favorable outcome in the performance summary will also show favorable results with TSPE, even with moderate freedom loss. This is because many, many consistent profits significantly add to the credibility of a systematic approach and repeatability becomes statistically possible. More typical situations involving smaller sample sizes are not as reliable because a small sample suggests a less likely chance of repetition. TSPE Applications TSPE can help you avoid failure due to underfunding through a knowledge of capital requirements. It can also help you avoid any system with a low probability of success. You can estimate the amount of time required to meet your goal based on your own knowledge of average trade duration and TSPE's calculation of the expected number of required trades to meet your goal. TSPE's expected profit achievement can help you determine if the expected return on your investment is worth the risk. This version of TSPE is similar to, but not exactly like previous versions. Read on for a comparison. 8.1.2. UA's TSPE Compared to Earlier Versions This new version of TSPE is streamlined and extremely easy to use. Just input your P&L data, answer a few prompts and review results. Enhancements: New step-through interface requiring fewer inputs Additional output including Percentage chance of not going broke. Greatly improved speed, due to the support of 32-bit programming Maximum Anticipated Drawdown is now provided Changes: User's Reference Manual Page 175 Unfair Advantage This version of TSPE does not support an analysis of multiple trading systems used simultaneously. This allowed us to omit all control file input and manipulation. There is no entry to identify an actual vs. simulated trading result, so all trading records are entered using the same conventions. Adjustments for handling simulated trades are controlled through input screens. The Degree of Merit calculation has been omitted. Margin is no longer an input. A trial version of TSPE is provided with all Unfair Advantage software systems, however full use is limited to those CSI subscribers who pay the full UA license see. Please read on for details. 8.1.3. Limitations for Trial Users Trading System Performance Evaluator is provided as a courtesy to UA subscribers who have paid the full Unfair Advantage license fee. All others may use TSPE a maximum of ten times on a trial basis. If you have not paid the full UA license fee, you will be limited to 10 uses of TSPE. Don't waste them! If you are a trial user of UA or if you have not paid the full UA license fee, your TSPE will become nonfunctional after ten uses. You may restore full TSPE capabilities by upgrading to a regular UA subscription. Contact CSI marketing for details at (561) 392-8663 or (800) 274-4727. We reserve the right to change this policy at any time. TSPE requires an accurate accounting of the trading system you plan to evaluate, so please be sure your P&L string is available before launching TSPE. 8.1.4. Getting Your P&L String Ready When preparing a profit and loss record (P&L) for analysis with Unfair Advantage, it is important to make sure your data conforms to the assumptions used by TSPE. Sample Size: When building your initial file, you should continue adding information to the P&L string until you supply more than 30 trades if your P&L distribution is not normal (bell-shaped). Although it is possible to run TSPE with just a few trades in the file, we recommend at least 50 entries spread over an extended and representative time period to obtain a reasonable assessment of the trading system. Results derived from fewer than 50 samples may have little validity. This is particularly true when an actual trading record is evaluated because TSPE makes few corrections for user bias in this case. For proper evaluation of a system, the selection of samples should be either a census of all trials or a random sample drawn from a P&L set that possesses a mean and variance representative of the parent population. It goes without saying that any attempt to trick the computer with biased input is an attempt to fool yourself with an unachievable solution. Please read more about the importance of sample size and trade independence in "The TSPE Model" in the TSPE Overview chapter. Preparing and Saving an ASCII File You can create an ASCII text file with any spread sheet program or word processor, including the Notepad program that is included in your Windows Accessories. Page 176 User's Reference Manual Unfair Advantage The ASCII file hold separate line for each trade record. These lines include a single field per line, which is the profit and loss information. This is a positive or negative number indicating the net or gross profit or loss on a trade. A decimal point may be included in the value. Do not include $ symbols in your file. Profits are entered as positive numbers. Do not use a + to identify positive values. Losses are entered as negative numbers. Use a - sign immediately in front of the dollar value to indicate losses. DO NOT put a space between the - sign and the numerical value. An example: When you are finished entering your P&L information, save the file anywhere you want, being sure to give it a unique name and to remember how to find it again. Preparing a TradeStation System Report File TradeStation can create a file of profits and losses IN POINTS, which TSPE is able to import and process for evaluation. We recommend preparing the report in TradeStation before launching UA. Here's how: 1. Perform the desired analysis through TradeStation, using the markets and studies you wish to certify with TSPE. 2. Pull down TradeStation's View menu, and select "System Report." 3. Click the disk icon to Save File. 4. Save the report as an Excel file to c:\sysrep.xls User's Reference Manual Page 177 Unfair Advantage 5. Close TradeStation and launch TSPE. Note that each file created in this way has the same filename, so you cannot store two reports simultaneously. They overwrite each other! If you wish to analyze multiple TradeStation studies, you'll need to run the study, generate the report, analyze with TSPE, and then repeat the entire sequence for the next TradeStation study. Once you have compiled the proper profit and loss data to enter or import into TSPE, you'll be ready to launch the program. 8.1.5. Launching TSPE If you are not already running the UA software, you may launch TSPE from your start menu by going to Programs, selecting CSI Unfair Advantage, and then clicking Trading System Performance Evaluator. From within the UA program, you may start TSPE by clicking the Initiate menu, then selecting Trading System Performance Evaluator. Both result in the following screen: Click [Next] to proceed with selecting your method of inputing information about your trading system. 8.1.6. Steps to TSPE Analysis There are five basic steps to evaluating a trading system or track record. The steps are listed here, and each is described fully in its own chapter of this manual. TSPE will walk you through each step. 1. Enter (Import) a Track Record and Elaborate on Track Record Page 178 User's Reference Manual Unfair Advantage First you must give TSPE a track record to analyze. A track record is the list of profits and losses from trading activity. This can be based on actual trading results or on simulated trading. See "Getting your P&L string ready" for tips. The raw track record entered may require adjustments for commission, slippage, sample size, parameter count, etc. TSPE walks you through all possible considerations. When the complete P&L has been entered, you will view a chart of your trade frequency. This screen gives a graphic presentation of the profits and losses generated by your trading system. 2. Choose Your Goals Set your dollar goals and the time (in terms of number of trades). 3. View TSPE's Results The capital analysis charts lets you see the probability of reaching your goal at all capital stake levels. Capital Analysis runs may take a good deal of time, with a high percentage of that time spent calculating the final fractional percentage points. 8.2. Step 1 - Import & Define P&L 8.2.1. Selecting Data Import Method As the following screen illustrates, there are three ways to import the profit and loss record from your trading system into TSPE: If your trade results are only available in hardcopy (on a printout or written records) click [Manual] for keyboard data entry. If your trade records have been stored in an ASCII text file, or if you can export them into such a file, click User's Reference Manual Page 179 Unfair Advantage the [ASCII] option. If you used Omega Research's TradeStation software to develop the system you'll be evaluating, you may use Omega's System Report as input into TSPE. Click [TradeStation] to proceed. 8.2.2. Manual Data Input When you click [Manual] from TSPE's Data Import screen, the following displays. (This screen also displays following the importation of a data file, allowing you to manually edit the P&L file.) Note: This is an incomplete data entry screen. Your P&L record should include at least 50 entries for a valid analysis. See "Getting Your P&L String Ready" for more information on appropriate input. As you can see from this simple interface, manual data entry is not a difficult task. However, if you will be using the same track record on multiple occasions, you may want to save it as an ASCII file through another program, and then import it into TSPE as needed. TSPE will not save the track record you enter here. Entering a track record: Simply click the first data entry box at the right of the screen and enter the dollar value of the profit or loss from the first trade on your list. Each line on this screen represents a single trade record. The order of trades has no relevance in the analytical process, so the sequence of trades need not be chronological. This is merely a convention to keep track of the input. Each P&L file can hold up to 300 entries. Use these guidelines to edit a P&L trading record: Enter all necessary values directly through your keyboard. TSPE will not accept inappropriate input, such as Page 180 User's Reference Manual Unfair Advantage a letter when a number is required. It is not necessary to use leading spaces for even columns. All entries are automatically right-justified. Press the down arrow ($) or click the next line with your mouse to advance through the entry form. Pressing <Enter> or <Tab> will NOT advance through the table. Do not skip a line. Enter the dollar amount of the profit or loss for the trade you are recording. You may enter dollars and cents (separated by a decimal point), but TSPE will automatically pad the values to the right of the decimal with zeros if no decimal is included. Do not use $ or +. Do use - to indicate losing trades. For example, a $1000 profit is entered as: 1000 A $1000 loss is entered as: -1000 You may enter either your net (after commission) or gross (before commission) P&L values, but be aware which ones you are using and don't mix both net and gross values in the same trading record. TSPE will allow you to adjust for commission and slippage later if necessary. Thanks to a new multiplier option available in this version of TSPE, you may also enter profits and losses in points! If entering point values, all entries MUST be based on the same point value. TSPE will allow you to enter the multiplier in the next screen, and will even find the proper value from within the UA database, if necessary. The left-hand side of this screen displays statistics about your P&L string. See P&L Statistics for more information. 8.2.3. Import ASCII File This feature lets you enter trade data into TSPE electronically, instead of typing your profits and losses manually. This feature can be a real time saver if you have or can produce an ASCII file suitable for import into TSPE. TSPE is fairly liberal on the type of data it will accept. Please see "Getting your P&L String Ready" in the Getting Started with TSPE chapter for details. When you click [ASCII] from TSPE's Data Import screen, the following displays: User's Reference Manual Page 181 Unfair Advantage This example shows the default UA directory with the file name "RSIcornPL.txt" selected. This file was previously saved there and was selected by scrolling through the directory. Either type or select the ASCII file (note file extension .txt) you wish to load into TSPE and click [Open]. The Manual Data Input Screen displays, where you can review your input, edit as desired and review the P&L Statistics. 8.2.4. Import TradeStation System Report This feature lets you enter trade results generated by Omega Research's TradeStation software into TSPE. When you click [TradeStation] from TSPE's Data Import screen, the following displays. If you have already prepared a TradeStation Report as described in "Getting Your P&L String Ready," then Page 182 User's Reference Manual Unfair Advantage you can just click [OK] here. If not, go through the following steps to perform a TSPE/TS 2000i conversion. 1) Launch TradeStation 2000i 2) Select Insert Analysis Techniques by right-clicking your mouse anywhere in the chart. 3) Choose your analysis technique, MACD, for example. 4) Once TS had displayed the MACD on the AMGEN chart, click on VIEW/SYSTEM REPORT. The system report is now ready to be saved by pressing the picture of the floppy diskette. It is important to save the system report to sysrep.xls (sysrep.xls may be saved to any drive to directory). You can now get back into UA and proceed to this spot again. Click [OK] at the above screen. The following displays: Click [Open] to use the sysrep.xls file. The Manual Data Input Screen displays, where you can review your input, edit as desired and review the P&L Statistics. 8.2.5. P&L Statistics The Manual Data Input screen displays for entering data manually and for editing data that has been imported into TSPE. The left-hand side of this screen displays statistics about your P&L string: User's Reference Manual Page 183 Unfair Advantage Use the scroll bar at right to view more rows of information about your trading record. Click any heading to change the sort order. These entries change as you edit the trade records in the right-hand column (see Manual Data Input). Click [OK] to proceed with more information about your trade record. 8.2.6. Contract Size Multiplier After entering the profit and loss records from your trading system, either though manual entry, importing from ASCII or from a TradeStation System Report, you'll need to elaborate on those records through several additional screens within TSPE. The first of these, shown below, is designed to adjust P&L records from trading systems that report profits and losses as POINTS, rather than dollar values. TradeStation users must adjust this entry, because it reports POINTS, not dollars in System Reports. Enter the dollar value of one full-point move: For any track record showing dollar profits and losses this value is always 1.0. A track record showing points of profit and loss will likely require a different value. Page 184 User's Reference Manual Unfair Advantage Stock traders will generally leave this entry as 1.0, but commodity pricing can be more complicated. If you don't know the point value for a commodity, TSPE will enter the amount for you using information form UA's Commodity Factsheet. Click [Find] and then scroll through the database listing to find the commodity used in the analysis. (Change the sort order as desired.) Click the box to identify your choice, then click [OK]. When this screen is complete, click [Next] to tell TSPE about the commission and slippage involved in your trading record. 8.2.7. Choose Commission & Slippage Once you have completed TSPE's Contract Multiplier screen, the program asks you more about the profits and losses you have entered: Dollar Round-Turn Commission: Here you'll enter the dollar amount of the average round-turn commission for the trades in your file. This is a very important entry, as the cost of trading can make a big difference in the profitability of a trading system. Enter zero (0) for commissions only if they have already been reflected in the profits and losses you entered. Dollar Slippage: Slippage is the difference between the current market price and the actual trade price, which can vary with market activity. Enter the average slippage (in dollars) for the trades in your file. One or one-and-a-half trading ticks are usually sufficient. Enter zero (0) for slippage only if your track record represents actual trading results. In the course of executing TSPE, slippage is deducted from all simulated trades after it is exponentially randomized. This is an appropriate convention because slippage tends to follow an exponential distribution pattern. Liquid markets could give up little or no slippage, whereas lightly traded markets tend to require more of a penalty. Be aware that some analysis software programs use a default response of zero (0) for the commission User's Reference Manual Page 185 Unfair Advantage charge and the slippage "tax." When these defaults are used, many marginal systems would, due to that liberty, be cast in an undeservedly favorable light. If commission and slippage charges are understated with your analysis software, TSPE will accept additional dollar costs of commission and slippage that will approximate a more realistic assessment of those charges. When these entries are complete, click [Next] to correct for sample size and parameters, and to select the correction value. 8.2.8. Correct for Sample Size & Parameter Count Once you have identified the commission and slippage involved in your track record, you must enter important information about the trading system itself: Sample Size: The sample size is filled in for you. It is the number of trades included in your track record. We recommend at least 50 P&L inputs. See "The Importance of an adequate sample size" in the discussion of The TSPE Model (in TSPE Overview). Number of Independent Parameters: Generally speaking, a parameter is any restriction used to generate trading signals. Since each parameter adds more artificial control over a hindsight evaluation, TSPE compensates within reason for the artificially-inflated profits they produce in simulated trading. When an actual trading record is analyzed, the number of parameters or restrictions used in generating signals has no relevance on the validity of the P&L string. We do assume that some user bias is included in all trade records, so the minimum accepted response of 1 should be entered here for an actual trading record. Counting Parameters for Simulated Track Records We expect that TSPE will be used most often to evaluate trading systems or programs that have been purchased. Most toolkit programs are loaded with parameters, so we've listed the parameter count for a few popular studies as examples below. Page 186 User's Reference Manual Unfair Advantage We hope these examples will help you learn to count parameters in your own trading systems. If you need additional assistance with this, feel free to contact the CSI service staff. They will record the pertinent information about your trading system and get back to you with a parameter count. Examples of Parameter Counts Public domain study RSI Sum = MAC/D Parameters 1 1 1 3 Parameter description Enter length of RSI? Enter top threshold Enter bottom threshold Enter MACD period 1 Enter MACD period 2 Enter signal period Sum = 1 1 1 3 Enter period length? Regular or slow? Enter length of moving average? Sum = 1 1 1 3 Enter period length? Top index value? Bottom index value? Sum = 1 1 1 3 Stochastic William's %R The mathematician who does not use off-the-shelf programs may need to consider other factors in calculating the parameter input. If the analyst has a graphic chart of price history for the stock of General Electric, for example, one might conclude that a first degree equation fits the data very well. A first degree equation is a straight line. Only two points sighted or fitted through the chart would exactly define the line. A straight line model takes one degree of freedom which is considered 1 parameter. A second degree equation polynomial) consumes two degrees of freedom, making the parameter count two. A third-degree equation consumes three degrees of freedom which would be counted as three parameters, etc. Total Correction: This entry determines how conservative corrections will be when the software corrects results for likely forecasting error. This is simply an adjustment involving the number of parameters and the sample size that requires one of the following equations. Click the symbol to the right of the selection box to drop down the following menu: When applying any of these correction factors to a given positive P&L result, the positive profit is replaced by the given profit divided by the equation factor; negative profits are replaced by the product of the equation factor and the given negative profit. The generous and moderate selections use a technique known as the Akaike Correction, which is less severe than the CSI Correction used for the normal and conservative User's Reference Manual Page 187 Unfair Advantage selections. The Akaike correction translates into a requirement of relatively less capital to meet a given goal than the CSI correction requires. Make your selections from this screen, then click [Next] to view a graphic display of your P&L string (including TSPE corrections). When a third party's Performance Summary suggests a profitable system, be aware that a winning simulation could easily deliver a substantially negative result in actual trading. Here's why: Every trading system is controlled by one or more parameters that, in a very real way, fit the data to the chosen system under study. Matching data with a technical remedy could force a non-repeatable circumstance because you, the developer, would allow the historical data to be analyzed against your personal study rules. Your choice of market or system could be based solely upon simulated performance results, which will pose a problem when excessive parameter control is innocently introduced. A moving average crossover study requires two parameters: a short term moving average and a longer term moving average. Two-parameter systems are less likely than one-parameter systems to return a profit in real life. A less constrained one-parameter system example could be a breakout system, which will execute trades into an opposing long or short posture when the market moves out of a trading range. Your parameter consumption quantity reveals much about how your P&L string was prepared, so the mathematics can assess the validity of the profits and losses. In general, the fewer parameters, the better the anticipated result because TSPE imposes a disclosed penalty for excessive parameters. 8.2.9. View Frequency Chart After you enter your parameter count, TSPE begins working on a profit frequency chart (shown below). This chart is the simulated Frequency of Profits and Losses. In practice, you'll notice that the input P&L string has been somewhat degraded to account for the hindsight performance. This chart may be better understood by right clicking the mouse to increase (or decrease) the number of bins shown on the screen. "Corrected P&L After Slippage" is the expected profit from the P&L trading record in the control file, less any necessary corrections for commission and slippage. Click [Next] to proceed with the TSPE analysis. Other options on this screen: Print - Click [Print] to print the chart. Page 188 User's Reference Manual Unfair Advantage Back - Click [Back] if you want to go back and change your input. Cancel - Click [Cancel] to exit. Help - Click [Help] to reach the on-line manual. 8.3. Step 2 - Choose Your Goals 8.3.1. Profit & Time Targets Once you have dismissed the P&L chart, TSPE goes on to ask you about your goals for this trading system with the screen below: TSPE calculates default values for the Profit Target and Time Target based on the input of your P&L string. These values represent reasonable expectations from the trading system represented. You might begin TSPE evaluations with these default values and then adjust, as needed, according to the considerations below. Target Profit (Goal): You should attempt to identify a goal commensurate with expected investment risk. TSPE can readily compute required investment capital, but it cannot simulate a market trading program without knowing what would be a reasonable dollar objective or goal. It could take a couple of simulated trading exercises with TSPE to refine the targeted goal. The default response is generated from your input P&L. Just about any investor knows what he might earn without any appreciable risk by simply visiting his local bank or examining published CD rates. Of course such a pursuit should take into account discounted losses due to real dollar inflation. Perhaps such an exercise should be a basic starting point in determining a reasonable goal. Another consideration related to the setting of a goal would be the number of trades one User's Reference Manual Page 189 Unfair Advantage might be willing to tolerate before taking his capital from the market and applying it elsewhere. This latter constraint, described below, has an elapsed time value which the trader should understand before he enters the market. The dollar level of goal specified should provide for a handsome return that will exceed nominal bank rates by some substantial multiple of bank rates less the economy's rate of inflation. Keep in mind that the probability of recovering invested capital plus goal should be as close to certainty as possible to undertake the planned investment. Time Target: This is the number of trades you would like to execute to achieve your stated goal. If it is less than 100, you may want to increase it and the Target Profit by a power of ten. This input makes it possible for you to compare your expected profits with those you might receive from interest-bearing alternatives. See "How the Number of Trades Affects the Probability of Marginal Performance" for more information on these two inputs." Click [Next] to view your results. 8.3.2. How the Number of Trades affects the Probability of Marginal Performance A trading system becomes profitable in practice when a given goal is achieved. The likelihood that a goal is met depends upon the dollar level of the goal and the time it takes to persist in one's trading when marginal results develop over time. Certain situations will occur that can be identified as marginal performance. Marginal performance will readily occur in any profitable system when profits and losses statistically alternate prolonging the ultimate targeted goal. In TSPE, the difference between the probability of preserving your capital (the center curve on the chart) and the probability of certain goal achievement is the difference between 1.0 and the values represented by the horizontal center curve on the performance chart for high levels of invested capital. This difference, for purposes of explanation, is known as the Probability of Marginal Performance. Choosing a very large, but unreasonable "Time Target" will force all scenarios for a winning system to approach 1.0, given that infinite capital is available and the Probability of Marginal performance is zero. If the Probability of Marginal Performance is, say 2% for a given level of invested capital, this means that 2% of the time you entered into a case where profits would not elevate you sufficiently beyond your invested capital to achieve your goal. It does not mean that you lost 2% of the time. It simply means that you did not achieve your goal. This is so because your invested capital remained intact. The TSPE user should understand that there will be occasions where capital is preserved, yet capital remained in place a finite percentage of the time. When both targets are entered to your satisfaction, click [Next] to view the Capital Analysis chart. Page 190 User's Reference Manual Unfair Advantage 8.4. Step 3 - TSPE Results 8.4.1. TSPE Chart The Outcome Probability vs. Capitalization chart shows the substance of the overall TSPE results. You might want to zoom in (as in the example using a right mouse click) to improve the visual resolution of the chart curves. Study the chart carefully before deciding to risk your valuable capital in pursuit of a predetermined goal. The Capitalization chart offers a fixed horizontal scale (logarithmic) that ranges from an invested capital of one dollar to as much as $10,000,000. The vertical scale shows linear probability that ranges from zero (no chance of goal achievement) to 1.000 (a 100% chance of goal achievement). The curves are drawn through a Monte Carlo simulation of your situation as determined from the inputs supplied. TSPE will display the exact x,y coordinates for the location of your cursor. This lets you use your mouse to clarify the values for the vertical scale showing linear probability and the horizontal scale showing your invested capital. The mouse position on the screen defines probabilities as a function of the selected invested capital. Once a coordinate is identified, you will immediately know the capital level required to achieve the goal (also shown in the chart heading) at the probability identified. The probability intersection points for the three curves on the y axis are identified as follows: "With capital of $5,300, a goal of $4,000 within 30 trades yields a win prob of 70.1%, a breakeven prob of 86.9%, and some capital left prob of 96.3. Please note that the number of trades supplied to the system affects the probability of winning, but that the residual capital remaining in your account is not lost. In effect, this is the probability of Marginal Performance (13.1% for the above example), as explained above. Chart Legend: BANKRUPTCY: The top curve in the above Capital Analysis chart shows the chance that drawdown will be any given number of dollars or less (see horizontal scale). The chance that drawdown will exceed the dollar value reading of the horizontal scale is 100 minus the vertical scale reading. CAPITAL PRESERVATION: The middle curve shows the probability of recovering the original capital stake (shown on the horizontal scale). Saying it in another way, given that we started with the horizontal scale reading, the chance that the account holds that balance or more is shown on the vertical scale. This curve represents the required probability for any given capital/goal level to return original investment capital back User's Reference Manual Page 191 Unfair Advantage to the investor without interest. GOAL ACHIEVEMENT: The vertical scale shows the probability that a given goal can be met with original capital intact (horizontal scale). This line represents the mean probability of reaching your stated goal at all capital stake levels. Low values indicate a low probability of reaching your goal and high values indicate a high probability of reaching that goal. The probability of reaching the goal normally increases as capital stakes are increased. The closer this curve gets to 1.0 on the vertical scale, the better the chance of achieving your goal with a given capital stake. Please note that the TSPE chart curves represent sampled results, so they are not necessarily a smooth and ever-increasing. TSPE is subject to sampling error. The solid line should be thought of as a reflection of a series of expected values. Read on for more about the Captial Stake Value. 8.4.2. Estimated Capital Stake This is an estimate of what you feel is the required capital to trade the system(s). The estimate given is used principally to cover the high end of the range of capital necessary to reach an achieved probability of .999. This estimate and the actual degraded P&L string profit (after parameter and sampling size correction) will combine to prepare the range of capital values shown on the charts. If care is taken to choose a capital stake that will likely produce a successful result, the capital stakes used to prepare the probability charts should be appropriately spaced. Please see the "TSPE Summary" for more information on interpreting results. 8.4.3. TSPE Summary By randomizing trade sequence, compensating for parameter control, factoring in the quantity of trades and taking commission and slippage charges into account, TSPE goes way beyond the information provided by most analysis programs. It may certify your efforts and confirm that you have found a sound trading system, or it may alert you to rethink and re-evaluate your technical approach. TSPE is a reliable safety net for all technical investors. It takes only a few moments to run the program and reduce your likelihood of unfortunate surprises, so no one should commence trading without it. 8.4.4. TSPE Article from CTJ More TSPE: Goal Selection and Chart Interpretation (From the February, 2000 CSI Technical Journal) In recent months we have devoted much attention to the way Unfair Advantage's Trading System Performance Evaluator certifies analysis results and assesses capital requirements in terms of probability values. As is often the case with innovative products, every bit of new information we supply brings more thoughtful questions from our customers. Several TSPE users have asked for tips on setting appropriate goals and interpreting results. We hope the following information helps. Engaging TSPE in an attempt to quantify your required capital stake commensurate with your suggested goal requires that you supply TSPE with a real or simulated record of profits and losses observed over time. After entering that string of performance numbers, you will be asked for your parameter count, profit goal and Page 192 User's Reference Manual Unfair Advantage a realistic setting for the number of trades you are willing to make to achieve your goal. Choosing a Goal The choice of goal is an important input for any TSPE analysis. The user should attempt to identify a goal commensurate with expected investment risk. TSPE can readily compute required investment capital (the horizontal capitalization axis on the TSPE display chart), but it cannot simulate a market trading program without knowing what would be a reasonable dollar objective or goal. It could take a couple of simulated trading exercises with TSPE to refine the targeted goal. Just about any investor knows what might be earned without any appreciable risk by simply visiting a local bank or examining published CD rates. Of course such a pursuit should take into account discounted losses due to real dollar inflation. Perhaps such an exercise should be a basic starting point in determining a reasonable goal. The specified goal should provide for a handsome return that will exceed nominal bank rates by some substantial multiple of bank rates less the economy's rate of inflation. Keep in mind that the probability of recovering invested capital plus goal (the vertical scale on the TSPE display chart) should be as close to certainty as possible to undertake the planned investment. Another consideration related to the setting of a goal is the number of trades one might be willing to tolerate before taking capital from the market. This latter constraint has an elapsed time value that should be understood before entering the market. A trading system becomes profitable in practice when a given goal is achieved. The likelihood that a goal will be met depends upon the dollar level of the goal and the time it takes to persist in trading when marginal performance develops over time. Marginal performance will readily occur in any profitable system when profits and losses statistically alternate, prolonging the attainment of the ultimate targeted goal. In TSPE, the difference between the probability of preserving one's capital (the center curve in the Capitalization chart) and the probability of certain goal achievement is the difference between 1.0 and the horizontal center curve for high levels of invested capital. This difference, for purposes of explanation, is known as the Probability of Marginal Performance. Choosing a very large, but unreasonable "Number of Trades" will force all scenarios for a winning system to approach 1.0, given that infinite capital is available and the Probability of Marginal Performance is zero. If the Probability of Marginal Performance is, say 2% for a given level of invested capital, this means that 2% of the time profits were not elevated sufficiently beyond the invested capital to achieve your goal. It does not mean that you lost an additional 2% of the time. It simply means that you did not achieve your goal. This is User's Reference Manual Page 193 Unfair Advantage so because your invested capital remained intact. The TSPE user should understand that there will be occasions where capital is preserved, yet capital remains in place a finite percentage of the time. Chart Interpretation TSPE has a couple of charts that should be briefly described. One is the simulated Frequency of Profits and Losses. In practice, you'll notice that the input P&L string has been somewhat degraded to account for the hindsight performance. This chart may be better understood by right clicking the mouse to increase (or decrease) the number of bins shown on the screen. The second chart, Outcome Probability vs. Capitalization, shows the substance of the overall results. You might want to zoom in (as in the example using a right mouse click) to improve the visual resolution of the chart curves. The Capitalization chart offers a fixed horizontal scale (logarithmic) that ranges from an invested capital of one dollar to as much as $10,000,000. The vertical scale shows linear probability that ranges from zero (no chance of goal achievement) to 1.000 (a 100% chance of goal achievement). The curves are drawn through a Monte Carlo simulation of your situation as determined from the inputs supplied. TSPE will display the exact x,y coordinates for the location of your cursor. This lets you use your mouse to clarify the values for the vertical scale showing linear probability and the horizontal scale showing your invested capital. The mouse position on the screen defines probabilities as a function of the selected invested capital. Once a coordinate is identified, you will immediately know the capital level required to achieve the goal (also shown in the chart heading) at the probability identified. The probability intersection points for the three curves on the y axis are identified as follows: "With capital of $5,300, a goal of $4,000 within 30 trades yields a win prob of 70.1%, a breakeven prob of 86.9%, and some capital left prob of 96.3. Please note that the number of trades supplied to the system affects the probability of winning, but that the residual capital remaining in your account is not lost. In effect, this is the probability of Marginal Performance (13.1% for the above example), as explained above. 8.4.5. TradeStation Example Studying the Anatomy and the Dangers of TradeStation® By Bob Pelletier (Adapted from the CSI Technical Journal, January 200) I have been attempting to unravel the mysteries of TradeStation (TS) for several months now, and have recently focused my attention on its "Strategy Performance" report that offers an "Account Size Required" for typical derived systems. The capital stake for most efforts was minimal, and I was eager to see if I might Page 194 User's Reference Manual Unfair Advantage score handsomely with the small capital outlay TS suggests. Could it really be as good as it looked? I put on my detective hat to find out. I selected the day-session T-Bond contract for the TradeStation study, because it is a very liquid and popular market. Due to the flawed nature of the Historybank.com database that comes with TradeStation, the first step was to substitute clean CSI data for TradeStation analysis. Many things can go wrong when attempting to develop a system, and the last thing I wanted to do was start out with a database that could not be trusted. Omega's Historybank.com, according to the Futures Magazine study published in September 1999, has an error rate that is 485% as high as the error rate of "the best" firm studied, which was CSI. It took about an hour of my time to wrestle through the many options and introduce the range of parameters that TS would use to optimize the results. The method for achieving a profitable system with TS was not simple. I was concerned that I wasn't even given the opportunity to specify the trading commission and the expensive slippage tax, although I do remember having seen such a prompt on one occasion in an earlier exercise. I'm sure happy I don't have to make a regular habit of playing with that package. There are too few hours left in my life to spend another one struggling through that again. TradeStation studied T. Bonds for me over a two-year period from December 12, 1995 through December 12, 1997. It suggested a stop parameter and a slow and a fast moving average that seemed reasonable, based on a narrow range of settings for the three parameters. The Strategy Performance report showed that the system produced a very respectable $4,156 profit (before commissions) with a required account size of only $1,438. Such a situation would reward the user with a "Return on Account" of an astounding 289%. With results like this, I thought, Bill Gates would have to move over, because I had already begun making plans to buy him out well before the Millennium became a blur in the past. The Strategy Performance report also showed that I could achieve those results in just 15 simple trades. With such a small investment, I was aching to call my broker to make that first trade. Back to reality - this is only a test! I needed to get a feel for whether TradeStation was on the up and up, and know whether or not the performance derived in hindsight would be possible in the future. Of course, it seemed remote that anything could go wrong in actual practice. After all, the performance summary showed that Gross Profits exceeded Gross Losses by a 2.4 ratio. How could I go wrong? The next part of my investigation involved evaluating the TradeStation results with Unfair Advantage's® (UA's) new Trading System Performance EvaluatorTM (TSPE). In the November 1999 and December 1999 issues of the CSI Technical Journal, we wrote about how one might certify or at least assess the risk of trading or repeating a given performance record. We talked about how this would be accomplished, and commented on how one might interpret the results. Please see those issues for more information. I entered each trade for the two-year test period into TSPE, and factored in a $100 commission and slippage expense per trade to compensate for these figures' exclusion from the TS analysis. In spite of Omega leaving out these real-world requirements, they were forced in place. The end results weren't good. TSPE said my account size should be $30,000 and that my chance of achieving a $2,656 goal (TS's aftercommission result) on a $30,000 investment would be about 89% (see right dot on chart). The probability of preserving my $30,000 capital was 98%. The probability of achieving the same goal on TS's $1,438 investment was only about 30% (left dot) and the probability of preserving my $1,438 capital was about the same. How could such a good system operate so poorly in projected operation? And how does TradeStation justify telling me that I will get rich when the likelihood of going bankrupt and losing my $1,438 capital stake is at least 70%? The three curves from top to bottom display as a function of invested capital (the horizontal scale) the probability (vertical scale) of remaining solvent, of retaining invested capital, and of reaching a specified goal. The dollar goal is an input not shown on the chart. The larger the dollar goal, the larger will be the separation between the bottom two curves. The more marginal the profitability of a given system, the larger User's Reference Manual Page 195 Unfair Advantage will be the separation between the top and middle curves. To force all curves to approach certainty of goal achievement requires unlimited trading, but residual invested capital will not be eroded should the trader suspend trading early. Before going further with my search for a profitable system, I frantically searched the TS documentation to understand the declared assumptions concerning the TS Strategy Performance Summary. Nothing! There was absolutely no mention of any declared assumptions! I inductively determined their assumptions from the factual output. Since the $1,438 account size matched up with the account's largest drawdown, I deduced that this was how TradeStation decided the maximum required account size. The apparent underlying assumption therefore, was that trade-by-trade results are not independent. In other words, there is a dependent sequence of trading outcomes that forces the very low drawdown. The resulting account size requirement, return on investment, and all of the superlatives and statistics reported in favor of the derived system were based on the chronological (serial) arrangement of the artificially derived profit-and-loss statistics. Omega could argue that the "Account Size Required" was a presimulation proving figure and not a post-simulation limit, but that would be contrary to the purpose of back testing a proposed technical method. The dependence assumption adopted by TS is a puzzling premise, given that markets are reactions to the unpredictable daily effects of weather, government policy, regional politics, employment rates, world trade, natural resource production, product substitutability, supply and demand, and many more factors too numerous to mention. Such influences strongly and absolutely contribute to market randomness, which in turn forces the necessary assumption of independence, not dependence, on the trade-by-trade results. Given the TS performance statistics, it would be impossible for the makers of TS to argue that their performance summary is based upon an assumption of trade independence. A simple change in sequence resulting in a clustering of losses would have measurably inflated the account size requirement, proving them wrong. What is there about TSPE that makes it assess performance in such a conservative light? As we explain in CSI's TSPE documentation, TSPE makes a critical conservative assumption known as "trade-by-trade independence." Independence, in a mathematical sense, is one of those buzzwords that most people dismiss as unimportant. You can see from TSPE's high capital requirement that independence bears heavily upon the result. When one gets into the trading pit, profits and losses tend to cluster together, as alternating profits and losses are statistically infrequent. Commission and slippage are taxes that must be paid. In the TSPE simulation, trading results are randomly sampled from the P&L list. The randomly compiled string of consecutive losses is allowed to amplify account size requirements, which will conservatively turn the odds against you. Another characteristic of TSPE has to do with parameter control. The moving average crossover study used and analyzed by TradeStation requires two moving averages and a stop limit. Each of these controls (3 in total) contributes to a reduction in simulated profits and a worsening of losses to account for the hindsight loss of statistical freedom. In spite of the above, I still hadn't totally given up hope on buying out Bill Gates. Giving Omega the benefit of the doubt, there was still something I needed to do to prove their result was repeatable. I wondered how that derived system would have done in the two-year period that lies after the two-year development period. If it worked there, perhaps further testing would give me some promise with my newfound TS system. A quick review of the unseen virgin period from 12/12/1997 to 12/12/1999 revealed that my system would have lost $3,843 on 15 more trades, inclusive of commission and slippage. The facts bear it out: TSPE did a good job of keeping me out of the market. Given the TSPE results and confirmation from TradeStation, it appears that not only will I not be able to buy Page 196 User's Reference Manual Unfair Advantage Bill Gates out, I won't be able to buy out Bill Cruz either. The mysteries of TradeStation are, indeed, unraveling. We can only advise caution and wariness. In spite of the ads, always read the escape disclaimer designed to protect the vendor and buyer beware. There is no free lunch. TSPE is said to "certify" a system based upon a review of the hindsight past or based upon the prospects of repeating actual experience. In the former event (hindsight), parameter control comes into play. In the latter case (repeatability of actual results), only sample size bears on the outcome. Parameter control causes degradation and sample size serves to overcome control parameter effects. In either event, the so-called certification is measured against a probability of achievement. In other words, certainty has only to do with the declared probability, always leaving a measured chance of ruin. One should assess that chance carefully. Trade-by-trade example of TradeStation study results: 588 -318 -475 556 -506 -725 4087 -162 -287 806 -693 493 -225 -6 -475 TSPE and TradeStation Using Omega Research's software, traders subject a given market to one of many possible studies such as moving average crossover, stochastics, RSI, and others. Once the choice has been made, stop-loss limits can be imposed, objectives can be targeted, and the paper trading commences. TradeStation supplies a "Performance Summary" that reports the maximum number of consecutive losses, the percentage of losses, the average profit, the average loss, the largest winning trade, etc., etc. A quick look at a Performance Summary reveals several assumptions that may be mitigated through TSPE. One important Performance Summary statistic is the number of consecutive losing trades that occurred in the actual or simulated past. If it is small and the overall profits and losses appear to alternate, then you may be in for an unpleasant result when you attempt to repeat that situation in real life. To find out how the system might play out, TSPE will simulate the trading system that derived the P&L string. Over and over again, it randomly selects (with replacement) from that P&L set. Don't be surprised if it reveals that the same set of outcomes may not be so opportune in practice, causing excessive drawdown and possible account bankruptcy. Understanding the Discrepancies The quantity of trades in a P&L input is very important in a TSPE evaluation, where a large quantity of trades restricts the degradation to actual experience. Any system with many trades that shows a favorable outcome in the Performance Summary will also show favorable results with TSPE, even with moderate freedom loss. User's Reference Manual Page 197 Unfair Advantage This is because many, many consistent profits significantly add to the credibility of a systematic approach and repeatability becomes statistically possible. More typical situations involving smaller sample sizes are not as reliable because a small sample suggests a less likely chance of repetition. A small sample size was the downfall in our example study. Although this may, indeed, be a profitable system, the limited amount of statistical data makes it impossible to certify that profitability will be sustainable. In a TradeStation Performance Summary, the quantity and percentage of winning trades must be viewed with a wary eye. Any trade ending with a breakeven result is counted as a profit! While every trader desires to achieve consistent winning performance, introducing faulty input through false assumptions is not helpful. The foregoing is not a criticism of Omega's software. We are simply suggesting that TSPE does much more. It will help keep you from misinterpreting the details by requiring an unbiased account of each trade. Page 198 User's Reference Manual Unfair Advantage 9. Trader's Accountant 9.1. Upcoming Release & Limitations This software is under development and will be included with Unfair Advantage in the near future. It will be a free upgrade, available to all UA subscribers who have paid the full license fee. An upgrade of the on-line manual with details on the new software will be included. Trader's Accountant Limitations for Trial Users Trader's Accountant is provided as a courtesy to UA subscribers who have paid the full Unfair Advantage license fee. All others may use Trader's Accountant a maximum of ten times on a trial basis. If you have not paid the full UA license fee, you will be limited to 10 uses of Trader's Accountant. Don't waste them! If you are a trial user of UA or if you have not paid the full UA license fee, your Trader's Accountant will become non-functional after ten uses. You may restore full capabilities by upgrading to a regular UA subscription. Contact CSI marketing for details at (561) 392-8663 or (800) 274-4727. We reserve the right to change this policy at any time. User's Reference Manual Page 199 Unfair Advantage 10. Third-Party Software 10.1. Writing Export Format Files Most third-party software that is compatible with UA (such as MetaStock, TradeStation, One Day at a Time, spread sheets, etc) use one of the export file formats: • • • • CSI Format MS (MetaStock) Format CSIM Format ASCII Format During the data distribution process, Unfair Advantage automatically writes the export format files specified in your portfolio to disk. UA offers a couple of additional methods to quickly and easily update your export format files whenever you want current data for analysis. Your exported files will be placed in the folders you identified in your portfolio. To review where the files will be located or the specific parameters used in creating continuous files, right-click any contract or stock in your portfolio listing and then click "Properties." Use the "Change Format" feature on the Portfolio menu to select the desired format. Please note that UA's Rounding/Ranging tab of Data Options (from the Options menu) includes three features that affect UA charting as well as data written to export format files. They are: Making Close in High/Low Range, Show Mutual Fund Loading and Force Tick Integrity. Please refer to these options in the Charting chapter for more information. Writing All Export Files by Manually Distributing Data As stated above, UA creates Export Format Files during the data distribution process. Although distribution is required after daily updates (it normally occurs automatically), you may initiate the process manually at any time. Doing so will write all Export Format Files listed in your portfolio, along with all the other processes included in the distribution. From the Initiate menu, click "Manual Database Distribute." Writing all Export Files without Data Distribution To write all export format files, click any item in your portfolio list and then right-click your mouse. Click "Select All" from the menu as shown: Page 200 User's Reference Manual Unfair Advantage Everything in your portfolio will be selected. Right-click your mouse again, then click "Write File" from the menu. UA will write all files to disk as specified in your portfolio. You'll note that every active file is rewritten from start to end, assuring that any changes in contract specifications, error corrections and adjustments to raw or computed continuous files will be incorporated. Writing Individual Export Files without Data Distribution To write any single file for export to another file format, simply click the desired file on your portfolio list, right click your mouse and then click "Write File." This procedure will write only the file you selected, and can be repeated as necessary. Writing an Export Format File that is Not In Your Portfolio Use UA's Send Data to Third Party Software feature to write files that are not listed in your portfolio. 10.2. Send Data to Third Party Software This feature allows you to write an export format file for a contract or stock that is not in your portfolio (not recommended). To write a file to disk that is not in your portfolio, you must identify the desired market, series, format, etc. just as if you were adding the item to your portfolio. Start by clicking the third icon on the toolbar, "Send to third-party software." The process is exactly the same as for portfolio additions, so we won't repeat the instructions here. The only difference is that your entries will not be saved for automatic updates in the future. We recommend adding all contracts of interest to your portfolio. Failure to do so will mean that you must enter all the information each time you want to update your export format files. User's Reference Manual Page 201 Unfair Advantage 10.3. Analysis Without UA When you have finished downloading and distributing data with UA, you may begin using UA's own charting and analysis features (if desired), or you may leave UA and begin analysis with your third-party program. Exit UA by clicking the Initiate menu and then clicking "Exit," or simply click the close box in the upper right hand corner of your screen. Launch your analysis software normally and begin analysis with the only market data firm proven* to be superior to all other world firms studied. An alternate method of exiting UA after data distribution is found on the Daily Distribution screen of Data Options. There you can enter the command line to launch your analysis program automatically. Please check this manual to see if specific information is available to streamline compatibility with your specific analysis program. *In an independent study of ten of the most visible world class commodity data firms, CSI was chosen to be "the best" firm studied. Application Programming Interface Unfair Advantage is provided with an Application Programming Interface (API) which permits programmers/developers to access an ASCII comma separated format memory image of data spooled directly from UA's compressed database. With the API, there are no files or directories to be concerned with, as data is passed to your application via the clipboard. The API is extremely powerful in that all of the hundreds of UA markets and contracts are available for instant study through software and programs supplied by the user. Because no formats are specifically required, the effort to get started with this interface could be minimal. The data is presented as numerical quantities of contract open, high, low, close, volume, open interest, date (century included) etc. for a continuous time series arranged in historical order. UA fulfills ad-hoc requests through an OLE automation interface designated API2. This allows a client application to search through the set of markets and the series available for each market. It also allows for any series to be retrieved in binary or ascii formats. API2 is fully documented in the file c:\ua\uapi\funcspec.doc titled "UNFAIR ADVANTAGE API (API2) FUNCTIONAL SPECIFICATION" which we refer to as the "API2 document." Developer's Document CSI maintains a document called "Programmer's Guide to Unfair Advantage" on the website at: http://www.csidata.com/ua/devdoc.htm. This document contains information designed to help system developers make the best use of Unfair Advantage and the UA database. The Programmer's Guide is available only through the website to avoid publishing obsolete information in printed form. It is updated as needed by Steven Davis. We recommend that developers check this document frequently to stay current with any changes or enhancements that may affect your applications. Page 202 User's Reference Manual Unfair Advantage 10.4. CSI and CSIM/MetaStock File Formats CSI (QuickTrieve) format The CSI (QuickTrieve) format uses a master file called QMASTER for each directory which identifies the content of the individual data files. The file naming process assigns names as: F001.DTA where the first character is always an F, and the next three characters are a right-adjusted number from 1 to 120, which identifies the file record number (not the CSI commodity or stock number). The extension .DTA identifies this as a CSI format file. UA can write and maintain CSI format files if they are listed in your portfolio. Their description includes the complete path and filename, as in this example: C:\UA\DATA\F001.DTA Please see your QuickTrieve manual for specifics about the format. The MetaStock and CSIM format (for use with MetaStock) The MetaStock and CSIM formats use a master file called MASTER for each directory which identifies the content of the individual data files. There are two data files for each contract. The file-naming process assigns names as: F1.DAT and F1.DOP, where the first character is always an F, followed by an integer from 1 to 200, which identifies the file record number (not the CSI commodity or stock number). The extensions identify this as a CSIM format file. A CSIM file might be listed on your drive directory as : C:\UA\DATA\F1.DAT Many long-term CSI customers have previously used our QuickTrieve software to store data in the MetaStock format. Unfair Advantage offers improved compatibility and more flexible file creation options, such as customized Perpetual Contract data, nearest future contracts, etc. The CSIM format is published on CSI's website at www.csidata.com. 10.5. Data Options Affecting ASCII Files 10.5.1. ASCII Options Overview Click "Options" above the UA toolbar to pull down the Options menu. It offers two categories of options: Data options and Communications Options. The Data Options Screens offer several functions that affect ASCII files, including: • • • • ASCII Field Layout ASCII File Names ASCII Misc. Rounding/Ranging User's Reference Manual Page 203 Unfair Advantage 10.5.2. ASCII Field Layout When writing files to ASCII format, the record layout of the resulting fields depends upon your selections on the ASCII Field Layout tab of Data Options (through the Options menu). The available user settings are shown here: Layout as: The "Layout as" box identifies all the fields (records) that will be included in your file. Indicate your preferred layout by entering the fields in sequence (using the codes shown) in the "Layout as" box. In the example, DOHLCvi would result in files that would include the Date, Open, High, Low, Close, contract volume and contract open interest, in that order. The codes VI would replace vi if this file held total volume and open interest in place of contract-level values. Enter any combination you desire, keeping in mind that D (for date) must come first. Form Columns: Check the"Form Columns" box if columns are desired. Your specifications on the ASCII Field Layout screen will be used to create ASCII output files for use with other programs. These files will be placed on your hard drive according to your wishes as described in your UA portfolio. Your ASCII files will have descriptive names, allowing you to recognize one from another (in most cases) based upon your Filename Definitions and your portfolio requests. Click OK to save all your changes. 10.5.3. ASCII File Names Third-party user applications demand files that are uniquely identified through the assignment of file names. UA makes it possible to construct these unique file names for your special application purpose. When writing files to ASCII format, file names of the resulting files depend upon your selections on the ASCII File Name Page 204 User's Reference Manual Unfair Advantage tab of Data Options (through the Options menu). The available user settings are shown here: Name by: ASCII filenames for commodity contracts will be created based on your selection in the "Name by" box. To determine the file naming conventions for your ASCII files, enter the abbreviations shown for your desired fields in the order in which they should be presented. In the example, SCYA (the default) means the filename will include the commodity symbol (S), the century (C) the year (Y) and the alphabetic delivery month code (A). Force Extension: Click .PRN or .TXT to select either of these as filename extensions. If you prefer to use one of the fields as an extension, type a period (.) followed by the abbreviation shown. For example, to use the exchange as the file extension, add .E to the output format definition (SCYA.E). Great care should be taken in changing the filename definitions from the default entries shown above. Deviating from the default can result in confusion with regard to the specific delivery month or computed contract in question. CSI's Technical Support staff may not be able to assist with problems resulting from custom filename and field definitions. Click OK to save all your changes. 10.5.4. ASCII Misc. When writing files to ASCII format, your preferences for inclusion of a header line (or not) and the handling of holidays are controlled though the ASCII Misc. screen of Data Options (through the Options menu). The available user settings are shown here: User's Reference Manual Page 205 Unfair Advantage Include Header Line: A header line is the first line of the file, which identifies the columns with headings such as "date," "open," "high," etc. To include a header line with your file, click the box. Handle a Holiday by: This refers to how Unfair Advantage deals with daily voids in the data file when no market data is reported. Such voids are usually weekday holidays for which no data is included in the file. These could be days that were not holidays, but for which no trading took place in a particular market. Unexplained "Holidays" could also be the result of a corrupted database file. The choices for presenting data fields for "holidays" in ASCII files are: • No record for holidays - This eliminates all gaps in your data files, but may obscure problem areas where no data exists. • All prices zero for holidays - Zero prices make some trading systems crash. • Duplicate previous day's prices for holidays - This eliminates gaps, while avoiding troublesome zeros in your files, but can produce misleading results in series with multiple voids. Click OK to save all your changes. 10.5.5. Rounding/Ranging All options found on the Rounding/Ranging tab of Data Options (on the Options menu) affect the processing of data for use with third-party software, as well as for analysis with UA. ASCII files produced with UA will use the same "Making Close in High/Low Range," "Force Tick Integrity" and "Show Mutual Fund Loading" entries as UA charts. Page 206 User's Reference Manual Unfair Advantage These options are listed in this manual as "Data Options That Affect Charting." Please see their descriptions in the "UA Charts" chapter. 10.6. Data Options Affecting CSIM & MS Format 10.6.1. CSIM/MS Options Overview Click "Options" above the UA toolbar to pull down the Options menu. It offers two categories of options: Data options and Communications Options. The Data Options Screens offer tabs that affect CSIM and MetaStock format files, including: • Volume/Open Interest • Rounding/Ranging 10.6.2. Volume/Open Interest The MetaStock and compatible CSIM formats do not support both total- and contract-level volume and open interest for the same data file, but you may select which will be included in your files. Click the CSIM/MS Format Options tab of Data Options (from the Options menu) to view your choices: Click your choice of: • Total volume and open interest, reflecting these values for all contracts of the selected commodity User's Reference Manual Page 207 Unfair Advantage • Contract volume and open interest, where these values will reflect only the given contract being studied Your response here will apply to all CSIM and MetaStock format files created by UA. Click OK to save all your changes! 10.6.3. Rounding/Ranging All options found on the Rounding/Ranging tab of Data Options (on the Options menu) affect the processing of data for use with third-party software, as well as for analysis with UA. MetaStock and CSIM files produced with UA will use the same "Making Close in High/Low Range," "Force Tick Integrity" and "Show Mutual Fund Loading" entries as UA charts. These options are listed in this manual as "Data Options That Affect Charting." Please see their descriptions in the "UA Charts" chapter. 10.7. Data Options Affecting CSI Format 10.7.1. CSI Format Options Overview Click "Options" above the UA toolbar to pull down the Options menu. It offers two categories of options: Data options and Communications Options. The Data Options Screens offer tabs that affect CSI (QuickTrieve) format files, including: • • • • Files Per Directory Volume/Open Interest Compatibility w/Third Party Software Rounding/Ranging 10.7.2. Files Per Directory QuickTrieve and many third-party charting packages can process a limited number of files in a single directory (folder). UA normally limits CSI-format directories to 120 files each to accommodate these packages. This option is controlled through the "CSI Format Options" tab of Data Options (from the Options menu), as shown below: Page 208 User's Reference Manual Unfair Advantage If you know that the 120-file limit is not needed for your application and you want to expand this value, click the radio button next to 999. This will raise the maximum number of files in NEW directories to 999. It will not affect existing directories on your drive. Click OK to save all your changes. 10.7.3. Volume/OI By default, a CSI-format file created with UA holds both total and contract-level volume and open interest. However, some versions of QuickTrieve and perhaps other compatible programs are unable to process data reported this way, resulting in charts with no volume or open interest showing. This option corrects the problem by placing the same values in both the total and contract-level fields for volume and open interest. This option is controlled through the "CSI Format Options" tab of Data Options (from the Options menu), as shown above (see Files Per Directory). If you are unable to display volume or open interest in your CSI format data, decide which method you prefer for reporting volume and open interest, and click your choice. Click OK to save all your changes. 10.7.4. Compatibility w/3rd Party What If Software This feature includes the prompt, "Maintain at least ____ holiday records at end." It literally adds extra trailing days beyond the current date to each data file. This might be useful for programs that need additional days to forecast future prices, or for manually entering actual or what-if prices. User's Reference Manual Page 209 Unfair Advantage This option is controlled through the "CSI Format Options" tab of Data Options (from the Options menu), as shown above (see Files Per Directory). The default value is 14, but you may enter as many days as are necessary for your system. Click OK to save all your changes. 10.7.5. Rounding/Ranging All options found on the Rounding/Ranging tab of Data Options (on the Options menu) affect the processing of data for use with third-party software, as well as for analysis with UA. CSI Format files produced with UA will use the same "Making Close in High/Low Range," "Force Tick Integrity" and "Show Mutual Fund Loading" entries as UA charts. These options are listed in this manual as "Data Options That Affect Charting." Please see their descriptions in the "UA Charts" chapter. 10.8. Recommended Settings & Considerations 10.8.1. MetaStock Required Format Equis International's MetaStock software was designed to read and process files in the proprietary "MetaStock Format." The structure of this file format may change at the discretion of the software vendor, as may access to such information. Since MetaStock does not read the Unfair Advantage compressed database directly, analysis with MetaStock requires the use of Export Format Files. UA allows you to specify the Export Format File type while creating your portfolio, so it is a simple one-time process to set up MetaStock-compatible files. To avoid problems with undisclosed or unexpected format changes, CSI independently developed the MetaStock-compatible CSIM format. This format has no known incompatibilities with the MetaStock (MS) format, but has greater stability when used with Unfair Advantage. Although both MetaStock and CSIM formats are available on UA's selection screens, we recommend that all customers needing MetaStock format data use the CSIM format produced by Unfair Advantage. Total or Contract Volume and Open Interest A MetaStock format data file cannot hold both total and contract-level volume and open interest simultaneously for a single market. Therefore, you must select your preference before file creation. This is controlled through CSIM/MS Format Options tab in Data Options. MetaStock users typically use Contract Volume and Open Interest. Automatically launching Metastock after Data Distribution UA has the capability of launching a third-party analysis program after a successful download of new data Page 210 User's Reference Manual Unfair Advantage (with distribution). To use this feature, go the Options menu, Data Options, and click the "Data Distribution" tab. At the bottom of the screen, you'll find the prompt: After distribution is complete, execute the command c:\MS\MS.exe Enter the command shown in the above example - your drive designator (c:\), your MetaStock directory (MS\) and the executable file for starting MetaStock (MS.exe). 10.8.2. One Day at a Time Portfolio Selection UA comes to you with a pre-set One Day at a Time portfolio that can be selected upon installation. This is the recommended portfolio for One Day at a Time users. You may download the current One Day at a Time portfolio through CSI's website. See "Downloading a Portfolio" in the Portfolio chapter for details. Communications Options A special setting is required for analyzing data with the Delta Society's One Day at a Time software. UA's automatic processing of multiple days of data runs counter to the requirement to step through the data "one day at a time." That's why UA gives the option to "Prompt between each day's distribution." To activate, click "Options" above the UA toolbar to pull down the Options menu. It offers two categories of options, which are Communications Options and Data Options. Click Data Options. Click the Daily Distribution tab on the Data Options screen, where you should check the box (click it) beside "Prompt between each day's distribution." When retrieving multiple days of data with UA, you'll have the option of halting the distribution after each day of data. You should do so, then exit to One Day at a Time to process the data BEFORE distributing the next day. Use "Manual Database Distribute" from UA's Initiate menu to add the remaining days to your database, stopping for analysis with One Day at a Time after each day is distributed. 10.8.3. Vantage Point Portfolio Selection UA comes to you with a pre-set Vantage point portfolio that can be selected upon installation. This is the recommended portfolio for Vantage point users. You may download the current Vantage Point portfolio through CSI's website. See "Downloading a Portfolio" in the Portfolio chapter for details. 10.8.4. Omega Research Recommended Export File Format Omega Research's software can read the CSI format, ASCII files and the MetaStock/CSIM format. Each of these formats has its own strengths and weaknesses, but overall, the CSIM format seems to work best with User's Reference Manual Page 211 Unfair Advantage these products. Therefore, for analysis with Omega Research software (TradeStation, System Writer, Ti2000), we recommend you select CSIM format for your Export Format Files. Two-Character Commodity Symbols for Omega Research Compatibility Despite persistent advice to conform to industry trends, at the time of this printing, TradeStation and other Omega Research programs still do not recognize exchange-assigned commodity symbols of three characters or more. While two-character symbols were the norm through the 1980s, this convention became woefully outdated during the 1990s, when the commodity industry exploded with new products throughout the world. Overseas commodities are typically identified by three-character symbols, which are also used for various specialized series. Click the Options menu, then Data Options and go to the "Displaying Data" tab, to reveal the Symbol Size prompt as shown: Click the box in front of "Force two-character symbols" to use only the symbols identified in the factsheets in the "2 Char Symbol" column. You'll note that these symbols are not necessarily representative of the commodity name, and often include characters such as #$%, etc. The use of these special characters artificially expanded the quantity of two-character symbols available. How to Open Unfair Advantage Data Files in Omega Trade Station The following instruction will help you to open Unfair Advantage data files with Trade Station after you set up and write the files through Unfair Advantage. Page 212 1. 2. 3. Run Omega Research Trade Station. Select Open New Workspace Select the "Create a Trade Station Chart Window" 4. In the Show section, select 3rd Party Directory 5. Click New Dir. 6. In the Data Type list, select the format in which the data is stored. 7. In the Directory box, enter the exact path for the directory. User's Reference Manual Unfair Advantage To select the directory, click Browse. Navigate through the data tree by clicking on the appropriate path until you find your directory. Click OK. The specified directory is placed in the Directory box. If you don't know the path, or you want to add multiple directories at once, you can use the Scan feature. See the instructions below. 6 Click OK. 7 The directory is added to the drop-down list. 8 Select the commodity or stock and click on Plot To add multiple directories at once using the Scan feature: 1 In the Show section select 3rd Party Directory. 2 Click New Dir. 3 In the Data Type list select the format in which the data is stored. 4 Click Scan. 5 Enter the drive letter you want to scan for data directories (e.g., C). 6 Click OK. Once the scan process is finished, any directories containing data in the specified format will be listed in the Directory drop-down list. TradeStation and TSPE When using TSPE to analyze a trade record generated by Omega's Trade Station(R), you must supply a multiplier to convert trading units to dollars. Export to Omega's RadarScreen(R) User's Reference Manual Page 213 Unfair Advantage Not currently supported - This feature was added to Unfair Advantage in an effort to compensate for the restrictive architecture of RadarScreen, which makes it very cumbersome to use any database other than the History.com data provided by Omega Research. After problems with Beta Testing, we decided not to support this feature and to recommend against its use. "Export to Omega's RadarScreen" is included in the software for possible future development. Some background: Since Sheldon Knight's "How Clean Is Your Data?" article appeared in the September 1999 edition of Futures magazine, we have received many calls from people wanting to know how to use CSI data with their trading software. RadarScreen, which is Omega Research's 2000i product, was a program of special concern. Data format compatibility was not really the problem; it was more a matter of convenience (or lack thereof). While Omega requires only 10 or 12 mouse clicks to use RadarScreen with all of the stocks in their own historybank.com database, any outside database requires about 40 keystrokes per stock, plus a requirement to enter the stock symbol twice and the full stock name once. The 2.7 million required mouse clicks take the bulk of the time to identify all of CSI's stocks with Omega's 2000i product. Whether or not it was the intent, the result of these extra mouse clicks is to effectively discourage use of any third-party database. Since so many Omega customers wanted to use CSI data with their RadarScreen, we added the Stock Scanning feature to UA along with this utility for complete compatibility. These enhancements reduce the cumbersome procedure to a totally automated 14-step process. The steps are fairly easy to apply, but the process takes considerable disk space, and one very long step must be endured to get the job done in perhaps one full weekend. Due to the unusual length of this procedure, we do not recommend its undertaking. If you missed Mr. Knight's article, you may be wondering why anyone would go to such lengths simply to use a different data supplier. The article reported that Omega committed some 21.75 errors and omissions per year per data symbol; whereas CSI, the best overall vendor, committed 4.48 per year per data symbol (based on a controlled study using S&P 500 futures and CBOT commodity). If equivalent performance can be extrapolated to stocks, then the result of any trading experience might be dramatically improved by using CSI for your analytical work. Omega's projected error rate of 21.75 errors per year (250 trading days) translates into .087 errors per day. If RadarScreen scans a 30-day period for any given stock, the chance that all 30 days of data is error free is less than 6.6%. Investing real dollars on such slim prospects of accuracy would, it seems, certainly violate anyone's level of tolerance. A summary conclusion of the Sheldon Knight study compared the performance of Omega's data bank with CSI using a simple breakout system and found that Omega's profit performance, over a two-year period, varied by as much as 50% below that of CSI. Data source does make a HUGE difference in results, not to mention the enormous waste of time in analyzing thousands of stocks without gaining a sound conclusion and dependable course of action. To their credit, Omega allowed us to run an advertisement in their Omega magazine demonstrating the superiority of CSI data over their own. In a full page letter in S&C Magazine's Nov. '99 edition (p. 27), Bill Cruz of Omega Research said in the introductory topic sentence of his letter, "Your financial success is important to us." If he really means that, perhaps he will listen when you ask that he make his products work as well with outside databases as with his private label database. UA's Stock Scanner offers a number of methods for filtering stocks with clean CSI data. If you would like to suggest a screening technique for use with our stock scanner, please e-mail your ideas and/or algorithm to [email protected] for consideration. Any additions will be made available for all UA subscribers. Page 214 User's Reference Manual Unfair Advantage 11. Data Resources 11.1. Factsheets 11.1.1. Factsheet Overview At CSI, we believe it is vitally important that accurate records about the database itself be available to the user. The factsheets offer extensive information about the data you received from CSI, with separate listings for commodities and stocks. The information in the factsheets is provided for your information and is also used for processing the data. To view the UA factsheets, click the Initiate menu and then select "View Factsheet, or click the "Display Factsheet" icon from the toolbar. The commodity (futures) factsheet displays: The information in the factsheets can be edited as described in the "Editing the Factsheets" section of this User's Reference Manual Page 215 Unfair Advantage manual. For an expanded view of any column on the factsheet, position your mouse on one of its boundary lines and press the mouse button. Still holding the mouse button down, drag the line to the desired position. Release the mouse button to drop the line at the new location. Sorting the list, Locating an item and Selecting Market Type Market Type: At the upper right of your screen is the "Market Type" box, which determines whether the stocks & funds or commodity factsheet displays. The default is "Commodities." To switch to stocks & funds, click the down arrow symbol to the right of the Market Type box, then select your choice from the drop-down menu. Once you've got the right factsheet displayed, use one or both of the other boxes across the top to find the commodity or stock of interest to you. Sort Order: The database listings can be sorted by your choice of CSI number (the default), symbol, exchange, name, conversion factor, trading months or any of the fields in the fact sheet. To change the sort order, either click he down arrow symbol to the right of the "Sort" box, then make your selection, or click the heading directly on the factsheet on which sorting should be based. The above example shows the Futures fact sheet sorted by number. Use the scroll arrows to navigate through the listing. Locating a commodity or stock: You can go directly to any commodity or stock on the factsheet (without scrolling) by typing its name, CSI number, symbol, or whatever relevant piece of information you know into the "Locate" box. The appropriate entry correlates to the "Sort" box at left. If the Sort Order is "CSI Number," UA will only accept a number for locating the item, and will search on the CSI number field. If you want to search by name, switch the "Sort" order to "Name," and then type the name in the "Locate" box. Likewise, to search by symbol, change the order to "Symbol" and type the symbol in the "Locate" box. Factsheet Fields CSI Number: Each commodity and stock has been assigned an arbitrary CSI number for cataloging purposes. CME Live Cattle is 2, Cocoa is 3, etc. Older, more traditional commodities tend to have lower numbers than later additions to the database. Some non-standard issues, such as cash markets and treasury issues, have numbers that are preceded by the letter x. West Texas Intermediate Sweet Cushing Oil, for example is number x207. Symbol: The exchange-sanctioned symbol is listed here. This will be used to identify all charts and files, unless an alternate two-character commodity symbol is requested through the Data Options menu (Displaying Data tab). See Symbol (2), below, for information on alternate symbols. Exchange: The exchange is listed again here, where it can be used for sorting purposes. Click the "Exchanges" tab at the bottom of your screen for the full name represented by each acronym. Name: The name of the commodity or stock. Non-standard cash and treasury issues (those with an x in the CSI number) may have their names preceded by an alternate number that is used by CSI's other software products. Page 216 User's Reference Manual Unfair Advantage Price Format (Conversion factor): CSI's system of tracking the markets depends heavily on a conversion factor system, which emulates pricing information to conform with pricing you would see in the newspaper the next day. The conversion factor system establishes the currency value of a given price using the last (terminal) digit or digits for interpretation. In many cases, the parent exchange uses the same common denominator of the raw price as we do. There are, however, some differences. The concept of conversion factors was introduced because there are no decimal points or fractions in the CSI database. It allows the receiving software to convert the raw database numbers to the appropriate values in terms of decimals, eighths, etc. Our earliest customers were all commercial banks and brokerage houses, which processed the data themselves through mainframe computers. They still need to know the conversion factors, as do the software programs used by most of our customers today. Unfair Advantage, QuickTrieve, MetaStock, and other software programs that use CSI data invisibly and seamlessly employ the conversion factor before displaying data on your computer screen or chart. PRICE FORMAT KEY: For those who want to fully understand conversion factors, here are the details: A positive conversion factor simply tells how far the decimal point should be placed to the left to obtain the "newspaper" price. A negative conversion factor indicates that the final (rightmost or terminal) digit(s) represent fractional values as: -1 = eighths, -2 = 16ths, -3 = 32nds, -4 = 64ths, -5 = 128ths, -6 = 256ths. Examples for the raw value 56111 Price Format Conversion Factor +5 +4 +3 +2 +1 +0 -1 -2 -3 -4 -5 -6 Newspaper price* .56111 5.6111 56.111 561.11 5611.1 56111 5611 1/8 561 11/16 561 11/32 561 11/64 56 111/128 56 111/256 *The "Newspaper price" is the typical price representation, as you might find it in the Wall Street Journal. Although most CSI users need never concern themselves with conversion factors, the conversion factor system is key to saving space in data storage and space both for newspapers and computer disk resources. For example, the number 9817, with a conversion factor of -3 (for 32nds), in decimal form would be presented as 98.53125. This value would take considerably more bytes of storage and more new sprint space. One notable exception to seamless conversion factor application is in currency trading. There are two schools of thought on how some currency prices should be presented. While most trading systems require currencies be quoted with a conversion factor of +4 (.6115), others require a conversion factor of +2 (61.15). For this reason, we allow the user to modify conversion factors, but advise that such changes be made only as directed by CSI or your software vendor. Unit (of Measure): The Unit of Measure entry simply reveals the currency of trading for the particular commodity and the units (bushels, bales, tons, metric tonnes, pounds, grams, kilograms, ounces, percent, points, cross-rate currency, BTUs (or Therms) [A BTU = a unit of heat equal to 232 calories], basis points, acres, barrels, 100 weight (CWT), percent, bags, index, megawatt hours (MWH), gallons, MMBTUs, etc. of User's Reference Manual Page 217 Unfair Advantage product. CME live cattle, for example, is traded in cents per pound (C/LB). Contract Size: The contract size is shown. You can calculate the total value of any contract by multiplying the contract size times the point value times the CSI price, taking into account the conversion factor. The current Point Value shows the value of the given commodity per point in the currency used to trade the commodity. Point Value: The "Point Value" is the currency value of the movement of one point in the terminal digit of a price. A good example is the Australian All Ordinaries Index on the Sydney Futures Exchange (CSI#230). In this commodity, the CSI price would be held as 16430 with a conversion factor of +1. The exchange sees this as 1643.0 (after applying the conversion factor). To the exchange, a one-point move is twenty-five Australian dollars, which is the difference between 1643.0 and 1644.0. In CSI's lowest denominator system, the value of one CSI point is AUD2.50, because one point is measured before the conversion factor is applied, such as in the difference between 16430 and 16431. Active Months: This entry lists a symbol for each of the 12 calendar months in a year. It identifies all the contract months, including those lightly traded contracts that are considered switching months, as well as non-trading months. They are presented as: • V = Normal (valid) trading month • S = Switching month (Switching Months are lightly traded contracts with typically short trading periods and low volume and open interest. They are not usually included in analysis series because of their inactivity and brief trading periods, but they may be included at your option. An example of a switching month is January COMEX Gold.) • | = Not a trading month Previous CSI Number: Commodities that have, for any number of reasons, been known by a different CSI number in the past, will have an entry in this field. Commodity #8, High Grade Copper is one example. Comex Copper was originally Standard Grade, which was stored in the CSI database as CSI number 6. See New CSI Number (below) for more on this topic. New CSI Number: This field shows the date that a commodity became known by its current number. Of course, this field will only hold a value for those markets showing a "Previous CSI Number," above. There will be a footnote on all such commodities explaining the circumstances of the change and how CSI handled it. 2 Character Symbol: This field lists an alternate two-character symbol for those commodities which would normally be identified by a three-character, exchange-sanctioned symbol. These are necessary for use with those third-party analysis programs (at this time, most notably those programs by Omega Research, including TradeStation) that do not accommodate three-character symbols. To use these symbols, check the "Force all commodity symbols to two characters" option on the Displaying Data tab of Data Options (from the Options menu). Currency: This field lists the currency of trading. Start Date: This is CSI's first day on file for the selected market. Footnotes Always check the box under the commodity list to see if a footnote of important information exists for the selected commodity. The footnote can include a myriad of details such as explanations of no-trading days, Page 218 User's Reference Manual Unfair Advantage changes in contract size, etc. We request that you consult the factsheets (including the footnote section) before calling CSI with a question about data. You may find the answer at your fingertips! Charting via the Factsheets Although charting is typically done through your portfolio or by requesting a chart from the main UA screen, you can also chart any market directly through the factsheets. Double-click any factsheet entry to create a UA chart. Please see "Editing the Factsheets" for information on making changes to these values. 11.1.2. Editing the Factsheets CSI automatically maintains your factsheets by transmitting any necessary changes along with your daily updates. Changes could include new trading units, currency, contract size, etc., and may require that additional database manipulations be done to assure data integrity and continuity. CSI takes care of this automatically though your daily transmission! If you know of changes to the factsheet specifications that have not been addressed by CSI, please send an e-mail to [email protected] so we can transmit a revision to all UA users. CSI periodically transmits factsheet changes with daily updates, which will automatically overwrite previous versions. If you do not wish to have your factsheets overwritten automatically, please see "Factsheet Changes" on the Updating Control Files tab of Data options (on the Options menu) to change this setting. UA allows you to edit the commodity and stock specifications if you so desire. We recommend you do not edit the factsheets unless you have a compelling reason to do so. To edit an entry in the fact sheet, locate the desired commodity or stock, then click on the table cell to be edited. (Don't double-click it!) Click the cell for a second time to make the values editable, and type your changes. For example, let's say you wanted to change the Price Format (conversion factor) for CSI Number 24, Deutschemark, from 4 to 2. This would make the prices display as 51.87 instead of .5187, which is your preference. You would go to the 5th column (Price Format) and click on the "4." Then click again and type 2 over the 4. Make sure just the 2 is showing, using the delete key, if necessary, to remove the 4. Press Enter to accept the change. Use the same technique to make all desired changes. User's Reference Manual Page 219 Unfair Advantage 11.1.3. Refreshing Factsheets CSI automatically maintains factsheet files, so it is not usually necessary to manually download a new one from the CSI website. However, if you have blocked UA from receiving factsheets and would like to download a current one, you may do so as a "Refresh" option from the CSI website. To see if a new factsheet is available for stocks or commodities, check Unfair Advantage Headlines at: http://www.csidata.com/UA/uax.html If a new factsheet is available, click the link as directed to download. Save a new stock factsheet file as: c:\ua\archives\sdbfacts.adm Save a new commodity factsheet file as: c:\ua\archives\cdbfacts.adm 11.2. Data Options Affecting the UA Database 11.2.1. Database Options Overview The UA "Options" menu offers two categories of options: Data options and Communications Options. The Data Options Screens offer several tabs that affect the UA database, including: • • • • Futures & Stock Adjustments Factsheet Changes Facts and Events User Edits 11.2.2. Historic Adjustments Futures Adjustments UA maintains a file of adjustments that can be applied to raw market data to bring historical prices into the same terms as current prices. The adjustment file (called UA\ARCHIVES\cdbadjst.adm) holds multipliers to adjust for changes in contract size, trading units, or other contract specifications. We recommend these adjustments be applied to the database, and therefore, have made this the default response. This option is handled through the "Historic Adjustments" tab of Data Options (on the Options menu) as shown below. If you do not wish to use the adjustments, click the box to remove the check. Page 220 User's Reference Manual Unfair Advantage Stock Adjustments Long-term charting and analysis of the stock market can be greatly enhanced by adjusting historical data to reflect stock splits, dividends and capital gains. These are very relevant to the value of the stock, but would not be appropriately reflected in raw price series. UA maintains statistics on all splits, capital gains and dividends so that adjustments to be made without affecting the raw price data in the database. These options are handled through the "Historic Adjustments" tab of Data Options (on the Options menu) as shown above (see Futures Adjustments). If you wish to change the settings, check or uncheck the boxes as desired. Adjust for stock splits - Adjusts the data prior to the split using an appropriate multiplier to force a smooth transition from pre-split data to post-split data. For example, in a 2 for 1 split, which would normally result in the stock price falling by 50%, the pre-split data would be multiplied by .5. Adjust for stock dividends and capital gains - Much like the split adjustment, an appropriate multiplier is used to compensate for the value removed from the stock price by the dividend or distribution. Due to the effects of inflation, this method can cause adjusted stock prices to fall below zero. Negative values are not accepted by all trading systems. Adjust Dividend/Capital Gain proportionally (Not right P/L, but no negatives) - This adjustment method also smoothes the transition from pre-distribution prices to post-distribution prices, but the adjustment is based on the dividend or capital gain as a percentage of price, not on the dollar value actually paid to shareholders. This technique avoids negative values in your adjusted stock file. User's Reference Manual Page 221 Unfair Advantage 11.2.3. Factsheet Changes The factsheets hold important information and settings for maintaining and interpreting the data supplied by CSI. In order to make sure your factsheets are accurate and current, CSI transmits revised versions whenever necessary. The new factsheet ordinarily overwrites the old, allowing changes to be incorporated seamlessly. We recognize that if you have edited your factsheets with custom information, you may not want a new factsheet to automatically overwrite the old. That's why the following options are offered. You can reach this screen by selecting the "Updating Control Files" tab of Data Options (on the Options menu). Your options are: Automatic (Recommended): This option allows CSI to maintain your factsheet files automatically, as the system was intended to do. It assures that you always have the most current, accurate and STANDARD set of information. Warn First: When this option is chosen, UA will notify you that a new factsheet file has been transmitted and give you the option of accepting or rejecting that file. Skip All: UA will discard all new factsheet files without processing the revised information. The most up-to-date factsheets are usually available for download from the CSI website. 11.2.4. Facts and Events CSI maintains a file within UA that tracks important events affecting the markets. This feature was called the "Alerts Calendar" in earlier versions. Page 222 User's Reference Manual Unfair Advantage To view, pull down the Initiate menu, then click "Facts and Events." Scroll through the materials to find the content of interest to you. To make sure UA always has the most current information available, CSI transmits revised and updated Facts and Events calendars periodically. You control whether or not these updates are processed though "Updating Control Files" tab of Data Options (on the Options menu) as shown above (see Factsheet Changes). To automatically receive and process new Alert Calendars of Facts and Events, make sure the lower box is checked. If new calendars are not desired, click the check to remove it (not recommended). 11.2.5. User Edits When you edit the prices in the UA database, you change the way data will be presented in both UA charts and third-party software. Although the presentation of the data is changed, it remains in its original form in the compressed database. If you have made changes to the database that you do not wish to apply, you can instruct UA to disregard ALL your changes. Click the User Edits tab of Data Options screen (on the Options menu) and click "Ignore User-Supplied Prices," as shown below. 11.3. Essay on Computed Contracts Computed Contracts: User's Reference Manual Page 223 Unfair Advantage Their Meaning, Purpose and Application An Essay by Bob Pelletier It is an unending study of an ever-changing subject. It is a quest that takes commodity traders and technicians deep into the history of the markets, brings them rushing back to the present and hurls them pensively into the future. Technical analysis is indeed an exciting, sometimes grueling business; one which leads its practitioners to tackle large quantities of historical data for individual commodities. Speculators demand a workable way to view the markets that simulates the perils, profits and pitfalls of actual trading. Those in the know are finding that the most meaningful results can be found in the study of "computed" contracts, which are derived from, but do not exactly mirror actual market activity. This is a discussion of the various types of computed contracts available to CSI data resource subscribers. Let's start with the basic fact that futures contracts are relatively short lived. They are created on some date by traders on some exchange floor and eventually die when their delivery dates are reached. This birth-death process for commodity and futures contracts is an inherent characteristic that cannot be ignored. Some commodity contracts have longer lives than others. Grain contracts, for example, trade for a year or two, while financial markets may be traded six to ten years into the future. In all markets, nearby contracts (those about to expire) enjoy much heavier volume and open interest than contracts with later expiration dates. Technical traders are wary of entering illiquid markets, where order-execution slippage can take a significant toll on both actual profits and efficient order execution. Liquidity factors relating to open interest and volume, life span and distance from expiration are all-important considerations. th N Nearest Future Contracts Traders of the 1950s and before were comfortable viewing a concatenation of contracts of the same commodity over time. These were created by manually splicing together the nearest portion of successive delivery months into a series covering ten, 20 or even 50 years. They could then simulate the practice of trading and viewing the more active (and most liquid) period of each successive contract to obtain a feel for trends, volatility and opportunity for profit. Many traders still prefer viewing the markets from a nearestcontract perspective. An advantage to this approach is that the most heavily traded portion of every contract viewed in the concatenated series is a representation of the actual market prices. A major disadvantage is that significant price jumps or drops (discontinuities) occur from one contract to the next which help to discredit, distort and diminish results. Unfair Advantage accommodates this type of analysis through the Nearest Future Contract choice in its Portfolio Manager. When selecting the Nearest-Future contract option, users may select the calendar delivery months to include. Most users wish to analyze the first nearest future, but the 2nd, 3rd, etc. nearest future may be selected instead, to add distance and time from delivery risk. There is also a prompt allowing users to select the day and relative month of roll-forward. This option also adds distance from delivery risk and clarifies when to expect one contract to roll to the next. While viewing a chart of this or any other computed series, UA users can display the price, volume and open interest information of the computed contract along with the name of the underlying contract in a movable window. This is done by clicking the Price Window (crosshair) button on the tool bar and positioning the vertical bar on any day. Gann Contracts Gann enthusiasts represent another trading group that is interested in simulating markets over a wider spectrum of contract history. This group views the markets similarly to the nearest future proponents, with the exception that like contracts (those with the same delivery month classification) of a commodity are concatenated. For example, a Gann time series might hold the final year of the June 1987 contract, followed by the final year of the June 1988 contract, followed by successive June contracts up to and including the Page 224 User's Reference Manual Unfair Advantage most current June contract that lies within 12 months of its expiration date. Unfair Advantage accommodates this type of analysis through the Gann Contract choice in its Portfolio Manager. First the single delivery month to be used for this Gann series is chosen. Then comes the roll date, which can be selected as any day relative to month start. This allows for rolling on, say, the first or tenth day of the month, or any date the user selects. The ability to gain more distance from delivery is available for these series by opting to roll in the calendar month prior to expiration. UA users can simply enter a 0 to roll during the delivery month, 1 to roll one month prior to the delivery month, or even higher numbers to roll earlier. The Gann approach may be better than the nearest-future variety because there are fewer discontinuities. On the other hand, the one-year segments of a "Gann file" may be too long to yield meaningful information. What may have been learned from the distant (early) portion of each one-year segment of the time series may not readily apply to the more volatile later portion of each successive one-year series. As a contract approaches maturity, its characteristics such as volatility and trading volume gradually increase until a maximum level is reached near the end of each delivery month's contribution to the overall series. Unfortunately, the later period of each contract is likely, in a statistical sense, to show no resemblance to the relatively tame earlier period. This phenomenon suggests a lack of stationarity, a statistical property explained in the Perpetual Contract® data discussion below. Perpetual Contract Data In 1970, when the computer became more popular for analysis, CSI unveiled its trademarked Perpetual Contract data. This computed contract, very popular among CSI subscribers, represented a time-weighted average price of the two active contracts that lie earlier and later than a fixed number of days and months ahead of the then-current date. This method of calculation remains popular because it provides an accurate view of the market's characteristic waveform over time that is "perpetual" in nature. It is similar to the forward contracts offered by the London Metals Exchange (LME). The major drawback of the Perpetual Contract data approach is that the contracts cannot be traded directly, and can only be used as a guide for overall market direction. They are used to assist in examining long-term analysis alternatives. They should not be heavily relied upon in examining agricultural markets where different supply-and-demand conditions may affect the distinct old and new crops. An alternative to the standard Perpetual Contract data is the open interestweighted Perpetual Contract which has a near-contract view that results from all contract prices being weighted by their respective open interest. Advocates of Perpetual Contract data series point out that these series are more likely to exhibit statistical stationarity than, say, a Gann contract. This is particularly true when there is a long enough period from birth to death to change the contract's volatility over time. The concept of "stationarity" is simple to understand. For a serially correlated time series to be stationary (and most time series are serially correlated), the mean and variance of the series must remain statistically constant. Another significant advantage of Perpetual Contract data is that it offers flexibility to focus on near or far contracts as single independent series for analysis purposes. For example, an analyst could pair off far-forward future hogs against nearby corn (the raw material needed to produce the hogs) to study the dependent impact of these two commodities on each other. Unfair Advantage accommodates this type of analysis through the Perpetual Contract choice in its Portfolio Manager, where many options give the user flexibility to fine-tune the study. Any or all contract months may be included in a Perpetual Contract series, but generally all active trading months (the default response) are represented over time. The Perpetual Contract data user must choose how many months ahead to view the market. Three months is the usual distance, but a two-month forward series may be appropriate for commodities that expire every month or two such as the energy products and perhaps some precious metals. Farther-out studies can also be useful as in the above example of near corn and far-off hogs. Perpetual Contract users have the same roll-forward options as nearest future and Gann traders. The Perpetual User's Reference Manual Page 225 Unfair Advantage Contract choice in the Portfolio Manager is also used to affect open interest weighting on the data, whereby no rolling is involved and weighting is based solely on speculative and trader interest. Back- and Forward-Adjusted Contracts More recently, traders have shown an interest in back- and forward-adjusted contracts. Back-adjusted contracts use the actual prices of the most recent contract with a backward correction of price discontinuities for successive earlier active delivery months. In a forward-adjusted contract, the prices of the current contract are changed to eliminate the gap between the current and recently expired contract. An important aspect to remember about forward-adjusted contracts is that current prices do not represent actual values for today's markets. Because of the removal of contract-to-contract price jumps and drops in both back- and forward-adjusted contracts, they appear as smooth, blended, homogeneous price histories representing a sorted and concatenated compilation of successive contracts over time. Starting with version 1.66 of UA, there are two back adjusters available. One is written with a forward market viewing perspective, and the other views the market forward in time. Both have been thoroughly tested on standard and exotic data as part of our continuing quality assurance commitment. The results may differ in that the roll date may be skewed by a day. For a more complete comparison of these choices, please go to our Internet site at www.csidata.com. To use the alternate adjuster, click the "Use C++ Back Adjusted" box on the Back Adjusting tab of Data Options (from the Options menu. The back-adjusted accumulation method of joining contracts in a series over a period of years or decades permits the analyst to focus on the period when one might prefer to trade the markets in actual practice. Traders often wish to communicate their own rolling preferences so that they will not be simulating trading situations when there is either a risk of delivery or an exposure to highly volatile markets. To accommodate these preferences, UA lets users choose their desired delivery months and a roll-forward date. The rollforward date may be relative to the start or end of the month for rolling. The option of picking a roll date relative to the month end is useful for traders who want to avoid risking delivery of their commodities by rolling out of a contract on or before the first notice day, which is often calibrated relative to the end of the month. Back- and forward-adjusted files can also roll when heaviest volume or open interest shifts from one contract to the next. The switching of contracts based on volume or open interest is always based on the previous day's data because these values are released one day late by the commodity exchanges. For example, a rollover based on a change in volume or open interest on Monday would not be reflected in the data file until Tuesday. If heavy volume or open interest switches back to an earlier contract, the current delivery month will not change, as it is locked in to avoid confusing oscillations. Although the menu choice of these adjusted files is called "Back-adjusted" the software can forward-adjust the data just as easily. The selection of representative prices (previously referred to as splicing method and delta) is another userdefined option, which heavily impacts the adjusted files. It refers to the data points used to calculate the back or forward adjustment value. It closes the gap between adjacent contracts by focusing upon the close-toopen, close-to-close or the open-to-open price differential of successive pairs of contracts to be joined. The option of comparing the open price of the new lead contract with the previous day's close price of the former lead contract is an especially desirable feature because it gives the user the opportunity to either ignore or include a real gap in contract-to-contract price movement. Negative Values in Back- and Forward-Adjusted Series An advantage of the back-adjusted approach to long-term market synthesis and simulation is that the data observed is precisely the same as the exchange's representation of the final contract in the concatenated Page 226 User's Reference Manual Unfair Advantage series. A flaw in back adjusting is the strong chance that an inflation-sensitive market could produce negative price quantities into the past. The same logic allows forward-adjusted contracts in a deflationary environment to produce negative current prices for today. The suggestion that prices can be negative in actuality is clearly flawed and could discredit the accuracy of such a methodology for longer-term analysis. No one would really pay you to take 50 bars of gold away or pay you to take thousands of pounds of cotton. This flaw demonstrates that a bias is introduced through the removal of contract-to-contract price discontinuities. When early contract prices in a concatenated set are significantly less than their real contract counterparts, they tend to produce a bias that in simulated trading would heavily favor the act of buying over selling. In addition, even if the early contract prices are not significantly different from their current-contract counterparts, inflation could play a role in influencing buying over selling when such a long series is introduced as representative of current pricing norms. This phenomenon should tell you that your results may be invalid and that applying in the present what you have learned by simulating the past can distort your trading algorithm. Fortunately, there is a way this bias can be removed without compromising the validity of your simulation. Detrending to Remove Biases Users of back- or forward-adjusted series can, through a simple time series analysis transformation, remove the upward or downward trend tendencies by detrending the portion of the series that connects the final current contract with the earlier balance of the series. This approach, which is found in all computed contract series and cash prices of the UA data warehousing system, removes any evidence of long-term trend for any length series so that trading can be simulated without the danger of favoring long trades over short trades. Two alternatives for detrending are offered. One allows detrending up to the very end of the contract that lies before the current contract; the other detrends up to one day short of the period end. This series includes all of the current contract up to, but not including the very last day on file. The latter approach may be most suitable for use with UA's Seasonal Index study. The idea of detrending is meant to apply only to the longest possible time period. This would be the period of time that incorporates all or virtually all available history for the market to be studied. It wouldn't be practical to detrend the short-to-intermediate oscillatory period. This more fruitful period should be left in the data for the technician to study. Little or no penalty stems from the detrending process because all data is viewed from today's perspective, with today's prices (when the entire series is detrended). Before detrending, each price in a historical data file is assumed to be measured by today's dollars. Given the effects of inflation over the years, this is clearly a faulty assumption. Consider that a six-cent price move in 1966 may have represented a limit-up or limit-down situation, whereas, the same six-cent move today might be considered insignificant. When data is not detrended, that very significant six-cent move of 1966 is rendered as insignificant as a six-cent move today. Detrending, on the other hand, returns integrity to data from the distant past by putting it back into proper perspective. The importance of detrending is that it increases the chance that analytical results derived from yesteryear will be relevant and comparable to trading conditions in today's market. Don't be fooled by analysis results which suggest that the simulated performance of a non-detrended series produces greater hindsight profits than the same series in detrended form. Remember that this process removes a bias that may give the false impression that buying is always better than selling. Such results are not achievable in future trading practice. You also cannot easily trade across contract boundaries without paying a heavy slippage and commission tax, even if you have carefully spliced together successive independent series. Deciding Which Computed Approach to Follow User's Reference Manual Page 227 Unfair Advantage There are many considerations in choosing computed contracts for analysis and, eventually, for impacting investment decisions. Each category has some unique value. Both the nearest future contract and Perpetual Contract data can view the markets from early and distant delivery perspectives by focusing upon contracts that expire either early or late with respect to any given current date. The Perpetual Contract is the only viable approach that can focus upon a fixed period forward in time and therefore achieve a substantial level of statistical stationarity. From an astrological perspective, perhaps only the Gann computation is valid. It seems to have the advantage of offering a predictably long period of time to view a market on an annualized basis and may have some longevity benefits not possible with nearest-future contracts. Nearest future contracts have the advantage of focusing upon the most liquid period of a contract's life, but the disadvantage of offering very brief periods of individual contract data. The overlooked idea of detrending of computed data is especially useful with Unfair Advantage. Without loss of substance, one can get data into a form where profits and losses are not subject to extremes and avoid the problem of compounding profits and losses of the distant past into present value terms. Portions of an entire time series can receive equal weight treatment, and the early portions of a detrended inflationary series are progressively amplified so that they appear in as volatile a form as the most current data. The back-adjusted contract offers the most flexibility for the user. Current data can be supplied as it was actually traded in exchange-released form and past data can be expressed in adjusted and detrended form. The mechanical effects of back adjusting and price inflation can be removed, making the detrended series an excellent source of information for seasonal analysis. A minor disadvantage to the back- or forwardadjusted contract is the heavy computing requirements necessary to produce the resulting series. Total computing time is measured in seconds rather than microseconds, making it necessary for one to wait for results. Perpetual Contract data is also a very good choice because of the statistical stationarity issue, but many users dislike using non-tradeable price representations. As an analytical guide or tool for overall market direction and as an auxiliary independent supporting input, it is an excellent choice. Traders and analysts may be tempted to adopt some form of hindsight market synthesis and simulation to prove a preconceived method of trading. Each of the alternative computed contract methods have certain advantages. In addition to what has been argued above, the Perpetual Contract data has a very distinct advantage over the others where intermarket analysis is involved. Because Perpetual Contract data uses actual prices on a time-weighted forward basis, the data in related markets operating in parallel can be significant to any analytical exercise. Price ratios of related markets and their correlated or associative properties are directly comparable. Backadjusted series, on the other hand, cannot benefit from such associative characteristics. This is so because the inherent flaws involving contract splicing and the overwhelming tendency for back-adjusted series to report negative readings all but destroy the relative characteristics of one market with respect to another. Gann and nearest future contracts can be used much like Perpetual Contract data, however, because of inherent price discontinuities, the results are not as consistent for longer-term analysis. This message is presented to guide you in your study of the commodity markets and to help you understand the ever-changing subject at hand. It is not only for those who are contemplating building trading systems based on computed contract series, but also for those whose trading systems have been derived from such approaches. Each type of computed contract discussed here can add some visibility to market analysis. It is important to consider both the strengths and possible weaknesses inherent in these methods to maximize profits and preserve capital in actual trading. Page 228 User's Reference Manual Unfair Advantage 11.4. Data Release Schedule Phased Release of Data CSI phases data release from 10:30 AM for the Pacific Rim, 4:30 PM for European markets, 5:30 to 8:00 PM for US futures, stock indices, stocks, mutual funds, and options, etc. Customers may call for data as the markets are finalized and begin analyzing the information provided. Data Access Times The following is the official release time schedule for daily data delivery. The times shown are for the typical user interested in a sampling of markets around the world. Ninety-five percent of the time, CSI will deliver data at a prescribed mean time as listed. To avoid a repeat call due to missing data, do not access your daily file until after the posted release time. If you require part of your portfolio before all data has been posted, you may call twice for data, but you will be billed a modest surcharge. Please see CSI's current rate schedule for details. It is possible to call early for some data without paying extra if you wait until the following day to download the missing part of your portfolio. In other words, if you don't get the missing data until you call for an update the following day; you'll be accessing just once per day and will avoid extra charges. If you happen to receive no data for a particular commodity that settled late or was not quoted by your collection time, the omission will be corrected with the following day's update. After that, corrections, additions and changes are handled through our automatic correction file. We suggest an update time of 8 p.m. eastern time if you require the most complete data set possible. If you find that certain commodities of interest to you are usually unavailable when you call for your update, you'll need to choose one of these three options: 1) adjust your update time to accommodate the missing markets; 2) continue retrieving your updates at the normal time, but wait until the following day to get the late data in your normal update; or 3) make a second call after 8 p.m. eastern time, which will assure you have the most complete data available for the day. Additional charges apply for regularly receiving more than one update daily. Data Release Schedule (All times Eastern) (Please allow for seasonal Daylight Savings Time adjustments) • • • • • • • 10:30 A.M. Pacific Rim commodities 4:30 P.M. European commodities 5:30 P.M. All other commodities and futures except stock index futures 5:55 P.M. All index markets 6:30 P.M. All commodity cash prices and commodity options 7:30 P.M. All stocks and mutual funds* 8:00 P.M. Final posting of stock options, late arrivals, omissions and corrections *After-hours trading on NASDAQ has forced delays of stock release times. We hope to release stock prices earlier than this published schedule. The above release times are subject to change without notice. Hours of Data Availability User's Reference Manual Page 229 Unfair Advantage The CSI host computer systems are available for access 24 hours per day 7 days per week with random oneto-two minute periods of required downtime for file maintenance. File maintenance will consume approximately 20 minutes per week. 11.5. Editing the Database The UA database itself cannot be edited by the user. Error corrections made to the CSI host computer are transmitted along with daily updates to each UA subscriber. This assures that each user has an identical database of the most accurate data possible. If you suspect an error in your CSI data, please report it to CSI so that the questioned values can be researched and appropriate corrections made to all UA installations. We reward the first person reporting an error with a CSI pen! UA does allow you to create an exception file of price and/or volume and open interest revisions to meet your individual needs. This might be handy to correct an error before CSI has a chance or to do what-if studies. Your revisions, if desired, will be incorporated in all charts and export format files. Since your edits are stored separately and do not affect the compressed UA database itself, it is possible (and easy) to remove edits (see below) or to ignore user edits in any application. Your changes will not be effective immediately. You must re-create the chart to reveal the new prices. This applies to export format data files as well. To incorporate changes, the files must be re-written. To edit prices or volume: 1) Create a UA chart of the raw price series to be modified. Be sure you select the raw stock or commodity contract, not an adjusted or detrended series. See Creating a Chart for instructions. 2) Once the chart displays, click the "Table" tab at the bottom of the screen. 3) Scroll through the table data to find the date to be modified. 4) Click on the price or volume cell to be edited (don't double-click it). Then click it a second time. A cursor will display. 5) Type your changes, being sure to use the same units as the other prices or volume/OI for the contract or stock. Press [Enter]. The entire table row for the edited day will change color to alert you that you are not viewing original prices (even if you didn't make a change). To add a day (for manual data entry): There are a few reasons why you might want to manually enter a day of data before you download that day's update from CSI. UA allows for this through the data display table. Before you can manually enter the data, you'll need a new row in the price table. Here's how: 1) Create a chart and display the table as described above. 2) Click anywhere on the table, then right-click your mouse. The following menu displays: Page 230 User's Reference Manual Unfair Advantage 3) Click "Add A Day" to insert a day at the bottom of your table. It will be dated the next business day after your last day updated. The values shown will be a repeat of the previous day. 4) Type your desired price or volume data. 5) Press [Enter] to record your edit. 6) Repeat for all fields. To mark as a Holiday: UA and appropriately programmed compatible software will not chart or analyze a day that is marked as a "Holiday." Holidays are basically disregarded. To mark any day as a holiday, display the price table for your desired commodity or stock (explained above). Then: 1) Click the table row for the date you want disregarded. 2) Right-click the mouse to bring up the above menu. 3) Click "Holiday." A check mark will display next to "Holiday" on the menu, and the entire day's entry will display in a different color. This will alert you to the change. Un-check the "Holiday" entry to restore the day to non-holiday status. Removing Edits Whenever you manually edit a day of data through a UA price table, the edited lines display in a different color for easy identification (on the table only). You can restore the presentation of the UA compressed database by removing your edits. To remove edits: 1) Create the required chart and click the "Table" tab to view the price table, as you did to edit the data originally. 2) Click the table row for the date you wish to return to its original form. 3) Right-click your mouse to display the following menu: 4) Click "Remove Edits for Record." The entry that was created in the UA exception file for this specific date will be deleted, so only the data stored in the UA compressed database will be available for that commodity or stock. Your changes will not be saved in any way. User's Reference Manual Page 231 Unfair Advantage An alternatives to permanently removing edits is changing your selection on the User Edits screen, of Data Options (on the Options menu) to temporarily ignore edits. 11.6. File and Chart Naming Conventions Whether you are viewing a chart or saving a file to disk, it is important to be able to identify the time series at hand. Unfair Advantage handles the identification process through the use of very descriptive filenames. Filenames for conventional (normal) futures contracts are straightforward and easily mastered. However, computed contracts (adjusted, Perpetual Contract data, Gann, etc.) offer a challenging mix of parameters, each of which is revealed in the filename. The filename for a normal futures contract is determined automatically based on your choices during your initial setup of Unfair Advantage. You can review and change these entries by pulling down the VIEW menu, clicking User Settings and clicking the ASCII formats tab. UA does not emulate QuickTrieve in its handling of computed contracts and file naming conventions. Naming conventions for computed contracts can be employed only as long as the files are in ASCII, or dBase (all the ASCII-like) formats, and even then, the filename cannot deal with the switching or nonswitching months or some roll-forward criteria. Normal Futures Contracts The filenames for normal future contracts typically include a symbol, the numerical delivery month and the delivery year. An ASCII file might be listed in your portfolio as: ASCII comma w/century daily file -->LC_1997M.CSV This would follow a header identifying the commodity. The actual filename (at right) shows the symbol (LC for Live Cattle with an underscore padding the three-character field), the delivery year (1997), a single-digit delivery month code (M for June) and a three-character file extension as selected by the user. Alternate presentations can include a code identifying the exchange and other options as noted in User settings. A numerical delivery month code 1 - 12 can replace the alphabetic exchange-based one shown here: F - Jan G - Feb H - Mar J - Apr K - May M - Jun N - Jul Q - Aug U - SepV - Oct X - Nov Z - Dec Nth Nearest Future Contracts The conventional contract closest to delivery has traditionally been identified as the "nearest future contract". In practice, however, commodity traders have a different view as to which contracts should be included in the list of candidates to consider for nearest future treatment. Unfair Advantage gives great leeway in determining which contracts are to be included, how far out the market should look and when the rollover date should be. UA's file-naming structure of rolling rules for nearest future (and back-adjusted) contracts is as follows: SSS Symbol I Number of months to ignore in hexadecimal (0-9,A,B,C,D,E,F,N). If the user wishes to roll relative to contract end, then this field will hold a 0. In general, the "ignore" value represents the number of months before the expiration month that rolling should occur. Not withstanding the preceding, if rolling is requested to Page 232 User's Reference Manual Unfair Advantage occur with respect to contract expiration, then the character position identified with an 'I' will represent the first digit of the number of days before contract end as described in the rR field below. rR If the roll-forward relative date is measured with respect to the month end, rR = relative date + 31; if the roll-forward date is measured with respect to the month start, rR will be set to = a value from 1 to 30; if the roll-forward date is to be the last trading day, then the two characters: _L will be shown in the rR field positions; if the roll-forward date is measured from contract expiration, then the R position will hold an 'X', and the number of days in the two characters: I and r will represent the number of days before contract end where 01 signifies the last trading day, 02 signifies the day before the last trading day, etc. In no event, should the two character: 'Ir' ever hold the quantity 00. When Rolling is a Function of volume, open interest, either volume or open interest or both volume and open interest. In the event the user requires rolling to be a function of new contract readings overtaking old contract readings in the fields of volume, open interest, either volume or open interest or both volume and open interest, then the following three sets of four rR set possibilities will be written into the file name: _ V, _I, _ E, _ & designates rolling when all readings are well known for a) volume, b)open interest c) either volume or open interest, or d) both volume and open interest. @V, @I, @E, @& designates rolling when all readings are reported for a) volume, b) open interest c) either volume or open interest, or d) both volume and open interest. A V,A I,A E,A & designates rolling when all readings are anticipated for a) volume, b) open interest c) either volume or open interest, or d) both volume and open interest. N This is the value of N in an Nth nearest future calculation. 'N' This is the Nearest future designator (upper case 'N' for a non for a detrended series. detrended series, or lower case 'n' Back- (or forward-) Adjusted Data (Back- Forward- or Proportionately Adjusted) Back- (or forward-) adjusted files are built from a series of contracts whose prices have been adjusted (either backward or forward) to eliminate the gaps between expiring and newly active contracts. Each of the parameters is explained in Chapter 3. The files are named as follows: SSS I rR D Symbol No. months to expiry (0,1,2,...8,9,A,B,C,D,E,F) Same as for Nth Nearest Contract This field combines two parameters: detrend and the computational rolling rule: Computational rule Detrend Description Description D= 0 = close-to-close Do not detrend 0 1 = open-to-open Do not detrend 1 2 = close-to-open Do not detrend 2 3 = close-to-open w/old gap Do not detrend 3 4 = close to open w/new gap Do not detrend 4 0 = close-to-close Detrend to 1st non-current contract A 1 = open-to-open Detrend to 1st non-current contract B 2 = close-to-open Detrend to 1st non-current contract C 3 = close to open w/old gap Detrend to 1st non-current contract D 4 = close to open w/new gap Detrend to 1st non-current contract E 0 = close-to-close Detrend to day before the last day of the current contract X 1 = open-to-open Detrend to day before the last day of the current contract Y 2 = close-to-open Detrend to day before the last day of the current contract Z 3 = close-to-open w/old gap Detrend to day before the last day of the current contract V 4 = close-to-open w/new gapDetrend to day before the last day of the current contract W J Adjustment type: F = forward adjusted; B = Back adjusted; R = proportional. (The redundant notation of upper case letters for non-detrended and lower case for detrended, is used here for consistency with the other computed contracts.) User's Reference Manual Page 233 Unfair Advantage (Note, when rolling on volume or open interest, the number of months to expiry (I) is not relevant, but a "0" will be introduced into the fourth column of the expressed file name.) This produces an 8-character file name. For example, JUS133Cb represents U.S. T-Bonds on the Tokyo Stock Exchange (JUS), expiring one month earlier than the expiration month (1), rolling two days before month's end (31+2 = 33). Detrending occurs through the end of the first non-current contract using the closeto-open rule (C) on a back-adjusted (b) series. Note that filenames are the same for contracts that are detrended through the previous contract as for contracts that are detrended through the next-to-last update. If both types are required, they should be stored in different directories through the Portfolio Manager to avoid overwriting. Gann-Format Data (continuous) W. D. Gann, legendary commodity trader, discovered long-term market cycles by studying many years of data for the same contract month of each commodity. Since no single contract trades for very long, the combined data from one delivery year with data from the next year in a continuous fashion, always focusing upon the same delivery month. CSI delivers a continuous data file, which produces the same type of year-toyear chart. A Gann-format file contains prices of a specific contract through its expiration or your specified roll-forward date. On the day following the roll-forward date, data for the same delivery month of the succeeding year is included. UA creates Gann-format ASCII files with delivery month codes as follows: 70 + Delivery Month To View -1 = Gann code. Therefore: a December contract would be 81, because is (70+12-1 = 81). SSS I rR M 'G' Symbol Number of months to ignore (0-9) Roll-forward day of month Gann delivery month (see alphabetical delivery month codes) Gann contract designator (upper case for non-detrended; lower case g for detrended) Perpetual Contract® Data This is a proprietary CSI concept, which represents a weighted average of the distant two contracts that lie adjacent to a given period-ahead point in time or, under certain circumstances, an open interest-weighted series, which includes all delivery months. Each of the parameters included in these files is explained in the Portfolio chapter. The filename is constructed as follows: SSS I rR 0-9 'P' Symbol Number of months to ignore (0 - 9) Roll date of month or _L for last trading day Perpetual no. months forward (0 for open interest-weighted series) Perpetual Contract designator (upper case for non-detrended; lower case p for detrended) Cash Prices The filenames for cash price series include a symbol and a numerical delivery month code (either 54 for current day cash or 61 for lag day). If the data is detrended, the filename shown is suffixed with a lower case "d." A detrended cash price file might be listed as: ASCII comma w/century daily file -->LC_54d.CSV Page 234 User's Reference Manual Unfair Advantage 11.7. Structure of Daily, Weekly and Monthly Files The file structures shown here reflect the contents of the six data fields identified as open, high, low, close, volume and open interest. Most commodity files contain exactly this data in these fields. Certain fields may be replaced by other types of data as indicated in the fact sheets. One should consider the type of data stored in each of the six fields when interpreting weekly and monthly figures. A DAILY file will hold the daily open, high, low, close, volume and open interest. A WEEKLY file will hold Monday's open, the high and low for the week, Friday's close, weekly volume and Friday's open interest. A MONTHLY file will hold the open from the first business day of the month, the high and low for the month and the close from the last business day of the month. Monthly volume figures normally represent the average daily volume. The total volume for the month can be used if it is not larger than 9,999,999. Open interest is for the last day of the month. 11.8. Structure of Stock Statistics Files As part of the stock database, CSI offers various market statistic data series including advance/decline, new highs/new lows, etc. for several exchanges. The name of the specific data series will give you a good idea of what is in the file, but content will vary depending upon the series. For example, CSI #5500 UVDV-I (for Up Volume/Down Volume) Includes: Issues Traded, Issues Traded Up, Issues Traded Down, Issues Unchanged, Advancing Volume and Declining Volume. User's Reference Manual Page 235 Unfair Advantage 12. Software Maintenance 12.1. Uninstalling & Reinstalling UA IMPORTANT NOTICE: Any time you install or uninstall software, unexpected problems can occur. We urge you to back up your hard drive (or sensitive applications and documents) before installing or uninstalling any software. You are solely responsible for protecting your computer system, software and data. CSI will not be responsible for any loss or damage arising from or in connection with your using, modifying, or removing any software. PLEASE READ ALL OF THE FOLLOWING BEFORE PROCEEDING! Use this utility before reinstalling UA from a new CD or upon termination of service. Do NOT uninstall UA before upgrading from the website. 1) Either select "Uninstall" from the Initiate menu and skip to step 4 or Quit all programs. 2. Click Start, move to Programs, then CSI Unfair Advantage. 3. Click Uninstall. 4. You will be asked to confirm that you want to delete UA from the specified directory. BEFORE answering, please read the important two-paragraph explanation below: IF the listed directory includes a drive designator AND a directory name (such as C:\UA), you may click YES to delete EVERYTHING from that directory, including the UA software and data files. If this directory holds software or data that you do not wish to delete, click NO. IF the listed directory is the root directory of any drive (such as C:\ or D:\), this indicates that UA was incorrectly installed in the root directory. Click NO (don't uninstall) because UA cannot be uninstalled safely with this utility. Doing so can result in permanent loss of all software and all data on your drive! Reinstalling UA PLEASE READ ALL OF THE FOLLOWING BEFORE PROCEEDING! If you have a problem with your initial installation of UA, you may reinstall the software from the original CDROM; however, this may only be done within the two-month period following shipment of the CD from CSI. Reinstalling from your original CD after that time will permanently corrupt your database because it will be outdated beyond UA's updating window. Do not uninstall UA unless you are re-installing from your original CD within two months, have received a new, updated UA CD from CSI or unless you intend to permanently terminate service. Do not uninstall UA if it was originally installed at the root directory of any drive, such as C:\ or D:\. The following steps should be taken to assure proper re-installation of UA: 1. Shut down and restart your computer. 2. Preserve a backup copy of the \UA folder in your \OLDUA folder and then Uninstall UA. Page 236 User's Reference Manual Unfair Advantage 3. After uninstalling UA, use your Windows Explorer to locate and delete the file UA.INI from your Windows folder. 4. Install UA from your CD as described above. 5. Shut down and restart your computer again. 6. If you wish to use your previously listed portfolio, copy the file ARCHIVES\PORTFILE.ADM from the \OLDUA folder to the \UA folder. 7. Reinstalling from a CD will lock the UA database. Collect a daily update to unlock the database and bring files current. 12.2. Upgrading UA CSI maintains a website where product upgrades can be downloaded without interfering with your database files. Most software upgrades to correct program errors or to obtain enhancements are available free of charge on the Product Upgrade page of CSI's website at http://www.csidata.com. These files are available to all users for regular upgrades at your own discretion. You may be advised by a Technical Support representative to download one of these files to correct a problem. We recommend that you check the UA Website once per week or so and download all enhancements to make sure you have the latest version. The website upgrades are frequently updated and are indicated with a version number. We strongly recommend saving a copy of your UA directory before installing an upgrade! This will allow you to return to the previous version if there is a problem with the new one. It will also make it possible for you to restore your customized portfolio and factsheet specifications without re-entering them! Please see "Backing Up UA" for specific instructions. Downloading Upgrades Important note: Running UA loads certain DLL files into your computer's memory, which can interfere with new versions. Therefore, before installing an upgrade of UA, please exit the Unfair Advantage program and restart your computer. After downloading the upgrade, exit your browser and restart your computer again before running your new UA upgrade. An upgrade does not constitute a fully functional UA system. Upgrades do not include database files, nor factsheets nor other essential elements of the UA system. DO NOT UNINSTALL UA before upgrading from the website! Before beginning, get your User ID and user number (from User Settings, if necessary) because you will need to re-enter into your new version. To download an upgrade, use your web browser to reach the CSI Home Page on the Internet. The URL address is: http://www.csidata.com. The CSI website offers many features for active and potential UA subscribers. Click Support at the top of the page, and then click Unfair Advantage Program Upgrades for a list of available software. User's Reference Manual Page 237 Unfair Advantage Scroll through and read the various notices and warnings until you reach the box titled "Unfair Advantage Program and Data Updates" (as in the example below). Each available update version is listed separately, along with its creation date. Most listings represent the full program (excluding the database and perhaps other files). We sometimes offer a "lite" version that includes only recent changes. Do not use the lite version unless you have been keeping up-to-date with EVERY upgrade version. Double-click the file that you think is most appropriate for your situation. This is usually the most current full, non-development version. DO NOT select a version that is earlier than your current version, as backward-compatibility may not be retained. Unless you are instructed to do so by a CSI representative, do not download a Development or Test version (may be marked with a "b" appended to the filename). Such files represent "Beta" or experimental versions. Once you select a version, a description of that version is displayed. It includes a listing of enhancements and all known problems. Please read this over carefully to determine if you wish to upgrade at this time. If so, click where indicated to download the program. Your browser will indicate that the file cannot be viewed and ask if you want to save the file or pick an application. Choose SAVE and click OK. Next you'll be prompted for a filename with a standard SAVE AS dialog box. Use the default filename, which reflects the current version number (don't change it). Your browser may attempt to save the file in the briefcase, a Temp directory or other inappropriate location on your drive (as shown below). Page 238 User's Reference Manual Unfair Advantage If this occurs, click the arrow symbol at the right of the default directory to drop down a menu of other locations. Double-click the drive letter of your hard drive (probably C:) and the available folders will display as in the example below. Change the directory to your UA folder by scrolling through your directories and doubleclicking the UA folder. Once there, click "Save." The File Download dialog chronicles your progress. The "Estimated time left" is likely to be WAY off! Our sample run started off indicating a seven-hour download, and within half an hour was down to "52 minutes." The entire download took about an hour. When the download is complete, disconnect from the Internet as desired. Installing Upgrades (Be sure to preserve a backup before installing an upgrade!) User's Reference Manual Page 239 Unfair Advantage As noted on the website, you should always install upgrades on top of your current UA, without uninstalling previous versions or starting over in a new directory. This is because most (but not all) UA files are overwritten. Your database files are not affected by software upgrades UNLESS you Uninstall your UA software. We do not recommend Uninstalling UA unless you have a current CD from CSI, or are terminating service. In most cases, the UA software you download from the website does not become functional until you execute the program you received, which, in turn, installs the updated version. To install your upgrade (after downloading it), click your computer's "Start" button with the right mouse key (right-click it). Click on Explore, then navigate to the UA directory as you did when saving the program (above). Within the UA directory, look for the file you just saved. It is most likely a UA version number with a .exe extension. Double-click the upgrade file to execute it and install the program. Customizing Upgrades Once your UA upgrade is installed, you should exit your Browser and restart your computer. Start UA as usual and enter your Authorization codes (if prompted). Depending upon scope of the upgrade, you may need to enter a new portfolio or restore your previous portfolio (if you saved it). You must download quotes to unlock your database before proceeding. 12.3. Backing Up UA We strongly recommend that you preserve a copy of the UA folder before downloading and installing a new or upgraded version. This is done through standard Windows mouse functions as follows: Right-click your computer's Start button, then click "Explore." A screen much like the example below displays. Scroll through the left window and note two things: 1) whether or not you have a folder called TEMP, and 2) the location of your UA folder. Still working in the left window, click your UA folder and then click the Edit menu, where you'll click "Copy." Page 240 User's Reference Manual Unfair Advantage Next click the TEMP folder. Go back to the Edit menu and click "Paste." When properly done, this operation creates a duplicate copy of your UA folder (including its subdirectories) in the TEMP folder. Click the TEMP folder to reveal the UA folder within. Click the UA folder (in TEMP), then click the File menu (top left of screen). Click Rename and enter the new name as OLDUA. Press Enter to complete the renaming. You are now ready to download your upgrade or reinstall the software. When you install new UA software or an upgrade, it upgrade will overwrite the original UA folder, but will not affect your OLDUA copy. 12.4. Restoring the UA Folder Under normal circumstances, you would not use the backup copy of your UA software. The backup is intended only for cases of emergency, such as an unforseen problem with a newer version or hardware failure. Keep in mind that the software and data in your backup copy of UA will be current as of the last time that particular software version was used for daily updates (probably just prior to the backup date). If it has been more than two months since your last backup, don't bother restoring the full UA system. The database will be outdated (expired) and a new CD will be required from CSI. Certain components of the UA directory, such as archives\portfile.adm (your portfolio), \archives\cdbfacts.adm (your factsheets) and others may be restored from the backup copy regardless of the time that has transpired since the backup. If your backup copy of the UA folder is not outdated, you may restore it to become your working UA. First, delete the current UA folder (through the File menu in Windows Explorer), then drag the OLDUA folder out of the TEMP folder with your mouse. Drop it into the root directory and rename it UA. If you experience difficulties with an upgrade of UA that require you to restore an earlier version, please contact our service staff immediately so that they can attend to the problem before it affects other users. 12.5. Restoring the Factsheets The commodity and stock factsheets can be edited by the user to reflect your own conventions for tracking the markets. Although the CSI staff automatically maintains the factsheets through control files that are downloaded with daily updates, you have the power to preserve your edits by overriding those changes. (See Data Options - Updating Control File, Factsheet changes.) When your "Updating Control File" option is set to "automatic," your factsheets may be overwritten at any time. Other options allow for changes after "warn first," or to "Skip all" factsheet changes. Whatever your selection in Data Options, you may want to preserve your customized factsheet for later use, for reference, or to restore after inappropriate (for you) changes occur. The stock factsheet file is called \ua\archives\sdbfacts.adm The commodity factsheet file is called \ua\archives\cdbfacts.adm Backing up the factsheets Any time you back up the entire UA directory, these files are automatically included. To back up just the User's Reference Manual Page 241 Unfair Advantage factsheet files, right-click your START button and click "Explore." Navigate to the UA folder and click it, then click Archives. Click on whichever factsheet file you want to back up (sdbfacts.exe or cdbfacts.exe), then go to the Edit menu and click "Copy." Next, click your TEMP folder, go back to the Edit menu and click "Paste." This will put a current copy of your factsheet file in the TEMP directory. Restoring the factsheets If you backed up the full UA folder and want to restore just the factsheets, right-click your computer's START button, click "Explore," and navigate to the TEMP folder. Click the TEMP folder to reveal the OLDUA folder. Double-click OLDUA to reveal a series of folders, including one called ARCHIVES. Double-click ARCHIVES and, in that folder, you'll see both the sdbfacts.adm file and the cdbfacts.adm file. Click the one you want to restore (if both, hold down the Ctrl key while selecting), then click the Edit menu. Click "Copy." Next navigate back to your working UA folder and click the Archives folder. Go to the Edit menu and click "Paste." This will restore the factsheet files to your older version. If you backed up just the factsheet files within the TEMP folder, use the above directions, skipping the step of going into the OLDUA\ARCHIVES folder. 12.6. Refreshing Factsheets via the Web If you have any reason to believe the new factsheet file(s) will interfere with your applications, (e.g. you have modified the factsheet(s) and do not want to lose your changes) be sure to make a backup copy of your factsheets before proceeding. The CSI website often has the latest factsheet files available online. If you opted to skip any recent factsheet version, you can go to the website and get it retroactively. The UA Software Upgrades Screen shows "Unfair Advantage Headlines at this address: http://www.csidata.com/UA/uax.html Go there to find out if a factsheet file is available for download. If so, follow the on-screen directions to save and download the file. It should be stored in the UA\ARCHIVES directory. If the factsheet(s) you download do not include changes you feel are necessary, you can either revert back to your previously saved version or (preferred) edit the new file with your desired changes. 12.7. Debug Generator One of the great things about Unfair Advantage is that it is continually evolving with new features and enhancements. Unfortunately, new programming code sometimes results in unexpected problems that should be addressed by a CSI systems analyst as soon as possible. That's where the Debug Generator comes in. When activated, the UA software creates a file of technical information (driver operations) that can help pinpoint the problem so that it can be solved quickly and efficiently. The Debug Generator slows the software considerably, and should be used ONLY when requested by a CSI Technical Support Representative. You will receive detailed instructions from CSI on using this feature if it should become necessary. Page 242 User's Reference Manual Unfair Advantage 12.8. Display Tips at Startup The "Tip of the Day" is a useful bit of information about Unfair Advantage that displays each time the software is launched. It is generated from a revolving list of topics, each intended to broaden your understanding and enjoyment of UA and the CSI Data Retrieval Service. If you do not wish to view the list (perhaps after going through a complete cycle), you can disable it through the "General" tab of Data Options (on the Options menu). Simply click the checkbox (uncheck it) to turn the tips off. Re-check the box to view tips again. User's Reference Manual Page 243 Unfair Advantage 13. Troubleshooting 13.1. Installation Issues CD Won't Load If you followed the installation instructions and the software won't load, you may have received a damaged disk. Or, if you have a high-speed CD-ROM drive (36X or faster), you may be having an incompatibility problem with a CDR disk. We use a combination of CDR disks (which we record in the office) and pressed disks (which are made by an outside firm). Some high-speed CD-ROM drives can't read the CDR disks. If either of these seems to be your problem, please contact our Technical Support staff to request a new CD or discuss other options. 13.2. Downloading Issues Download Was Unsuccessful This can happen to new subscribers if you have incorrectly entered your User ID and/or Customer Number upon installation. Please double-check them on the "Account" tab of Data Options (on the Options menu) and try again. If you are repeatedly unsuccessful in attempts to retrieve an update, please CALL CSI! An error message displays during the brief periods when CSI's computer is inaccessible due to normal file maintenance. Try the call again in two or more minutes. If problems persist, you may want to try retrieving data through direct-dial access, where our backup system can deliver data to your computer in cases of more involved problems. Please note that you are responsible for any long-distance phone charges incurred. Data Distribution Takes Too Long The time required for data distribution is controlled by a number of factors. Among these are: the scope of your update (just domestic commodities, world commodities, options and/or commodities and stocks, etc.); the quantity of files that must be recalculated (as opposed to appended); the number of export format files that must be written to disk; and the number of screenings required. Here are tips you can use in designing your custom portfolio that will speed distribution: Use nearest future group (individual contract group) sparingly. This feature scans all contracts so it can automatically add new contracts and omit expired ones from your portfolio, which can be time-consuming. Do not select "Always Retrieve the Cash" from the "Cash/Saturdays" tab of Data Options (on the Options menu). Instead, select the "cash" option in the portfolio manager for those individual commodities for which you wish to view cash. Do use the "Append to portfolio files when possible" option on the General tab of Data Options. This reduces file building to the minimum required. Do not inflate the Charting Limit beyond the recommend ten to 12 charts. Doing so can slow your system in several ways. Page 244 User's Reference Manual Unfair Advantage Don't make indiscriminate changes to the Default Data Presentation through the "Rounding Ranging" tab of Data Options (on the Options menu). Whenever this is changed, UA must scan all data series and rewrite all files that are affected by out-of-range settlement prices. Recognize that a complex portfolio may take a while to build, especially on days when back-adjustments require extensive re-building of files. Accepting this fact won't speed distribution, but it will allow you to better manage your time. Why not find another task or take a short break during lengthy distributions? Using the Stock Scanner can be a very time-consuming, but worthwhile exercise. Time increases as more exchanges are involved and more days of data are included. We recommend you limit the Stock Scanner function to those days that you will be making use of the scanning file. Turn it on and off on the Stock Scanning tab of Data Option (on the Options menu). UA Duplicates Last Day of Data in Each Retrieval Session This is not a problem but a valuable UA feature. There is a very good reason for re-sending the past day a second time: Markets close around the world as the earth rotates, and we post data all during that period. If a customer calls before all data is released for the day, which happens as late as 8:00 PM Eastern time, data can be missing for some of the contracts. Error corrections on data released in earlier downloads are also corrected by about 8:00 PM. If we didn't supply the redundant update, you would miss those corrections. As far as we know, we are the only service in the industry to offer this luxury. It assures that you receive critical information, the loss of which could cause unpredictable voids in your data continuity. Time Delay for Far East Data Quotes from the Pacific Rim markets are posted at 10:00 a.m. eastern time for the corresponding current trading day. This means that Monday's trading in Hong Kong is posted to our database at 10:00 a.m. Monday morning eastern (Florida) time. To retrieve this data within our normal one-access-daily pricing arrangement, you may either retrieve it along with your other data on Monday evening (eastern time) or skip evening retrieval sessions. If you choose the latter, you'll always pick up the fresh Pacific Rim prices in the morning, along with the previous evening's data from other exchanges. Another option is to call twice daily for updates (see below). Multiple Daily Updates Retrieving data from the CSI host computer more than once a day isn't really a problem, but it is a source of additional expense. You might make a call in the morning to retrieve Pacific Rim data, or perhaps in early afternoon for European data, and then another in the evening to update the balance of the markets. Retrieving data more than once daily will result in extra charges, however. Please see our current rate schedule for details. 13.3. Analysis Issues Data Won't load into Analysis Software or Chart With UA The database is probably locked. Many a new subscriber has installed the software and tried to open the CBD files through the FILE Menu. Sorry, but this doesn't work. You'll need to download an update from CSI to unlock the database before you can chart any UA data. User's Reference Manual Page 245 Unfair Advantage If some charts display, but others won't, the number of charts to display is subject to the "Memory Cache Size" selections for charting limit on the General tab of Data Options (through the Options menu). The initial setting is somewhere around ten or 12, which is the recommended quantity. Once this limitation is reached, no more charts will display, even if they are listed in your portfolio. An error message will display for each chart over the limit. To create more charts, close the current charts, then create additional ones through the charting method of your choice. UA Database is Locked The database is intended to be locked until such time as you complete your first successful data retrieval and distribution session with UA. Please see "Downloading Quotes" for instructions. The database can also be locked if you allow service to lapse for a month or more. Retrieve a daily update to unlock the database. If more than two months have transpired since your last update, a new CD-ROM may be required. A replacement CD is available from CSI at an extra charge. See the license agreement or contact CSI marketing for details. An incorrect system date on your computer can result in the database being locked unnecessarily. Reset your computer's date to correct this problem. UA Database is Still Locked The database stays locked until the first data distribution has been completed. If you clicked the "cancel" button during distribution, you stopped the process before the database was unlocked. PLEASE DO NOT CANCEL the distribution process, even if it is lengthy. Unable to Create Multiple Computed ASCII Files With Different Contract Selections UA creates unique filenames for different computed contracts based on your input for the type of data series, rolling parameters, etc. A nearest future corn contract would have a different filename than a Perpetual Contract data corn contract, for example. Even two nearest future corn contracts with different roll-forward criteria would have different filenames. However, UA does not identify every contract selection within the filename. If you make multiple computed series for the same commodity, with the only difference being a different list of included delivery months, the files will all have the same names and will overwrite each other. To avoid overwriting such files, they should be stored in different directories as identified through the portfolio manager. Even then, the filenames and chart names within the different directories will be identical. Unless you have a specific need to compare very similar computed contracts as described above, we recommend using the default list of delivery months for each computed series, or sticking with one nonstandard list of contracts that is used consistently. 13.4. Data Issues Close Value is Higher Than the High, or Lower Than the Low Page 246 User's Reference Manual Unfair Advantage This is probably not an error, but the result of your choice of default data presentations. Upon initial setup, you had the option of presenting the actual prices, regardless of where the settlement lies within the trading range, adjusting the high and low to encompass the settlement price, or adjusting the settlement to be within the daily range. To change your data presentation, click the Options menu, then click Data Options and check your preference under "Making Close in High/Low Range." An on-screen description displays for each choice. Both the Open and Close are Outside the Trading Range This problem is rare, but more likely to occur in overseas data. It has been reported specifically in the CAC40 Index. The exchange did not publish opening prices in the early days of trading, so to keep charting programs from blowing up with the nonexistent open, the close (settlement) was proliferated into the opening field by CSI. The settlement (fourth field) is not necessarily a traded price and can be outside the high-low range. We consider this to be the most appropriate approach, as our other options were to show an open that is fictitious, such as the high-low average in the opening field or a zero. If you see this occur, i.e., the open equals the close and both are outside the high-low range, then you have the option of using another program to compute an artificial open (coupling in yesterday's close or calculating the high-low average, for example). Check the on-line factsheet's footnote to find out if this or other anomalies are likely in the markets of interest to you. Distortions in UA Charts or Computed Data Series Any time there is a distortion in a data series, a problem exists somewhere along the line. It could stem from a software error, a data point error or a damaged database file. Here are our suggestions for pinpointing the culprit. • If you are creating a computed contract, try creating a different computed series from the same data. Try a nearest future series if a back-adjusted won't work, for example. If nothing works correctly for that commodity, but other commodities do work, a HISTORY REFRESH of the specific database file might do the trick. Get it from the CSI website at http://www.csidata.com. • If a problem occurs in creating the same computed contract for all commodities, but those commodities are otherwise normal, it is likely a software error. Go to CSI's web site at http://www.csidata.com, then click "Support," then "Upgrades" to see if there is a new upgrade of UA. Download and install the upgrade (if you don't already have it) and try charting your series again. It may be we have already discovered and corrected the problem. If the problem continues, please e-mail [email protected] with the specific parameters you used in the failed attempts. We'll try to solve the problem ASAP. • If you're using a third-party analysis program to chart the data, try charting it directly through UA. If the identical data series will chart with UA, but not in another format, there is likely a programming error or format incompatibility with that software. Call your software supplier for a remedy. It is usually pretty easy to spot a data error. It may appear as a spike or single data point, either much higher or much lower than the rest of the data. The balance of the chart is severely compressed. If you suspect a data error, please contact CSI with details on the contract or stock in question, the date, the suspected field or fields and your reason for believing it is in error. If the data point is confirmed as an error, a correction will be transmitted to all UA subscribers in their next download. Ask about our rewards for being the first to report User's Reference Manual Page 247 Unfair Advantage an error. UA Won't Create Delivery Month Codes Like QuickTrieve It's true, UA does not create QuickTrieve-style delivery month codes (code 55 for nearest future, for example) because its architecture is far too flexible for the rigid guidelines the codes require. UA uses descriptive filenames and chart descriptions to identify individual data series. Please refer to "File and Chart Naming Conventions" for a better understanding of UA's chart and file names. Back Adjusted Contracts That Roll N-Days Prior to Expiration Don't Roll Out of Current Contract on Time UA can execute adjustments based on any roll date perfectly throughout the historical past, but when it comes to the current contract that is about to expire, the program has insufficient information for early rolling. Both UA back adjusters depend upon knowing when a given contract rolls by simply reviewing the historical series of all the delivery months in the database for the commodity in question. Neither back adjuster can absolutely determine when the nearest delivery month will expire until after the fact. This may seem to be a shortcoming in the software, but it is not. All traders should be aware of the rolling conventions expected and effect the rolling requirements on the appropriate day. CSI provides alert calendar information under the "Alerts" tab for quick review. The last trading day is reliably posted for regular review and examination for most commodities followed by UA. Mutual fund data seems distorted CSI's mutual fund data is just about as perfect as the commodity data, but can be distorted if not handled correctly. We regularly review the mutual fund data deeply into the past, and errors are quite rare. Discontinuities and strong drops in price over time occur when you have not requested that UA apply supplied dividend and capital gains payments. You may choose between two forms of adjustment from the "Historic Adjustments" tab of UA's Data Options. New files won't create There are several reasons why a file might not be created on your hard drive, as explained below. If these common situations have been ruled out as the source of the problem, feel free to contact CSI Technical Support for further investigation. 1). The directory does not exist. Right-click the "Start" button and explore your drive to confirm the existence of the specified directory. Create the new directory if necessary. 2. The file is open in an application. If this is the case, shutting down all programs, including UA, and trying again will solve the problem. 3. The hard drive is out of space. Right-click your "Start" button and click "Explore." See the "Free disk space" notation near the bottom of your screen. 4. Norton Antivirus is running. This can interfere with the creation of new files. We recommend Uninstalling Norton Antivirus and trying again. 5. IF you are running Windows NT, you may not be able to create files without administrator privileges. Page 248 User's Reference Manual Unfair Advantage Check with your network administrator about this feature. 13.5. Software Issues Tips at Startup The Unfair Advantage "tips" that display when you start the program are intended to familiarize you with the system's capabilities in an inobtrusive way. If you have already been through the limited selection of tips, or would rather not view them, you may simply turn this feature off. To turn off tips, click the Options menu, go to the General tab and click the checkmark on the "Display tips at startup" entry. This will un-check the option and eliminate tips from your daily routine. Computer Locks Up We used the latest in technological advances in designing Unfair Advantage, which sometimes limits backward-compatibility with older equipment. We have found that older hardware, specifically older Video Cards or Video Adaptors, can cause the UA software to lock up your computer screen. Fortunately, is it a simple, inexpensive process to upgrade out-of-date video equipment. If your computer locks up while using UA, follow these steps to see if the problem is your video card: 1) Click the "Start" button in the task bar and choose Settings|Control Panel. 2) In the Control Panel double-click on the Display icon. 3) Choose the settings tab in the Display Properties Dialog. 4) Click on the "Change Display" Type button. 5) You should now see a Change Display Type dialog that has a Adapter Type group. Under Adapter Type click on the Change button. Note: write down your current adapter (driver). You will have to change back. 6) Select the Show All Devices radio button in the Select Device dialog. 7) Select the Standard Display type in the Manufactures selection box and Standard Display Adaptor from the Models selection box. 8) Then Click Ok. 9) If it tells you it needs to reboot to make the change, click ok and let your system reboot. This will change your display to a 16 color VGA mode. Your screen will look a little funny, but don't worry, this is just to check if it is your video driver's fault. Try running UA now that the video driver is a generic one. If UA works now, then the driver is your problem. Change your adaptor back to the one you where using before you changed it to Standard VGA (Do this by following all the above steps just this time Select the selections you wrote down prior to the change.) Once your Screen is back to normal, visit your Video Card manufacture's site and get the updated verision of your display adaptor, or contact your video card manufacture for information on an updated adaptor (driver). UA Manual Outdated After Software Upgrade User's Reference Manual Page 249 Unfair Advantage We urge you to read the notices on the web about each upgrade BEFORE you download the software. These notices contain important information about recent enhancements and known problems with each UA version. Although we don't change the on-line manual with each software upgrade, we do periodically revise it to stay relatively current. You may navigate the latest manual on the CSI website at http://www.csidata.com (click Support and then Online Manual) or, if a new version is available to download, it will be listed along with other product upgrades. To view the version that is currently stored on your hard drive, click UA's HELP menu, then click Help Topics. You might also check the Tech Talk section of recent CSI Technical Journals to see what current topics have been addressed by our Technical Support staff. Active subscribers receive the CSI Technical Journal by mail each month, and it can also be read directly from web site. Page 250 User's Reference Manual


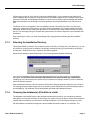
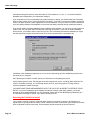
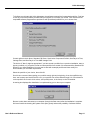
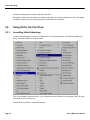
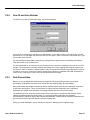

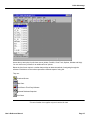
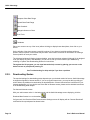
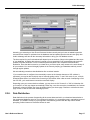
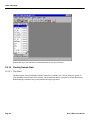
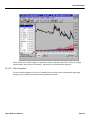
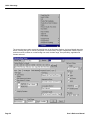


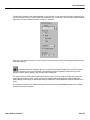

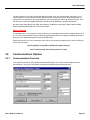
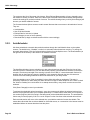


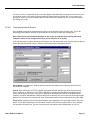

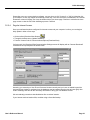

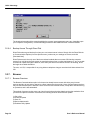


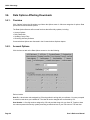
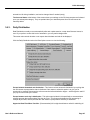

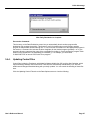

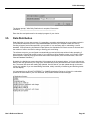
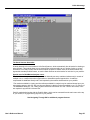
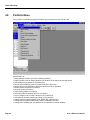

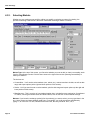
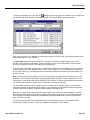

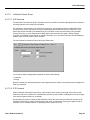


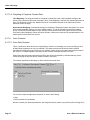

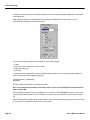
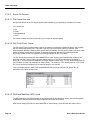
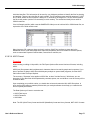

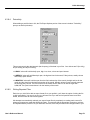

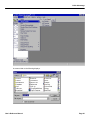

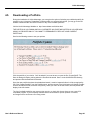
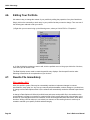
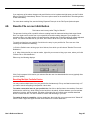

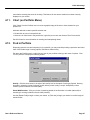


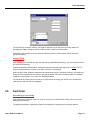


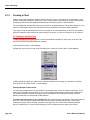
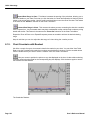

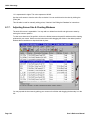
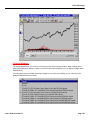
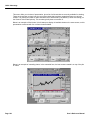
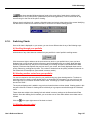


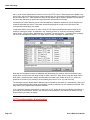

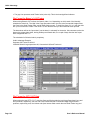


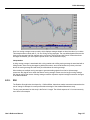
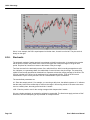
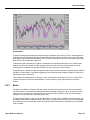
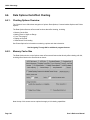

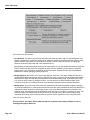
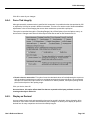
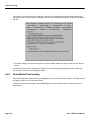
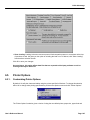
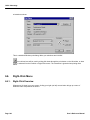


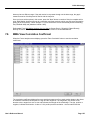


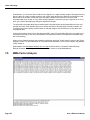


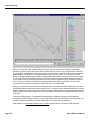


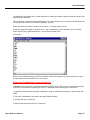

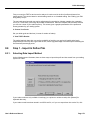


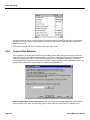
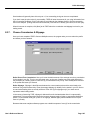
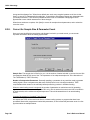
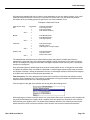

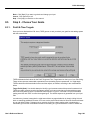

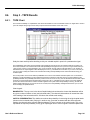

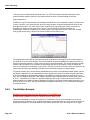


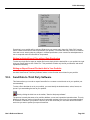


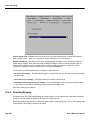


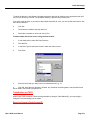
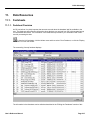


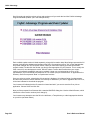
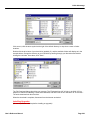


![Main lSetup l Cleanup] Parameters Locals}](http://vs1.manualzilla.com/store/data/005794368_1-f1180d1b21e5ef681561217b8f35e179-150x150.png)