1
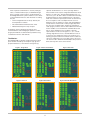
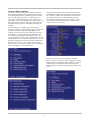
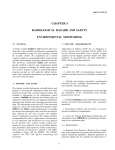
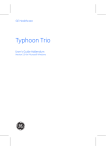
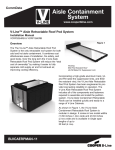
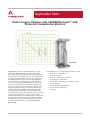
Application Note
Radon Progeny Rejection with CANBERRA Argos™-5AB
Personnel Contamination Monitors
Argos-5AB
CANBERRA’s personnel contamination monitors, and in
particular the ARGOS-5AB gas flow proportional model,
are used throughout the world’s nuclear industry. Typically
these monitors are designed to detect surface contamination
from alpha, beta and gamma emitters (if the gamma option
is installed), however, the units also have the capability to
“reject” the presence of radon progeny which often plates
out on synthetic clothing materials and plastic objects such
as polyester clothing, fleece, and hard hats. Activity levels
of these progeny have the potential of exceeding the alarm
set points for external surface contamination typically set
to detect 5000 dpm β /1000 dpm α (83.33 Bq & 16.67 Bq,
respectively), thus presenting results which appear to be
“Contaminated”, when the alarm indication is due to naturally
occurring radioactive materials, and not plant or facility
related licensed material. To complicate matters, many plants
have set more conservative alarm level settings, sometimes
considering the presence of “difficult-to-detect isotopes in
the station radionuclide mix” as recommended by INPO.
(INPO 05-008).
In this application note, the following topics will be covered:
• Background of the problem
• Method of “rejection”
• Guidance and Acceptance Criteria
• Argos Monitors and Software
• Determination of the Presence of Radon Progeny
• Specific Settings
• Practical Demonstration Example
• Data Collection and Analysis
• Summary
1
Background (the radiation and problem)
The Basic Method:
Radon is a colorless and odorless radioactive gas that is
produced by the radioactive decay of radium. Radium is a
product of uranium decay and is found in trace amounts
naturally in nearly all rocks, soils, and groundwater as well as
building materials, plants, animals, and the human body. One
of the known characteristics of radon related contamination
events is that they are normally very close to release limits
(i.e. low activity). Note the radon decay chain shown on the
previous page. Note the short lived alpha and beta emitters
which are present as radon progeny (Po-218, Pb-214, Bi-214,
Po-214) which attach themselves to clothing and objects.
The method used by CANBERRA involves the use of the
beta to alpha activity over a range of body locations to trigger
monitor actions, and settings dependent upon the appropriate
selection of the ratio. In selecting this ratio, one must consider
several factors to avoid the identification of contamination
resulting from plant operations as “radon” related. Typical
plants without failed fuel have beta to alpha activity ratios
that are in the 100’s of thousands to millions to one. Thus,
the typical expected presence of any alpha related activity
would not be due to normal plant operation, but most likely
from radon related decay products. If sufficient alpha activity
is present due to facility conditions/source term, then this
method must be used with extreme caution /conservatism,
restricted to personnel who are not working in areas of
potentially elevated alpha contamination, or not at all.
From the decay chain, one might expect a certain fixed
beta to alpha particle ratio if this chain was in equilibrium.
However, in practice, in air, and particularly on objects, the
decay products are not in a set equilibrium. Many factors can
affect the measured ratio including:
• Attenuation of alpha in air (i.e., distance from the
detector).
• The type of ventilation system(s).
• The concentration of progeny on the monitored object
and in the air.
• The time elapsed from acquiring radon progeny on
clothing to the monitoring point.
Applicable Guidance and Acceptance Criteria
• The Institute for Nuclear Power Operations (INPO)
and the American Nuclear Insurers (ANI) have
acknowledged the ability of monitors to identify
naturally occurring materials such as radon progeny.
For example, INPO states the following:
“If the monitor does not have the ability to account for
radon, have procedures in place to evaluate alarms for
short-lived or natural radioactivity”
The problem also arises in that there is no clear way to
immediately and positively identify the cause as activity from
radon progeny without some type of spectroscopy. While
this spectroscopy is practical using very close and constant
geometry, as is done using CANBERRA’s iSolo® and iCAM™
products, this method isn’t possible using either gas flow or
solid scintillation based alpha/beta detectors due to variable
and potentially significant distances (relative to the range
of the alpha particle) from the detectors, and the lack of
sufficient spectroscopic capabilities of these detectors.
• Similarly the American Nuclear Insurers (ANI) notes in
ANI Section 8.5 Radiation Protection Bioassay.
“The bioassay program should be governed by a set of
procedures which describe the following:
8.5.2.7 Methods to determine whether PCM/PM
alarms are caused by radon, noble gas, internal
contamination, distributed external contamination, or
discrete hot particles” and…
In a typical nuclear power situation, the personnel (or
equipment such as hard hats) which were determined to be
contaminated at the RCA exit point and thought to be so from
radon progeny, would sit off to the side and wait for the short
lived radon progeny to decay. Once decay had occurred,
personnel would make additional attempts at passing through
the monitors to achieve a “Clean” determination. On days
where radon, and thus radon-progeny concentrations may
be high, it may not be uncommon to have a handful, or up to
a dozen or more personnel (and objects) waiting to “decay”
prior to exiting the RCA.
“If Radon is determined to be the cause of the alarm, a
PCM with Radon (alpha) discrimination capabilities may
be used to clear the individual”
• EPRI states the following:
“Radiation Protection Response to Indicated
Contamination
If contamination is indicated on a person, the following
steps should be taken:
…. 4. Determine if contamination is due to short-lived
radioactivity (i.e., half life < 2 hours). Such may not be
considered a PCE. Refere to the EPRI PCE guideline
(EPRI 2005)
Many personnel waiting is costly to the utility/facility
because personnel are still “on the clock” sometimes
collecting overtime pay, as well as stressful/annoying to the
employees who cannot leave the RCA for home, meals,
or other engagements. In addition, the possibility of true
contamination may also be on the workers’ minds. The
potentially contaminated personnel, objects/clothing, such as
hard-hats, can become a distraction as well as an additional
source of unnecessary work/surveys for radiation protection
personnel who may already be short-staffed. This is often
likely the case “If the monitor does not have the ability to
account for radon, have procedures in place to evaluate
alarms for short lived or natural radioactivity” (INPO 05-008).
Thus, procedures and personnel must be available to deal
with radon progeny if an automated system is not available.
And…
2
If the suspected contamination is cause by noble gas,
radon, or medical radioisotopes, as identified through
decay counting, isotopic analysis, worker interview, or
knowledge/verification of plant conditions such as leaks
or environmental inversions, then the article of clothing
may be:
• Left in a designated area for decay and may be
resurveyd later for release
• Decontaminated and returned to the owner
• Released based upon isotopic analysis
separate smaller detectors or “zones” per large detector.
These smaller zones may be configured/combined as virtual
detectors as sum zones. The principle behind the use of a
sum zone (s) is to be able to detect contamination which may
be between detectors in the minimized areas of the frame
which has no detector exposed (also known as dead zones).
As a consequence of this assumption that the source is
between zones, the efficiency is lower, and spread/disperse
activity which is characteristic of radon progeny deposition,
the sum zones normally tend to alarm more frequently for
radon progeny. However, this has been addressed in how the
monitor handles such contamination and will be discussed
later on in this application note. A number of pictorial
representations can be seen in Figures 1, 2, 3, 4, 5 and 6
showing single detector zones, and what different series of
a sum zones are comprised of (zones are shown by cross
hatching). Grayed out detectors indicate that those detector/
sum-zone combinations are not possible. These sum zones
can also be used to determine the beta/alpha ratio present to
drive radon rejection actions of the monitor.
So guidance exists from industry documents and
recommendations acknowledging the problems of radon
progeny and methods to deal with these problems using
contamination monitors and methods.
The Monitor:
The ARGOS-5AB as typically configured at many nuclear
power facilities includes up to twenty-five (25) gas flow
proportional detectors, each detector having three (3)
Figure 1- Single Zone
Figure 2 Intra Pair Sum-Zone
Figure 3 Inter-Pair
Figure 4 Inter-Pair
Figure 5 Quad Zone
Figure 6 Another Quad Zone
3
The Argos Monitor Software
Using the keyboard down arrow to the bottom of the menu
and highlight the “Radon Rejection Support” and toggle the ±
key to set this to “YES”. Press the “ESC” key twice to retain
your settings and return to the Service Menu. (Note that
your menu may appear different for other settings, as these
screen captures have been produced on a demonstration
software version of the monitor.)
The monitor software includes data collection, results files
and archiving capabilities which enable the easy collection
of monitoring data related to establishing your beta to alpha
ratios for radon progeny rejection or “radon rejection”. It
is possible to enable radon rejection in the software and
capture data to tune your beta/alpha ratios and settings. Let’s
look at the data files present on the Argos monitor and see
what radon progeny rejection related data and settings are
available.
The basic settings are available only if radon progeny
rejection is enabled. So from the Service Menu of the monitor
(available by using the USB keyboard plugged into the
computer of the monitor) press the escape key. Once in the
Service Menu, press the CTRL-F10 key combination, this
is a “hidden” key combination, which will place you in the
Factory Setup Menu, from the Factory Setup Menu, select F1
– Model Selection. Care should be used in this menu, as it is
possible to change the monitor type and other configurations
that may cause you to lose your original monitor settings.
Please see the user’s manual to make sure you have backed
up your settings prior to entering this menu.
Now that your monitor has been enabled at the Model
Selection Level, it is time to proceed to enabling the rejection
settings within the Setup Menu. The Setup Menu is selected
by pressing “F3” on the Service Menu, then select “F10 –
Radon Rejection” to enter the radon progeny rejection setup
screen.
4
Note that currently as seen below, while “Enabled” no action
is actually taken by the monitor to change any settings “If
Radon [progeny are] is Detected (Beta/Alpha Ratio within
Limits)”. However, in this “Enabled” state even though no
action is being taken, the Monitor starts to collect data in a
file called RADON.csv. This file, and the RESULTYYYYMMDDHHMMSS.TXT files will contain the BETA/ALPHA ratios
for all Possible changes which might occur, and how/when
the changes will be made is determined by several factors.
These are described in the following paragraphs.
By default the Radon [Progeny] Rejection will be set to the
“Disabled” state. Toggle the ± key to enable. When enabled
the monitor will come up in the Factory Default settings.
5
How does the monitor determine if Radon
Progeny is detected?
The monitor then makes the following comparisons:
1. It checks the ratios against the Lo Limit and the High
Limit in each of the areas monitored.
2. If the beta/alpha ratio is within the limits specified in the
settings (which are 0.6 to 6.0 as seen in figure X below)
it sets a “Radon [progeny] Detected” flag to “YES” for
those zones.
3. If the beta/alpha ratio is outside the limits (in this case
less than 0.6 or greater than 6.0) the “Radon [progeny]
Detected” flag gets set to “NO” for those zones.
Using the basic premise that we discussed at the beginning
of the Application Note, the Monitor software makes this
decision based upon the Beta/Alpha Ratio. The Ratio is
calculated in one of two ways. One being the “Net Rate”
in cps of the Beta/Alpha count rate and the second or the
“Activity” being the (beta count rate/efficiency) divided by the
(alpha count rate/efficiency).
Now that the decision flags have been set, some actions are
then taken/or not taken by the Monitor program.
SOME TYPICAL SETTINGS AND ACTIONS
Many customers find settings for the Beta/Alpha ratio in
the 0.6 to 6.0 range to be effective. However, ratios as high
as 15 have been used. The following screen captures will
progress from the least aggressive to the most aggressive
settings to reduce radon progeny false alarms. This is often
the way that the radon progeny rejection can be setup in
an experimental fashion in real time while individuals whom
are known to have radon progeny on them are available for
testing. Starting out with the least aggressive settings, and
continuing to take steps using settings until an acceptable
level of clearance of individuals as “clean” is achieved. Once
the settings have been tweaked experimentally, a freshly
made representative plant smear should be created and
placed on individuals passing through the monitors to ensure
that actual contamination does not exit the RCA. The idea
is that the plant smear will/should make the beta/alpha ratio
high enough so that it exceeds the upper level of the ratio
setting.
Least Aggressive (1): (Turn off Sum Zones Alarms for just
those detectors that have the beta/alpha ratio within the
limits from 0.6 to 6.0) Don’t allow Sum Zones to Alarm on
“Detectors that show radon [progeny]: So any sum zone
which would normally be considered contaminated (nominally
5000 dpm or greater beta or 1000 dpm or greater alpha)
would not alarm and would give a “Clean” result. Note
that this happens ONLY for SUM-ZONES (combinations
of individual detector sections where at least one of the
detectors within the sum zone has a Radon Detected flag
set to “YES”). A single zone, or single detector section would
still be considered contaminated if it were determined to
be above 5,000 dpm and 1000 dpm alpha activity or beta
activity, respectively.
An individual steps into the monitor and is counted on the
front side, then turns around and is counted on the back
side. After each side’s count is completed the monitor has
calculated the beta/alpha ratio for the individual zones, and
in the case for settings above, the beta/alpha ratio for the
activity in any of the sum-zones (Ratio Sum Zones set to
“Enable”) are also considered.
6
More Aggressive (3): Sum Zone Alarms are turned off for
only detectors that show radon (ratio within limits), but now
the CTP (definitely contaminated) Alarm level is used. Please
see the definition of ALS, ATP, CTP and UTP in the Argos
manual for further specifics.
More Aggressive (2): Don’t allow any of the Sum Zones
to alarm if any one (1) detector section, or any one (1)
Sum Zone has the correct beta/alpha ratio. For example, if
detector section 6a (leg) had a beta/alpha ratio greater than
or equal to 0.6 AND less than or equal to 6.0, no sum zone
would alarm. Again, single detector sections would still alarm
if they were above the alarm set points.
More Aggressive (4):
7
More Aggressive (5): Now the Alarm settings use multipliers
(Alarm level setting times the multiplier) of 5000 dpm times
2.25 = 11,250 dpm for detectors on the monitor, if that single
detector has the beta/alpha limit within the limits. Detectors
or SUM Zones which do not have the correct ratio, do not
have alarm multipliers applied. The aggressiveness of this
approach can be adjusted by the multiplier value.
Most Aggressive (6): Now the Alarm settings use multipliers
(Alarm level setting times the multiplier) of 5000 dpm times
2.25 = 11,250 dpm for every detector on the monitor, if any
single detector or sum zone have the beta/alpha limit within
the limits. The aggressiveness of this approach is now
limited only by the value of the multiplier. Note: The value
of a multiplier can target to the most problematic areas, or
left at 1.0 (no effect) for areas where one would not want to
increase the alarm level setpoint.
8
Final Safety Fallback: So you ask. Where is your ultimate
safety fall back position on this? The answer is in enabling
the High Contamination Alarm in the Common Values Section
(F1 from the Setup menu) and its associated High Activity
Limit set globally for the monitor in the Global Setting (F3,
Shift+F5 from the Setup Menu, and then Alt+1 for beta,
Alt+2 for alpha). All the potential actions by the Radon
Progeny Rejection are overridden if the contamination level
exceeds the levels set. This value is set at 22,200 dpm
times the efficiency value of the detector for beta, or alpha,
respectively. For a nominal efficiency value of 10 % the High
Contamination Alarm would be triggered at a net count rate
of 2,220 net cps. The level can be set differently for various
areas (foot, top of shoe, body, head, and hand) by using the
F5 Group Settings.
9
A PRACTICAL DEMONSTRATION
As seen on the Monitor program:
The easiest way to demonstrate how this all works in practice
is to use some actual preliminary files/settings from a monitor
at a facility with significant radon progeny levels. At this
facility, the beta activity levels on some clothing (polyester
blend pants) and hardhats were in excess of 15,000 dpm as
reported by the monitor. The typical alarm level settings for
this facility are as follows:
Alarm Level settings:
1. Beta: 4500 dpm (4p)
2. Alpha: 1000 dpm (4p)
Radon Progeny Rejection settings as seen below can be
seen in the SETUP.TXT file and a screen capture from the
Monitor program. Note that you would typically not use both
the CTP and multipliers at the same time, as the monitor
determines the CTP first and then applies the multiplier
value. More exact control can be achieved by adjusting the
multiplier alone and not use both the CTP and multipliers
combined:
The “Contaminated Screen” bitmap generated from an
individual with radon progeny on them is generated when a
contaminated result is found:
SETUP.TXT File:
10
The ratios are calculated for the individual detector zones,
detector 5 (a “leg” detector) for example has three sections
5a, 5b and 5c. The beta/alpha ratio is calculated for each
single zone. In addition, detector 5 also has SUM ZONES
associated with it (we will just consider single detector
section zones for the purpose of illustration) these are intrapairs 5a-5b and 5b-5c. When we look at a RESULT.TXT file
for the front side (denoted by a “P1 C” suffix on the file to
denote that the result was contaminated “C” and the front
side position 1 “P1”) (Figure below) we can see the beta/
alpha ratio for these detectors. For detector 5c the “Radon
Ratio” is 4.3 which is in between 0.6 and 9.0 beta/alpha
ratio. Thus Radon Detected = Yes in the header of the file.
Thus the monitor has taken the following actions. If “radon”
was detected the Alarm level was multiplied by 2.25 so we
see the Alarm of 75 Bq times 2.25 is now set at 168.8 Bq.
Also, in this case CTP will be used instead of CTP so the
CTP for this new Alarm Level is 180.5 Bq. This has been
set on detectors in the Body section. Note however that the
multiplier for the Foot is set at 1.0, so the Alarm setting is
unchanged. However, since we are using CTP instead of ATP
on “All Detectors if Any Show Radon” the Used Trip Point for
the Alarm is set at the value for CTP. Thus all the actions that
were to be taken were applied.
11
While the radon progeny rejection worked for these
detectors, still several detectors were considered
contaminated, and likely were due to radon progeny. So
why weren’t these detectors caught by the radon progeny
rejection? Let’s have a look at detector 16a on the front of
the body which can be seen in the “Contaminated” image
at being at 6,706 dpm. If we look for detector 16a in the
RESULT.TXT file we see the following:
No radon ratio (no beta/alpha ratio was found). When no
ratio is present, radon progeny flag is set to NO, and the
proper ratio does not exist according to the monitor. Thus,
per the setup, multipliers were only to be used on “Detectors
that show radon”, since the beta/alpha ratios were zero. No
multiplier was applied. However, since the CTP was to be
used across the entire monitor Use CTP instead of ATP on
All detectors if any show radon. But the CTP of 10.1 was just
0.7 cps below the actual net count rate of 10.8, and thus the
result was considered to be “contaminated”.
12
Practical Determination of the Beta to
Alpha Ratio
Here a RADON.CSV file has been copied from the DATALOG folder of an Argos-5AB Monitor. Note that for all
contaminated results a corresponding data and time stamped
entry will also be made in the CONTAM.CSV file. These are
results extracted for a single individual who was determined
to have radon progeny on the legs of his pants in zone 9 and
zone 16 (these zones correlate to detector sections 3c and
6a as seen in the zone pictorial below). Only the data from
zone 9 is displayed in the Excel sheets.
Determination of the Beta to Alpha ratio can be achieved by
analyzing the results of the RESULT.TXT files, however this
is time consuming when many files need to be evaluated.
Once radon progeny rejection has been enabled on the
monitor, the monitor will collect the beta/alpha ratio data
for each and every zone of the monitor, for every individual
monitored in the RADON.CSV file. The Radon Detected flag
may be NO in these trials since you are collecting data to
determine the beta/alpha ratio, and if the ratio does not agree
with your settings, then the NO flag will be set.
CONTAM.CSV
RADON.CSV
13
Once all the data associated with the collection of volunteer
personnel is collected, the RADON.CSV file can be analyzed
by body area and the average ratio’s selected. Various
analyses may be performed to determine the averages,
ranges, and most appropriate ratios to be selected for trial in
the monitors.
14
Collection and Analysis of data:
Setting up to perform and document the collection of radon
progeny data by considering the inclusion of the following
elements:
• Outline a test plan and the steps needed to complete
the testing. Determine a location within your facility
that you have identified as a source of radon progeny,
and the absence of licensed material.
• Configure the monitor so it is ready to collect data.
Make sure all monitors are operational and have
recently passed their routine performance /alarm
testing successfully.
• Have a recently prepared representative plant smear
to test that the radon progeny rejection settings do
not pass personnel with a plant smear on them as
“Clean”. This is needed to validate the radon progeny
rejection settings. Prepare a representative plant
smear using methods outlined in the most recent
INPO How To, RP 1-4 documents available on the
INPO web site.
• Have volunteer personnel wear clothing materials
such as micro fleece, plastic hardhats, and polyester/
synthetic blend materials. If you have identified
problem clothing, make sure to include this in the
testing.
• Challenge the response and performance of the
Monitor in the presence of Radon Progeny only,
Radon Progeny plus a representative plant smear,
and the performance of the monitor with Radon
Progeny rejection enabled, and disabled.
• Consider the use of some “control” personnel who DO
NOT wear materials which accumulate radon progeny.
• Determine your acceptance criteria for overall
performance. Does the radon rejection setting
identify actual contamination at an acceptable level
in the presence of radon progeny? Does the monitor
perform acceptably in the absence of radon progeny
with radon progeny rejection enabled? The monitor
should pass the INPO How To, RP 1-4 at 90% or
better in the absence of radon progeny, and ideally at
the same rate with radon progeny present. Determine
the rate at which you will consider the rejection
settings successful with significant radon progeny
present. Will greater than 80% be successful?
• Monitor all personnel in an Argos unit and get a
“clean” determination on each individual prior to
putting them into the area of radon progeny. It is
possible for personnel to have radon progeny on
them from their home environment which may still be
present on their clothing depending upon the levels at
home, and the time it takes them to travel from home
to work.
• After the data has been collected and analyzed and
the monitors have been setup for radon progeny
rejection, send personnel back through the monitors
after accumulating radon progeny, to judge the
efficiency of the rejection settings. Some typical
reductions in radon related alarms range from
approximately 60 to 75 %. Define an acceptance
criteria goal for reduction of alarms. Determine how
“aggressive” you can be in reducing radon progeny
alarms. This will depend upon the range and the
severity of your radon problem.
Consult the User Manual and the CANBERRA Services and
Application Support Group (ASG) for assistance or services
to complete testing.
15
Summary
CANBERRA’s radon progeny rejection algorithm has been
demonstrated to significantly reduce the number of false
alarms due to radon progeny when correctly implemented.
Reduction of these alarms also results in major productivity
improvements enabling the radiological protection staff to
focus on true contamination events without the distraction
of false alarms and management of personnel with
radon progeny related alarms. Please contact your sales
representative to learn how the radon progeny rejection
algorithm can be implemented in your facility and obtain
customer references.
References
1. Institute of Nuclear Power Operations (INPO) INPO
05-008 Guidelines for Radiological Protection at Nuclear
Power Stations (2005).
2. American Nuclear Insurers (ANI) ANI Section 8.5
Radiation Protection Bioassay. (2008).
3. Argos-3/-5 Whole Body Surface Contamination Monitors,
User’s Manual, Canberra Industries (2010).
Agos is a trademark of CANBERRA Co.
iCAM is a trademark of Canberra UK Ltd.
iSolo is a registered trademark of Canberra Industries, Inc.
Measurement Solutions for Nuclear Safety and Security CANBERRA is the Nuclear Measurements Business Unit of AREVA
n
For more information please visit: www.canberra.com C39338
- 9/12
16