1
iSNMP Suite
User Manual
10/04/2005
page 1 of 45
iSNMP Suite Help
Table of Contents
Chapter 1 – Getting Started with iSNMP Editor
Page 2
1.1 Auto-Discovery
1.11 Unmanaged Devices
1.12 Managed Devices
Chapter 2 – Manual Device Configuration
Page 9
2.1 Unmanaged Devices
2.2 Managed Devices
Chapter 3 – Tag Configuration
Page 13
3.1 Polled tags
3.2 Trap tags
3.3 Finding tags
3.4 Filtering tags
Chapter 4 - MIB Template Generator
Page 20
Chapter 5- SNMP traps and Event Notification
Page 22
Chapter 6 - Network Analyst Configuration
Page 25
Chapter 7 – User-Defined derived tags
Page 26
Chapter 8 –Advanced iSNMP Settings
Page 28
Chapter 9- iSNMP Communicator
Page 30
Chapter 10– iSNMP DataViewer
Page 35
Chapter 11 – iSNMP OPC Interface
Page 39
Appendix A – COM Call Tracing Using TraceHook Components
2
Chapter 1 - Getting Started with iSNMP Editor
Before you can begin to monitor the health and performance of your Ethernet network, IndustrialSNMP
must first be made aware of the network devices that you wish to monitor. Setting up a database of
network data is easy and quick with IndustrialSNMP Editor. The procedure is as follows:
1.
2.
3.
4.
Auto-discover or manually define the network devices that you have.
Define the data points that you want to read from the network devices.
Monitor the configured devices in the iSNMP DataViewer, or
Set up your HMI to read the OPC tags from the IndustrialSNMP OPC server.
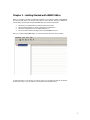
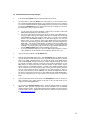
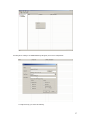
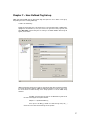
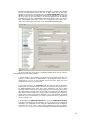
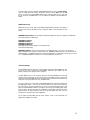
When you first start IndustrialSNMP Editor, you will see the Explorer-like screen as shown below:
To define the devices in your network, you have two choices. You can either Auto-Discover the network
devices (easiest way), or you can define the network devices manually (harder way).
3
1.1
Auto-Discovery of Network Devices
1.
2.
3.
4.
Make sure that the iSNMP computer is connected to the Ethernet network that you want to
Auto-Discover network devices on!
Press the Auto-Discover button on the taskbar or select Auto-Discover from the Operations
menu. Note: The Auto-Discover button is the green eye on the iSNMP menu bar.
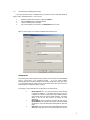
The Search Network dialog box should appear. In order to search the network, you will need
to tell IndustrialSNMP the range of IP addresses to search. Enter the starting and ending IP
address range of the Ethernet devices in your network and press the Begin button. Note: If
you haven’t defined an IP range, IndustrialSNMP won’t allow you to search the network.
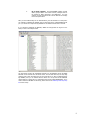
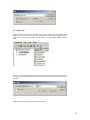
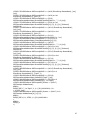
After iSNMP has searched the network, a list of both SNMP manageable and unmanaged
devices will be shown in the New Devices dialog box, as shown below. Note: If you have
already defined or auto-discovered a device before, it will not appear in the New Devices
dialog box, but instead will appear in the lower Current Devices dialog box.
Using the Auto-Discovery feature of IndustrialSNMP assumes that you have already configured the IP
address(es) of your network devices. Most manufacturers ship their devices without an IP address preassigned. For help on how to configure your network devices, please consult the network management
manual for the device, or contact your supplier for the hardware. Additionally, while most Windows
2000 and XP Professional operating systems have SNMP Services enabled by default, monitoring SNMP
data from Windows NT workstations often requires that the SNMP services be installed. Detailed
instructions are available from the Microsoft help files.
If you wish to add any of the devices that the auto-discovery tool has found into the IndustrialSNMP
editor, then double-click on the device’s IP address in the New Devices dialog box. If the device is
unmanaged, follow this link to the un-managed device Help file section. If the device is SNMP
manageable, then turn to the Managed Device Setup Help section.
4
1.11
Auto Discovering Unmanaged Device Setup
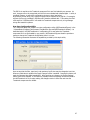
If you have auto-discovered an unmanaged device, by default the Device name that iSNMP will
assign it will be (Unmanaged Device) - xxx.xxx.xxx.xxx.
1.
2.
3.
4.
Replace the default device name with a brief logical Name.
Leave the Device field as (Unmanaged Device).
Leave the IP address field unchanged!
Type a brief description of the device in the Description field if you wish.
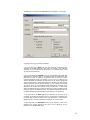
Below is a screen capture of an example completed Device Wizard screen:
ADVANCED TAB
The advanced tab includes advanced settings primarily concerned with how IndustrialSNMP
reacts if a field device is not responding promptly.
If you are having problems
communicating with a field device adjusting some of these settings may resolve your issues.
It is recommended that the settings are left at the default values unless you are asked to
make changes by an iSNMP tech support engineer!
The following is a list of definitions for the selections on the Advanced Tab:
1.
2.
3.
Device Timeout (ms): This value is the amount of time allowed
to complete an SNMP get. In situations where there may be a lot
of traffic on the network, a longer timeout before iSNMP assumes a
communication failure has occurred might be helpful. The default
setting of 500 ms has been found to be suitable for most
applications.
Device Retries: After an attempt to get data has timed out, the
Device Retries value represents the number of times that iSNMP
will attempt to retrieve the data before deciding that the device has
failed.
Skip Count: This is the amount of time that iSNMP will wait before
attempting another GET from a device that has failed. The time unit
5
is defined in the Device timeout setting. Example ( 800 ms device
timeout with 30 skip count =2400ms before new attempt)
6
1.12 Auto-Discovered SNMP-Managed Device Setup
In addition to the “Heartbeat” data that iSNMP makes available for all network devices,
SNMP-manageable devices have a wealth of additional detailed network data that can be
accessed. This section will help you configure your SNMP manageable devices:
DEVICE TAB
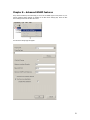
If IndustrialSNMP recognizes the managed device from our pre-defined list of supported
network devices, much of the information required will be filled in, as illustrated below.
If not, follow the steps below to complete the device configuration:
1.
By default, IndustrialSNMP creates a default device name by merging the type of
network device that it discovered with the device’s IP address. Since the device
name often is used as part of an OPC address string in your HMI, it is a good idea
to now change the Device Name to a shorter unique string.
2.
The second field in the Device Wizard is a drop-down Device menu, which allows you
to select from a list of predefined SNMP-manageable devices. If the network device that
you are configuring is one of the devices that IndustrialSNMP has in its predefined
device list, this field should already be auto-populated with the type of network device
that iSNMP detected. If the network device that you are setting up is not part of the
predefined list, you have three choices:
a.
b.
You can leave the Device field blank, in which case you will have to create each
SNMP data tag individually (the most difficult route.)
You can scroll down the list and select from the list of Generic x-port MIBII devices
(x being the number of Ethernet ports that the device has.) For example: let’s
assume that IndustrialSNMP has discovered a network switch, but it is not one of
the predefined devices in the iSNMP database. If the field device happens to be a
24 port Ethernet switch, you can select the Generic 24port MIBII device from the
drop-down device menu. Most Ethernet devices support MIBII, which is an
industry-standard list of SNMP “tags”. Using the generic MIB template, you should
7
c.
be able to have iSNMP create a large number of useful tags for the device without
having to create each data point individually. You can add unique system device
tags to the predefined MIBII tags later. (See the SNMP Tag Setup section of Help
explaining how to do this.)
If you purchased iSNMP Expert Edition, you can use the MIB Template Generator
to automatically create a unique template for the device you are configuring.
Please read the Using MIB template Generator Help file.
3.
The third field that should be auto-populated is the IP Address for the device. Since
you have auto-discovered the device, you should not change this address (unless you
like to create trouble for yourself!) This address follows standard IP addressing format
(for example: 192.168.0.30).
4.
The fourth field is the Community field. The “community” is actually the control access
level that you will be using when communicating to the network device. In an SNMPmanageable device, you can limit the access that an SNMP manager application(such as
iSNMP) can have, based on the manager software’s password level. There are generally
two default “password” (community) levels; Read and Read/Write. In most SNMP
devices, the default community for Read-only privileges is called “Public,” and the
default community for Read/Write privileges is “Private.” Some SNMP-manageable
devices can be configured to have custom levels of access. Please make sure that the
community level you choose is in accordance with the access privileges that you need.
If you want only to limit access on a few SNMP tags, you can select the highest access
level for the device, and then limit the access level for specific SNMP tags within
IndustrialSNMP Editor.( See the Tag Configuration help for more details on how to limit
access on a tag-by-tag basis.)
5.The fifth field is the Description field. It is not necessary to have a description, but in
larger networks, it may help to sort out which device you are looking at in the
IndustrialSNMP Editor.
6.
The sixth field is the Network Analyst selection. Network Analyst is only available
with iSNMP Expert Edition. When the Network analyst box is selected, iSNMP will create
extra OPC tags that represent calculations such as bandwidth utilization and device
status. These Network analyst tags are available only when monitoring a network
switch. (There is detailed information about the configuration of these points in the
Network Analyst Tag Set-up.)
ADVANCED TAB
The Device Wizard advanced tab includes advanced settings primarily concerned with how
iSNMP reacts if a field device does not respond. If you are having problems communicating
with a field device adjusting some of these settings might resolve your issues. It is
recommended that the settings are left at the default values unless you are asked to make
changes by a iSNMP tech support engineer!
The following is a list of definitions for the selections on the Advanced Tab:
1.
2.
3.
Device Timeout (ms): This value is the amount of time allowed
to complete an SNMP get. In situations where there might be a lot
of traffic on the network, a longer time before a communication
failure might be helpful. The default setting of 800 ms has been
found to be suitable for most applications.
Device retries: After an attempt to get data has timed out, the
device retries value is the amount of times the SNMP manager will
attempt to retrieve the data before failing.
Skip Count: This is the time that the manager will wait before
attempting another GET from a device that has failed. The time unit
is defined in the Device timeout setting. Example ( 800 ms device
timeout with 30 skip count =2400ms before new attempt)
8
4.
No. of Items/ Message: The IndustrialSNMP software requests
data in groups of OID’s. The number of items / messages refers to
the numbers of OID’s requested in one SNMP GET. For most
networks, 25 items has been found to be the ideal size of message
for the best performance.
After you have finished filling out the field definitions, press the OK button. At this point if
you selected a predefined tag database from the drop-down menu, IndustrialSNMP will ask
you if you want to auto-import the tag database for the defined network device. Press OK.
If you selected a predefined tag database, iSNMP will auto-populate the tag list for the
device, as seen in the example below:
The Auto-import function will automatically populate your tag database with all the SNMP
data that can be accessed from the device. Note: In some cases there may be many tags
imported, and in other cases there may be only a few tags. If you have a predefined device
tag database, then you are finished with this device! You can proceed to add additional
network devices or simply save your configuration and exit the IndustrialSNMP Editor. If you
need to define the MIB data for the device, please reference the SNMP Tag Data Setup Help
file section of Help.
9
Chapter 2 - Manual Network Device Configuration
If you are trying to define a device that has not yet been installed on the network or if you want to
create a device without using Auto-Discovery, you will need to use the following procedure:
First place the mouse over the Network Devices tab in iSNMP Editor, and right-click the mouse. Select
the New Device selection. You will be given the choice to either select a managed or unmanaged
device. If you are setting up a SNMP-manageable device, skip below to the Help section for the Manual
device setup - Managed.
2.1
Manual Network Device Setup- Unmanaged
1. In the Device Wizard name field, type a brief logical alias for the device.
2. In the Device Field, use the drop-down menu to select (Unmanaged Device).
3. Type the IP address of the unmanaged device into the IP Address field.
4. Type a brief description of the device in the Description field if you wish.
Below is a screen capture of a completed Device Wizard screen:
10
Unmanaged device Advanced tab
The advanced tab includes advanced settings primarily concerned with how IndustrialSNMP
reacts if a field device does not respond. If you are having problems communicating with a
field device adjusting some of these settings might help resolve your issues. It is
recommended that the settings are left at the default values unless you are asked to make
changes by a iSNMP tech support engineer!
For advanced users the following is a list of definitions for the selections on the Advanced
Tab:
Device Timeout (ms): This value is the amount of time allowed to complete an SNMP get.
In situations where there might be a lot of traffic on the network, a longer time out setting
might be helpful. The default setting of 500 ms has been found to be suitable for most
applications.
Device Retries: After an attempt to get data has timed out, the device retries value is the
amount of times the SNMP manager will attempt to retrieve the data before failing.
Skip Count: This is the time that the manager will wait before attempting another GET from
a device that has failed. The time unit is defined in the Device timeout setting. Example (800
ms device timeout with 30 skip count =2400ms before new attempt)
11
2.2 - Manual Network Device Setup- Managed
1.
In the Device Wizard Name field, type a brief logical alias for the device.
2.
The second field is a drop-down Device menu, which allows you to view and select from a
list of predefined SNMP-manageable devices. If the network device that you are configuring
is one of the predefined devices that IndustrialSNMP supports, then select it from the list and
proceed to the IP Address field. If the network device that you are setting up is not part of
the predefined list, then you have three choices:
a.
b.
c.
You can simply leave the Device field blank, in which case you will have to create each
SNMP data tag individually (the most difficult route.)
You can scroll down the list and select from the list of Generic x-port MIBII devices (x
being the number of Ethernet ports that the device has.) For example: let’s assume that
IndustrialSNMP has discovered a network switch, but it is not one of the predefined
devices in the IndustrialSNMP database. If the field device happens to be a 24 port
Ethernet switch, you can select the Generic 24port MIBII device from the drop-down
Device menu. Most Ethernet devices support MIBII, which is an industry-standard list of
SNMP “tags”. Using the generic MIB template, you should be able to have iSNMP create
a large number of useful tags for the device without having to create each data point
individually. You can add unique system device tags to the predefined MIBII tags later.
(See the SNMP Tag Setup section of Help explaining how to do this.)
If you have iSNMP Expert Edition you can use the MIB Template Generator to create a
unique template for the actual device you are configuring. Read the How to use
3.
Type the new device’s address in the IP Address field.
4.
Select the appropriate SNMP access level in is the Community field. The SNMP community
is actually the control access level that you will be using when communicating to the network
device. In an SNMP- manageable device, you can limit the access that an SNMP manager
(such as IndustrialSNMP) can have, based on the manager software’s password level. There
are generally two default “password” (community) levels; Read and Read/Write. In most
SNMP devices, the default community for Read-only privileges is called “Public,” and the
default community for Read/Write privileges is “Private.” Some SNMP-manageable devices
can be configured to have custom levels of access. Please make sure that the community
level you choose matches the device configuration for the access privileges you expect. If
you want only to limit access on a few SNMP tags, you can select the highest access level for
the device, and then limit the access level on each SNMP tag within IndustrialSNMP Editor.(
See the Tag Configuration help for more details on how to limit access on a tag-by-tag
basis.)
5.
Type a brief description of the network device in the Description field. It is not necessary to
have a description, but in larger networks, it may help to sort out which device you are
looking at in the IndustrialSNMP Editor.
6.
The sixth field is the Network Analyst selection. When the Network analyst box is selected
iSNMP will create extra OPC tags that create derived calculations such as bandwidth
utilization and device status. These Network analyst tags are available only when monitoring
a network switch. (There is detailed information about the configuration of these points in
the Network Analyst Tag Set-up.)
12
Managed Device Advanced tab
The Advanced tab includes advanced settings primarily concerned with how IndustrialSNMP
reacts if a field device does not respond. If you are having problems communicating with a
field device adjusting some of these settings might help resolve your issues. It is
recommended that the settings are left at the default values unless you are asked to make
changes by a iSNMP Software tech support engineer!
Device Timeout (ms): This value is the amount of time allowed to complete an SNMP get.
In situations where there might be a lot of traffic on the network, a longer time out setting
might be helpful. The default setting of 500 ms has been found to be suitable for most
applications.
Device Retries: After an attempt to get data has timed out, the device retries value is the
amount of times the SNMP manager will attempt to retrieve the data before failing.
Skip Count: This is the time that the manager will wait before attempting another GET from
a device that has failed. The time unit is defined in the Device timeout setting. Example:
(800 ms device timeout with 30 skip count =2400ms before new attempt)
13
Chapter 3 - Tag Configuration
There are two major types of tags that can be created within iSNMP. Polled tags are tags that iSNMP
actively “gets” from network devices on a regular basis. Traps tags are tags that iSNMP is configured to
receive from devices that will not be polled, but instead will broadcast alarm messages whenever alarm
conditions occur.
3.1 Polled tag Configuration
You can define your polled tags manually if you are not auto-discovering your
network devices or if auto-discovery did not find an OID that you need. To
manually define an SNMP OID, first highlight the network device that you want to
add an SNMP tag to in the iSNMP Editor left screen frame. With the correct device
highlighted, move your mouse to the right screen frame, right-click, and select
New Item, as shown below:
14
The dialog box for creating a new SNMP database tag will appear, as seen below:
To configure the tag, you must do the following:
1. Give the data point a Name. The tag name should be a logical and brief
description of the MIB object data being read. (For example, if the MIB data
represents the current link status for Port Number 1 on a network switch, a brief
tag name would be PortLink1.)
2. The second field is the ObjectID for the tag. The ObjectID is the specific data
address for the information that you are requesting from the SNMP agent. Most
MIB addresses follow an Object ID nomenclature that has a series of whole
numbers separated by periods. (For example: .1.3.6.1.2.1.2.2.1.7.1) Note: You can
find the MIB Object ID addresses and descriptions in the network management
manual supplied with your SNMP-manageable device. Be aware that some network
component vendors have two product manuals – one for installing and operating
the network device, the other detailing network management information. If the
ObjectID for the tag does not reference a table, the offset is 0. In those cases
where the ObjectID references a table, the offset is the number of SNMP get calls
needed to access all the data of the table. The information detailing the structure
of a MIB is available from the manufacturer of the device you are monitoring.
3. The third field is the Data Type for the MIB data you are going to be
requesting. By pressing the drop-down arrow on the right side of this dialog box,
you will be able to choose the data type from a pre-defined list. The Data Type for
MIB data can be found in the management manual for your network device.
4. The fourth field is the Description field. It is not necessary to have a tag
description, but in larger networks it may help to sort out which tag you are
looking at in the IndustrialSNMP editor.
15
5. The next choice you must make is the Access selection for the tag. If you click
in this box, you can limit any communication to this tag to allow only reading of
the data. Some MIB data can be set, such as a System Contact field or to reset a
counter in the SNMP agent. Leaving this box un-checked will allow write
commands to be sent to the MIB data point. Note: The SNMP agent residing on the
network device may just support Read-Only for all or some tags, and selecting
write privileges from within IndustrialSNMP does not guarantee that write
commands will be executed. Please consult the network management manual for
your network device to be sure of the functionality supported.
6. The last section allows you to create some additional OPC tags that can help in
network History applications. Selecting the previous value box creates an OPC
tag that holds the previous SNMP get value in an OPC tag. The Delta Time box
creates a tag based on the delta in time between the values of the current and last
SNMP Object ID. The Moving Average section creates an OPC tag for a moving
average of a particular SNMP value. Note: In most applications it will not be
necessary to select any of the History options.
support engineer for assistance with these tags.
Please consult a iSNMP tech
After you have filled out the field definitions, press the OK button. At this point you should
see the tag that you just created appear on the first line on the right frame of the
IndustrialSNMP interface, as seen in the example below:
To add additional tags for this device, right click on the right frame of the iSNMP Editor
interface and follow the preceding procedure again.
Once you have created all the tags that you want for the network device, you can either add
another network device or you can close IndustrialSNMP Editor and begin to view the SNMP
data from your OPC client program. IndustrialSNMP includes a powerful network visualization
tool called IndustrialSNMP Dataviewer. You can use this tool quickly and easily to view the
SNMP and RMON data in your configured system. Please refer to the IndustrialSNMP
Dataviewer Help file to learn how to use this powerful tool.
3.2 - Creating Trap tags within iSNMP
If a network agent has been configured to generate traps, the network agent broadcasts a
string of data to all configured SNMP manager applications whenever specified trap
conditions occur. The trap string includes the unique SNMP object identifier (OID) address of
the trap condition. When iSNMP receives a trap from a field device, it compares the incoming
trap string to the defined Trap tags for that field device. For traps that have been defined
within iSNMP Editor, the incoming OID string is converted from the raw x.x.x.x.x.x format
into the associated OPC tag name for the trap. iSNMP makes the trap name available as part
of the Event string to be displayed within your HMI. If a matching OID address for an
incoming trap cannot be found, iSNMP displays the raw OID in the trap string alongside the
timestamp and trap condition value.
If you do not want to receive a raw OID in the Event string from a trap, and want a Tag
name instead, then you can define the Trap tag manually by:
1. First highlight the network device that you want to add an SNMP trap tag to in the iSNMP
Editor left screen frame. With the correct device highlighted, move your mouse to the right
screen frame, right-click, and select New Item, as shown below:
16
The dialog box for creating a new SNMP database tag will appear, as seen in the example below:
To configure the trap, you must do the following:
17
1. Give the trap a Name. The tag name should be a logical and brief description of the trap
condition. (For example, if the MIB data represents an overheat sensor, a simple name could
be Overheat.)
2. The second field is the ObjectID for the tag. The ObjectID is the specific data address for
the information that you are requesting from the SNMP agent. Trap addresses follow an OID
nomenclature that has a series of whole numbers separated by periods. (For example:
.1.3.6.1.2.1.2.2.1.7.1) Note: You can find the MIB Object ID addresses and descriptions in
the network management manual supplied with your SNMP-manageable device. Be aware
that some network component vendors have two product manuals – one for installing and
operating the network device, the other detailing network management information. If the
ObjectID for the tag does not reference a table, the offset is 0. In those cases where the
OID references a table, the offset is the number of SNMP get calls needed to access all the
data in the table. The information detailing the structure of a MIB is available from the
manufacturer of the device you are monitoring.
3. The third field is the Data Type for the MIB data you are going to be requesting. Select
Trap/Notification.
4. The fourth field is the Description field. It is not necessary to have a trap description, but
in larger networks it may help to sort out which tag you are looking at in the IndustrialSNMP
Editor.
5. The next choice you make is the Access selection for the tag. If you click in this box, you
can limit any communication to this tag to allow only reading of the data. Some MIB data can
be set, such as a System Contact field or to reset a counter in the SNMP agent. Since you
are receiving traps, you cannot write to the device, but you can write to the iSNMP value to
clear the strings. Leaving this box un-checked will allow write commands to be sent to the
MIB data point.
6. The last section allows you to create some additional OPC tags that can help in network
History applications. The History section is not applicable to SNMP Traps.
After you have filled out the field definitions as illustrated in the screenshot below, press the
OK button.
18
1.
To add additional traps for this device, right click on the right frame of the iSNMP Editor
interface and follow the preceding procedure again.
3.3 – Finding tags
If you have an OID that you wish to quickly find in the complete list of tags for that device, you can
use the FIND tag feature. Press the Find Tag button, as shown below:
A Dialog window will pop-up that will allow you to find any tag in the list by typing in the OID name.
For example, if you wish to find the sysUptime tag (A counter that continually increments to display
device uptime), you can type in a portion of the OID name and press the Find Next button. The find
feature will take you to all tags which include the string of characters that you typed.
19
3.4 – Filtering tags
SNMP-manageable network devices often have a large number of OIDs that can be cumbersome to
navigate. If you wish to find a group of OIDs which include a specific string of characters, you can
select the Filter tags feature by pressing the Filter button on the iSNMP Editor interface, as shown
below:
Once you have the Filter dialog box, type the string that you wish to filter by into the text box. For
example, to find all OIDs that include the string “sys”, type the string into the text box and press the
OK button.
iSNMP will return all tags for that device that include the string.
20
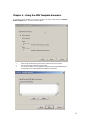
Chapter 4 - Using the MIB Template Generator
To generate a custom template for the device selected in the device wizard press the Generate
Device Template button. The screen below will appear:
1.
2.
3.
Select the appropriate device type and number of Ethernet ports on the device.
Press the next button to advance to the next step.
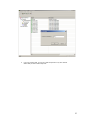
The next screen asks the user to designate the location of the private MIB data file(s) to
be integrated into the custom iSNMP device template, as seen below:
21
Press the ADD… button to browse the file system to locate the private MIBs related to the
network device. If you do not have any private MIB data press the Next button to proceed to the
next step, since IndustrialSNMP has the ability to create a basic template for the network device
despite having no private MIB data. It should be noted that some templates require multiple MIB
documents, and some MIBs are dependent on the inclusion of other MIB documents to be
functional. Make sure that you include all necessary private MIB files! Note: In the process of
generating a template, iSNMP MIB Template Generator will identify missing MIB files. If files are
missing you can continue with the generation process, but the template created may not be
complete. In some applications this might not be a problem. If the template is non-functional
after finishing the process, run the generator again and include the missing MIB files.
4.
5.
6.
Once iSNMP MIB template generator has completed parsing the private MIB files, you
will be prompted to give the newly created template a name. Note: Sometimes iSNMP
MIB template generator will be working for a minute or two parsing the files. Please be
patient!
When the file parsing is completed, you will be prompted to give the newly created
template a name. It is a good idea to choose a template name that describes both the
model number and manufacturer of the device, since many manufacturers have unique
MIBs for their different product lines. The template file that you have created will be
installed in the iSNMP template file with the pre-existing templates provided with
IndustrialSNMP. With the new template now “learned” by iSNMP, it will not be necessary
to run the MIB template generator again for similar devices to be discovered!
After pressing OK, you will return to the Device Wizard. Select the template you have
created and proceed to the next field.
22
Chapter 5 - SNMP Traps and Event Notification
Note: If you plan to configure iSNMP to receive traps, then Windows 'SNMP Trap
Service' on the same PC must be disabled. Running both iSNMP trap reception and
Windows Trap reception will cause traps not to be received.
iSNMP supports both active polling of SNMP Agents and the receipt of unsolicited event messages from
SNMP agents. Unsolicited event messages sent by network agents to network manager applications are
commonly called “traps”. A network agent transmits traps whenever a configured event, such as a link
up/down change occurs. Note: SNMP Agents can be configured to send traps to more than one
network agent, so if you are sharing network hardware with your IT department, traps can be sent to
both iSNMP and the IT network management application simultaneously!
To configure an SNMP Agent and receive SNMP traps from it within iSNMP you should:
1. Configure the SNMP agents on the network manager(s) to send SNMP
traps to the network manager application. The network device should be
powered up, and its management menu accessed. All devices are configured slightly
differently, but the example shot screen below shows an Ethernet switch being
configured via it’s web browser interface to send traps to an iSNMP application running
on a PC with IP address 192.168.1.15.
2.
Verify that the network device is connected onto the same network as
the iSNMP server. Launch iSNMP Editor and run the auto-discovery tool
(if you cannot run the Auto-discovery tool, then skip to the manual trap
configuration screen below.) Assuming that the network device has been correctly
configured with an IP address, it should appear in the Discovered Devices
window. If the device has a pre-defined iSNMP MIB template, iSNMP should
recognize it, and pre-build the tag database, including trap data. If the device is
not supported as a predefined iSNMP device, then you will have to manually define
the traps you wish to receive, which you can verify by following step 3 below.
Note: The manual trap definition procedure is described in Events Advanced
Settings section below.
23
3.
Verify that iSNMP is receiving the trap data from the target device. If you
still have open the iSNMP Editor Application, save and close now. Launch the
iSNMP Dataviewer application from Start > Programs > IndustrialSNMP > Tools >
iSNMP Dataviewer. “Explode” the tree next to the device that you wish to test,
and scroll down until you see the Events group. Note: There are often many tags,
iSNMP Dataviewer lists the tags and groups alphabetically, so scroll down until you
find Events. Select and move the Events Count and Event_xxx tags over to the
active monitoring portion of the screen as shown below:
Initially, you may not have any values in the trap tags to view. Begin to create trap
conditions. For example, if the network device is a switch, and it is configured to
send Link up and Link Down traps, then you can connect and disconnect devices
from the switch to create trap conditions. As trap conditions occur, you should see
the trap counter increment, and the traps string sent by the network agent will be
displayed in the value column of the Events detail tags. As SNMP traps are received
from the network, iSNMP places the most current trap in the Events_001 field, and
moves the previous traps down by one on the range. This way you can have a
“first-in first-out” alarm log history easily displayed in your HMI. Note: The default
number of Event strings is 10. If you wish to increase or decrease the number of
Event strings available, open iSNMP Editor, and right click on the Events tab under
the target device, as shown below:
24
4.
If you are receiving traps, you can now repeat the process for any other network
devices that you wish to receive traps from.
25
Chapter 6 - Network Analyst Tag Set-up
Network Analyst tags are derived tags based on the raw data provided from certain SNMP Object IDs.
To activate this feature the Network Analyst check box must be selected on the Device Wizard box.
Note: Network Analyst functionality is only available on Ethernet Switches. To adjust some of the
variables associated with the Network Analyst tags, open up the tree structure under the switch on the
left side of the screen. Highlight the Network Analyst and the available tags will appear on the right
side of the screen. Double clicking on a specific tag will bring up a properties box. For the individual
port bandwidth utilization (buPctIn.nn), (buPctOut.nn) or port status (buStat.nn) a read-only properties
box will display the current settings of the user definable variables. The switchBUStat tag has a
properties box that allows you to adjust the thresholds for the 3-level status tags as well as the
multipoint average of the inbound bandwidth utilization percentage.
The value for the buPct tags is a moving point average of the raw inbound or outbound bandwidth
utilization calculated by iSNMP. You will notice when you browse the available tags in the OPC Server
that there are more Network Analyst tags available to use in your OPC client application. iSNMP also
makes the raw bandwidth utilization value available. It is not recommended that the raw bandwidth
utilization value be used in an alarming application. The inherent behavior of network traffic on an
Ethernet network involves momentary spikes in bandwidth utilization. Typically, network administrators
should be concerned with high network traffic loads for an extended period of time. A more
appropriate “tag” to monitor for network load alarm purposes would be the rolling average tag. Note:
Within iSNMP the default sampling rate for the average bandwidth utilization tag is 30 seconds.
26
Chapter 7 – User-Defined Tag Set-up
iSNMP User-Defined iSNMP tags are derived OPC tags that require the user to define a new tag by
manipulating the value of existing iSNMP tags.
To add a user-defined tag:
Expand the device detail view of the target device on the left hand window in iSNMP Editor,
highlight the User-Defined icon, move your mouse to the right screen frame, right-click, and
select New Item, and the dialog box for creating a new SNMP database derived tag will
appear, as seen below:
iSNMP uses Microsoft JScript as the syntax for derived tags that offers tremendous flexibility
for creating derived tag equations. iSNMP has added an extension to Jscript in order to use
the current values of certain OPC tags in the Jscript equations. To use the iSNMP Jscript
extension:
The Val ( ) function takes the name of an iSNMP OPC tag and returns
the value of that tag into the equation variable.
Example: x = val(ifOutUcastPkts.01);
If the input to the Val ( ) variable is a valid OPC tag name, Val ( )
returns the current value of that OPC tag into the equation.
27
If the equation that is created in the derived tag includes tags from
multiple devices the full OPC tag name (<device>.< tag name>) will
bring in the current values from multiple devices.
For information on the syntax for Jscript please visit the Microsoft website and search for
Jscript. Below is the most current link to the section of the Microsoft website with
instructions on Jscript.
http://msdn.microsoft.com/library/default.asp?url=/library/en-us/script56/html/js56jsoriJScript.asp
28
Chapter 8 – Advanced iSNMP Features
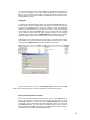
Every network is different, and occasionally you must tune the iSNMP engine to best perform on your
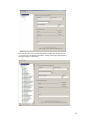
network. Advanced polling features are detailed on the OPC Server Settings page. Select the OPC
Server Settings button from the EDIT menu item:
The OPC Server settings page will appear:
29
Do not change the default settings on the OPC Server Settings page
unless you are experiencing problems with polling devices on your
network. A brief description of OPC server settings:
Trace Level: In cases where you wish to maintain a log file of server operations, you can select
the level of Server Operating Tracing. The different levels of Server Operating Tracing in the
drop-down are:
•
None – (Default) No trace messages are output.
•
•
Connect - Log trace messages associated with client connectivity and
server activation.
•
Group - Log trace messages associated with creating / deleting / modifying OPC groups.
•
Item - Log trace messages associated with item transactions. For example: read, write,
and subscription transactions.
•
All - Log all message types.
Trace File Path: Select the destination where the server operation log file is stored.
COM Call tracing: Turns COM call tracing on and off. Default is OFF. Go to Appendix A for more
details.
Base UDP port: This is the first port that the server uses for multithreaded polling. The server
will use this port and the next 100 ports above it (if needed) to execute the multi-threaded poling
of network devices.
Run Server as Windows Service: By selecting this option, iSNMP will run as a Windows
service, which can be configured to start automatically when Windows starts.
All: Log all message types.
Run Server as application: By selecting this option, iSNMP will run whenever
an OPC client requests data, and will shutdown within seconds of no demand. This
is the default setting.
Disable Auto shutdown: By selecting this checkbox, if iSNMP is running as an
application, the OPC server will not shutdown once started, even if no OPC clients
are requesting data.
Enable initial polling: By selecting this checkbox the iSNMP OPC server will not
display a value to an OPC client application until a verified value has been
returned. This can increase server startup time greatly. Default setting is OFF
Note: COM Call tracing is distinct from server operation tracing. COM Call tracing is
lower-level than server operation tracing and sends its output to a different log
file. See Appendix A for Comm. call tracing functionality.
30
Chapter 9 - IndustrialSNMP Communicator
During system troubleshooting, you may wish to communicate to your SNMP-manageable
network devices without having to start the IndustrialSNMP OPC Server. One advantage to
the Communicator is that you do not have to configure your SNMP database using the
IndustrialSNMP Editor. This allows you to verify any SNMP data directly from the PC Network
Interface Card. If you have an existing IndustrialSNMP Editor configuration set up, then you
will be able to browse the tag database you have already set up.
When you first start IndustrialSNMP Communicator, you should notice that the
IndustrialSNMP OPC Server screen does not open. This is normal. IndustrialSNMP
Communicator is a stand-alone SNMP communication product, and it accesses the PC’s
Network Interface Card directly.
There are two ways to use Communicator. One is to browse a network that has already been
configured using IndustrialSNMP Editor. The other is to manually fill in the required SNMP
MIB data fields. We will cover browsing an existing configuration first. To use IndustrialSNMP
Communicator without browsing, please jump ahead to Spot Checking SNMP Data
Browsing an Existing IndustrialSNMP Database
The Communicator screen is split into two major parts. The left screen is the device browser
area. This area will show a list of the available network devices and the tags that you have
configured in IndustrialSNMP Editor. The right part of the screen is where you can view realtime data from any of the configured tags or from any tag for which you have the correct
MIB address data.
To begin, you can browse the SNMP “tree” in the left screen. Start by left-clicking the mouse
over the + sign to the left of the IndustrialSNMP Suite “tree” icon on the OPC Data Tree
screen, as shown below: Note: If there is no + or – sign to the left of the “tree,” then you
probably have not configured any devices from within IndustrialSNMP Editor. Please exit
IndustrialSNMP Communicator and configure the devices in your network first, or skip ahead
to the Spot Checking SNMP Data section of this Help manual.
31
In the network shown, a device called SwitchA has been configured. By left clicking on the
“+” sign to the left of the SwitchA network device, a listing of all the tags configured for that
device should appear, as shown below:
32
Now that all the tags that have been configured are displayed, it is possible to add individual
tags into the Communicator real-time view area. To begin viewing any tag, first simply
highlight it by left clicking on the individual tag in the IndustrialSNMP Suite window. The
MIB data for that “tag” will be automatically entered into the data fields on the right-hand
side of the screen. In the screen below, a tag has been highlighted, and the MIB data
automatically filled in. Note: IndustrialSNMP Communicator allows access to one tag at a
time. IndustrialSNMP Communicator is meant as a troubleshooting tool primarily. If you
need to view multiple “tags” concurrently, use the IndustrialSNMP Dataviewer utility.
You will note that there are six items of information displayed about each tag within the
IndustrialSNMP Communicator display windows:
1. The first Window is the IP address of the SNMP agent that is being polled. Note: It is
necessary to have configured an SNMP address in the manageable network device to
communicate to it. If you are unsure whether this has been done, please refer to the
management manual for your network device.
2. The second text box is the Community field. The Community field is essentially a
password field. The community setting in this field must match the community that is set in
the SNMP-manageable switch. Note: Many device manufacturers will have a default
community setting of Private for full access privileges to their network device. Often there is
also a default Public community, which will allow read-only privileges from the SNMP agent.
Many network devices will allow you to create a number of communities, all of which have
varying levels of access to that device’s MIB data. If an IT group maintains the network
device that you are communicating to you should coordinate with them to determine the
correct community to use.
3. The third field is the SNMP Object Identifier for the tag. The SNMP Object Identifier
is the specific data address for the information you are requesting from the SNMP agent
embedded in your manageable network device. Most MIB addresses follow an Object ID
nomenclature that has a series of whole numbers separated by periods (for example:
.1.3.6.1.2.1.2.2.1.7.1.) Note: You can find the MIB Object ID addresses and descriptions in
33
the network management manual supplied with your SNMP-manageable device. Be aware
that some network component vendors have two product manuals–one for installing and
operating the network device, the other detailing network management information.
4. The fourth field is the Data Type for the MIB data you are going to be requesting. MIB
data is stored in a number of formats. Some data is stored in various types of integers,
others in strings, and so on. By pressing the drop-down arrow on the right side of this dialog
box, you will be able to choose the data type from a pre-defined list. Note: The Data Type
for your specific MIB data can be found in the management manual or in the MIB definition
file for your network device.
5. The fifth field of data is the Current Value of the tag. This column displays the data in
real-time as often as it is updated by the SNMP driver. Note: IndustrialSNMP Communicator
only retrieves data from the manageable network device when you press the trigger button.
It is normal to see a line of question marks until the Trigger button is pressed.
6. The sixth field is the Description field. This field will be populated with the text that was
set in the Description field of IndustrialSNMP Editor. If there is no text, IndustrialSNMP
Communicator will still work!
Reading SNMP Data
To initiate a poll of the SNMP MIB data click on the GET button to poll the SNMP agent in the
selected device. The GET NEXT button will increment through the MIB and retrieve the data.
The Current Value text box will now reflect the state of the requested SNMP MIB Object
Identifier. The read function is only triggered once at the moment that the GET or GET NEXT
button is pressed. To update the data, you must press the GET or GET NEXT button again.
Writing SNMP Data
To initiate a write to the SNMP MIB database, use the SET button on the bottom of the
screen. You can change the value of an Object ID only if it is permitted by the configuration
of the SNMP agent in the device you are interrogating. You also have to configure the tag
for write ability in the IndustrialSNMP Editor. You can view the status of the tag in the
IndustrialSNMP Information section of the Communicator. Note: When attempting to SET a
value in the SNMP MIB, you must be at the proper community ( Read/Write or Write only)
setting for the ability to set a value. This community setting is configured when setting up
the device.
Spot-Checking SNMP Data
You do not have to have set up a device in IndustrialSNMP Editor to be able to communicate
to any SNMP- manageable device using IndustrialSNMP Communicator. To spot-check SNMP
MIB data on a network, you will need four pieces of information from the SNMP agent about
the MIB data item that you want to read:
1. The IP address of the SNMP agent that is being polled. Enter this data in the SNMP Agent
field on the right side of the Communicator interface. There are four boxes, one for each of
the four sections of the SNMP agent IP address. Note: It is necessary to have configured an
SNMP address in the manageable network device to communicate to it. If you are unsure
whether this has been done, please refer to the network manual for the device and configure
it before attempting to use IndustrialSNMP Communicator.
2. The Community for which that the managed network device is configured. The
Community is essentially a password field. The community setting in this field must match
the community that is set in the SNMP manageable switch. Note: Many device manufacturers
will have a default community setting of Private for full access privileges to their network
device. Often there is also a default Public community, which will allow read-only privileges
from the SNMP agent. Many network devices will allow you to create a number of
communities, all of which have varying levels of access to the device’s MIB data. If the
network device that you are communicating to is maintained by an IT group, you should
coordinate with them to determine the correct community to use.
34
3. The SNMP Object Identifier for the tag. The SNMP Object Identifier is the specific
data address for the information you are requesting from the SNMP agent embedded in your
manageable network device. Most MIB addresses follow an Object ID nomenclature that has
a series of whole numbers separated by periods (for example: .1.3.6.1.2.1.2.2.1.7.1.) Note:
You can find the MIB Object ID addresses and descriptions in the network management
manual supplied with your SNMP-manageable device. Be aware that some network
component vendors have two product manuals–one for installing and operating the network
device, the other detailing network management information.
4. The Data Type for the MIB data you are going to be requesting. MIB data is stored in a
number of formats. Some data is stored in various types of integers, others in strings, and so
on. By pressing the drop-down arrow on the right side of this dialog box, you will be able to
choose the data type from a pre-defined list. Note: The Data Type for your specific MIB data
can be found in the management manual or in the MIB definition file for your network
device.
35
Chapter 10 - IndustrialSNMP DataViewer
IndustrialSNMP DataViewer is an OPC client application designed to assist iSNMP users in
verifying that the iSNMP OPC Server is collecting and sharing data properly. iSNMP
DataViewer can be a useful tool in troubleshooting potential problems with OPC
communication. When you first start IndustrialSNMP DataViewer, you should notice that the
IndustrialSNMP OPC Server screen will flash open and then will minimize to run as a service
on your computer. Note: Before using IndustrialSNMP DataViewer, you must configure your
SNMP database using the IndustrialSNMP Editor. Please refer to IndustrialSNMP Editor in the
Help menu for instructions.
Reading Data
The DataViewer screen is split into two “windows”. The left screen is the device browser
area. This area will show a list of the available network devices and the tags that you have
configured in IndustrialSNMP Editor. The right part of the screen is where you can view realtime data from any of the configured tags. To begin, you must browse the SNMP “tree” in
the left screen. Begin by left-clicking the mouse over the + sign to the left of the
IndustrialSNMP Suite “tree” icon on the OPC Data Tree screen, as shown below. Note: If
there is no + or – sign to the left of the “tree”, then you probably have not configured any
devices from within IndustrialSNMP Editor. Please exit IndustrialSNMP DataViewer, and
launch IndustrialSNMP Editor to configure the devices in your network first!
In the network shown, two devices have been configured. We will work with the device
called SwitchA. By left clicking on the “+” sign to the left of the SwitchA network device a
listing of all the tags configured for that device should appear. It is now possible to add
individual tags into the DataViewer real-time view area. To view any tag, first left-click on the
individual tag in the OPC Data Tree window, then press the -> in the taskbar. In the screen
36
below, six data tags that have been moved into the real-time data window: (Double clicking
on the tag will also move the tag into the real time viewing area)Note: To “clean up” the OPC
Data tree window, you can press the “-“button to the left of any device’s icon. This will hide
the list of tags from this device, and help to navigate to other network devices more easily.
You will note that there are four items of information displayed about each tag within the
Real-time display window:
1. First is the Tag name of the data. Note: The tag name from within the real-time
window is displayed in OPC naming format. In this case, it shows the OPC name as
<Device>.<Tag name>.
2.The second column is the Read/Write column. This column displays whether the
tag is configured for read-only, or read/write privileges. If the device has
read/write privileges, then you can actually set the tag value from within
IndustrialSNMP DataViewer. See the Writing Data section of Help below for
details.
3.The third column of data is the current value of the tag. This column displays the
data in real-time, as often as it is updated by the SNMP driver. Note: If you are
only getting “0”s or “*******” values, you probably have a problem
communicating to your SNMP manageable network devices. Verify that you are
attached to the network and then verify that the network device you have
configured is powered.
4.The fourth column shows the timestamp for the last update time for data being
retrieved from the SNMP manageable device. To increase or decrease the
frequency of the data update, go to the Advanced Setting section below.
Now that you have begun to gather real-time data, you can easily change the data points
that you are monitoring. To add a tag from another device, simply open the tag listing for
that device by left-clicking o n the “+” sigh to the left of the device name, as you did for the
first device, highlight the tag that you want to monitor, and press the -> button on the
taskbar above the DataViewer windows.
37
To remove a tag from the real-time window, highlight it by left-clicking on it and then press
the <- button on the taskbar. . If you want to remove multiple tags, you can hold down the
Ctrl key on your keyboard, and then select each desired tag with the left mouse button.
When you press the <- button on the taskbar, all highlighted tags will be moved out of the
real-time DataViewer window.
Writing Data
To write data to a manageable network device from within IndustrialSNMP DataViewer, you
should check that the point is read/write able in the first place. You can do this by looking at
the R/W column in DataViewer. If the column has a R/W by the tag, then the tag was
configured in IndustrialSNMP Editor to be able to be written to. Note: The SNMP agent
residing on the network device may only support read-only for all or some tags, and selecting
write privileges from within IndustrialSNMP Editor does not guarantee that write commands
will be executed. Another factor that affects read/write privileges is the community
“password” that you defined during the Network Device setup. Please consult the network
management manual for your network device to be sure of the functionality supported).
Assuming that you have configured the tag to be write-able, you can write a value by simply
double clicking on the tag from within the real-time Dataviewer window. When you double
click on the point, a Write Value pop-up window will appear, as seen below:
Type the new value that you want in the New Item Value text box, and click the OK
button. Once you have done this, the new value should appear on the next scan of that tag.
Saving and retrieving Data view windows
After you have selected the tags that you want to monitor, you may want to Save the list, so
that you do not have to re-browse and select the tags every time that you restart
IndustrialSNMP DataViewer. To save your list, press the Save Data view button (looks like
a floppy disk), which is located above the real-time DataViewer window. You will see the
pop-up Save As window. Type a file name for the DataView that you want to be able to
recall and then click the Save button. At this point the DataView that you have created will
be available any time you restart IndustrialSNMP DataViewer.
38
To recall a Data view after restarting IndustrialSNMP DataViewer, press the Open Button,
which is located above the real-time DataViewer window (or select Open from the File
menu). You will see the pop-up Open window below. Select the Data view you want from
the list and press the Open button. Your pre-selected tag database will automatically be
loaded.
iSNMP System Tags
iSNMP creates a few “virtual” tags for each SNMP manageable device defined. These tags are
not part of the devices MIB table, they are created by iSNMP. A brief description of each
follows:
$iSNMPMinimumPollTime: This tag reflects the 'Minimum SNMP Scan Rate (ms)' setting in the iSNMP OPC
Server Settings dialog in SNMP Editor.
$iSNMPDeviceTimeout
$iSNMPDeviceRetries
$iSNMPDeviceSkipCount
$iSNMPDeviceNoItems
These tags reflect the device settings on the 'Advanced' tab
of the Device Wizard dialog.
$iSNMPDeviceStatus : This virtual tag is based on the sysObjectID OID (.1.3.6.1.2.1.1.2.0), which every
SNMP-manageable device supports. At each polling cycle, $iSNMPDeviceStatus attempts to get the value of the
sysObjectID OID. If $iSNMPDeviceStatus does a successful SNMP 'Get' of sysObjectID from the agent, its value
is '1'. If $iSNMPDeviceStatus is unable to do a successful SNMP 'Get', its value is '0'.
Advanced Settings
IndustrialSNMP DataViewer allows you to make changes to the base IndustrialSNMP poll rate,
as well as the rate of update that IndustrialSNMP DataViewer OPC update rate. The
difference between these two poll rates is as follows:
The Base SNMP Poll rate is the frequency with which the IndustrialSNMP driver will make
requests of the network device for data. For example, a base SNMP poll rate of 1000ms will
ensure that the IndustrialSNMP driver will attempt to poll the network devices that have been
configured no more often than once every 1000milliseconds.
The Sync Poll rate is the rate at which IndustrialSNMP DataViewer requests information from
the SNMP polling engine. There are two selections within the Sync poll rate, the default is
the Cache setting. In most circumstances, the Cache is the preferred polling method. This
allows the IndustrialSNMP DataViewer to display a cached value if the SNMP polling engine
does not have a refreshed value from the manageable network device. Selecting the device
polling selection will make DataViewer wait for a refreshed SNMP data value. This can
sometimes slow the performance of the application.
Do not change the base SNMP poll rate below 1000ms, unless you have discussed your
application with iSNMP tech support.
39
Chapter 11 - IndustrialSNMP OPC Server Interface
The IndustrialSNMP OPC driver will be started by any OPC client that requests data from it. If
there is not an OPC client requesting information, the IndustrialSNMP OPC Server will be
inactive. You can verify that the IndustrialSNMP OPC Server is running by looking for a small
SNMP icon in the lower right hand taskbar of your O/S. This icon shows that the OPC driver is
running. If you minimize the OPC client software application (And any other software
windows you may have opened), you will see the IndustrialSNMP OPC Engine interface as
seen below:
This interface has a few important tools, as well as an event log, which can assist you in
troubleshooting your application. In the window, you will be told how many OPC clients are currently
connected to the IndustrialSNMP OPC Server. Note: Multiple OPC clients can connect to the
IndustrialSNMP OPC Server, so it is possible to have both IndustrialSNMP DataViewer and an HMI
package communicating simultaneously to the SNMP-manageable device.
If any polling errors are occurring, they will be listed in the event log screen, with a Date and Time
stamp for the event. You can easily view a history of errors (The log can hold up to 100,000 entries,
and will then begin to write over the oldest entry.)
If you wish, you can save the event log at any time by pressing the Save button on the left side of the
interface. This will save the log file as a text file. This can be helpful to our tech support staff, in the
event you are having communication problems.
You can also print the event log out to a printer. Press the Print button on the left side of the interface,
and follow up the instructions to print to one of your pre-configured printers.
If the OPC server has been configured to run as a service or not to shutdown automatically, you can
shutdown the server by pressing the Close button.
40
Appendix A - COM Call Tracing Using TraceHook Components
COM Call tracing is distinct from server operating tracing. COM Call tracing is lower-level than
server operation tracing and sends its output to a different log file.
Introduction
TraceHook components provide a means to record COM method calls to a circular file, at varying
levels of detail. The technology is implemented ‘out of band’ from, or orthogonal to, the actual
method call. This means that there is absolutely no tracing code inside the COM method call
implementation. Tracing is provided by means of pre and post call hooks that utilize type library
data to interpret the stack when generating input and output parameter dumps.
When the TraceHook components are configured to record the greatest level of detail, the trace
file will contain particulars of each COM method call just prior to and just after its execution,
including full input and output parameter dumps. The following is an excerpt of an actual trace
log file generated while the OPC Browser browsed the namespace of the simulation server that is
provided with the Toolkit. This example illustrates the highest level of detail available.
2001-07-31 12:58:51.093 LOG FILE OPENED!
12:58:51.213 NDISimServer:OPCServer@bf1450 >> (207-1)
IOPCServer::AddGroup("NDI_Browser", 0, 0, 0, [Ptr] NULL, 0, 2048, [out], [out],
REC<968964692,
286, 4560, >, [out])
12:58:51.233 NDISimServer:OPCServer@bf1450 << (207-1) hr=0x4000d
IOPCServer::AddGroup([in], [in], [in], [in], [in], [in], [in], 12529312, 10, [in], [IUnknown]
0x00148E38)
12:58:51.283 NDISimServer:OPCServer@bf1450 >> (311-2)
IOPCBrowseServerAddressSpace::QueryOrganization([out])
12:58:51.283 NDISimServer:OPCServer@bf1450 << (311-2) hr=0
IOPCBrowseServerAddressSpace::QueryOrganization(ENUM<1>)
12:58:51.283 NDISimServer:OPCServer@bf1450 >> (207-3)
IOPCBrowseServerAddressSpace::BrowseOPCItemIDs(ENUM<1>, "", 0, 0, [out])
12:58:51.303 NDISimServer:OPCServer@bf1450 << (207-3) hr=0
IOPCBrowseServerAddressSpace::BrowseOPCItemIDs([in], [in], [in], [in], [IUnknown]
0x015F0180)
12:58:51.303 NDISimServer:OPCServer@bf1450 >> (311-4) IEnumString::RemoteNext(1, [out],
[out])
12:58:51.303 NDISimServer:OPCServer@bf1450 << (311-4) hr=0
IEnumString::RemoteNext([in], "src", 1)
12:58:51.303 NDISimServer:OPCServer@bf1450 >> (333-5)
IOPCBrowseServerAddressSpace::GetItemID("src", [out])
12:58:51.303 NDISimServer:OPCServer@bf1450 << (333-5) hr=0
IOPCBrowseServerAddressSpace::GetItemID([in], "src")
12:58:51.303 NDISimServer:OPCServer@bf1450 >> (207-6) IEnumString::RemoteNext(1, [out],
[out])
12:58:51.303 NDISimServer:OPCServer@bf1450 << (207-6) hr=0
IEnumString::RemoteNext([in], "trg", 1)
12:58:51.303 NDISimServer:OPCServer@bf1450 >> (311-7)
IOPCBrowseServerAddressSpace::GetItemID("trg", [out])
12:58:51.303 NDISimServer:OPCServer@bf1450 << (311-7) hr=0
IOPCBrowseServerAddressSpace::GetItemID([in], "trg")
41
12:58:51.353 NDISimServer:OPCServer@bf1450 >> (146-8) IEnumString::RemoteNext(1, [out],
[out])
12:58:51.353 NDISimServer:OPCServer@bf1450 << (146-8) hr=0x1
IEnumString::RemoteNext([in], [NULL], 0)
12:58:51.353 NDISimServer:OPCServer@bf1450 >> (333-9)
IOPCBrowseServerAddressSpace::BrowseOPCItemIDs(ENUM<2>, "", 0, 0, [out])
12:58:51.373 NDISimServer:OPCServer@bf1450 << (333-9) hr=0x1
IOPCBrowseServerAddressSpace::BrowseOPCItemIDs([in], [in], [in], [in], [IUnknown]
0x015F0180)
12:58:51.373 NDISimServer:OPCServer@bf1450 >> (146-10) IEnumString::RemoteNext(1,
[out], [out])
12:58:51.373 NDISimServer:OPCServer@bf1450 << (146-10) hr=0x1
IEnumString::RemoteNext([in], [NULL], 0)
12:58:53.005 NDISimServer:OPCServer@bf1450 >> (311-11)
IOPCBrowseServerAddressSpace::ChangeBrowsePosition(ENUM<3>, "src")
12:58:53.005 NDISimServer:OPCServer@bf1450 << (311-11) hr=0
IOPCBrowseServerAddressSpace::ChangeBrowsePosition([in], [in])
12:58:53.016 NDISimServer:OPCServer@bf1450 >> (146-12)
IOPCBrowseServerAddressSpace::BrowseOPCItemIDs(ENUM<1>, "", 0, 0, [out])
12:58:53.026 NDISimServer:OPCServer@bf1450 << (146-12) hr=0x1
IOPCBrowseServerAddressSpace::BrowseOPCItemIDs([in], [in], [in], [in], [IUnknown]
0x015F0180)
12:58:53.026 NDISimServer:OPCServer@bf1450 >> (333-13) IEnumString::RemoteNext(1,
[out], [out])
12:58:53.026 NDISimServer:OPCServer@bf1450 << (333-13) hr=0x1
IEnumString::RemoteNext([in], [NULL], 0)
12:58:53.046 NDISimServer:OPCServer@bf1450 >> (207-14)
IOPCBrowseServerAddressSpace::BrowseOPCItemIDs(ENUM<2>, "", 0, 0, [out])
12:58:53.066 NDISimServer:OPCServer@bf1450 << (207-14) hr=0
IOPCBrowseServerAddressSpace::BrowseOPCItemIDs([in], [in], [in], [in], [IUnknown]
0x015F0180)
12:58:53.066 NDISimServer:OPCServer@bf1450 >> (146-15) IEnumString::RemoteNext(1,
[out], [out])
12:58:53.066 NDISimServer:OPCServer@bf1450 << (146-15) hr=0
IEnumString::RemoteNext([in], "Tag01", 1)
12:58:53.066 NDISimServer:OPCServer@bf1450 >> (333-16)
IOPCBrowseServerAddressSpace::GetItemID("Tag01", [out])
12:58:53.066 NDISimServer:OPCServer@bf1450 << (333-16) hr=0
IOPCBrowseServerAddressSpace::GetItemID([in], "src.Tag01")
12:58:53.066 NDISimServer:OPCGroup$NDI_Browser >> (146-17)
IOPCItemMgt::ValidateItems(1,
ARRAY<
ELEM[0] REC<"", "src.Tag01", 0, 0, 0, [Ptr] 0x00000000, 0, 0>
>, 0, [out], [out])
12:58:53.066 NDISimServer:OPCGroup$NDI_Browser << (146-17) hr=0
IOPCItemMgt::ValidateItems([in], [in], [in],
ARRAY<
ELEM[0] REC<0, 11, 47789, 1, 0, [Ptr] 0x00000000>
>,
ARRAY<
ELEM[0] 0
>)
42
12:58:53.066 NDISimServer:OPCServer@bf1450 >> (311-18)
IOPCBrowseServerAddressSpace::BrowseAccessPaths("src.Tag01", [out])
12:58:53.086 NDISimServer:OPCServer@bf1450 << (311-18) hr=0
IOPCBrowseServerAddressSpace::BrowseAccessPaths([in], [IUnknown] 0x015F0180)
12:58:53.086 NDISimServer:OPCServer@bf1450 >> (146-19) IEnumString::RemoteNext(1,
[out], [out])
12:58:53.086 NDISimServer:OPCServer@bf1450 << (146-19) hr=0
IEnumString::RemoteNext([in], "Path1", 1)
12:58:53.086 NDISimServer:OPCServer@bf1450 >> (207-20) IEnumString::RemoteNext(1,
[out], [out])
12:58:53.086 NDISimServer:OPCServer@bf1450 << (207-20) hr=0x1
IEnumString::RemoteNext([in], [NULL], 0)
12:58:53.086 NDISimServer:OPCServer@bf1450 >> (207-21) IEnumString::RemoteNext(1,
[out], [out])
12:58:53.086 NDISimServer:OPCServer@bf1450 << (207-21) hr=0
IEnumString::RemoteNext([in], "Tag02", 1)
12:58:53.086 NDISimServer:OPCServer@bf1450 >> (146-22)
IOPCBrowseServerAddressSpace::GetItemID("Tag02", [out])
12:58:53.086 NDISimServer:OPCServer@bf1450 << (146-22) hr=0
IOPCBrowseServerAddressSpace::GetItemID([in], "src.Tag02")
12:58:53.086 NDISimServer:OPCGroup$NDI_Browser >> (333-23)
IOPCItemMgt::ValidateItems(1,
ARRAY<
ELEM[0] REC<"", "src.Tag02", 0, 0, 0, [Ptr] 0x00000000, 0, 0>
>, 0, [out], [out])
12:58:53.086 NDISimServer:OPCGroup$NDI_Browser << (333-23) hr=0
IOPCItemMgt::ValidateItems([in], [in], [in],
ARRAY<
ELEM[0] REC<0, 11, 47789, 1, 0, [Ptr] 0x00000000>
>,
ARRAY<
ELEM[0] 0
>)
_
12:58:55.619 NDISimServer:OPCServer@bf1450
[out], [out])
12:58:55.619 NDISimServer:OPCServer@bf1450
IEnumString::RemoteNext([in], [NULL], 0)
12:58:57.652 NDISimServer:OPCServer@bf1450
IOPCServer::RemoveGroup(12529312, 1)
12:58:57.702 NDISimServer:OPCServer@bf1450
IOPCServer::RemoveGroup([in], [in])
2001-07-31 12:59:01.007 LOG FILE CLOSED!
>> (146-1215) IEnumString::RemoteNext(1,
<< (146-1215) hr=0x1
>> (333-1216)
<< (333-1216) hr=0
Each trace statement in this example contains the following information:
Timestamp
Process
Object ID
The time at which the trace statement was written. When both pre and
post call tracing is enabled call duration can then be determined.
The process name from which the trace output originates. For the OPC
Server Toolkit, this will always be the process name of the OPC server on
which the COM call is being made. In the example above, we see that
NDISimServer is the process name from which the trace output originates.
A unique identifier for the COM object on which the method call was
43
Directional
Indicator
Call ID
Return Value
Interface Name
Method Name
Parameter
Values
invoked. For the OPC Server Toolkit, this will always be
OPCServer@<address> or OPCGroup$<GroupName>. <address> is the
actual virtual memory address of an OPCServer object instance,
<GroupName> is the name of a particular OPCGroup object instance, so
specified by the client that created the group.
‘>>’ indicates a pre-call trace statement and ‘<<’ indicates a post call trace
statement.
The combination of the ID of the thread from which the call is being made,
and a globally unique call sequence number. For example, in the first trace
statement we see that the call is made from thread ID #207 and that the
call sequence number is 1. For the OPC Server Toolkit, the thread ID will
always be that of a thread in the RPC thread pool that services incoming
COM calls for the multi-threaded apartment.
In post call statements only, the .hr=<HRESULT>. entry appears. The
HRESULT value is the actual return value from the COM method call.
The name of the interface to which the COM method call belongs.
the name of the method being called.
A dump of the parameter values. For pre-call trace statements, the ‘[out]’
placeholder marks output parameters. For post call trace statements, the
‘[in]’ placeholder marks input parameters.
Trace Output Configuration
Trace output is configured by means of the ‘NDITraceHook.ini’ file. This file is installed in the
‘<CommonFilesDir>\Northern Dynamic\NDITraceHook’ directory by the TraceHook Setup
(<CommonFilesDir> represents the location for common shared files on the system e.g.
C:\ProgramFiles\Common Files).
Listed below are the contents of the file, as provided by the TraceHook Setup utility:
[Config]
; Full path to the trace log file
LogFile=c:\temp\NDITraceHook.txt
; Maximum trace log file size (in bytes). It will wrap to the beginning upon reaching this limit
MaxFileSize=10000000
; A trace filter string, using the same syntax as the VB "Like" statement. Only trace
; messages matching the filter will be written to the trace log file
Filter=
; The trace level setting. The following values have meaning:
; 0 - no tracing
; 1 - trace only failed method calls
; 2 - trace all method calls (HRESULTs only)
; 3 - provide both pre and post method call trace messages (gives call timing)
; 4 - provide both pre and post method call trace messages, with full parameter dump
TraceLevel=4
; Trace log file truncate flag. If non-zero, the trace log will be truncated to a zero
; length when it is first opened.
Truncate=0
44
The INI file is read when the TraceHook component DLLs are first loaded by any process. As
such, changes will not be recognized until the DLLs are unloaded and reloaded again. A utility is
provided, however, to adjust the configuration during run-time (see below).
By specifying a filter string, only events of interest will be captured in the log file. For example,
suppose you’re only interested in IOPCAsyncIO2 interface method calls. Then setting the Filter
value equal to ‘*IOPCAsyncIO2*’ will cause the TraceHook components only to log message
strings that match this pattern.
Run-time Configuration Utility
The TraceHook Setup also installs a run-time configuration utility (NDITraceHookCfg.exe) in the
‘<SystemRoot>\Program Files\Common Files\Northern Dynamic\NDITraceHook’ directory. As
described earlier, the ‘NDITraceHook.ini’ configuration file is read when the TraceHook
component DLLs are first loaded by any process. NDITraceHookCfg.exe therefore provides a
means to change the TraceHook configuration while it is in use.
The following screenshot illustrates the capabilities provided by this simple utility.
Here we see that the filter, trace level, and maximum log file size may be changed at run-time.
When any field value is modified the ‘Apply Changes’ button is enabled. Pressing this button will
make the changes take effect immediately. After applying any changes, the ‘Persist Settings’
button will then be enabled. If this button is pressed, the current settings will also be saved to
the NDITraceHook.ini file, thereby making the changes remain in effect the next time the
TraceHook components are utilized.
45