1
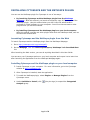
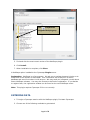
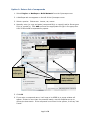
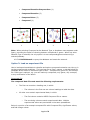
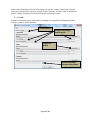
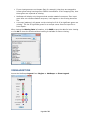
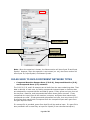
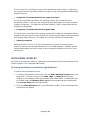
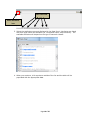
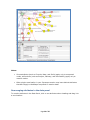
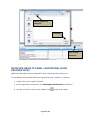
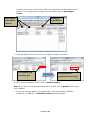
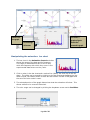
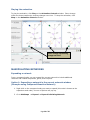
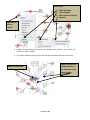
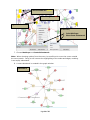
MetScape 2.3.2 User Manual A Plugin for Cytoscape National Center for Integrative Biomedical Informatics July 2012 2011 University of Michigan This work is supported by the National Center for Integrative Biomedical Informatics through NIH Grant# 1U54DA021519-01A1 Contents OVERVIEW ................................................................................................................................................. 4 About data sources ............................................................................................................................... 4 Workflow overview ............................................................................................................................... 4 INSTALLING CYTOSCAPE AND THE METSCAPE PLUGIN............................................................................ 5 Launching Cytoscape and the MetScape plugin from the Web ........................................................... 5 Installing Cytoscape and the MetScape plugin on your local computer ............................................. 5 ENTERING DATA ........................................................................................................................................ 6 Option 1: Enter a list of compounds ..................................................................................................... 7 Option 2: Load an experiment file ........................................................................................................ 9 VISUALIZATION ........................................................................................................................................ 14 METSCAPE TAB ........................................................................................................................................ 15 RULES USED TO BUILD DIFFERENT NETWORK TYPES ............................................................................. 16 DATA PANEL DISPLAY .............................................................................................................................. 17 Choosing attributes provided through MetScape .............................................................................. 17 Rearranging attributes in the data panel ........................................................................................... 20 Pathway filter in the data panel ......................................................................................................... 21 Concept filter in the data panel .......................................................................................................... 22 METSCAPE RESULTS PANEL (ADDITIONAL NODE INFORMATION) ........................................................ 25 ANIMATION OF DATA ............................................................................................................................. 26 Building an Animation ......................................................................................................................... 26 Manipulating the animation: zooming .............................................................................................. 28 Manipulating the animation: bar chart ............................................................................................. 29 Playing the animation ......................................................................................................................... 30 MANIPULATING NETWORKS ................................................................................................................... 30 Expanding a network........................................................................................................................... 30 Option 1: Expanding a network in the current network window (Example using CompoundReaction Network) .............................................................................................................................. 30 Option 2: Expanding a network in a new window (Example using Compound Network from Selected Genes) ................................................................................................................................... 32 Collapsing a network ........................................................................................................................... 33 Creating a subnetwork ........................................................................................................................ 33 Destroying a network .......................................................................................................................... 35 Page 2 of 35 SAVING AND REOPENING A SESSION ..................................................................................................... 35 Saving a session ................................................................................................................................... 35 Reopening a session ............................................................................................................................ 35 Please note that due to continuous software upgrades, the images in this handout may not exactly mimic what you see on the screen. Page 3 of 35 OVERVIEW About data sources MetScape is a plug-in for Cytoscape, the bioinformatics network visualization tool. The plug-in can be used to visualize and interpret metabolomics and gene expression data in the context of human metabolic networks. MetScape uses a metabolite database developed by extracting and integrating information from the following sources: 1. Edinburgh Human Metabolic Network (EHMN) — http://www.ehmn.bioinformatics.ed.ac.uk/ 2. KEGG COMPOUND Database — http://www.genome.jp/kegg/compound/ MetScape allows users to load a list of metabolites with experimentally determined concentrations, a list of genes with experimentally determined expression values, and a list of concepts or pathways, and display them in the context of relevant metabolic networks. Workflow overview With MetScape, you can: Trace the connections between metabolites and genes. Integrate multidimensional data Visualize compound, reaction, enzyme and gene networks and display compound structures, as well as information for reactions, enzymes, genes, and pathways. Visually animate changes in compound concentrations over time and across experimental conditions. The basic steps in the workflow include: 1. Enter data. You can type or paste a list of compounds and/or genes, load a file containing experimental data, or start from a biological pathway. 2. Select compound and reaction attributes. Choose which attributes to display in a table as you work with your visual network graph. 3. Explore the Visual network and table of attributes: Expand and collapse a network. Create a subnetwork Visualize your data in a wide variety of network layouts provided by Cytoscape. Use color, size, and other effects to visually reflect a set of attribute values. 4. Save your session and reopen it later. Page 4 of 35 INSTALLING CYTOSCAPE AND THE METSCAPE PLUGIN You can use the MetScape plugin for Cytoscape in one of two ways: By launching Cytoscape and the MetScape plugin from the MetScape Webpage. With this method, you launch a temporary copy of Cytoscape and the MetScape plugin. Use this method when you don’t have the administrative privileges to install software on your computer. You will not have access to other plugins when you use this method. By installing Cytoscape and the MetScape plugin on your local computer. With this method, you can use other plugins that work with MetScape data, such as Shortest Path and MCODE. Launching Cytoscape and the MetScape plugin from the Web To launch Cytoscape and the MetScape plugin from the MetScape Webpage: 1. Go to http://metscape.ncibi.org/metscape2/. 2. On the Webpage, click the Launch Cytoscape w/ MetScape 2 via Java Web Start link. After launching the Web version, you can do anything described in this User Guide. You can save your Cytoscape session on your local computer and reopen it at a later time after launching the application from the MetScape Webpage again. Installing Cytoscape and the MetScape plugin on your local computer 1. Install Cytoscape on your computer. For more information, go to the Cytoscape website at http://cytoscape.org/. 2. After Cytoscape is installed, start the application. 3. To install the MetScape plugin, select Plugins -> Manage Plugins from the Cytoscape menu. 4. Under Available to Install, click Analysis group. (the plus sign) to expand the Integrated Page 5 of 35 Click to expand the Integrated Analysis group 5. Find and click the most recent version of the MetScape plugin. 6. Click Install. 7. When installation is complete, click Close. A MetScape option is added to the Cytoscape Plugins menu. Registration: MetScape is a free program. We ask you to register because it helps us to keep track of the number of downloads. Your information will be stored in a secure database and we will not share it with anyone. We may send you infrequent e-mails about future MetScape releases. You may also choose to decline the registration. If you decide to register later, the registration window can be found on the main MetScape menu. Note: This plugin requires Cytoscape 2.8 to run correctly. ENTERING DATA 1. To begin a Cytoscape session with the MetScape plugin, first start Cytoscape. 2. Choose one of the following methods to get started. Page 6 of 35 Option 1: Enter a list of compounds 1. Select Plugins -> MetScape-> Build Network from the Cytoscape menu. 2. A MetScape tab now appears on the left of the Cytoscape screen. 3. Select a species. Choices are: human, rat, mouse 4. Manually enter (or copy and paste) compound ID(s) or name(s) and/or Entrez gene ID(s) or symbol(s). Click Add and enter the appropriate ID type in the popup box. Lists of IDs should be separated by spaces. Choose species Enter compounds and/or genes “ADD” buttons Enter compounds into “Add Compounds” popup window 5. Click OK 6. If you enter a compound name, it will map to its KEGG id; a popup window will appear. If there is more than one potential match, use the dropdown arrow to choose the best match. If the compound is not found in the system, it will say “Not Found.” Page 7 of 35 7. Click OK 8. After the experimental data has been loaded, if any of the genes/compounds that you submitted were not mapped to the database objects, a Missing Data window will appear. After viewing the Missing Data information, click SAVE to save the data for later viewing or click OK to close the window without making it available for future viewing. (See the Missing Data Window section below, under Option2: Load an experiment file, for more information about missing data). 9. Select a Network Type by selecting one of the following from the dropdown menu: Page 8 of 35 Compound-Reaction-Enzyme-Gene (1) Compound-Reaction (2) Compound-Gene (3) Compound (4) 1 2 3 4 Note: When selecting Compound as the Network Type, a dropdown menu appears under Query, providing the option of choosing between compounds or genes. When any other Network Type is selected, the only option is to use compounds/genes unless using a selected pathway. 10. Click Build Network to query the database and create the network. Option 2: Load an experiment file Use to load experimental data to visualize and explore compound networks over time or in varying experimental conditions. The input can be an Excel, comma, or tab delimited file. MetScape allows users to load three types of files – compound file, gene file, and concept file. Each type is optional, e.g. you can load only compounds, only genes, only concepts, or any combination of the above. Compound File The compound data file must meet the following requirements: The first row must be a heading row, in which: o The columns in the first row are column headings to label the data. All other rows contain experimental data, in which: o The first column contains KEGG Compound IDs or names. o The remaining columns contain experimental data. Multiple experimental values are permissible in the same spreadsheet. Below is a portion of an example compound file with Compound IDs, significance values, and fold change values: Page 9 of 35 Gene File The gene file must meet the following requirements: The first row must be a heading row that includes column headings to label the data. The first column contains Entrez Gene IDs or Official Gene Symbols. The remaining columns contain experimental data. Multiple experimental values are permissible in the same spreadsheet. Below is a portion of an example gene file with Gene IDs, significance values, and fold change values: Concept File The concept file can be generated by a gene set enrichment analysis tool such as LRpath or GSEA from gene expression data. Page 10 of 35 Note: Gene set enrichment testing is an approach used to test for predefined biologicallyrelevant gene sets that contain more significant genes from an experimental dataset than expected by chance. GSEA (Subramanian at al., Proc. Natl. Acad. Sci. USA, 2005, 102:1554515550). LRpath (Sartor et al., Bioinformatics, 2009, 25(2):211-7). Below is a portion of an example concept file: Instead of loading a concept file you can run LRpath directly from MetScape. Running LRpath from MetScape: If you choose to run LRpath directly from MetScape, the directional test against EHMN metabolic pathways with a minimum number of genes in the concept = 5 will be performed. Only the concepts with p-values < 0.05 will be reported. For more options, go to the LRpath page. 1. Select Plugins -> MetScape-> Select Experimental Data…from the Cytoscape menu. Select a species. Choices are: human, rat, mouse 2. Using the Import File… buttons, select the compound and/or gene files to load. 3. Select the appropriate column headings, using the dropdown menus, for fold change and p-value. Choose the desired threshold. 4. Choose to select an input file with concepts or choose to generate concepts using LRpath (generating the concepts with LRpath will take longer than loading a file with the information). Note: LRpath performs gene set enrichment testing, an approach used to test for predefined biologically-relevant gene sets that contain more significant genes from an experimental dataset than expected by chance (Sartor et al., 2009). To run LRpath, you Page 11 of 35 need a Gene Expression file with fold change (or log fold change) values and p-values. The Gene Expression file needs to contain all gene records, not just those for significant genes; LRpath will determine the significant genes from the input. 5. Click OK. Example of selecting experimental data, including importing files and designating fold change, p-values, and thresholds: Choose species P-value, Fold Change, and Threshold Import File button Option to generate concepts using LRpath Page 12 of 35 Example of ID mapping window from a loaded compound experiment file: Note: If you select Save on the Select Compound Mappings window, you will get a .csv file containing mapping information for all compounds that MetScape successfully mapped. Note: The Select Experimental Data window can also be accessed from the MetScape tab. Note: Multiple networks can be built within the same user session. After a network is built, pull up the Select Experimental Data window and change the data files. Then build the new network. Both networks will remain accessible. If you change species, however, all existing data will be lost. The below warning window will pop up in this situation. Missing Data Window After the experimental data has been loaded, if any of the genes/compounds that you submitted were not mapped to the database objects, a Missing Data window will appear. Genes, compounds, and concepts may appear on this missing elements list because: Genes and compounds that you supply may not be in the database. If they are not found in the database then they are reported as missing. Page 13 of 35 If your input genes are not human (Rat, for example), then they are mapped to human genes using homologs from NCBI’s HomoloGene. If this mapping fails, then those genes are reported as missing. MetScape will display only the genes that encode metabolic enzymes. If an input gene does not encode metabolic enzymes, it will appear on the missing elements list. A concept (pathway) will appear on the missing list if all of its significant genes are missing. The list of significant genes for a concept comes from the input file or from LRpath. After viewing the Missing Data information, click SAVE to save the data for later viewing or click OK to close the window without making it available for future viewing. VISUALIZATION Access the MetScape Legend from Plugins -> MetScape -> Show Legend. Page 14 of 35 Additional information about the network is expressed through visualization: A compound is red in the original network and subsequent subnetworks if it was in the original data loaded into MetScape. A green border surrounding a node represents significant gene/compound. Node size represents the direction of the change. Larger nodes represent an increase and smaller nodes represent a decrease in gene/metabolite. The actual amount of the change is not represented visually. When a node is expanded, the edges between the original node and the expanded nodes become blue. METSCAPE TAB This tab has options for choosing Network Types, the data you entered, and more. From this tab you can: Select the type of network that you want to build Select Network Type by selecting one of the following from the dropdown menu: o Compound-Reaction-Enzyme-Gene o Compound-Reaction o Compound-Gene o Compound Note: When selecting Compound as the Network Type, a dropdown menu appears under Query, providing the option of choosing between compounds or genes. When any other Network Type is selected, the only option is to use compounds/genes unless using a selected pathway. Add or Remove data. Select a pathway o Use to view all the compounds and reactions associated with a metabolic pathway. Select a specific pathway from the drop-down list. Save the Output as a File. Build Network graph based on the data. Page 15 of 35 Add or remove data Choose network type Select a pathway Save output as a file Note: When the organism is human, the Genes section will show Input ID and Input Symbol. However, when the organism is not human (ex. rat), the Genes section will show Input ID, Input Symbol, and Human Symbol. RULES USED TO BUILD DIFFERENT NETWORK TYPES Compound-Reaction-Enzyme-Gene (C-R-E-G), Compound-Reaction (C-R), and Compound–Gene (C-G) networks The C-R-E-G, C-R, and C-G networks are all built from the same underlying data. That data is derived, in each case, by finding compounds that participate in reactions that are catalyzed by enzymes that are encoded by genes. If only genes are input, then all the enzymes, reactions, and compounds that match those genes are used. If only compounds are input, then all the reactions, enzymes, and genes that match those compounds are used. If both genes and compounds are input, then only those C-R-EG couplings that match both a compound from the compound input and a gene from the gene input are used. If a concept file is provided, genes from that file will be used as input. If a gene file is also provided it will be used only as input for LRpath (if user chooses that option). Page 16 of 35 If only a gene file is provided, all genes from that file are used as input. In this case, we recommend that you load a smaller set of genes (e.g. most significant differentially expressed genes). Compound (C) networks built from compound input If a list of compounds is provided, the resulting network will include the query compounds (shown in red) plus any compounds that participate in the same reactions as query compounds. The edges will be drawn between “seed” compounds and their neighboring compounds Compound (C) networks built from gene input If a list of genes is provided, the resulting network will include the compounds that are related to the query genes via the reactions in which they participate, and the enzymes that catalyze these reactions. The edges will be drawn between all compounds. Pathway networks Pathway-specific C-R-E-G, C-R, and C-G networks are built from a set of genes, enzymes, reactions and compounds defined in the EHMN database. Pathway-specific Compound networks are built similarly to the Compound networks built from a set of input genes. DATA PANEL DISPLAY Attributes of compounds, reactions, pathways, and concepts that you have selected in the network appear in the Cytoscape Data Panel. Choosing attributes provided through MetScape To choose which attributes to view: 1. To choose attributes for compounds, click the Node Attribute Browser tab in the Data Panel. You can choose to view node, edge, or network attributes by clicking on the respective tabs at the bottom of the Data Panel. Pathway data can be viewed under the Pathway Filter tab and concept data can be viewed under the Concept Filter tab in the Data Panel. 2. Click the Select Attributes icon in the Data Panel toolbar. A list of attributes with check boxes will appear. Page 17 of 35 Data Panel tabs Select Attributes icon 3. Select the attributes you want displayed in the Data Panel. Attributes are listed with item type before the attribute (ex. Compound.name; Enzyme.name). The available attributes will depend on the type of network created. 4. When you are done, click anywhere outside of the list and the table will be populated with the appropriate data. Page 18 of 35 Below is a table of available attributes for each node type: *Please note that the reactions shown in the Reaction.equation attribute display all compounds, while the networks built from the list of input genes/compounds show only “main” compounds (see Ma et al., Mol. Syst. Biol., 2007, 3:135 for details). Pathwayspecific networks show all compounds. Below is a table of available attributes for each edge: 5. Select compounds and/or edges in the graph to view their attributes in the Data Panel. Page 19 of 35 Notes: Some attributes (such as Formula, Mass, and Smile) apply only to compound nodes, while others (such as Enzyme, Pathway, and Reversibility) apply only to reaction nodes. Other plugins used earlier in your Cytoscape session may leave behind attributes that don’t apply to MetScape compound or reaction data. Rearranging attributes in the data panel To reorder attributes in the Data Panel, click on an attribute column heading and drag it to a new location: Page 20 of 35 Click on heading and drag with mouse (notice: Compound.name is currently to the right of Compound.formula) Drop heading in new location (notice: Compound.name is now next to ID and to the left of Compound.formula) To sort by an attribute, click the attribute column heading; to sort in the reverse direction, click again. Click on column title to sort. Notice the (arrow) appears when a column is sorted A-Z (an arrow in the reverse direction appears when sorted Z-A). Pathway filter in the data panel MetScape provides two ways to access pathway information. The Pathway Filter tab lists all pathways represented in the network. Selecting one or more pathways will highlight in the network all nodes in the pathway(s). Pathways are also displayed as attributes in the data panel. Page 21 of 35 A subgraph can be created for a given pathway. The subgraph consists of a subset of nodes from an active network that belong to the selected pathway. To create a subgraph: 1. Select a pathway in the Pathway Filter tab. 2. Click the Create Subnetwork button at the top of the Data Panel (make sure you are on the Pathway Filter tab). 3. A new graph appears in the graph window. This is the subnetwork for the selected pathway. Concept filter in the data panel The content of the created or loaded concept file is put into the Concept Filter tab. Direction of the change Concept names P-value FDR 1. Concept Name - official name of the concept. 2. Number of Genes - the number of input genes that belong to the concept. 3. Direction – direction of the change. 4. P-value - the p-value for enrichment/depletion. Page 22 of 35 5. False Discovery Rate - the FDR, estimated using the method of Benjamini and Hochberg (When results are sorted by p-value, a FDR < 0.05 is interpreted to mean that approximately 5% of the concepts with lesser or equal p-value are false positives). To map a concept on the graph, click on the concept name in the Data Panel. The concept will then be highlighted in the graph (associated nodes turn yellow and associated edges turn red). Concept nodes turn yellow; concept edges turn red Select concept A subgraph can be created for a given concept. The subgraph consists of genes considered to be significant to the concept (those genes that drive the concept), not all genes in the concept. To create a subgraph: 4. Select a concept in the Concept Filter tab. 5. Click the Create Subnetwork button at the top of the Data Panel (make sure you are on the Concept Filter tab). 6. A new graph appears in the graph window. This is the subnetwork for the selected concept. Page 23 of 35 Graph of subnetwork appears in graph window Click on “Create Subnetwork” button Select concept The Reapply Selection button will re-select the last selected concept in the graph. If you select a concept and then select off of it, clicking the Reapply Selection button will reselect that concept. The concept information can be saved as a file. To save this information: 1. Under Concept Filter tab, click the Save Concepts… button. 2. A new window pops up, asking where to save the file. Choose the desired location. 3. Click Save. The file saves as a CSV file that can be opened with most text editing or spreadsheet programs. The file format is identical to the input concept file. Page 24 of 35 Choose location for saving file Click Save Click on Save Concepts… METSCAPE RESULTS PANEL (ADDITIONAL NODE INFORMATION) Additional information can be obtained for each node by double clicking on it. To get additional information about any compound, gene, reaction, or enzyme: 1. Double click on the node of interest. 2. On the right side of the screen, the MetScape Results Panel will show up. 3. Use the scroll bar or click on the undock icon Page 25 of 35 to see all the data. Double click on node of interest Additional Node Details ANIMATION OF DATA Create an animation of the data to see how it changes over time and across treatments. Building an Animation 1. Create a subnetwork (for example, create a subnetwork for the TCA Cycle. See the Concept Selection Data in the Data Panel section for how to do this). Note: It is not necessary to create a subnetwork before doing data animation; the animation can be done on any network. 2. From the Plugins menu, choose MetScape -> Animate data… Click Metscape , then Animate data… 3. A new window pops up, titled Initialize Coupled Animation of Multiple Data Columns. 4. Column headings from your data are listed on the right side of the new window. Determine how many animations (number of rows) and data items per animation Page 26 of 35 (number of columns) you will need. Enter this information into the Rows and Cols boxes. If you change these numbers from the default, click on Reconfigure Layout. Enter the # of rows and # of columns Reconfigure Layout button 5. Click and drag the column names into the grid to build the animation. Click heading, drag and drop in grid Heading dropped in appropriate location in grid 6. After grid is completely filled in, click on Build Animation. Note: If you want to undo what you filled out in the grid, click on Restart and the grid will be cleared. 7. Three new windows appear in the graph panel, each representing a different treatment. In addition, an Animation Controls window appears. Page 27 of 35 Manipulating the animation: zooming 1. Zoom in on one graph to the appropriate view size (zoom the same way you do with any Cytoscape graph). 2. On the Animation Controls window, click on Realign All. This brings all the treatment graphs to the same view. Page 28 of 35 Zoom in on one graph The other 2 graphs align to match the zoomed in graph Click Realign All button Manipulating the animation: bar chart 1. The bar chart in the Animation Controls window shows the range of the data and its frequency. The range of measurements are on the x-axis, while the frequency with which they occur in the experimental data set are on the y-axis. 2. Click on a bar in the bar chart and a vertical line (slider) will show up on the bar chart. The slider can be moved by clicking on the bar chart and dragging the line. When moved, the values shown in black are also shown in black in the graph and the set of the color scale is reset. 3. The selected portion of the graph determines what the animation will show. This allows outliers to be removed if desired. 4. The color range can be changed by clicking the dropdown arrow next to Red-Blue. Page 29 of 35 Playing the animation To play the animation, click Play on the Animation Controls window. Colors change within the three treatments, showing changes over time. To stop the animation, click Stop on the Animation Controls window. Colors change representing change over time MANIPULATING NETWORKS Expanding a network From a compound node, you can expand the current network to include additional reactions and related compounds, genes, and enzymes. Option 1: Expanding a network in the current network window (Example using Compound-Reaction Network) 1. Right click on the compound node you want to expand (this node is known as the expansion seed node). A menu of options will pop up. 2. Go to MetScape -> Expand -> Expand in Existing Network Page 30 of 35 In the menu, 4. Select MetScape 5. Select Expand 6. Select Expand in Existing Network Right click on node to expand 3. Additional compounds and reactions are added to the network. As a result, the network is often redrawn. 4. The edges between the original node and the expanded nodes are now blue. Added reactions and compounds due to the expansion. New edges are blue. Expansion seed node Page 31 of 35 Option 2: Expanding a network in a new window (Example using Compound Network from Selected Genes) 1. Right click on the compound node you want to expand (this node is known as the expansion seed node). A menu of options will pop up. 2. Select MetScape -> Expand -> Expand in Subnetwork In the menu, 1. Select MetScape 2. Select Expand 3. Select Expand in Subnetwork Right click on node to expand 3. A new network is created in a new window. This network includes only the expansion seed compound and its related compounds, reactions, enzymes, and genes (depending on the Network Type). The original color designations are used when the graph is created in a new window. Expanded network in new window Expansion seed node Page 32 of 35 Collapsing a network To collapse a network that is expanded in a current network window: 1. Right click on the expansion seed compound node. 2. Select MetScape -> Collapse and then: To collapse only the branch expanded from that expansion seed compound, select Collapse. To collapse all expanded branches, select Restore Original Network. Creating a subnetwork A subnetwork of a current network can be created and will appear in a separate window. A subnetwork will include all highlighted nodes and edges (selected nodes should be yellow and selected edges should be red). For example: 1. Select the compound IMP 2. Go to the Select menu in Cytoscape. 3. Choose Nodes -> First Neighbors of Selected Nodes. Now all the first neighbors of IMP should be yellow. 4. Go to the Select menu in Ctyoscape. 5. Choose Edges -> Select Adjacent Edges. Now all the adjacent edges should be red. 6. Right click on IMP. A menu of options will pop up. Page 33 of 35 Selected nodes are yellow Selected edges are red Right click on node In the menu, 1. Select MetScape 2. Select Create Subnetwork 7. Choose MetScape -> Create Subnetwork. Note: When choosing options from the menu, be careful not to move the cursor outside the menu panels. Doing so will remove the highlighting of the nodes and edges, resulting in an empty subnetwork. 8. A new subnetwork is created in the graph window. Subnetwork Page 34 of 35 Destroying a network To destroy a network no longer needed: 1. Make sure you really do want to destroy the network. Cytoscape will not ask you to confirm the deletion. Destroying the network is irreversible. Note: If you want to destroy a network view without destroying the network itself, use Destroy View instead of Destroy Network. 2. On the Network tab in the Cytoscape Control Panel, right click on the network you want to destroy and select Destroy Network. Note: If you destroy a network that has subnetworks, the subnetworks are NOT destroyed. They are promoted up one network level. SAVING AND REOPENING A SESSION Saving a session To save a Cytoscape session containing one or more MetScape plugin networks: 1. Select File -> Save (or Save As…) from the Cytoscape menu. 2. Browse to a location for saving the file. 3. Name the file. 4. Click Save. Reopening a session To reopen a saved session containing MetScape plugin data: 1. Select File -> Open from the Cytoscape menu. 2. Navigate to the saved file location. 3. Select the file. 4. Click Open. 5. After Cytoscape reports that the session file was successfully loaded, click Close. Page 35 of 35