1
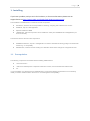
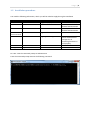
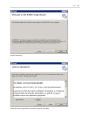
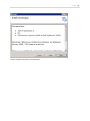
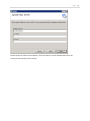
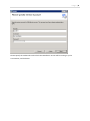
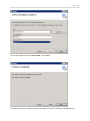
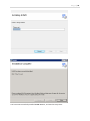
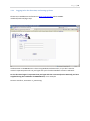
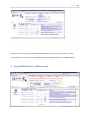
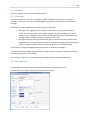
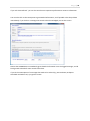
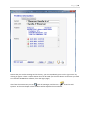
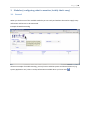
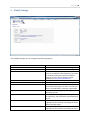
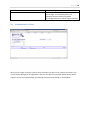
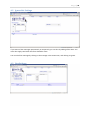
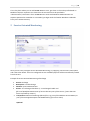
User Manual Page |2 Content 1. Installing .......................................................................................................................................... 3 1.1 Prerequisites............................................................................................................................ 3 1.2 Installation procedure ............................................................................................................. 4 1.2.1 2 3 4 Logging in for the first time, and setting up Users ........................................................ 11 Using HitWB Monitor (Mainscreen) .............................................................................................. 12 2.1 Menubar ................................................................................................................................ 13 2.2 Actionbar ............................................................................................................................... 13 2.3 MessageGrid .......................................................................................................................... 13 Modules (configuring what to monitor, luckily that’s easy) ......................................................... 16 3.1 General .................................................................................................................................. 16 3.2 Available Modules ................................................................................................................. 17 Global Settings............................................................................................................................... 18 4.1 Administrative Notes ............................................................................................................. 19 4.2 IgnoreList Settings ................................................................................................................. 20 4.3 UserSettings .......................................................................................................................... 20 5 Service Oriented Monitoring ......................................................................................................... 21 6 Reporting ....................................................................................................................................... 22 6.1 Availability Charts .................................................................................................................. 22 6.2 Storage Capacity Planning ..................................................................................................... 22 Page |3 1. Installing If you have a problem, and you can’t find a solution, or for more information please visit our supportforums on http://www.handle-it.nl/boards/fg/3/hitwb-monitoring.aspx. The installation of HitWB Monitor consists of several components HitCollector, windows service responsible for collecting, analyzing data collected from servers HitWB.net, asp.net 4 webapplication Sqlserver database HitWB HitWBCLient, optional component can be installed on client (from HitWB Monitor webapplication) for more functionality The licensed version also has extra components: HitWBServiceMonitor, asp.net 4 webapplication for Service Oriented Monitoring (bridge commandcenter function e.g. on a helpdesk) HitNotification, windows service sending out notification about status changes of configured services 1.1 Prerequisites The following components are needed before installing HitWB Monitor. .Net Framework 4 - SQLserver 2008 Express or Sqlserver 2008 other version, server authentication Mixed mode IIS If you’re installing on a Windows Server 2008/Windows 7 environment please be advised that to successfully install you need to install the Role “Services for IIS 6 Management Compatibility". Page |4 1.2 Installation procedure You need the following information, which you will be asked to supply during the installation Component Database Item DatabaseServer DatabaseUsername Value e.g. (local)\sqlexpress DatabasePassword HitCollector service Account Domain e.g. Handle-it Username e.g. Sa_monitoring Password WebApplication ApplicationPool *********** ASP.NET v4.0 For UAC: Launch a command prompt as Administrator From the command prompt execute the following command: Required Yes Optional, leave blank for Windows Authentication Optional, leave blank for Windows Authentication Yes Yes, must be a user with domain administrative privileges for all monitoring functions to work properly Yes Yes Page |5 Please click Next Read the license agreement and select I Agree, click Next Page |6 Please read the information, and click Next Page |7 Please specify the name of the SqlServer, and if you want to use sql authentication fill in the Username and Password, click on Next Page |8 Please specify the credentials under which the HitCollector service will be running in you’re environment, and click Next Page |9 Please select Application Pool: Asp.net v4.0, and click Next All needed information is gathered, please click Next to start the installation of HitWB Monitor P a g e | 10 You have now successfully installed HitWB Monitor, and need to setup users. P a g e | 11 1.2.1 Logging in for the first time, and setting up Users Please start a webbrowser and browse to http://<servername where HitWB is installed>/hitwb.net/login.aspx Authentication in HitWB Monitor is done using Windows Authentication, so you don’t need to remind a separate password. You just logon with you’re familiar Windows account credentials. For the first time login it’s important that you logon with the username (Service Account) you have supplied during the installation of HitWB Monitor, in our example Domain: Handle-iT, Username: sa_monitoring. P a g e | 12 Please from the mainscreen goto SettingsUserSettings, and Insert any users that you need. You can give a user a role, and a userprofile based on monitored Systems or available modules. 2 Using HitWB Monitor (Mainscreen) P a g e | 13 2.1 Menubar From the menubar you can select all available options. 2.2 Actionbar From the Actionbar you can see the lastupdate, which messages are Ignored (You can ignore messages so they don’t show up in the MessageGrid), and you can perform actions on selected messages. Fundamental is that HitWB Monitor utilizes two types of messages: Messages from Logging sources, which don’t have a way of telling if the problem is solved, like Eventlog, Snmp Traps, Logfiles, Syslog etc. If you have taken notice of the content of such a message, you can select the message and click on Acknowledge. The message will be no longer visible in the ‘Select Current’ view. Messages where the message automatically will be moved to the ‘Select Solved’ when HitWB detects it is solved. A simple example is a Diskspace message, when the threshold will be no longer reached it will be automatically places in the Solved Messages. If you want to see Acknowledged Messages please click on ‘Select Acknowledged’. If you want to see Solved Messages please click on ‘Select Solved’, notice that HitWB automatically calculates the duration of the problem. You can also quickjump to a certain System bij selecting the ‘Select System’ dropdownlist. 2.3 MessageGrid The MessageGrid contains all the information collected by the HitCollector service. You can click on the system and get System Detailed information. P a g e | 14 If you Tick ‘Auto Refresh’ you can also see the most important performance resource information. You can also click on the Description to get Detailed information, and if possible solve the problem immediately. If you click on a message that needs to be acknowledged you see this screen. Notice that HitWB Monitor immediately gives detailed information over the logged message, and all back-ground to decide if action needs to be taken. If you click on Description of a message that needs to be solved (e.g. Service down, Diskspace threshold reached etc etc) you get this screen P a g e | 15 Notice that you see the message and it’s history, you can immediately put it on the ‘Ignore List’ by clicking on Ignore. There is a Solve button that can be used (for the solve button to function you need to install the HitWB Client software, from the logon page) Also from the mainscreen you can Search all messages, and there is a wizard to add Systems. In the next chapter all the modules will be explained in more detail. P a g e | 16 3 Modules (configuring what to monitor, luckily that’s easy) 3.1 General When you click on one of the available modules you can easily and without the need to supply many information add servers to be monitored. Example of Module Eventlog Above an example of module Eventlog, you only have to add the System and the EventSource (e.g. System,Application etc). There is tooltip information available when you hover over . P a g e | 17 3.2 Available Modules Cluster, Complete monitoring of all resources in a Windows Cluster environment Database Check, Check by standard query, or own supplied query the status of you're databases Diskspace, Check free diskspace and get notified if thresholds are reached DFS & Replication, Check Distributed File System and if the supplied DFS is replicated correctly to all destinations Eventlog, Check Windows Eventlog and get notified if errors, warnings etc are logged. Get automatically a full description what the logged message means, the severity and what you should do to solve the possible problem, or prevent system failure GlobalHealth, Check a variety of Windows performance parameters like CPU Utilization, Memory, Hard disk IO, Network IO etc Logfiles, Check logfiles (mostly textbased) for keywords supplied (like error, warning, fatal etc) and get notified if such a message is logged to the supplied logfiles Netlogon replication, check Active Directory health, for example replication, trusts etc. Ping, good old TCP/IP check if device is reachable over the network Printservers, check Windows printserver and get notified if a printer is offline, needs toner etc etc ProcessChecker, check if a given process is running and is in a healthy state SNMP traps, receive snmp traps of every device capable of sending it. Configure the system to send SNMP traps to you’re HitWB Monitoring server and you are up and running. Services & Devices, check windows services & devices are running and in a healthy state SysLog, receive syslog messages (e.g. from a unix or linux system), configure the unix/linux system to send syslogmessages to you’re HitWB Monitoring server and that’s all there is too it. TaskScheduler, check scheduled tasks, if task is correctly scheduled and in a healthy state Timedifference, check the time on e.g. you're domain controllers to check if they are in sync. Very important for certain authentication methods like kerberos. TNSPing, check Oracle server listener if it's up and running correctly UrlChecker, check given url (e.q. http://www.handle-it.nl) on you're local network, or by proxy over the internet if reachable and running correctly VMWareESX - vSphere, check you're ESX/vSphere hosts on all important parameters like configuration, alarms, resource usage, health etc. P a g e | 18 4 Global Settings In the Global Settings you can configure the following options: Scan Interval Scan Timeout Determines how frequently scans are performed Determines the timeout for the scanning process Firewall Needed for connection to the internet, fill in proxy server address. Also important if you want the module UrlChecker to perform website checks over the internet. (please use URI notation e.g. http://proxy.handle-it.nl Specify portnumber for the proxy Firewall port HTTP Resp Threshold Logfile Ignore Pattern Logfile Search Pattern Alternate Credentials Username Alternate Credentials Password Important for URL checker and other modules the maximum time given to check a server over HTTP in seconds before a timeout is generated Essential for module Logfiles, which keywords should be ignored Essential for module Logfiles, which keywords are important, and if found are reported directly to you Essential for module VMWare ESX, credentials supplied here are used for connecting the hosts and performing checks Essential for module VMWare ESX, credentials supplied here are used for connecting the hosts P a g e | 19 Diskspace Threshold and performing checks Global threshold for the module Diskspace (percentage), if a checked System has a diskdevice with less then the supplied percentage freespace it will be reported directly 4.1 Administrative Notes Here you can supply a note per system, which is handy if you got a lot of systems to monitor. This note is shown throughout the application. Also you can collect system information like OS, Serial number, etc etc here automatically, by selecting the system and clicking on ‘AutoUpdate’. P a g e | 20 4.2 IgnoreList Settings If you want to filter messages permanently or temporarily you can do it by adding a filter here. You must also supply Until when this filter should be active. You can also filter message by clicking on the message in the mainscreen, and clicking on Ignore. 4.3 UserSettings P a g e | 21 This is the place where you can add HitWB Monitor users, give them a role and a profile based on Module of System. Important is to know that the username must be specified in <domainname>\<username> form. HitWB Monitor works with Windows Authentication so a separate password to remember is not needed, just logon with the familiar Windows credentials from you’re Active Directory. 5 Service Oriented Monitoring Here you can easily configure Service Oriented Monitoring, by supplying a Servicename, Description and a few other details. From this configured service Availabilty Reports will be automatically created from that time. Example of Service Oriented Monitoring of Exchange Service: Exchange Description: E-mail Exchange Contacts: System Administrator Servers: srv-exchange1.handle-it.nl, srv-exchange2.handle-it.nl (fill in Full Qualified Domainname of servers that are part of this service, if more that one servers separate by comma.) Components: Microsoft Exchange (Please fill in e.g. part of the Windows Service Names, or part of the messagedescription that HitWB will log if service is down) Optional P a g e | 22 Maintenance Window, if you fill in Maintenance Window, From Hour / To Hour, service disruption in that timeframe will be considered Regular Maintenance. Also if you’re service window is not for 7*24h, you can add a service window accordingly. 6 Reporting 6.1 Availability Charts Please click on the menubar ‘Monitor’ and select ‘Availability Charts’ If there was disruption in the selected period, the charts will contain a red part. By clicking on the chart (only when there was disruption or planned maintenance), you can see the details about the disruption that occurred. Also you can edit the disruption to Maintenance, so that it will not be calculated as disruption. 6.2 Storage Capacity Planning Every day the HitCollector service will make a snapshot of Storage Capacity of each server that is filled in module Diskspace. Here you have nice charts about the storage in time P a g e | 23