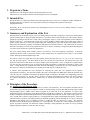
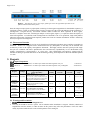
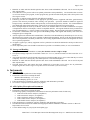
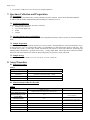
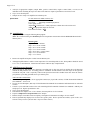
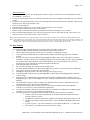
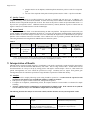
1
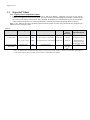
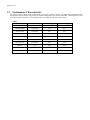
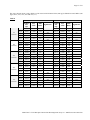
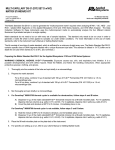
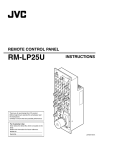
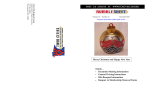
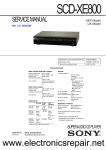
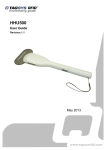
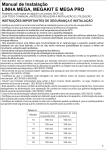
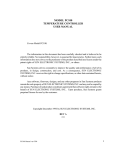
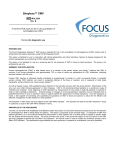
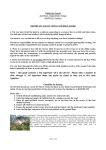
Technical Service: Customer Service (US): Customer Service (EU): [email protected] [email protected] [email protected] IdentiClone T Cell Receptor Gamma Gene Rearrangement Assay 2.0 For Identification of T Cell Clonality For in vitro Diagnostic Use Key to Symbols Used For In Vitro Diagnostic Use Catalog Number Reagent Volume Lot Number Storage Conditions Expiration Date Authorized Representative in the European Community Manufacturer Consult Instructions for Use Storage Conditions: -65 C to -85 ºC (DNA controls may be separated from assay kits and stored at 2 C to 8 C) Catalog# 9-207-0101 9-207-0111 Products IdentiClone T Cell Receptor Gamma Gene Rearrangement Assay 2.0 IdentiClone T Cell Receptor Gamma Gene Rearrangement Assay 2.0 MegaKit Quantity 33 Reactions 330 Reactions Page 2 of 19 Table of Contents 1. PROPRIETARY NAME .................................................................................................................................................... 3 2. INTENDED USE ................................................................................................................................................................ 3 3. SUMMARY AND EXPLANATION OF THE TEST ...................................................................................................... 3 4. PRINCIPLES OF THE PROCEDURE ............................................................................................................................ 3 4.1. 4.2. 5. REAGENTS ........................................................................................................................................................................ 4 5.1. 5.2. 5.3. 6. PRECAUTIONS .............................................................................................................................................................. 6 INTERFERING SUBSTANCES .......................................................................................................................................... 6 SPECIMEN REQUIREMENTS AND HANDLING ................................................................................................................. 6 SAMPLE PREPARATION ................................................................................................................................................ 6 SAMPLE STORAGE ........................................................................................................................................................ 6 ASSAY PROCEDURE ....................................................................................................................................................... 6 8.1. 8.2. 8.3. 8.4. 8.5. 8.6. 8.7. 8.8. 9. THERMOCYCLER .......................................................................................................................................................... 5 ABI CAPILLARY ELECTROPHORESIS INSTRUMENTS ..................................................................................................... 5 SPECIMEN COLLECTION AND PREPARATION ..................................................................................................... 6 7.1. 7.2. 7.3. 7.4. 7.5. 8. REAGENT COMPONENTS .............................................................................................................................................. 4 WARNINGS AND PRECAUTIONS .................................................................................................................................... 4 STORAGE AND HANDLING............................................................................................................................................ 5 INSTRUMENTS ................................................................................................................................................................. 5 6.1. 6.2. 7. POLYMERASE CHAIN REACTION (PCR) ....................................................................................................................... 3 FLUORESCENCE DETECTION ........................................................................................................................................ 4 MATERIALS PROVIDED ................................................................................................................................................ 6 MATERIALS REQUIRED BUT NOT PROVIDED ............................................................................................................... 6 REAGENT PREPARATION .............................................................................................................................................. 7 AMPLIFICATION ........................................................................................................................................................... 8 ABI FLUORESCENCE DETECTION ................................................................................................................................. 8 DATA ANALYSIS .......................................................................................................................................................... 9 QUALITY CONTROL ................................................................................................................................................... 10 ASSAY CONTROL ....................................................................................................................................................... 10 INTERPRETATION OF RESULTS .............................................................................................................................. 10 9.1. 9.2. ANALYSIS .................................................................................................................................................................. 10 SAMPLE INTERPRETATION ......................................................................................................................................... 11 10. LIMITATIONS OF PROCEDURE ................................................................................................................................ 11 11. EXPECTED VALUES ..................................................................................................................................................... 12 11.1. 11.2. EXPECTED SIZE OF AMPLIFIED PRODUCTS ................................................................................................................. 12 SAMPLE DATA ........................................................................................................................................................... 13 12. PERFORMANCE CHARACTERISTICS ..................................................................................................................... 14 13. BIBLIOGRAPHY ............................................................................................................................................................. 17 14. TECHNICAL AND CUSTOMER SERVICE ................................................................................................................ 17 15. LEGAL NOTICE ............................................................................................................................................................. 17 16. END USER LICENSE AGREEMENT........................................................................................................................... 18 Page 3 of 19 1. Proprietary Name IdentiClone T Cell Receptor Gamma Gene Rearrangement Assay 2.0 IdentiClone T Cell Receptor Gamma Gene Rearrangement Assay 2.0 MegaKit 2. Intended Use The IdentiClone T Cell Receptor Gamma Gene Rearrangement Assay 2.0 is an in vitro diagnostic product intended for PCR-based detection of clonal T-cell receptor gamma chain gene rearrangements in patients with suspect lymphoproliferations. Specifically, the T Cell Receptor Gamma Gene Rearrangement Assay 2.0 can be used to identify clonality in suspect lymphoproliferations. 3. Summary and Explanation of the Test Rearrangements of the antigen receptor genes occur during ontogeny in B and T lymphocytes. These gene rearrangements generate products that are unique in length and sequence. Polymerase chain reaction (PCR) assays can be used to identify lymphocyte populations derived from a single cell by detecting the unique V-J gene rearrangements present within these antigen receptor loci1. This IdentiClone PCR assay employs multiple consensus DNA primers that target conserved genetic regions within the T cell receptor gamma chain gene. Amplifying the region with fluorescently labeled primers is followed by fractionation by capillary electrophoresis and analysis by instrument software. This DNA based test is used to detect the vast majority of clonal T-cell populations. Presence or absence of clonality can support the differential diagnosis of reactive lesions and certain T and B cell malignancies. This assay cannot reliably detect clonality present at less than 5% of the total lymphocyte population. It should be emphasized that the results of molecular clonality testing should always be interpreted in the context of all available clinical, histological and immunophenotypic data. This test kit consists of a single master mix that contains primers that target the V2, 3, 4, 5, 8, 9, 10, & 11 and J1/J2, JP, and JP1/JP2 regions. The PCR amplicons have an expected size range between 159 and 207 base pairs. The Specimen Control Size Ladder master mix targets multiple genes and generates a series of amplicons of approximately 100, 200, 300, 400, and 600 base pairs to ensure that the quality and quantity of input DNA is adequate to yield a valid result. A single thermocycler program and similar detection methodology is used with all of our Gene Clonality Assays. This improves consistency and facilitates cross training on a broad range of our different assays. A software based algorithm has been developed for analyzing the peaks that were measured on the capillary electrophoresis instrument. The algorithm calculates the relative peak height ratio (RPR) and a statistical parameter D(x) value for each peak. The RPR is calculated by dividing the height of each peak to the smaller of its neighboring peaks and it must exceed a cutoff of 4.0. The D(x) value is based on a variation of the Kolmogorov-Smirnov test, which compares two empirical distributions and determines whether they are statistically different and its value must be greater than 0.0419. 4. Principles of the Procedure 4.1. Polymerase Chain Reaction (PCR) PCR assays are routinely used for the identification of clonal T-cell populations. This test amplifies the DNA between primers that target conserved regions within the variable (V) and the joining (J) regions that flank the unique hypervariable antigen-binding region 3 (CDR3). These conserved regions lie on either side of an area within the V-J region where programmed genetic rearrangements occur during maturation of all B and T lymphocytes. The antigen receptor genes that undergo rearrangement are the immunoglobulin heavy chain and light chains in B-cells, and the T cell receptor genes in Tcells. Each B- and T-cell has a single productive V-J rearrangement that is unique in both length and sequence. Therefore, when DNA from a normal or polyclonal population is amplified using DNA primers that flank the V-J region, a Gaussian distribution (bell-shaped curve) of amplicon products is produced within an expected size range. This Gaussian distribution reflects the heterogeneous population of V-J rearrangements. In certain cases, where lymphocyte DNA is not present, no product is detected. For DNA from samples containing a clonal population, the yield is one or two prominent amplified products (amplicons) within the valid size range. IdentiClone T Cell Receptor Gamma Gene Rearrangement Assay 2.0 – ABI Fluorescence Detection Page 4 of 19 Figure 1. This diagram of the T cell receptor gamma gene shows the approximate placement of the upstream and downstream DNA primers. Since the antigen receptor genes are polymorphic (consisting of a heterogeneous population of related DNA sequences), it is difficult to employ a single set of DNA primer sequences to target all of the conserved flanking regions around the V-J rearrangement. N-region diversity, and somatic mutation further scramble the DNA sequences in these regions. Therefore, a multiplex master mix, which targets multiple V and J regions (Figure 1), is required to detect the majority of clonal rearrangements. As indicated, clonal rearrangements are identified as one or two prominent, single-sized products within the background of different-sized amplicon products that form the Gaussian distribution around a statistically favored, average-sized rearrangement. 4.2. Fluorescence Detection Fluorescence detection is commonly used to resolve the different-sized amplicon products using a capillary electrophoresis instrument. Primers are conjugated with a 6FAM fluorescent dye (fluorophore) so that they can be detected after excitation by a laser in the capillary electrophoresis instrument. This highly sensitive detection system provides single base pair size resolution and relative quantification. Inter and intra-assay reproducibility in size determination using capillary electrophoresis is approximately 1 to 2 base pairs. This reproducibility and sensitivity coupled with the automatic archiving of specimen data allows for the monitoring, tracking, and comparison of data from individual patients over time. 5. Reagents 5.1. Reagent Components 9-207-0101 9-207-0111 IdentiClone T Cell Receptor Gamma Gene Rearrangement Assay 2.0 IdentiClone T Cell Receptor Gamma Gene Rearrangement Assay 2.0 MegaKit 33 Reactions 330 Reactions Table 1 Catalog # Reagent Components (active ingredients) Unit Quantity 9-207-0101 # of Units 9-207-0111 # of Units Storage Temp. Master Mixes 2-207-0091 TCRG – 6FAM Multiple oligonucleotides targeting the V2, 3, 4, 5, 8, 9, 10, & 11 and J1/J2, JP, and JP1/JP2 regions of the T cell receptor gamma gene in a buffered salt solution. 1500 µL 1 10 -65 C to -85 C Template Amplification Control Master Mix 2-096-0021 Specimen Control Size Ladder – 6FAM Multiple oligonucleotides targeting housekeeping genes. 1500 µL 1 10 -65 C to -85 C Positive Control DNA 4-088-3320 5% TCRG Positive Control DNA 50 g/mL of DNA in 1/10th TE solution 50 µL 1 5 2 C to 8 C or -65 C to -85 C Negative (Normal) Control DNA 4-092-0020 TCRG Negative Control DNA 50 g/mL of DNA in 1/10th TE solution 50 µL 1 5 2 C to 8 C or -65 C to -85 C Reagent Note: There are no preservatives used in the manufacture of this kit. 5.2. Warnings and Precautions 1. 2. This Product is for in vitro Diagnostic Use The assay kit should be used as a system. Do not substitute other manufacturer’s reagents. Dilution, reduction of amplification reaction volumes, or other deviation in this protocol may affect the performance of this test and/or nullify any limited sublicense that comes with the purchase of this testing kit. Page 5 of 19 3. Materials are stable until the labeled expiration date when stored and handled as directed. Do not use kits beyond their expiration date. 4. Close adherence to the protocol will assure optimal performance and reproducibility. Care should be taken to ensure use of correct thermocycler program, as other programs may provide inaccurate/faulty data, such as false positive and false negative results. 5. Do not mix or combine reagents from kits with different lot numbers. 6. Laboratory personnel are reminded to wear appropriate personal protective equipment and follow good laboratory practices and universal precautions when working with specimens. Specimens should be handled in approved biological safety containment facilities and opened only in certified biological safety cabinets. It is recommended that glass distilled de-ionized molecular biology grade water be used with the preparation of specimen DNA. 7. Due to the high analytical sensitivity of this test, extreme care should be taken to avoid the contamination of reagents or amplification mixtures with samples, controls or amplified materials. All reagents should be closely monitored for signs of contamination (e.g., negative controls giving positive signals). Discard reagents suspected of contamination. 8. To minimize contamination, wear clean gloves when handling samples and reagents and routinely clean work areas and pipettes prior to doing PCR. 9. Autoclaving does not eliminate DNA contamination. Work flow in the PCR laboratory should always be in a one way direction between separate work areas; beginning in Master Mix Preparation, moving to the Specimen Preparation, then to the Amplification, and finally to Detection. Do not bring amplified DNA into the areas designated for master mix or specimen preparation. 10. All pipettes, pipette tips, and any equipment used in a particular area should be dedicated to and kept to that area of the laboratory. 11. Sterile, disposable plastic ware should be used whenever possible to avoid RNase, DNase, or cross-contamination. 5.3. Storage and Handling For any duration other than immediate use, assay kits should be stored at -65 C to -85 C. The optimum storage temperature for the DNA controls is 2 C to 8 C, but DNA controls can also be stored at -65 C to -85 C. All reagents and controls must be thawed and vortexed or mixed thoroughly prior to use to ensure that they are mixed completely. Excessive vortexing may cause labeled primers to lose their fluorophores. Materials are stable until the labeled expiration date when stored and handled as directed. Do not use kits beyond their expiration date. The PCR master mixes and controls have been validated for 6 freeze-thaw cycles with no loss in performance. Aliquot reagents into sterile o-ring screw-cap tubes if more freeze-thaw cycles are necessary. 6. Instruments 6.1. Thermocycler Use or Function: Amplification of DNA samples Performance Characteristics and Specification: Minimum Thermal Range: 15 C to 96 C Minimum Ramping Speed: 0.8 C/sec Follow manufacturer’s installation, operation, calibration, and maintenance procedures. See section 8.4 Amplification for thermocycler program. 6.2. ABI Capillary Electrophoresis Instruments Use or Function: Fragment detection and analysis Performance Characteristics and Specification: The following capillary electrophoresis instruments will meet the performance needs for this assay: ABI 3100 Avant Genetic Analyzer (4-capillaries) ABI 3100 Genetic Analyzer (16-capillaries) ABI 3130 Genetic Analyzer (4-capillaries) ABI 3130XL Genetic Analyzer (16-capillaries) ABI 3500XL Genetic Analyzer (24-capillaries) Follow manufacturer’s installation, operation, calibration, and maintenance procedures. The ABI instrument used must be calibrated with appropriate Matrix Standards as outlined in section 8.2 Materials Required But Not Provided. Use the default settings for your polymer and capillary type. IdentiClone T Cell Receptor Gamma Gene Rearrangement Assay 2.0 – ABI Fluorescence Detection Page 6 of 19 See section 8.5 ABI Fluorescence Detection for sample preparation. 7. Specimen Collection and Preparation 7.1. Precautions Biological specimens from humans may contain potentially infectious materials. All specimens should be handled in accordance with the OSHA Standard on Bloodborne Pathogens or Biosafety Level 2. 7.2. Interfering Substances The following substances are known to interfere with PCR: Divalent cation chelators Low retention pipette tips EDTA Heparin 7.3. Specimen Requirements and Handling This assay tests genomic DNA extracted and purified from peripheral blood, bone marrow aspirates or paraffin embedded tissue. 7.4. Sample Preparation Extract the genomic DNA from patient specimens as soon as possible. Resuspend DNA to a final concentration of 10 g to 200 g per ml in 1/10th TE (1 mM Tris-HCl, pH 8.0, 0.1 mM EDTA) or in molecular biology grade or USP water. This is a robust assay system. A wide range of DNA concentrations will generate a valid result. Therefore, quantifying and adjusting DNA concentrations is generally not necessary. Testing sample DNA with the Specimen Control Size Ladder master mix will ensure that DNA of sufficient quality and quantity was present to yield a valid result. 7.5. Sample Storage Genomic DNA should be stored at 2 C to 8 C or at -65 C to -85 C until use. 8. Assay Procedure 8.1. Materials Provided Table 2 Catalog # Description 2-207-0091 TCRG – 6FAM 2-096-0021 Specimen Control Size Ladder – 6FAM 4-088-3320 5% TCRG Positive Control DNA 4-092-0020 TCRG Negative Control DNA 8.2. Materials Required But Not Provided Table 3 Reagent/Material Recommended Reagents/Materials and Suppliers Notes DNA Polymerase Applied Biosystems: AmpliTaq Gold DNA Polymerase (Cat# N808-0241) N/A Glass Distilled De-ionized Molecular Biology Grade or USP Water N/A Water must be sterile and free of DNase and RNase. Calibrated Pipettes N/A Must be able to accurately measure volumes between 1l and 1000l. Thermocycler N/A N/A Vortex Mixer N/A N/A PCR plates or tubes N/A Sterile Filter barrier pipette tips N/A Sterile, RNase/DNase/Pyrogen-free Microcentrifuge tubes N/A Sterile Page 7 of 19 Reagent/Material ABI Capillary Electrophoresis Instrument Hi-Di Formamide Size Standards Spectral Calibration Dye Sets Polymer Recommended Reagents/Materials and Suppliers Notes Applied Biosystems: ABI 3100, 3130, or 3500 series N/A Invivoscribe Technologies: HI-Deionized Formamide (Cat# 6-098-0041) Applied Biosystems: Hi-Di Formamide (Cat# 4311320) Invivoscribe Technologies: Hi-Di Formamide w/ROX size standards for ABI 3100 (Cat# 6-098-0061) Applied Biosystems: For ABI 3100 or 3130 instruments: GeneScan - 400HD [ROX] (Cat# 402985) For ABI 3500 instruments: GeneScan - 600 [LIZ] v2.0 (Cat# 4408399) Applied Biosystems: For ABI 3100 and 3130 instruments: DS-30 Matrix Standard Kit (Dye Set D) (Cat# 4345827) For ABI 3500 instruments: DS-33 Matrix Standard Kit (Dye Set G5) (Cat# 4345833) Applied Biosystems: POP-7 Polymer: POP-7 for 3130/3130XL/3500XL Genetic Analyzers (Cat# 4352759) N/A N/A Dye set used to spectrally calibrate ABI instrument for use with 6FAM, HEX, NED, and ROX N/A 8.3. Reagent Preparation 1. 2. All samples should be tested using the Specimen Control Size Ladder master mix. This is to ensure that no inhibitors of amplification are present and there is DNA of sufficient quality and quantity to generate a valid result. All samples must be tested in duplicate. If duplicate testing provides inconsistent results, re-testing or re-evaluation of the sample is necessary. Positive, negative, and no template controls must be tested. Using gloved hands, remove the master mixes from the freezer. Allow the tubes to thaw completely; then gently vortex to mix. Remove the calculated volume of each master mix to individual microcentrifuge tubes. The aliquot volume is 45 l for each reaction. We recommend adding an additional reaction for every 15 reactions to ensure an adequate volume is available. For the TCRG – 6FAM master mix, the number of reactions (n) should be: n = 2 # of samples +1 +1 +1 +1 n = 2 # of samples + 4 (Run each sample in duplicate) 5% TCRG Positive Control DNA TCRG Negative Control DNA No Template Control (water) Additional Reaction Total The total aliquot volume for the TCRG – 6FAM master mix will be n 45l. For the Specimen Control Size Ladder master mix, the number of reactions (m) will be: m = # of samples +1 +1 +1 m = # of samples + 3 3. 4. (Run each sample in singlicate) TCRG Negative Control DNA No Template Control (water) Additional Reaction Total The total aliquot volume for the Specimen Control Size Ladder master mix will be m 45l. Add 1.25 units (or 0.25l at 5 units/l) of AmpliTaq Gold DNA polymerase per reaction to each master mix. The total AmpliTaq Gold DNA polymerase added to the TCRG master mix will be n 0.25l, and m 0.25l for the Specimen Control Size Ladder master mix. Gently vortex to mix. For each reaction, aliquot 45l of the appropriate master mix + DNA polymerase solution into individual wells in a PCR plate or tube. IdentiClone T Cell Receptor Gamma Gene Rearrangement Assay 2.0 – ABI Fluorescence Detection Page 8 of 19 5. 6. 7. Add 5l of appropriate template (sample DNA, positive control DNA, negative control DNA, or water) to the individual wells containing the respective master mix solutions. Pipette up and down several times to mix. Cap or cover the PCR plate. Samples are now ready to be amplified on a thermocycler. Quick Guide: For each master mix and n reactions, mix: n 45 l Master Mix n 0.25 l AmpliTaq Gold DNA polymerase Vortex gently to mix. Aliquot 45l of master mix + DNA polymerase solution into each reaction well. Add 5l of appropriate sample to each well. Total reaction volume = 50l 8.4. Amplification 1. Amplify the samples using the following PCR program: (Note: We recommend using the calculated option for temperature measurement with the BioRad MJ Research PTC thermocyclers.) PCR Program Step 1: 95 C for 7 minutes Step 2: 95 C for 45 seconds Step 3: 60 C for 45 seconds Step 4: 72 C for 90 seconds Step 5: Go to step 2; 34 more times Step 6: 72 C for 10 minutes Step 7: 15 C forever 2. Remove the amplification plate or tubes from the thermocycler. Although amplified DNA is stable at room temperature for extended periods of time, PCR products should be stored at 2 C to 8 C until detection. Detection must be done within 30 days of amplification. 8.5. ABI Fluorescence Detection 1. 2. 3. 4. 5. 6. 7. 8. Please note that for ABI fluorescence detection a preceding peak is often seen and is an artifact due to the detection method the ABI platforms use. Preceding peaks are sometimes skewed and have bases that slope on the right side towards the real peak. This is especially evident in the Specimen Control Size Ladder master mix where the 96-base pair peak has a preceding peak that shows up at 84 base pairs. ABI 3100 and 3130 Platforms: In a new microcentrifuge tube, mix an appropriate amount (10 l per PCR reaction) of Hi-Di Formamide with ROX Size Standardsa. Vortex well. In a new 96-well PCR plate, add 10 l of Hi-Di Formamide with ROX size standards to individual wells for each PCR reaction. Transfer 1 l of each PCR reaction to the wells containing Hi-Di Formamide with ROX size standards. Add only one sample per well. Pipette up and down to mix. Cap or cover the PCR plate. Heat denature the samples at 95 ºC for 2 minutes, then snap chill on ice for 5 minutes. Prepare a sample sheet and injection list for the samples. Run the samples on an ABI 3100/3130 capillary electrophoresis instrument according to its user manualb. Data are automatically displayed as size and color specific peaks. Review profile and controls, report results. (See sections 9 Interpretation of Results and 11 Expected Values below.) Page 9 of 19 1. 2. 3. 4. 5. 6. 7. 8. ABI 3500 Platforms: In a new microcentrifuge tube, mix an appropriate amount (9.5 l per PCR reaction) of Hi-Di Formamide with LIZ Size Standardsa. Vortex well. In a new 96-well PCR plate, add 9.5 l of Hi-Di Formamide with LIZ size standards to individual wells for each PCR reaction. Transfer 0.5 l of each PCR reaction to the wells containing Hi-Di Formamide with LIZ size standards. Add only one sample per well. Pipette up and down to mix. Cap or cover the PCR plate. Heat denature the samples at 95 ºC for 3 minutes, then snap chill on ice for 5 minutes. Prepare a sample sheet and injection list for the samples. Run the samples on an ABI 3500 capillary electrophoresis instrument according to its user manual. Data are automatically displayed as size and color specific peaks. Review profile and controls, report results. (See sections 9 Interpretation of Results and 11 Expected Values) Note a: Please see Applied Biosystems’ accompanying product insert for mixing Hi-Di Formamide with size standards for different ABI instruments. Note b: As the samples are run on the machine, they are fractionated, detected and analyzed by the instrument. Runs are 20-24 minutes in duration. The ABI capillary electrophoresis instruments routinely handle 2 runs per hour (for the 16- and 24-capillary instruments this is equal to 768 and 1152 samples per day, respectively), and automatically analyze and store data for review or comparison with other test results. 8.6. Data Analysis The TCRG Algorithm worksheet has been developed to analyze the TCRG V2 data output. 1. Open the TCRG Algorithm Worksheet (the worksheet requires Microsoft Excel). 2. Add raw data files derived from CE analysis to a new project in GeneMapper software. 3. Verify that Analysis Method selected is “Microsatellite Default” and that the appropriate Size Standard is selected. 4. It may be necessary to lower the Minimum Peak Height threshold in order to detect all peaks in a Gaussian distribution. In order to do this, select GeneMapper Manager from the Tools Menu, go to the Analysis Methods tab, open the “Microsatellite Default” Analysis Method Editor. Go to the Peak Detector tab, select User Specified (rfu) toggle, and input the desired peak height for the Blue dye. 5. In the Analysis menu, select Analyze. 6. For each analyzed sample file, open the associated display plot. 7. To ensure that only the Blue Dye is shown in the display plot, go to the View menu, select Dyes Blue Dye. 8. Next, in the View menu, choose Tables Sizing Table. 9. Highlight the display plot peaks in the valid size range from 159 bp to 207 bp. 10. In the Sizing Table, Copy the Size (bp) and Height (RFU) column data for the highlighted peaks within the valid size range. 11. Paste the peak size and height data into the unlocked portion of the TCRG Algorithm worksheet (cells are highlighted in grey). Note: for GeneMapper version 3.5 and lower, this data must be entered into the worksheet manually. 12. The worksheet will output a summary of RPR, D(x), and %RFU(max) for the five peaks that are the most significant outliers from a normal Gaussian distribution. 13. If a peak in the summary table meets the criteria for a clonal peak as defined in the TCRG Algorithm worksheet, it will read “Yes” in the column titled “Significant?.” 14. If a peak in the summary table does not meet the criteria for a clonal peak as defined in the TCRG Algorithm worksheet, it will read “No” in the column titled “Significant?.” 15. The following criteria are implemented in the worksheet to define peaks as Positive for Clonality: The D(x) value of the suspected clonal peak, as calculated within the locked portion of the worksheet, must be ≥ 0.0419. The RPR of the suspected clonal peak, compared to the smallest adjacent peak, must be ≥ 4X. The RFU of the suspected clonal peak must be ≥ 20% of the RFU of the highest peak in that sample. If a peak is present + 1 bp from a clonal peak, it can be ignored if RFU (Pk + 1) ≤ RFU (Pk). There must be ≥ 2 bp difference between two positive peaks. IdentiClone T Cell Receptor Gamma Gene Rearrangement Assay 2.0 – ABI Fluorescence Detection Page 10 of 19 Samples must be run in duplicate, and both replicates must show positive results for a suspected peak. The size of the suspected clonal peaks in both replicates must be within ± 1 bp from each other. 8.7. Quality Control Positive and negative controls are provided with the kit and must be included with each assay run. In addition, a no template control (e.g. water) must also be included. A buffer control may also be added to ensure that no contamination of the buffer used to resuspend the samples has occurred. The values for the positive controls are provided under section 11.1 Expected Size of Amplified Products. Additional controls and sensitivity controls (dilutions of positive controls into our negative control) are available from Invivoscribe Technologies. 8.8. Assay Control The amplicon sizes listed in Table 4 were determined using an ABI 3130 platform. The amplicon sizes measured on your specific capillary electrophoresis instrument may differ by 1 to 4 base pairs from those listed depending on the platform of detection and the version of the analysis software used. Once identified, the amplicon size as determined on your specific platform will be consistent from run to run. Note: “Color” indicates the color of products generated with the master mix when using the default color assignment on ABI fluorescence detection systems. Table 4 Master Mix TCRG - 6FAM Target V1-V11 + J1/J2, JP, JP1/JP2 Specimen Control Multiple Genes Size Ladder Color Blue Blue Control DNA Cat# --Specified Size Range 5% TCRG Positive Control 4-088-3320 DNA TCRG Negative Control 4-092-0020 DNA Product Size in Base Expected Algorithm Pairs Results 159-207 One peak at 196 bp 194, 196 flagged as “Significant” 84, 96, 200, 300, 400, 600a: N/A Note a: Because smaller PCR fragments are preferentially amplified, it is not unusual for the 600 bp fragment to have a diminished signal or to be missing entirely. For ABI fluorescence detection, the 600 bp peak may not appear during normal run times. In addition, the size of this peak may differ by over 30 bp when fragment size is extrapolated using the GeneScan - 400HD [ROX] size standards. 9. Interpretation of Results Although positive results are highly suggestive of malignancy, both positive and negative results should be interpreted in the context of all clinical information and laboratory test results. The size range for the TCRG – 6FAM master mix has been determined to be 159 bp to 207 bp by testing positive and negative control samples. However, valid clonal TCR gamma rearrangements can occur outside the specified size range. Product(s) that are suspect TCR gamma gene rearrangement(s) that lie outside the specified size range should be sequenced to confirm their identity. 9.1. Analysis 1. 2. 3. 4. Samples that fail to amplify following repeat testing should be reported as “A result cannot be reported on this specimen because the DNA was of insufficient quantity or quality for analysis”. If the positive or negative control reactions fail, testing must be repeated. If samples run in duplicate yield differing results, the samples should be re-tested and/or re-evaluated for sample switching. All assay controls must be examined prior to interpretation of sample results. If the controls do not yield the correct results, the assay is not valid and the samples must not be interpreted. The following describes the analysis of each of the controls, and the decisions necessary based upon the results. Table 5 Type of Control Expected Result Aberrant Result No Template Control No amplification present: continue with analysis Amplification present: check contamination and repeat the assay. TCRG Negative Control Normal Gaussian distribution from 159 bp to 207 bp. No clonal peaks are flagged by Algorithm worksheet. Continue with analysis. Algorithm worksheet flags one or more peaks as “Significant”: Repeat the assay for Page 11 of 19 Type of Control Expected Result Aberrant Result 5% TCRG Positive Control Peaks present at 194 bp, 196 bp. Algorithm worksheet flags at least the196 bp as “Significant.” The 194 bp peak may or may not be identified as “Significant”. Continue with analysis. Algorithm worksheet does not flag peak at 196 bp as “Significant”: Repeat the assay. If the 100, 200, 300, and 400 bp peaks are seen, continue with analysis. Because smaller PCR fragments are preferentially amplified, it is not unusual for the 600 bp fragment to have a diminished signal or to be missing entirely. If no peaks are detected, repeat the assay unless specimen tests positive. If only the 100, 200, or 300 bp peaks are present, reevaluate sample for DNA degradation unless specimen tests positive. (This can also be an extraction control if positive control material is taken through extraction processes) Specimen Control Size Ladder 9.2. Sample Interpretation Given that the controls produce expected results, the clinical samples should be interpreted as follows: One or two significant peaks flagged by the Algorithm worksheet within the valid size range are reported as: “Positive for the detection of clonal T cell receptor gamma chain gene rearrangement(s) consistent with the presence of a clonal cell population. In the context of overall diagnostic criteria, clonal cell populations can indicate the presence of hematologic malignancy.” Three or more significant peaks flagged by the Algorithm worksheet within the valid size range are reported as: “T cell receptor gamma chain gene rearrangements are consistent with the detection of biclonality or oligoclonality.” An absence of significant peaks flagged by the Algorithm worksheet within the valid size range is reported as: “Negative for the detection of clonal T cell receptor gamma chain gene rearrangement(s).” Note: A visual confirmation should be conducted; the electropherogram should be visually reviewed to ensure that the algorithm interpreted the pattern correctly. 10. Limitations of Procedure This assay does not identify 100% of clonal cell populations. This assay cannot reliably detect below 5 positive cells per 100 total cells. The results of molecular clonality tests should always be interpreted in the context of clinical, histological and immunophenotypic data. The algorithm requires a reasonably consistent signal background and that the data is entered correctly. Gaps in the background can cause the algorithm to call a sample incorrectly. All electropherograms should be reviewed to confirm the validity of the interpretation. PCR-based assays are subject to interference by degradation of DNA or to inhibition of PCR due to EDTA, heparin, or other agents. IdentiClone T Cell Receptor Gamma Gene Rearrangement Assay 2.0 – ABI Fluorescence Detection Page 12 of 19 11. Expected Values 11.1. Expected Size of Amplified Products The amplicon sizes listed were determined using an ABI 3130 platform. Amplicon sizes seen on your specific capillary electrophoresis instrument may differ 1 to 4 bp from those listed depending on the platform of detection and the version of the analysis software used. Once identified, the amplicon size as determined on your specific platform will be consistent from run to run. This reproducibility is extremely useful when monitoring disease recurrence. Note: “Color” indicates the color of products generated with the master mix when using the default color assignment on ABI fluorescence detection systems. Table 6 Master Mix Target TCRG-6FAM All V and J genes Specimen Control Size Ladder Color Control DNA Cat# Product Size in Base Pairs Blue Specified Size Range TCRG Negative Control DNA --4-092-0020 159-207 159-207 V9, V10 + J1/J2 Blue 5% TCRG Positive Control DNA 4-088-3320 194 & 196 Multiple Genes Blue Any Human DNA --- 84, 96, 200, 300, 400, 600 a Expected Algorithm Results No Significant Peaks Significant Peak at 196 bp and possibly second peak at 194 bp N/A Note a: Because smaller PCR fragments are preferentially amplified, it is not unusual for the 600nt fragment to have a diminished signal or to be missing entirely. For ABI fluorescence detection the 600 bp peak may not appear during normal run times. In addition, the size of this peak may differ by over 30 bp when fragment size is extrapolated using the GeneScan - 400HD [ROX] size standards. Page 13 of 19 11.2. Sample Data The data shown below was generated using the TCRG-6FAM Master Mix. Amplified products were run on an ABI 3130 instrument. Panel 1 displays data generated testing the 100% TCRG Positive Control DNA. Panel 2 displays data generated testing the 5% TCRG Positive Control DNA. Panel 3 displays data generated testing the TCRG Negative Control DNA. Figure 2 For the Specimen Control Size Ladder master mix: Panel 1 displays data generated testing a negative water control. Panel 2 displays data generated testing the IVS-0000 Polyclonal Control DNA. Panels 3 and 4 display data generated testing two different 100% clonal control DNAs. Figure 3 IdentiClone T Cell Receptor Gamma Gene Rearrangement Assay 2.0 – ABI Fluorescence Detection Page 14 of 19 12. Performance Characteristics The assay was able to detect clonal rearrangements in 11 positive control cell lines. The following well-characterized T cell leukemia cell lines known to be positive for TCRG rearrangements were tested with TCRG – 6FAM master mix, and the results are shown in Table 7. Two prominent peaks were detected with each of the cell lines. Table 7 Cell Line IVS Part Number Peak One (bp) Peak Two (bp) 100% IVS-0004 4-088-0190 178.8 187.9 100% IVS-0005 4-088-0250 173.0 198.3 100% IVS-0008 4-088-0430 195.1 206.7 100% IVS-0009 4-088-0490 187.8 190.5 100% IVS-0016 4-088-0910 169.4 193.7 100% IVS-0021 4-088-1210 183.1 188.0 100% IVS-0039 4-088-2290 193.9 195.9 DND-41 N/A 168.9 188.8 PF-382 N/A 190.6 200.1 MOLT-13 N/A 187.9 190.6 Page 15 of 19 The assay showed robust results (Table 8) when tested with IVS-0039 DNA (200 ng/µl) diluted into tonsil DNA (200 ng/µl) at 5%, 10%, 25%, 50% and 75% (v/v). Table 8 Peak One 5% IVS-0039 10% IVS-0039 25% IVS-0039 50% IVS-0039 75% IVS-0039 Product Size (bp) D(x) Value RPR Ratio rep 1 196.20 0.2330 6.04 rep 2 195.81 0.1803 5.32 rep 3 195.71 0.1872 6.68 rep 4 196.18 0.2080 6.34 rep 5 195.79 0.1833 6.07 rep 1 196.24 0.3573 9.76 rep 2 196.15 0.3382 9.18 rep 3 195.66 0.2790 8.32 rep 4 196.15 0.3382 9.18 rep 5 195.80 0.2983 7.77 rep 1 196.02 0.3947 8.00 rep 2 196.11 0.3216 6.07 rep 3 195.72 0.4059 9.39 rep 4 196.11 0.3212 6.07 rep 5 195.71 0.4316 10.24 rep 1 196.15 0.2939 4.58 rep 2 195.67 0.3817 7.31 rep 3 195.66 0.4503 9.17 rep 4 196.07 0.3586 5.73 rep 5 195.67 0.4404 8.85 rep 1 196.11 0.2387 3.36 rep 2 195.72 0.3154 5.29 rep 3 195.62 0.4520 9.16 rep 4 196.15 0.2911 4.45 rep 5 195.71 0.3301 5.86 Peak Two Significant? Yes Yes Yes Yes Yes Yes Yes Yes Yes Yes Yes Yes Yes Yes Yes Yes Yes Yes Yes Yes No Yes Yes Yes Yes Product Size (bp) D(x) Value RPR Ratio 194.16 0.1208 2.93 193.75 0.0993 2.65 193.65 0.0962 2.45 194.09 0.0941 2.88 193.77 0.0931 2.70 194.31 0.2115 5.15 193.95 0.1877 4.03 193.62 0.1819 4.24 193.95 0.1877 4.03 193.75 0.1830 4.69 194.16 0.3730 22.2 194.17 0.3568 20.09 193.66 0.3451 17.02 194.17 0.3561 20.09 193.65 0.3482 17.09 194.23 0.4545 630.3 193.69 0.4686 120.4 193.62 0.4672 28.15 194.11 0.4607 32.59 193.69 0.4626 124.4 193.89 0.3532 58.40 193.66 0.4799 71.81 193.57 0.4811 110.9 194.14 0.4387 79.15 193.65 0.4708 78.47 Significant? No No No No No Yes Yes Yes Yes Yes Yes Yes Yes Yes Yes Yes Yes Yes Yes Yes Yes Yes Yes Yes Yes IdentiClone T Cell Receptor Gamma Gene Rearrangement Assay 2.0 – ABI Fluorescence Detection Page 16 of 19 The assay, when performed in combination with the TCRG Algorithm worksheet, was capable of detecting DNA from 6 control cell lines (200 ng/µl) diluted into tonsil DNA (200 ng/µl) at 5% (v/v) and the results are shown in Table 9. Table 9 Peak One 5% IVS-0004 5% IVS-0016 5% IVS-0021 5% IVS-0039 5% PF-382 5% MOLT-13 Peak Two Significant? Product Size (bp) D(x) RPR Ratio Significant? 42.50 Yes 184.69 0.1322 5.61 Yes 0.1193 27.59 Yes 178.39 0.0908 21.13 Yes 184.32 0.1266 22.96 Yes 178.32 0.1041 23.93 Yes rep 4 184.69 0.1200 14.97 Yes 178.78 0.1009 29.82 Yes rep 5 184.36 0.1342 12.12 Yes 178.40 0.1146 32.07 Yes rep 1 169.38 0.1035 115.9 Yes 193.71 0.1016 2.32 No rep 2 169.03 0.0918 159.0 Yes 193.50 0.0857 2.24 No rep 3 168.99 0.0975 55.00 Yes 193.41 0.0791 2.25 No rep 4 169.38 0.1028 100.9 Yes 193.77 0.1041 2.45 No rep 5 169.00 0.0957 55.0 Yes 193.53 0.0944 2.50 No rep 1 187.91 0.1120 7.28 Yes 182.92 0.1239 14.57 Yes rep 2 187.58 0.1003 5.67 Yes 182.53 0.1298 14.23 Yes rep 3 182.50 0.0950 35.5 Yes 187.50 0.1110 5.54 Yes rep 4 187.92 0.1112 6.99 Yes 183.01 0.1238 12.68 Yes rep 5 187.62 0.0978 6.09 Yes 182.67 0.1253 24.69 Yes rep 1 195.97 0.2907 8.46 Yes 193.95 0.1576 3.60 No rep 2 195.70 0.2221 6.74 Yes 193.59 0.1321 3.04 No rep 3 195.56 0.2010 6.86 Yes 193.53 0.1244 2.84 No rep 4 196.01 0.2942 8.05 Yes 194.01 0.1484 3.18 No rep 5 195.71 0.2513 7.53 Yes 193.65 0.1470 3.36 No rep 1 191.84 0.2784 5.77 Yes 158.41 0.3057 123.5 Yes rep 2 191.48 0.2558 5.30 Yes 158.24 0.2739 125.7 Yes rep 3 191.57 0.2418 5.44 Yes 158.15 0.2787 115.1 Yes rep 4 191.84 0.2822 5.68 Yes 158.33 0.2811 118.8 Yes rep 5 191.55 0.2524 5.63 Yes 158.15 0.2883 93.0 Yes rep 1 190.74 0.2147 3.97 No 187.92 0.1292 6.96 Yes rep 2 190.46 0.1806 3.51 No 187.60 0.1081 4.96 Yes rep 3 190.46 0.1731 3.42 No 187.53 0.1039 5.27 Yes rep 4 190.64 0.2132 4.10 Yes 187.93 0.1215 5.69 Yes rep 5 190.46 0.1983 6.19 Yes 187.57 0.1114 5.80 Yes Product Size (bp) D(x) RPR Ratio rep 1 178.87 0.2964 rep 2 184.36 rep 3 Note: 5% IVS-0004 is P/N 4-088-0230, 5% IVS-0016 is P/N 4-088-0950, 5% IVS-0021 is P/N 4-088-1250 and 5% IVS-0039 is P/N 4-088-2330 Using clinical samples, the TCRG V2 assay results were compared to Roche 454 sequencing for the identification T-cell receptor gamma gene rearrangements. For the 454 sequencing, any DNA sequence that was present at levels greater than 5% of the total sequences detected was considered a clonal event. If more than 2 sequences exceeded the 5% threshold, that sample was defined as oligoclonal. The TCRG V2 assay had 100% concordance for the 7 samples that were identified Page 17 of 19 as clonal by sequencing. There was 75% concordance for the 12 samples that were either negative for a clonal event or were oligoclonal. Sample types included peripheral blood, bone marrow, and FFPE samples. It is important to note that the presence or absence of clonal peaks in a clinical sample does not always correlate with actual clinical outcomes. 13. Bibliography 1. Miller, JE, et al., An automated semiquantitative B and T cell clonality assay. Mol. Diag. 1999, 4(2):101-117. 14. Technical and Customer Service Manufacturer Authorized Representative and EU Technical Assistance Invivoscribe Technologies, Inc. 6330 Nancy Ridge Drive, Suite 106 San Diego, California 92121-3230 USA Invivoscribe Technologies, SARL Le Forum – Bât B 515 Avenue de la Tramontane ZI AthéliaIV 13600 La Ciotat, France Phone: Fax: Technical Service: Customer Service: Website: Business Hours: Phone: Fax: Technical Service: Customer Service: Website: Business Hours: +1 858 224 6600 +1 858 224 6601 [email protected] [email protected] www.invivoscribe.com 7:00AM – 5:00PM PST/PDT +33 (0)4 42 01 78 10 +33 (0)4 88 56 22 89 [email protected] [email protected] www.invivoscribe.com 9:00AM – 5:00PM CET/CEST Technical and Customer Service Representatives are available Monday through Friday to answer phone, e-mail, or website inquiries. 15. Legal Notice This is an in vitro diagnostic product and is not available for sale or use within the United States. This product is covered by issued United States Patent Number 7,785,783 and other pending patent applications originating from International Patent Application PCT/AU2004/000625, European Patent Application Number 04732551.9 (16 countries), Brazil Patent Application Number PI0410283.5, Canadian Patent Application Number 2525122, Indian Patent Application Number 5792/DELNP/2005, Japanese Patent Application Number 2006-529437, Mexican Patent Application Number PA/a/2005/012102, Chinese Patent Application Number 200480016603.5, and Korean Patent Application Number 102005-7021561, all of which are licensed exclusively to Invivoscribe Technologies, Inc. Use of this product may require nucleic acid amplification methods such as Polymerase Chain Reaction (PCR). No patent license to use amplification processes or enzymes is conveyed expressly or by implication to the purchaser by the purchase of these products. Purchase of this product includes a limited sublicense for non-commercial uncompensated practice of this technology if and only if the purchaser is registered with IVS as an exclusively non-commercial user of IVS products. No sublicense for such use is granted simply by purchase of these products. To request a form for registration as an exclusively noncommercial product user, to discuss terms for a potential sublicense for broader practice of these methods, or for other questions please contact IVS by email at [email protected], or by telephone at +1 858 224 6600. IdentiClone™ is a trademark of Invivoscribe Technologies, Inc. IdentiClone T Cell Receptor Gamma Gene Rearrangement Assay 2.0 – ABI Fluorescence Detection Page 18 of 19 16. End User License Agreement THIS AGREEMENT MUST BE ACCEPTED BY AN AUTHORIZED REPRESENTATIVE OF THE END USER OF THIS PRODUCT PRIOR TO USING THE TCRG ALGORITHM WORKSHEET EXCEL FILE. BY USING THE TCRG ALGORITHM WORKSHEET EXCEL FILE, YOU ASSERT THAT YOU ARE AN AUTHORIZED REPRESENTATIVE OF THE END USER WITH AUTHORITY TO ENTER INTO THIS AGREEMENT. This End User License Agreement (“EULA”) is made and entered into by and between INVIVOSCRIBE, INC. (“Licensor”) and You (either an individual or a legal entity), the “Licensee,” as defined herein for the licensing and usage of the Licensor’s software. Licensee acknowledges and agrees that Licensee’s right to use the software in any manner shall be controlled by this EULA and that such use shall be strictly in accordance with the terms and conditions of this EULA. 1. GRANT OF LICENSE. Licensor grants to Licensee a non-exclusive, non-transferable, limited license, without right to sublicense, to use the software and any accompanying written materials and any documents or other content embodying information contained within the software (collectively, the “Product”) only for Licensee’s own use. Licensor reserves all rights not expressly granted to Licensee or to Licensee. The limited license granted by this EULA and Licensee’s payment of the license fee give Licensee the right to use the Product only in accordance with the terms of this EULA. This license is not a sale of the original software or any copy. 2. CONFIDENTIALITY. Licensee agrees that the Product is based on and includes one or more proprietary trade secrets, copyrights, patent applications, and/or granted patents (“Intellectual Property”) of Licensor. Possession and use of the Product shall be strictly in accordance with this EULA, and receipt or possession does not convey any rights to divulge, reproduce, or allow others to use the Product outside the terms of this EULA without specific written authorization of Licensor. Licensee agrees not to disclose, publish, translate, release, or distribute copies of the Product or any portion thereof to others outside the terms of this EULA. Licensee may not modify, adapt, translate, reverse engineer, decompile, disassemble, or create derivative works based on any portion of the Product, including any documents or other content produced using the software. 3. OWNERSHIP OF PRODUCT. Title to, ownership of, and all rights and interests in the Product, all copies thereof, and “Intellectual Property” relating thereto, remains at all times vested in Licensor. 4. COPY RESTRICTIONS. The Product is copyrighted. Unauthorized copying or modification of the Product, including software that has been modified, merged, or included with other software, is expressly forbidden. Licensee may be held legally responsible for any copyright infringement that is caused or incurred by Licensee’s failure to abide by the terms of this EULA. 5. TRANSFER RESTRICTIONS. This Product is licensed to Licensee, and may not be transferred to anyone without the prior written consent of Licensor. In no event may Licensee transfer, assign, rent, lease, sell, or otherwise dispose of the Product, or any portion thereof, on a temporary basis, except as expressly provided herein. 6. TERMINATION. This license will be terminated automatically without notice if Licensee fails to comply with any provision of this license. 7. LIMITED WARRANTY. THE PRODUCT, INCLUDING SOFTWARE AND ACCOMPANYING WRITTEN MATERIALS, INCLUDING INSTRUCTIONS FOR USE, ARE PROVIDED “AS IS,” WITHOUT WARRANTY OF ANY KIND, EITHER EXPRESS OR IMPLIED, INCLUDING, BUT NOT LIMITED TO, THE IMPLIED WARRANTIES OF MERCHANTABILITY AND FITNESS FOR A PARTICULAR PURPOSE. LICENSEE BEARS THE ENTIRE RISK OF THE QUALITY AND PERFORMANCE OF THE PRODUCT. 8. LIMITED LIABILITY. IN NO EVENT SHALL LICENSOR BE LIABLE FOR ANY DIRECT, INDIRECT, CONSEQUENTIAL, OR INCIDENTAL DAMAGES, INCLUDING DAMAGES FOR LOSS OF PROFITS, LOSS OF DATA, BUSINESS INTERRUPTION, OR LOSS OF GOODWILL, AND THE LIKE, ARISING OUT OF THE USE OF OR INABILITY TO USE THE PRODUCT, EVEN IF LICENSOR HAS BEEN ADVISED OF THE POSSIBILITY OF SUCH DAMAGES. Because some states do not allow the exclusion or limitation of liability for consequential or incidental damages, the above limitations may not apply to Licensee. 9. GOVERNING LAW. This EULA shall be governed by the laws of the State of California, and Licensee consents to jurisdiction by the state and federal courts sitting in the State of California. 10. COMPLETE AGREEMENT. This EULA is the entire agreement between Licensor and Licensee with respect to the specific terms set forth herein concerning license and warranties of the Product and any other included term or obligation. Page 19 of 19 This EULA replaces all prior understandings and agreements, whether written or oral. This EULA may not be modified unless Licensor and Licensee both assent in writing. 11. SEVERABILITY. If for any reason a court of competent jurisdiction finds any provision or part of any provision of this EULA unenforceable, that part or provision shall be enforced to the maximum extent permitted by law so as to affect the intent of the parties, and the remainder of the EULA shall continue in full force and effect. P/N 280267 Revision B 2012/05 IdentiClone T Cell Receptor Gamma Gene Rearrangement Assay 2.0 – ABI Fluorescence Detection