1
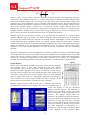
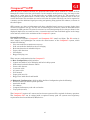
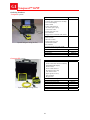
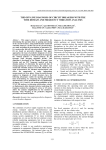
Conquest™ GPR Purpose Conquest™ is a ground penetrating radar (GPR) system for carrying out surveys for the following purposes: Locate reinforcing steel, metallic tendon ducts, and other metallic embedments Measure concrete cover over reinforcement and other embedments Measure the thickness of slabs and pavements Detect internal voids and deterioration Detect embedded cables carrying electrical current Principle Ground penetrating radar (acronym for RAdio Detection And Ranging) is analogous to the ultrasonic pulse-echo technique (see MIRA pg. 96), except that pulses of electromagnetic waves (short radio waves or microwaves) are used instead of stress waves. An antenna that rests on the test surface contains a transmitter and a receiver. The transmitter emits a short pulse of low-energy radio waves. The pulse duration depends on the operating frequency of the antenna. The pulse is detected immediately by the receiver side of the antenna. As the pulse penetrates into the test object, a portion is reflected when it encounters an interface with a different material. The reflected pulse is picked up by the receiving side of the antenna and a voltage signal is created. The signal from the receiver is plotted as a function of time (waveform). By convention, the time axis is plotted in the vertical down direction. By multiplying ½ of the round-trip travel time by the propagation speed in the material, the vertical axis is the depth of the reflecting interface or target. Reflection For materials like concrete the propagation speed of the pulse of electromagnetic energy is given by the following approximate relationship: C C0 (1) Material Portland cement concrete Asphalt‐cement concrete Gravel Sand Rock Water Range of Relative Dielectric Constant 6 to 11 3 to 5 5 to 9 2 to 6 6 to 12 80 where Co is the speed of light in air (≈300 mm/nanosecond) and ε is the relative dielectric constant. The table to the right gives typical values of ε for some construction materials (from ASTM D4748). The dielectric constant is a property of electrical insulators that is related to the extent of charge alignment when the material is placed in an electric field. By definition, the relative dielectric constant of air equals 1. The dielectric constant of concrete and other porous materials increases with increasing internal moisture content. When an electromagnetic pulse travelling through a material is incident on an interface with a material having a different dielectric constant, part of the energy penetrates into the underlying material and part is reflected. The reflection coefficient (RC) at the interface is given approximately by the following equation: 33 Conquest™ GPR RC 1 2 1 2 (2) where ε1 and ε2 are the relative dielectric constants of the top material and underlying material, respectively. The reflection coefficient at a concrete-air interface is different for GPR compared with stress-wave methods (impact-echo or ultrasonic-echo). For stress waves, the reflection is almost 100 % because the acoustic impedance of air is negligible compared with concrete. On the other hand, for GPR the mismatch in dielectric constants at a concrete-air interface is not as drastic, and only about 50 % of the incident energy is reflected at a concrete-air interface. While GPR can detect the presence of voids, it is not as sensitive to the presence of concrete-air interfaces as are stress-wave methods; however, because only a portion of the energy is reflected at a concrete-air interface, the pulse is able to penetrate beyond the interface and “see” underlying features. Metallic objects are not insulators and Eq. (2) is not applicable for reflection at a concrete-metal interface. Metallic objects, or targets, will totally reflect the portion of the pulse that is incident on the target. This makes GPR very effective for locating metallic embedments. On the other hand, strong reflections from embedded metals can obscure weaker reflections from other reflecting interfaces that may be present, and reflections from reinforcing bars may mask signals from greater depths. In addition, if the spacing between reinforcing bars is less than a certain value, which depends on cover and antenna frequency, the pulse is not able to penetrate into the underlying material. The pulse is attenuated as it travels through the test object, and there is a limit to the thickness that can be inspected. For concrete, the depth of penetration depends on the characteristics of the GPR system, the concrete moisture content, and the amount of reinforcement. With increasing moisture content and amount of reinforcement, penetration decreases. For relatively dry unreinforced concrete, the maximum penetration of the pulse produced by a 1-GHz antenna is about 600 mm Signal Display In the early development of GPR, test results obtained as the antenna was scanned along a line were displayed using pen plotters (oscillographs). The recorded waveforms were plotted side by side as shown to the right. The horizontal axis is the antenna location along a scan line and the vertical axis is the round-trip travel time, which can be converted to depth if the wave speed is known. These so called waterfall plots (or wiggle plots) take on a topographic appearance and provide a cross sectional view of the targets within the object. Changes in the pattern of the received signals are relatively easy to identify. Modern computer-based GPR systems use a different approach for displaying the results of a scan along a line. The basic element used to create the display is still the waveform output from the antenna. The principle is illustrated in the figure on the left, which shows a schematic of two reinforcing bars in concrete. The shaded region below the antenna is the influence zone of the antenna. Any target within the influence zone has the potential of being detected. The waveform that is shown represents the antenna signal when the antenna is directly over the first bar. The waveform is transformed to a shaded line, with the degree shading related to the amplitude of the waveform. High 34 Conquest™ GPR positive amplitude is shown as white and high negative amplitude is shown as black. Intermediate amplitudes are shown as varying shades of gray. When the antenna is moved, a new line is generated corresponding to the new antenna position, which is measured by a distance wheel on the antenna. As the antenna is rolled continuously along the surface, a 2-D image is created as shown on the right side of the figure. The image represents the cross section of the test object along the scan line based on the antenna signal. The bands at the top of the image are due to the pulse being received directly by the receiver as the pulse is being emitted. The inverted V patterns represent reflections from the two bars and the dark band in the lower portion of the image is the reflection from the back wall of the test object. The Conquest™ system permits the display to be shown in various shades of colors as well as the traditional grayscale. In addition, a filter can be applied to remove horizontal bands in the display and enhance the image due to reflections from embedded targets Hyperbolic Patterns As shown in the previous figure, reflections from reinforcing bars result in an inverted V pattern in the line-scan image. This pattern occurs because the antenna has a characteristic influence zone and it is capable of "seeing" a reinforcing bar when the center of the antenna is not directly over the bar. When the antenna is offset with respect to the reinforcing bar, the round-trip travel time of the reflection is longer than when the antenna is directly over the bar. As result, the depth of the bar appears to be greater than the actual depth. As shown by the equation in the figure to the right, the apparent depth is a hyperbolic function of the offset. This is the reason for the characteristic inverted Vs due to reflections from reinforcing bars or similar circular metallic targets such as tendon ducts, pipes, conduits, or electrical cable. Power Cable Detector (PCD) A unique feature of the Conquest™ GPR system is a sensor in the antenna to detect electrical current in embedded conductors. While cables and wires will be detected by the GPR as would other metallic objects, the PCD measures the magnetic field that surrounds an electrical conductor carrying alternating current. Thus the Conquest™ is able to discriminate between reinforcing bars and cables carrying electrical current. The PCD operates while the GPR survey is performed and the display of the PCD signal can be toggled ON/OFF. Because the PCD display indicates the variation of the measured magnetic field surrounding the cable, the pattern is affected by the details and relative orientation of the conducting wires. The following are examples of the image of a live electrical cable with the PCD display turned OFF and the display turned ON. With the PCD turned OFF, the GPR image of the cable is shown along with images of reinforcement. With the PCD turned ON, the bars do not appear and the image of the magnetic field surrounding the live cable is shown. PCD OFF PCD ON 35 Conquest™ GPR Wave-Speed Determination The fact that reflections from circular metallic targets have characteristic hyperbolic shapes in a line-scan display can be used to estimate the wave speed in the material, which is needed to convert the round trip travel time to depth. The principle is illustrated in the figure to the left. The equations in the shaded box show that the relationship between travel time t(x) and antenna position (X) depends on the following parameters: (1) the location of the target (Xo) along the scan line; (2) the target depth (Do); and (3) the wave speed (V). The values of the parameters can be estimated by least-squares curve fitting to measured round-trip travel time data. The data points in the graph are travel times obtained by analyzing the waveform records of the line scan. The curve represents the best-fit of the t(x) equation by finding the best-fit values of the three parameters. In this case, the estimated location of the target is 500 mm from the start of the scan, the estimated target depth is 127 mm, and the wave speed is 101 mm/ns. In the Conquest™ GPR system, the user can invoke the built-in software to estimate the wave speed based on automatic analysis of well-defined hyperbolas in the line-scan display. Once the wave speed is estimated, the vertical scale in the image will show the correct depths of the various targets. Line Scans and Grid Scans The Conquest™ GPR system can be operated in two modes: line scan and grid scan. In line-scan mode, data are recorded as the antenna is moved along a line. The cross-section is displayed in real time as the antenna is rolled along the surface. The maximum line-scan length that can be saved is 6.4 m (21 ft.). The optimum image is obtained by scanning in a direction perpendicular to the direction of the bars or tendon ducts to be detected. The line-scan mode is used often for a preliminary investigation to establish the orientation of the targets of interest. The grid scan mode is used to collect line-scan data in two directions using a specific test grid. The Conquest™ system comes with plastic and paper sheets on which a 600 x 600 mm (or 24 x 24 in.) test grid has been marked. A single sheet or multiple sheets are taped to the surface, and the antenna is scanned along the grid, first in one direction and then in the other direction. The computer display assists the user in acquiring data in the correct sequence. 36 Conquest™ GPR After the grid is scanned, the data are processed and results can be viewed as a series of slices through the volume below the grid location. In the example on the previous page, the image in the upper left is a plan view of a 25 mm thick slice at a depth of 100 mm (4 in.). The presence of an orthogonal grid of reinforcement is shown clearly. The other two views represent slices in the two vertical directions. The crosshairs are used to select the slice planes. The data can also be exported to a memory card for additional signal processing and printing using optional PC software, as shown in the above figure. GPR systems can detect reinforcement and other embedded metal targets at greater depths than electrical covermeters (see pg. 42). The size of reinforcing bars, however, cannot be determined with commercial GPR systems Care must be exercised to avoid interpreting the bar images shown in the displayed depth slices as actual bar sizes. A 3 mm bar and a 25 mm would both appear in the image as 30 mm bars, which is the resolution of the Conquest™ system. System Description Two models are available: Conquest™ and Conquest SL™ (small and light). The SL version is more compact and lightweight but retains the main features of the Conquest™ system, which include the following: Line-scan mode for reconnaissance surveys Grid scan mode for detailed on-site 3-D imaging Real-time detection of embedded objects Power cable detection LCD display Rugged carrying case There are two configurations for the Conquest™: (1) Base Configuration, which includes: Control unit with 15 in. LCD display and built-in help system GPR sensor head with distance wheels Power cable detector 5-m sensor cable AC power cable User manual Paper grids (set of 5) Rugged case with wheels and handle (2) Enhanced Configuration, which includes the Base Configuration plus the following: Wireless remote to control system operation Attachable handle PC software Compact flash memory card and card reader Vinyl grids (set of 5) The Conquest™ requires AC current and an inverter system will be required for battery operation. The Conquest SL™ can be ordered with an optional battery pack. All systems meet regulatory requirements for ultra wideband (UWB) devices 37 Conquest™ GPR Ordering Numbers Conquest system System weight: 21 kg (46 lbs) Item Base System: Control unit with built in self help 15 in. LCD display Sensor head Power cable detector AC mains power plug 5-m sensor cable Paper grids (set of 5) User manual Rugged case w/ handle and wheels Enhanced System Base System Wireless remote Vinyl grids (set of 5) Attachable handle PC software Compact flash card and reader Optional items 10-m sensor head cable Extra vinyl grids (set of 5) PC software 3-D visualization software Order # GPR-10 Item SL System Control unit with built in self help TFT-LCD VGA display Sensor head Power cable detector AC mains power plug 5-m Sensor cable Paper grids (set of 5) User manual Rugged case Optional items 12 V battery pack 10-m sensor head cable Extra vinyl grids (set of 5) PC software 3-D visualization software Compact flash card and reader Order # GPRSL-100 GPR-20 GPR-30 GPR-40 GPR-50 GPR-60 Conquest SL system System weight: 3.5 kg (8 lbs) 38 GPRSL-200 GPR-30 GPR-40 GPR-50 GPR-60 GPR-70