1
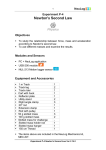
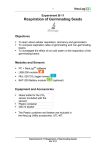
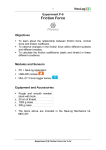
1 Experiment P-1 Falling Objects Objectives To study the motion of falling objects. To learn about the effect of air resistance force. To study motion parameters of a bouncing ball. Modules and Sensors PC + NeuLog application USB-200 module NUL-213 Motion logger sensor Equipment and Accessories Utility stand Right angle clamp Extension clamp Paper baking cup Paper cup Ball Ball pump Basket (or box) The items above (except for the basket) are included in the NeuLog Mechanics kit, MEC-KIT. Experiment P-1 Falling Objects Ver 3.6.10 2 Introduction The position (or displacement) of a moving object is marked by the letter x. The object's velocity is marked by the letter v. The velocity is determined by the ratio between the change in position and the time it took for the object to move. The formula is: v (average) x (final) - x (initial) t (final) - t (initial) When the velocity is constant it can be described as in the formula above. When the velocity changes with time, dividing the change in position by the time will give us the object's average velocity. In order to calculate the object's momentary velocity (v(t)), we divide a very small section of the position change by the time difference. Acceleration is the rate at which an object changes its velocity and it is marked by the letter a. The acceleration is determined by the ratio between the change in velocity and the time it took. The formula is: a (average) v (final) - v (initial) t (final) - t (initial) The formula above describes average acceleration (or constant acceleration). In order to calculate the object's momentary acceleration (a(t)), we divide a very small section of the velocity change by the time difference. These concepts will help you understand the principles of falling objects. One of the classic questions in physics is: If we throw two objects (one with a mass of 100 g and one with a mass of 1000 g) from a tall building, which one will hit the ground first? The intuitive answer is that the heavier object will hit the ground first. 300 years ago, Galileo proved that the two objects will hit the ground together. When an object falls, it always increases its velocity towards the ground. In other words, the object accelerates. The acceleration of all free falling objects is the same. Experiment P-1 Falling Objects Ver 3.6.10 3 This law is correct as long as there is no factor that influences the falling object such as air. The air applies force on the body, thus decreases its velocity towards the ground according to the ratio between the surface area and its weight. The force applied by the air is called air resistance. When the object's surface area is large and its weight is small, the air resistance force will decrease its falling speed. This is why we use a parachute – to lower the falling speed of paratroopers. In this experiment, we will examine falling objects. We will measure the position of a paper cup and a paper baking cup over time and also velocity changes during the fall. When some objects fall, they bounce right up but do not reach the same height in which they were dropped. In the second part of the experiment, we will measure the position, velocity, and acceleration of a bouncing ball over time. Experiment P-1 Falling Objects Ver 3.6.10 4 Procedure Experiment setup 1. Set up the experiment as shown in the picture below. 2. Use the pump to inflate the ball. 3. Attach the motion sensor to the utility stand using the right angle clamp and the extension clamp. The motion sensor should be aimed at the floor. Experiment P-1 Falling Objects Ver 3.6.10 5 Sensor setup 4. Connect the USB-200 module 5. Check that the motion sensor USB-200 module. to the PC. is connected to the Note: The following application functions are explained in short. It is recommended to practice the NeuLog application functions (as described in the user manual) beforehand. 6. Run the NeuLog application and check that the motion sensor is identified. Experiment P-1 Falling Objects Ver 3.6.10 6 Settings 7. Click on the On-line Experiment icon main icon bar. 8. Click on the Sensor's Module box. 9. Click on the Range button. 10. Select the m (meter) radio button to change the sensor's mode to position. 11. Click on the Experiment Setup icon: Experiment duration to 1 second Sampling rate to 20 per second Trigger level 0.3 m (rise) Experiment P-1 Falling Objects Ver 3.6.10 in the NeuLog 7 Testing and measurements Note: The sensor measures the distance from an object by sending a short pulse of sound that we cannot hear (ultrasonic) and measures the time it takes the echo to return. The sound beam angle is approximately 45o. The sensor measures the time of the first received echo. Make sure to remove any items located In the beam range, between the motion sensor and the floor. 45 o Falling path 12. Make sure that the motion sensor is well directed to the floor. Observe that the position (distance from the sensor) values already appear in the sensor’s module box. 13. Check that the measured distance is the height of the sensor from the floor. Set the motion sensor to be around 1 m from the floor. Experiment P-1 Falling Objects Ver 3.6.10 8 14. Take a paper baking cup and let it fall to the floor. Check that it falls in a straight line (observe its fall from above). Note: The shape of the paper baking cup is as follows: This shape balances it while falling. 15. Hold the paper baking cup around 25 cm (0.25 m) below the motion sensor and check that this distance appears in the sensor's module box on the screen. 16. Click on the Run Experiment icon measurement. 17. The message 'Waiting for Trigger' should appear on the screen. to start the We use the trigger function because the experiment duration is very short. 18. Release the paper baking cup and observe its fall to the floor. Experiment P-1 Falling Objects Ver 3.6.10 9 19. Click on the Zoom fit icon . 20. Your graph should be similar to the following: 21. If your graph is not similar to the example graph, check that the paper baking cup moves against the motion sensor all the time and check that there are not any objects that are sending an echo to the sensor. 22. Save your graph. 23. Analyze the graph and identify what happens to the paper baking cup velocity and acceleration during the measurement. 24. To calculate the average velocity click on click on the Select Zone icon and select the part of the graph that represents the paper baking cup velocity. 25. Click on the Show functions icon , and then click on the Motion sensor button on the left of the screen. Experiment P-1 Falling Objects Ver 3.6.10 10 26. Click on the Linear fit button to get the equation. We can see that in this range, the position versus time is a linear graph and it means that the velocity is constant. In our example above, the value of the velocity is: V = 1.018 m/s 27. Click on the Back button on the left of the screen. 28. Click on the Sensor's Module box and then click on the Velocity and Acceleration icon. Experiment P-1 Falling Objects Ver 3.6.10 11 29. Click on the Graph icon graphs are added: . Velocity and acceleration Acceleration Velocity The velocity of the paper baking cup starts from zero, increases and then becomes constant. The graph is not ideal because any small movement of the paper baking cup affects the measured velocity. 30. Click on the Table icon and look for the part which includes the values from the linear part of the graph: Experiment P-1 Falling Objects Ver 3.6.10 12 The velocity values are similar to V = 1.018 m/s (the calculated value). What is the acceleration of the paper baking cup when its velocity is constant? 31. Let us repeat the experiment with the paper cup. The cup has about the same shape as the paper baking cup, but it is much heavier. 32. Click on the Erase experiment icon the graph. 33. Place the paper cup on the starting position and click on the Run Experiment icon in order to erase to start the measurement. 34. Release the paper cup and observe its fall. 35. Click on the Zoom fit icon 36. Your graph should be similar to the following: 37. Save your graph. . Experiment P-1 Falling Objects Ver 3.6.10 13 38. Observe the graph and see that it is not linear. The cup accelerates all the way to the floor. 39. Click on the Sensor's Module box and then click on the Velocity and Acceleration icon. 40. Click on the Graph icon graphs are added: . Velocity and acceleration Acceleration Velocity 41. Save your graph. 42. We can see that the velocity increases in relatively constant rate thus the cup's acceleration is constant. Experiment P-1 Falling Objects Ver 3.6.10 14 43. Move the utility stand to the center of the table. 44. Put the utility stand on a basket or a box. Set up the motion sensor as high as you can. 45. Change the experiment duration to 5 seconds and close the 'Trigger' function. Experiment P-1 Falling Objects Ver 3.6.10 15 47. Let us repeat the experiment with the ball. 48. Hold the ball around 25 cm below the motion sensor. 49. Click on the Run experiment icon 50. Release the ball after one or two seconds and let it bounce. 51. Click on the Zoom fit icon . or alternatively, in order to focus on the desired range, click on the Zoom icon , locate the mouse cursor at a point above the graph and press its left button; keep it pressed and create a rectangle that includes the whole range. 52. Your graph should be similar to the following: 53. You can see the position of the ball over time. The ball can never bounce back to its original height. It loses some of its energy to air resistance, internal forces, and friction between the ball and the table. 54. Click on the Sensor's Module box and then click on the Velocity and Acceleration icon. Experiment P-1 Falling Objects Ver 3.6.10 16 55. Click on the Graph icon graphs are added: . Velocity and acceleration Acceleration Velocity 56. We can see in the graphs that when the ball falls down it gains velocity in a constant rate, then it bounces back up and loses its velocity in the same rate but in the opposite direction; therefore the acceleration is still positive. The acceleration at the moment the ball changes its direction is negative (when the positive direction is downwards). When the ball hits the ground, its velocity quickly turns from positive to negative; this transition happens in an instant, thus the acceleration graph has peaks of negative acceleration every time the ball hits the ground. Experiment P-1 Falling Objects Ver 3.6.10 17 Summary questions 1. Explain why the velocity of the paper baking cup becomes constant and does not increase as the velocity of the paper cup. 2. Air resistance force also acts in nature. Explain how plants use air resistance for seed dispersal. 3. Why can some balls bounce (like the one you used) and others cannot? Experiment P-1 Falling Objects Ver 3.6.10