1
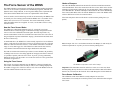
The WDSS hardware
Wireless Dynamics Sensor System
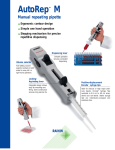
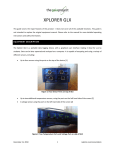
The photo below shows the Wireless Dynamics Sensor System with the key parts
identified.
(Order Code WDSS)
The Wireless Dynamics Sensor System (WDSS) allows you to take data from a
three-axis accelerometer, force sensor, and altimeter, using a Bluetooth® wireless
connection to your computer. It is the perfect tool for dozens of physics and physical
science experiments such as:
• Studying the motion of a dynamics cart on a track. The WDSS can be mounted
on a cart, avoiding the problems associated with wires when using conventional
accelerometers and force sensors.
• Amusement park and playground rides. The WDSS has internal memory and can
collect acceleration and altitude data (to get a profile of the ride) for over 100,000
readings over several minutes. You can store multiple runs before retrieving the
data.
• Studying simple harmonic motion by mounting the WDSS as an oscillating mass
hanging from a spring.
• Studying accelerations of skateboarders or dancers with a WDSS mounted on
them while data are recorded on a nearby computer.
• Studying forces and accelerations during circular motion by mounting the WDSS
on a turntable or bicycle wheel.
In addition, you can use the WDSS to do other traditional experiments that you do
with conventional accelerometers and force sensors. You will find more information
on experiments you can do with the WDSS later in this manual.
• On/Off Switch: The switch controls the power to the WDSS. Turn the switch off
when you are not using the WDSS. Data stored in the WDSS memory will not be
lost when you turn off the power.
• Battery Charging LED: This yellow LED indicates when the WDSS batteries
are being charged. The LED will come on as soon as the WDSS is plugged in
unless the battery is already 100% charged. The LED will go off when the battery
becomes fully charged.
• Power Connector: This connector is used with a 6 V DC, center-negative power
supply, like the one included with the WDSS or with a Vernier LabPro interface.
This power supply is Vernier order code IPS.
2
• Data Collection LED: This LED indicates when data are being collected or
ready to be collected by the WDSS. When the WDSS is communicating with
Logger Pro, and ready to take live data, the Data Collection LED is green. This
LED also gives feedback as you start remote data collection. When remote data
collection starts, the LED will start flashing green. You may also see this LED
flash red. This means that data are being moved around in the WDSS internal
memory. Do not turn off the WDSS power when this LED is flashing red. If you
do remote data collection with triggering, this LED will flash orange while the
WDSS is waiting for a trigger. If there is a problem, this LED will turn steady
red. One example of an error condition would be attempting to collect remote
data when the WDSS memory is full.
• Bluetooth Wireless Communication Status LED: This LED indicates whether
the WDSS is successfully communicating with a computer or LabQuest. When
the WDSS is on, but not connected to any version of Logger Pro, this LED
appears red. When the WDSS is connected to Logger Pro, the Communications
Status LED is green.
• Remote Data Collect Start/Stop button: This button is used to start and stop
data collection during remote data collection only. The button is recessed to
prevent accidental bumping during field use. You need to press firmly on it. To
start remote data collection, press this button. Note that the Data Collection LED
will be steady green when the WDSS is ready to begin remote data collection.
When you press the Remote Data Collect Start/Stop Button, the Data Collection
LED will start flashing. When the WDSS is communicating with a computer and
Logger Pro, the Start/Stop button is not active.
• Accelerometer Direction Diagram: The label on the top of the WDSS has a
diagram indicating the orientation of the three accelerometers. Note that the
x-axis is defined as the long dimension of the WDSS. The acceleration sensing
hardware in the WDSS is located directly below the center of this label.
• Bluetooth Radio antenna (inside the case): The antenna icon on the label
indicates the approximate position of the antenna used for Bluetooth
communication. Since radio waves do not pass through metal, avoid putting
metal objects over the antenna.
3
WDSS Power
The WDSS is normally powered by its internal high-capacity Lithium-Ion battery
pack. The battery pack is designed to provide power for 20 hours of use. The battery
pack should be ready for an hour of use after only about 10 to 15 minutes of
charging. Like all Li-ion batteries, it will undergo a slow self discharge when stored.
If you leave it unpowered for many weeks, the rechargeable batteries may lose much
of their charge.
You can check the status of the WDSS rechargeable batteries when it is connected to
the computer. Click on the icon of the WDSS on the Logger Pro toolbar. The WDSS
Setup Sensors dialog box allows you to turn sensors on and off and also displays the
battery status.
To charge the WDSS Li-ion battery, simply plug in the power supply. The WDSS
power supply provides 6 volt DC, 500 mA to a center-negative connector. The
power supply is the same one used with the Vernier LabPro interface. The main
power switch on the WDSS should be left in the OFF position when charging, unless
it is in use. A full charge (from completely dead batteries) should take about eight
hours. The Battery Charge LED indicates when the WDSS batteries are being
charged. The LED will come on as soon as it is plugged in unless the battery is
already 100% charged. The LED will go off when the battery becomes fully charged.
The battery pack and charging system on the WDSS are very flexible. The batteries
do not need to be fully discharged before you charge them. Also, you do not need to
charge the batteries completely before you use the WDSS.
The WDSS may get slightly warm while charging. When charging it, place it on a
surface that is relatively heat resistant. Charge the WDSS only with the power
supply that was included with the WDSS or with a LabPro power supply. Do not
attempt to charge any other batteries in the WDSS unit.
If you ever need to replace the Li-ion battery and get rid of
the original one, please note that it is designed for recycling.
In the United States, check the web site www.rbrc.org/ for a
list of locations near you where the battery can be recycled.
Other countries have similar recycling programs.
4
Computer Software and Hardware Requirements
®
The Wireless Dynamics Sensor System must be used with Logger Pro version 3.4.5
or newer. The WDSS requires the following computer setup:
• Not Available means a WDSS is present, but it is connected to another nearby
computer. A WDSS that is connected to one computer cannot be seen by other
computers.
Windows: Windows XP, Service Pack 2 or newer is required. For Bluetooth radio
you need a Microsoft-compatible Bluetooth radio nub (also called a dongle) or builtin Bluetooth radio that is Microsoft compatible. The Bluetooth radio transmitter
must be set up to use the Microsoft Bluetooth drivers. If it has been set up for use
with other drivers, the WDSS will not work. You will have to remove those drivers
and install the Microsoft drivers. Note that removing other drivers may cause
problems if you are using the computer with other Bluetooth devices.
Vernier Bluetooth devices have been given easy-to-recognize names to help with the
setup. They are named using physicists’ names followed by a number. For example,
one may be named Newton22.
If your computer does not have built-in Bluetooth, we recommend using a Bluetooth
radio (dongle) that plugs into the USB port of your computer. If you purchase a
Bluetooth dongle for use with this product do not install any software that comes
with it. You have to make sure that the adapter has the "Designed for Microsoft®
Windows® XP" logo. This identifies hardware that meet or exceed certain quality
standards of compatibility with the Microsoft Windows XP operating system.
3. Choose WDSS Setup from the Sensors menu in LabQuest App.
A list of compatible devices can be seen at
http://testedproducts.windowsmarketplace.com/results.aspx?text=bluetooth
Macintosh: OS 10.3 or newer operating system is required. Built-in Bluetooth radio
or a Bluetooth nub that is Macintosh compatible is also required.
Intel processor Macintosh computers (new in 2006) require Logger Pro 3.4.6 or
newer.
LabQuest Software and Hardware Requirements
WDSS requires a LabQuest running version 1.5 or newer along with a supported
Bluetooth radio.
Bluetooth Devices
Bluetooth devices, including the WDSS, connect via radio to the computer. The
range of Bluetooth communication is typically about 10 meters. The maximum
workable distance between your computer and the WDSS will depend on a number
of factors. Any solid object will block some of the waves. Walls and objects
containing metal will greatly reduce or totally block the signal. The range also
depends on the Bluetooth hardware in your computer.
Connecting your Bluetooth WDSS to LabQuest
1. Insert a supported Bluetooth radio to LabQuest.
2. Turn on the WDSS.
4. Tap Scan to look for WDSS devices.
5. Select the desired WDSS by name and tap OK.
6. Select which of the five sensors you want for datacollection and tap OK.
Connecting your Bluetooth WDSS to a Computer
To connect the WDSS to your computer and Logger Pro, follow theses steps:
1. Turn on the WDSS. Note the name on the label of the device.
2. Make sure Bluetooth is activated on your computer. Some computers have
Bluetooth built into them. If that is the case, make sure Bluetooth is turned on.
3. Start Logger Pro.
4. Choose Connect Interface and then Wireless from the Experiment menu. Choose
Scan for Wireless Device. There will be a short delay while Logger Pro attempts
to establish a connection. If the WDSS is not found, try scanning again. A dialog
box will appear showing your WDSS on the list of available devices. Choose
your WDSS device.
5. After you have made the connection, the icon of the WDSS and live readouts
from its sensors will appear on the Logger Pro toolbar. You should have two
green LEDs on the WDSS.
We will use the following terminology to describe how Bluetooth is used when
connecting to the WDSS:
6. If your WDSS does not connect, make sure it has battery power and that it is
within Bluetooth range. If that does not solve the problem, refer to the
Troubleshooting section of this manual.
• Connected means that a particular computer running Logger Pro and the WDSS
have established Bluetooth communication.
Connecting Your Bluetooth WDSS After Initial Setup (computer)
• Available means the WDSS is present, but not connected to any nearby
computer.
5
After you have completed the steps above, and your Bluetooth WDSS is connected
to your computer, the connection process can be somewhat simplified. As long as
Logger Pro is running, it will remember the name of the WDSS devices it has
6
detected. After connecting once, you can simply choose Connect
Interface►Wireless from the Experiment Menu. The name of your WDSS should
appear, and you can choose it. You do not need to scan for WDSS devices again.
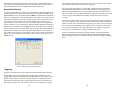
Active Sensors and the Set Up Sensors Dialog Box
By default, the WDSS will initially report force and three accelerometers. The
WDSS has another sensor inside it, the altimeter, which you can activate. Sometimes
you may want to turn off some unneeded sensors. Choose Set Up Sensors from the
Experiments menu and then select your WDSS device. This will display the WDSS
setup dialog that will allow you to turn sensors on or off or change the calibration of
the sensors. Experiment files can be saved with any combination of WDSS sensors
active and with calibrations specified. When you open one of these experiment files,
the appropriate sensor will be made active and calibrated as set in the file.
The WDSS hardware remembers what sensors were last active. If you start it up
later, the same sensors will be on by default.
For force only:
• Reverse direction
If you want Logger Pro to report data from a particular sensor, turn it on by clicking
on its checkbox. If you do not want data reported from the sensor, turn it off. The
Calibrate option lets you completely recalibrate a particular sensor. Details of the
calibration process are given below. The Zero option simply defines the present
reading of the sensor as zero. It is useful for removing offsets from force and
accelerometer readings. The Units selection allows you to change the units used by
the sensor. For example, you can change from metric to English. The Sensor Info
choice provides information on the sensor and how it is calibrated.
The WDSS Setup dialog box also reports other information about the WDSS.
• The WDSS operating system version is displayed and the battery status is listed
below that. The battery status is listed as good, low, or very low.
• Manage Memory Button: This button lets you see what remote data is stored in
the WDSS, and delete it if you want. It also lists the version number of the
WDSS firmware and other information regarding Bluetooth setup.
• Identify button: The Identify button is used to test Bluetooth communication. If
you press this button, the Data Collection LED on the WDSS connected to the
computer will flash. This is designed as a way to find out which WDSS is
connected to a particular computer in a classroom situation with several Wireless
Dynamics Sensor Systems.
Live Data Collection via Bluetooth
The Set Up Sensors dialog for a WDSS
For each sensor of the WDSS, there is a Configure button offering you options, such
as turning on or off the sensor, and selecting calibration options for that sensor. Here
is a complete list of sensor configuration options:
For all sensors:
• Calibrate
• Sensor Info
• Zero
• Units
7
The active sensor readings are displayed on the toolbar once Logger Pro connects
with the WDSS. Click on the Logger Pro Collect button, and data appear on graphs
and data tables. You can use Logger Pro as you would with any other interface, such
as a LabPro or a Go! Link. To change the data-collection rate or length of the
experiment, choose Data Collection from the Experiment menu, or click the
“stopwatch” icon on the toolbar.
Calibration and Zeroing
The sensors of the WDSS generally do not need to be calibrated. If you ever want to
calibrate them, you can. Details are explained in the Force Sensor, Accelerometers,
and Altimeter sections below. For the force and accelerometer sensors, it is often
helpful to zero the sensor before data collection. You do this by choosing Zero from
the Experiment menu or clicking the Zero button on the toolbar. Make sure the
sensor is set up in a zero force or zero acceleration situation before zeroing it. The
zeroing operation subtracts any reading at the time from all future readings. It will
correct for the tilt of the WDSS or for extra weight pulling on the force sensor
(similar to tarring or zeroing a balance).
8
The WDSS has internal flash memory that stores the calibration of each of the
sensors. This allows us to custom calibrate the sensors and it means that if you ever
choose to calibrate a WDSS sensor, you can store that calibration in the WDSS
memory for use in the future.
Remote Data Collection (Computer only)
1. With the WDSS communicating with the computer (live readouts displaying on
the toolbar), set up the data collection. Activate the sensors you want to use. Use
the Data Collection dialog to adjust the length of the experiment, the data
collection rate, and triggering condition to match what you want to be done
remotely.
The WDSS can also be used to take data remotely, far beyond the Bluetooth range of
the computer. Sensor readings are stored in the memory of the WDSS. This kind of
data collection is great for amusement park rides, bungee jumps, and sky dives, as
well as many less extreme situations. The accelerometers record data while the
altimeter of the WDSS provides information on the motion such as a profile of an
amusement park ride.
2. Choose Remote Setup from the Experiment menu, and then choose your WDSS.
This dialog box lets you confirm the experimental setup. If you want to check
how much memory is available in the WDSS, choose Examine Memory. It lists
the number of data points that are available in WDSS memory and lets you delete
data, if necessary. Choose OK when you are ready to exit this dialog box and use
the WDSS for remote data collection.
The WDSS can store about 240,000 individual data points internally. This allows for
many minutes of data collection. You can repeat data collection several times before
retrieving the data from the WDSS. The exact time limit depends on the number of
sensors that are active and the data collection rate.
3. The WDSS disconnects from the computer and the WDSS data no longer appears
on the Logger Pro toolbar. The Bluetooth connection LED on the WDSS will
turn steady red, indicating that the WDSS is no longer communicating with the
computer.
The actual rules for determining the maximum number of readings are complex.
Some of the complexity comes from the fact that the WDSS has two kinds of
memory: temporary memory (RAM) and non-volatile memory (flash RAM). Data
are moved from RAM to flash RAM during or after data collection. Here are some
rough rules on how many points you can collect.
4. To start the remote data collection, press the Remote Data Collection Start/Stop
button on the WDSS. Note that the button is slightly recessed to prevent
accidental pressing. You need to press carefully to make sure you start the data
collection run. The Data Collection LED will change from steady green to
flashing green as data collection begins. (If you have set a triggering condition, it
will flash orange.) If there is a problem, the Data Collection LED will turn steady
red. This probably means that the WDSS data storage memory is full. See
Troubleshooting for other possibilities.
• You can store any one run of about 120,000 total readings, counting each active
sensor reading separately. This means that if you are using three axes of
acceleration measurements, you can take a maximum of about 40,000 readings
per sensor.
• If you are reading the three accelerometers and the altimeter, you can take about
30,000 readings per sensor on one run.
• If you use the force sensor for remote readings, it counts as two sensors (this is
because inside the WDSS, we treat it as two sensors).
• You can always make multiple remote runs until you fill up the 240,000 point
limit, or until you have made 20 remote runs. Even if you set up to collect the full
120,000 readings, you can do that remote run twice and store all that data on the
WDSS.
• If you take runs with fewer readings you can repeat many remote runs.
Here is one example: Taking 15,000 readings with four sensors (not using the force
sensor) is about 60,000 data points, and thus you can do it four times before
retrieving data from the WDSS.
Once you have started remote data collection, it will continue until either:
• The time you specified for the experiment has elapsed.
• You press the Remote Data Collection Start/Stop Button again.
When remote data collection ends, the Data Collection LED will flash red and then
turn steady green, indicating data are stored in the WDSS. During the time that the
Data Collection LED is flashing red, data are being moved around in the memory of
the WDSS, and you should not turn the WDSS off.
Usually after a remote data collection run, the Data Collection LED turns steady
green. This means that you can repeat a remote data collection run. You can repeat
this as often as you like (up to 20 runs), until you fill the memory of the WDSS. For
example, if you are at an amusement park and you have set up for remote data
collection on a particular ride, you can have several students take the ride, one after
another, pressing the Start/Stop Button on the WDSS each time before reconnecting
the WDSS to a computer to retrieve the data.
A typical remote data collection run with the WDSS is done with these steps:
9
10
If the Data Collection LED turns steady red at the end of a run, the WDSS memory
is full, and you cannot take another remote run. Full does not mean all memory is
used, it means that there is not enough memory for the complete run.
Remote Data Retrieval
To retrieve the data with the computer, move the WDSS into Bluetooth range of the
computer and reconnect with it. You can do this by choosing Experiment►Connect
Interface►Wireless or you can choose Remote►Retrieve Remote Data and then the
name of your WDSS device from the Experiment menu. Either way, Logger Pro will
notice that the WDSS has remote data, and you will be asked if you want to retrieve
it. If you choose No, the data will be left on the WDSS, and you can retrieve or
delete them later. If you choose Yes, you are given the choice of retrieving the data
into the current file or into a different file. When the Remote Data Retrieval dialog is
displayed, it lists all data runs on the WDSS. You can check which ones you want to
retrieve and which ones you want to delete. You can retrieve data without deleting it,
so that the data could be retrieved to several different computers. One example of
this would be when a whole class of students wants to retrieve roller coaster data for
analysis on several computers. Delete runs you do not need to use again to free up
WDSS memory.
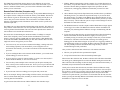
triggered data collection to start when the force exceeds a certain limit. In a similar
way, an acceleration reading can be used for triggering.
Set up triggering using Logger Pro. Select Data Collection from the Experiment
menu or click the Stopwatch icon on the toolbar, then click on the Triggering tab.
Check the Triggering Box at the top left, and then check the On Sensor Value box.
Select the sensor to be used and the condition for triggering. For example, you could
choose to trigger on the WDSS force reading, when the force increases across
1 newton.
You may also set the number of points to be collected before the trigger condition is
met. This is called Pre-trigger data. Data will be collected in a buffer and the proper
number of points will be saved before the triggering event. This is great for studying
the time just before (and making sure you do not miss) a collision. Note that when
you request a large number of pre-trigger data points, you will have to wait until
those points are collected before the trigger condition can be met.
If you do remote data collection with a trigger condition, pressing the Start/Stop
button on the WDSS will cause the Data Collection LED to start flashing orange.
When the trigger condition is met, the Data Collection LED will change to flashing
green.
Retrieve WDSS Remote Data dialog box
Triggering
Triggering is possible both in remote data collection and with live data collection.
Triggered data collection will begin when specified trigger conditions are met.
Triggered data collection with the WDSS is handled the same as it with the Vernier
LabPro or other interfaces. The most common example is in studying collisions.
Typically the experimenter wants to take data quickly but only for the interesting
part of the experiment—the time near the collision. You can do this by setting up
11
12
Hooks or Bumpers
The Force Sensor of the WDSS
The WDSS includes a general-purpose load cell for measuring pushing and pulling
forces. It can be used as a replacement for a hand-held spring scale, mounted on a
dynamics cart to study collisions, or on a ring stand. Many of the experiments that
can be done with the WDSS force sensor are explained later in this manual.
Forces as small as 0.01 N and as large as 50 N can be measured by the WDSS. There
are actually two force sensing systems inside the WDSS. One is for smaller forces
and the other is for forces over 10 newtons. The sensor automatically switches
ranges depending on the forces applied. To a user, it seems that as if there is only
one force sensor.
The end of the WDSS farthest from the On/Off switch has an aluminum extension
with a threaded hole. This is the connection to the force sensor, and it can be used for
mounting various bumpers and hooks for force measurement. It has a standard (US)
#6-32 threaded hole. All hooks and bumpers that thread into the Vernier Dual-Range
Force Sensor (DFS-BTA) will work with the WDSS force sensor. The WDSS comes
with two different accessories for connection here:
Wire hook with plastic lock nut–The hook is used to measure pulling forces (or
pushes).
How the Force Sensor Works
The WDSS uses a dual-beam aluminum load cell. A load cell is an electromechanical device with strain gages in a Wheatstone bridge configuration used to
convert a force into a differential electrical signal. The load cell provides very
accurate measurements of the force with little movement of the force sensor arm. It
has good dynamic response and minimal “ringing” (vibration back and forth) when
the force is taken away.
As mentioned above, the WDSS force sensor actually reports force in two different
ranges, ±10 N and ±50 N. If the force is between ±10 N, then Logger Pro will read
in the force data from the more sensitive, ±10 N channel. If the force is outside the
range of ±10 N, then Logger Pro will read the force data from the less sensitive,
±50 N channel. This transition between ranges should not be noticeable.
The hook connected to the force sensor
Rubber bumper with 1/2" 6-32 aluminum extension–The Bumper is used mostly for
collision experiments or any time you want to measure pushing forces.
The load cell is built with internal stops to reduce, but not eliminate, the possibility
of damage from excessive force being applied. Do not apply more than 75 newtons
(17 pounds) of push or pull to the force sensor. If you do, you may permanently
damage the sensor. You may need to re-zero the force sensor if a force greater than
50 newtons is applied to it.
Using the Force Sensor
Start Logger Pro software and make sure the WDSS is connected. Normally the
force sensor of the WDSS will be on and you will see force readings displayed on
the toolbar of Logger Pro. If the force sensor is off, click on the WDSS icon at the
left of the toolbar and turn on the force sensor.
The WDSS on a dynamics track with a bumper
Important: If the aluminum extension on the force sensor ever comes out, do not
thread anything directly into the #6-32 hole in the load cell that could extend farther
than 0.5 cm (3/16 inch) into the load cell. This could damage the load cell hardware.
Force Sensor Calibration
The calibration stored on the WDSS is usually adequate for most force
measurements. You usually do not need to perform a new calibration when using the
force sensor.
13
14
If you want to improve force readings, there are two steps you can take. The quickest
and easiest step is zeroing the force sensor. This means defining a certain orientation
and condition as zero force and subtracting that amount from all future readings. In
most cases zeroing is all you need to do before force sensor experiments. It adjusts
for any minor offset in the force readings. It also adjusts for the orientation of the
WDSS. The sensor is sensitive enough to measure the weight of its hook or bumper.
This means that the force reading will change, depending on the orientation of the
WDSS. To minimize this effect, simply place the sensor in the orientation in which it
will be used (horizontal or vertical) and choose Zero from the Experiment menu or
use the Zero icon on the toolbar. This will define the current reading as 0 N of force.
If you want to improve the calibration, it is easy to recalibrate. Simply follow the
same procedure that is used in calibrating most Vernier sensors–a two point
calibration. The first point should be with no force applied.
Mounting on a Dynamics Cart
The WDSS was designed for easy mounting on a Vernier or Pasco dynamics cart for
force and acceleration experiments.
Mounting on a Vernier Dynamics Cart
For connection to a Vernier Dynamics cart use a 5/8" × 10-24 binding barrel and a
hex-head bolt (1" × 10-24). First place the bolt head in the middle slot of the top of
the Vernier dynamics cart. Then lower the WDSS on top of the cart and insert the
binding barrel in the large hole of the WDSS. The bolt threads into the binding
barrel. Tighten the binding barrel. The process is shown in the series of photos
below:
1. Orient the WDSS with the hook connected to the force sensor pointed downward.
2. Select Calibrate from the Experiment menu and then select the force sensor.
3. Remove all force from the sensor.
4. Enter 0 as the first known force.
5. Now hang a 1 kilogram mass from the hook on the force sensor.
6. Enter the weight of this mass (9.8 newtons) as the second known force.
We recommend calibrating with a 1 kg mass because of the way the force sensor
works. As mentioned above, the WDSS force sensor really is two force measurement
systems in one package. One measures forces in the range of ±10 N range, and the
other measures force in the ± 50 N range. The 1 kg (9.8 newton) mass is a good
compromise for calibrating both of these force sensors together.
Mounting on a Pasco Dynamics Cart
First insert a 10-24 x 1" hex head screw through the plastic mounting plate. Next use
two 10-32 flat head x1/2" long screws to mount the plastic mounting plate to the
Pasco cart. Finally, use the barrel bolt to hold the WDSS down on the mounting
plate. The process is shown in the series of photos below:
Note that since the calibration process happens in the vertical orientation, if you are
going to then take force readings in a horizontal (or other non-vertical) orientation,
you should zero the force sensor after calibration, with it held in the proper
orientation.
Mounting an Extra Mass on Top of the WDSS
For many dynamics cart experiments, it is helpful to be able to add mass to the cart.
The WDSS has been designed to allow you to mount one or two Vernier 0.5 kg
masses to the cart. These masses are Vernier order code MASS. The photos below
show one mass being installed. If a second mass is added, place it next to the first
one, toward the force sensor. It is bolted down in the same way.
The hole for bolting down the mass is not symmetrical to the mass. If the mass does
not appear to be square to the WDSS, flip the mass over to correct the problem.
15
16
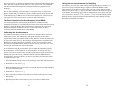
The Accelerometers of the WDSS
Important: Do not use any screw that would intrude more than 8 mm into the
threaded hole. This could damage the internal electronics of the WDSS.
Mounting on a Ring Stand
The WDSS is designed to be mounted on a ring stand to allow force measurements
in several different ways. Use the rod included with the WDSS (9.5 mm diameter
rod, 15 cm long, with a hole in it). Insert a thumb screw through the hole in the rod
and into the end of the WDSS nearest the power connector. Tighten the thumb
screw.
Another option is to use the aluminum rod threaded into the end of the WDSS
nearest the power switch and then attach this rod to a ring stand via a right-angle
clamp.
The WDSS on a bicycle for studying acceleration
The WDSS has a three-axis –6 to +6 g accelerometer inside it. Using Logger Pro,
you can graph any of these components or calculate the magnitude of the net
acceleration. The accelerometer can be used for a wide variety of experiments and
demonstrations, both inside and outside the classroom. In the lab, the accelerometers
can be used on dynamic carts to study Newton’s laws and on rotating objects to
study centripetal acceleration. Outside the lab there are lots of possibilities from
automobiles to playground equipment to amusement parks. Many examples of
acceleration experiments are included in the Experiments section of this manual,
below.
How the Accelerometers Work
WDSS with thumb screw
WDSS with rod threaded into the end
Hand Held Force Sensor Experiments
The aluminum rod can be used as a convenient handle for holding the WDSS in your
hand for some experiments. Avoid large off-axis forces which may damage the
WDSS or the rod.
17
The Wireless Dynamics System contains a three-axis linear accelerometer with an
electronic interface. The accelerometers are fabricated at right angles to each other.
Each acceleration sensing unit is micro-machined in silicon with very thin “fingers”
carved in silicon. These fingers flex when accelerated. They are arranged like the
plates of capacitors. As the fingers flex, the capacitance changes. A circuit on the IC
monitors the capacitance and converts it into a voltage signal. The signal is filtered
and sent to the analog input of the WDSS. The acceleration reading from each of the
three axes is transmitted by Bluetooth to the computer or stored internally during
remote data collection.
Accelerations are normally measured in either meters per second per second (m/s2)
or g’s. One g is the acceleration due to gravity at the Earth’s surface, or 9.8 m/s2.
This accelerometer will measure accelerations in the range of –6 g (–59 m/s2) to +6 g
(+59 m/s2) in each direction. This is a range of accelerations that the human body
handles well. Many collisions will produce much larger accelerations. In fact,
dropping the WDSS on a hard surface from even a few centimeters can produce
accelerations of a hundred g’s. The WDSS accelerometers will not be damaged by
accelerations up to 3000 g’s.
18
The accelerometers are capable of measuring both dynamic acceleration (e.g.,
vibrations) and static acceleration (e.g., gravity). The three accelerometers are
orthogonal with the directions labeled with X, Y, or Z, shown on the label on the top
of the WDSS.
To see if your accelerometers are properly calibrated, test their response to gravity.
When an axis arrow is held horizontally, that channel should very close to zero.
When the arrow representing an axis points upward, that channel should read
+9.8 m/s2. When an axis arrow points down, that channel should read –9.8 m/s2.
Note that when the WDSS is in a horizontal orientation, at rest, with the label
upward, the x- and y-axes are horizontal and should read near zero. The z-axis
accelerometer should read +9.8 m/s2. Try it by monitoring the accelerometer
readings on the Logger Pro toolbar. You may have to activate some of the
accelerometers by clicking on the WDSS icon on the toolbar first.
Logger Pro software can be used to create a “New Column” to calculate the square
root of the sum of the squares of the accelerations. This is the magnitude of the net
acceleration vector, sometimes called scalar acceleration. Many WDSS experiment
files have been set up with a calculated column for net acceleration. One example
you can open is at Experiment Files/Probes and Sensors/WDSS/Scalar Acceleration.
If you want to set it up yourself, choose New Calculated Column from the Data
menu. Name the column “Net Acceleration” and define it with the equation sqrt("XAxis Acceleration"^2+"Y-Axis Acceleration"^2+"Z-Axis Acceleration"^2). When
creating an equation like this, click on the Functions and Columns buttons rather
than typing in the names and functions.
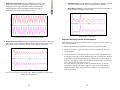
This scalar acceleration, or magnitude of the vector acceleration, is often very useful
to monitor and graph. It will be equal to 9.8 m/s2 when the WDSS has no
acceleration and zero when it is in free fall. The orientation of the WDSS does not
matter. To understand how this works, try holding the WDSS in your hand and very
slowly rotate it about the x-axis as you collect data with Logger Pro. The y and z
components of acceleration change drastically. The graphs on the next page show the
result. The top graph has all three components of acceleration. The lower graph has
the net acceleration (the square root of the sum of the squares of the accelerations).
Notice that the net acceleration stays near 9.8 m/s2 throughout all of this rotation.
Slowly rotating the WDSS and monitoring acceleration
Another way to see how the accelerometers work and how the net acceleration
column is useful is to gently toss the WDSS in the air. For safety, first remove the
hook or bumper from the force sensor. The most fragile part of the WDSS is the load
cell. If you drop the WDSS and it lands on anything attached to the load cell of the
force sensor, it may easily be damaged. One good way to protect your WDSS is to
tether it with a string attached to the large eyehook in the end. Tie the string so that
even if the WDSS is dropped, it cannot fall to the floor.
Below is a graph of the three accelerations with a separate graph of net acceleration.
Note that all three acceleration readings and the net acceleration go to near zero
during free fall, even though the WDSS unit is changing its orientation as it falls.
Acceleration components and net acceleration during a toss
19
20
The accelerometers are designed to measure small accelerations with minimal signal
noise. The noise is typically on the order of 0.1 m/s2 peak to peak. The calibration
will drift somewhat with temperature, but this should not be a problem in most
situations.
The use and terminology of accelerometers is a frequent source of confusion for
physics students and even instructors. We have added a special section near the end
of this manual to try to address some of these issues. Please refer to the Frequently
Asked Questions about Accelerometers section for more information.
Using Just one Accelerometer for Simplicity
For simplicity, and especially when working with beginning physics students, it is
often best to study acceleration along a single axis. Mount the WDSS so that a
particular axis is in the direction of the motion you want to study and turn off the
other accelerometers. The x, y, and z accelerometer directions are labeled on the top
of the WDSS. The following experiments or demonstrations can be done using just
one accelerometer: Newton’s 2nd law, Newton’s 3rd law, acceleration during simple
harmonic motion, study acceleration of the human body while jumping vertically,
and studying centripetal acceleration.
The Exact Location of the Accelerometer in the WDSS
For certain experiments, such as placing the WDSS on a turntable to study
centripetal acceleration, it is important to know where the actual acceleration sensing
hardware is inside the WDSS. The accelerometer is right below the center of the
diagram showing the orientation of the axes of the accelerometer, 24 mm or
0.95 inches above the bottom surface of the WDSS.
Calibrating the Accelerometers
The WDSS accelerometers usually do not need to be calibrated. These sensors are
calibrated at Vernier. This calibration is quite good. Since the accelerometers
respond to the Earth’s gravitational field, you may choose to zero the accelerometers
to remove this offset. However, this zeroing is only helpful if the orientation of the
WDSS does not change during the experiment. To zero any accelerometer select
Zero from the Experiment menu, and then select the sensors you want to zero. You
can also just click on the Zero icon on the toolbar.
If you find that zeroing the accelerometer does not adjust the calibration properly,
the accelerometer can be calibrated. As mentioned above, accelerometers sense
gravity as well as acceleration. This can make interpreting acceleration results more
difficult, but it provides an easy calibration method. Since the WDSS has three
accelerometers, when you calibrate, you may need to do the procedure three times.
To calibrate for the x-axis,
1. Orient the WDSS with the x-axis arrow pointing up for the first calibration point.
2. Define this as +9.8 m/s2 or +1 g.
3. Rotate the WDSS so the arrow for the x-axis points down and use this reading for
the second calibration point.
4. Define this as –9.8 m/s2 or –1 g.
5. The accelerometer will then read 0 with no acceleration when this axis is held
horizontally.
6. Repeat this procedure for the other two axes if you want to calibrate them.
21
22
If you take the WDSS to a very different altitude, turn its power off and back on one
time before collecting remote data. This allows the WDSS electronics to adjust for
the large change in air pressure. For example, if you set up the WDSS for remote
data collection in your lab at approximately sea level and take it into the mountains
for data collection cycle the power off and on before collecting data. Any remote
data collection setup will be maintained during this process.
The Altimeter of the WDSS
The Altimeter of the WDSS measures the air pressure reading and converts it to an
altitude. The range of readings is ± 300 meters, or ±1000 ft. The WDSS reports
relative altitude (in meters or feet) and returns that data to the computer. We say
“relative altitude” because the altitude setting is defined as zero at the point where
the data collection begins. The reason is that you often want to study the change in
altitude during the experiment. Examples would include roller coaster rides, sky
dives, or bungee jumps. The absolute altitude is not important.
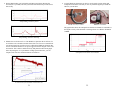
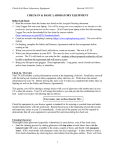
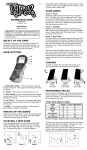
In most situations, the altimeter is used along with other WDSS sensors. A typical
use of the altimeter of the WDSS is an amusement park ride. The graphs below show
the idea. Notice that the two graphs have identical time axes. The top graph provides
a vertical profile of the roller coaster ride. Three accelerometers and an altimeter
were used in this experiment. A video taken during data collection can be viewed in
the Sample Movies folder of Logger Pro 3. These data and the associated movie
were collected by Clarence Bakken. For more information on data collection in an
amusement park visit our web site, www.vernier.com/cmat/datapark.html. Also, you
may want to download the Data Collection at the Amusement Park manual from the
same site.
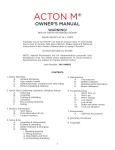
Because air pressure changes very slowly with altitude, the WDSS altimeter is
intended to measure altitude changes of 5 meters or more. Smaller altitude changes
may not be recorded reliably.
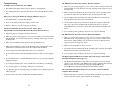
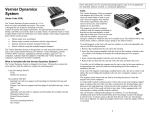
The graph below shows WDSS altimeter data taken in a car while driving in the
mountains.
Data collected on the Vortex
How the Altimeter Works
This graph shows that the WDSS reports relative altitude, that is, altitude relative to
the start of data collection. In this case, the car was dropping into a valley between
two mountain passes, so the altitudes are negative.
The WDSS contains a temperature-compensated pressure sensor that is factory
calibrated. The sensor is similar to the one in the Vernier Barometer (BAR-BTA). It
has a membrane that flexes as the air pressure changes. This sensor is set up for
absolute pressure measurement, so one side of the membrane is a vacuum. The
sensor produces an output voltage that varies in a linear way with absolute pressure.
It includes circuitry to minimize errors caused by changes in temperature. Even so,
we are measuring extremely small changes in air pressure and best results will be
obtained when the unit is kept at a near constant temperature during data collection.
23
24
Driving in the mountains with a WDSS reading altitude
The electronics inside the WDSS translate the pressure reading to an altitude based
on the approximation that, for relatively small ranges of altitudes, the pressure varies
in a linear way with altitude. (A pressure vs. altitude graph is nearly linear, with a
negative slope, over a relatively narrow range of altitudes.) Since the WDSS
altimeter always zeros the altitude at the start of data collection, the only calibration
factor is the ratio of altitude to pressure (slope of the altitude-pressure graph).
The altimeter will also have a very small response to acceleration because of inertial
forces acting on the pressure sensor's diaphragm. If you accelerate the WDSS
vigorously, you may notice a very small apparent change in altitude. Similarly, the
sensitive pressure sensor may respond to air currents. This effect is also very small.
Calibration of the WDSS altimeter is almost never necessary, but if you choose to do
it, it can be handled in one of two ways:
Experiments Using the Wireless
Dynamics Sensor System
Experiments Using Just the Force Sensor
Collision Experiments
Studying forces during collisions of a dynamics cart with a rigid object yields
information about how forces vary during collisions. You can vary the bumper or the
material between the rigid object and the force sensor bumper. It is a great way to
show students that making the collision take more time decreases the peak force.
This is an important concept, since it explains a lot of things about automobile safety
(air bags, crumple zones, etc.).
1. Manually change the slope of the calibration equation:
a.
b.
c.
d.
e.
Click on WDSS icon on the toolbar.
Click on the Configure button for the altimeter in the WDSS Setup
dialog and a pull-down menu is displayed.
Click on Calibrate.
Click on the Equation tab of the Sensor Settings Dialog.
Change the slope of the calibration equation.
or
2. Do a normal two-point calibration, moving the WDSS to two different known
altitudes. Since you will probably need to change the altitude more than
Bluetooth communications will allow with your computer staying in one spot,
this will probably involve moving your computer up and down also. It would
work best with a laptop computer.
Impulse-momentum setup using Vernier Dynamics Track Adapter (DTA-DFS)
Mount the WDSS on the dynamics cart and have the cart collide with a stationary
object at the end of the track. Another option is to screw a vertical rod through the
hole in the WDSS and mount the WDSS stationary at the end of the track and have
the moving cart collide with it. Collide a dynamics cart into the stationary collision
bumper on the WDSS.
A classic experiment is to compare the integral of the force vs. time graph with the
change in momentum of the cart undergoing this type of collision. If you get a graph
of force vs. time in Logger Pro, you can use the Integral tool to do the integration.
For studying the momentum change, you need to get the speed before and after the
collision. There are three ways to make these measurements:
1. Use Logger Pro, a WDSS, a LabPro, and a Motion Detector to make graphs of
the motion and the force at the same time. Examine the velocity vs. time graph to
determine the speeds before and after the collision.
2. Use Logger Pro, a WDSS, and a Go!Motion to make graphs of the motion and
the force at the same time. Examine the velocity vs. time graph to determine the
speeds before and after the collision.
3. Use a photogate connected to a LabPro, a WDSS, and Logger Pro software to
25
26
measure the speed of the cart before and after the collision. Place an index card
or business card on the cart to act as a “flag” going through the photogate.
Logger Pro can measure the time it takes the flag to go through the photogate
before and after the collision.
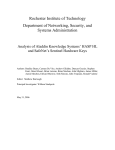
The sample graph below shows the results of colliding a dynamics cart with a WDSS
mounted on it with fixed object using magnetic repulsion bumpers. The speeds
before and after the collision were measured with a photogate.
Experiments Using the Force Sensor and Accelerometers
• Newton’s Second Law: Mount the WDSS on a dynamics cart. Push and pull
horizontally on the force sensor hook of the WDSS. Measure the acceleration of
the system as the force is varied. This experimental procedure is in the Vernier
Physics with Computers lab manual. The sample graphs below were made with a
WDSS on a Vernier Dynamics cart. The top two graphs are of acceleration and
force. The bottom graph is the same data with a graph of force vs. acceleration.
Note that the data are nicely linear and has a slope of the 0.605 newtons/m/s2 or
0.605 kg. This agrees nicely with the measured mass of the cart and WDSS, in
this case, 0.614 kg.
Impulse-momentum experiment done with the WDSS
Studying Friction
Use the force sensor of the WDSS as a replacement for a spring scale. Run a string
from the hook on the WDSS force sensor to a block of wood. Measure the force as
you pull the block along a horizontal surface. You can investigate how frictional
force is affected by surface area and type of surface. You can also compare static and
dynamic friction.
Force and acceleration graphs
Force vs. acceleration with linear fit
Studying friction with the WDSS
27
28
• Simple Harmonic Motion: Hang the WDSS from its force sensor
at the end of spring so that it undergoes simple harmonic motion.
Graph both the force applied and the vertical acceleration. The
sample graph below shows the WDSS mounted at the end of a
spring and used to study simple harmonic motion.
•
Pendulum Motion: Use the WDSS as a pendulum bob, hanging it from the
force sensor. Graph both the force on the string and acceleration
•
Model Bungee Jumper: Connect the WDSS to an elastic cord and drop it
so that it moves as a bungee jumper would.
Model bungee jumper data
Acceleration and force in simple harmonic motion
• Damped Harmonic Motion: Hang the WDSS from its force sensor at the end of
rubber band so that it undergoes harmonic motion. The motion will lose energy
more quickly and you get a quick change in the amplitude of the motion.
Experiments Using Just the Accelerometers
Some of the best and simplest experiments involve using just one accelerometer at a
time. Examples include:
• Measure the acceleration of dynamics carts as they roll down an incline.
• Measure acceleration vs. time on elevators, remote-controlled cars, bicycles, or
real automobiles.
• Use the accelerometer to measure the tilt of an object. Since each channel of the
accelerometer senses the vertical component of gravity, its reading will change as
its orientation is changed from horizontal to vertical. You can measure angles to
the nearest few degrees. Create a new calculated column in Logger Pro defined
as tilt = asin (X-Axis Acceleration / 9.8) or
tilt = atan (X-Axis Acceleration / Z-Axis Acceleration). Be sure to zero the
accelerometer carefully. Note that Logger Pro can be set for either degrees or
radians as units for angles and trigonometric calculation. Check Settings For…
under the File menu.
Force and acceleration graphs made with a WDSS suspended by a rubber band
(Damped harmonic motion)
29
30
• Put the WDSS under your belt buckle and jump up and down. Measure the
acceleration as you land, both with your knees flexed and with your knees held
more stiffly.
• A single WDSS accelerometer can also be used to study circular motion and
centripetal acceleration. Note that you can vary both the angular speed and the
radius as you take data.
Jump landing with knees flexed
WDSS on a bicycle wheel
WDSS on a turntable
The graph below shows the centripetal acceleration of a WDSS on a turntable as
the angular velocity of the turntable was changed from 33.3 RPM to 45 RPM to
78 RPM.
Jump landing with knees held stiff
• Measure the acceleration of a car. The WDSS was placed on the level floor of a
car with the x-axis oriented toward the front of the car. The car was started from
rest and accelerated to 65 mi/hr (29.1m/s) while taking WDSS acceleration data.
A New Calculated Column was set up in Logger Pro for the integral of the x-axis
acceleration. This column is labeled Velocity and plotted on the bottom graph
below. By noting the car’s speedometer reading at particular times, you can
compare with velocities calculated from the acceleration.
Centripetal acceleration on a turntable
Acceleration of an automatic transmission car
31
32
• Mount the WDSS on a free-turning wheel, such as a bicycle wheel. Give it a spin
and allow it to slow gradually. Below are graphs made this way with the wheel
mounted with its axis vertical and horizontal.
Centripetal acceleration (wheel horizontal)
Centripetal acceleration (wheel vertical)
Other experiments require more than one accelerometer to allow you to measure the
net acceleration. The easiest way to set this up is to open the file Experiment
Files/Probes and Sensors/WDSS/Scalar Acceleration. The alternative is to choose
New Calculated Column from the Data Menu to set up a new column that is the
square root of the sum of the squares of the accelerometer readings.
WDSS freefall experiment
• Pendulum experiments: Below is a sample graph made using the WDSS mounted
on a pendulum. The pendulum is swinging through a wide angle, so the angle of
the accelerometer is changing significantly. A simple, one-dimensional
accelerometer would not have done this job as well. In this case, only the net
acceleration is graphed. (See the April 1995 issue of The Physics Teacher for a
discussion of the acceleration of a pendulum.)
• Free fall experiments: Place some packing material (packing peanut, foam, etc.)
in a large box. Simply start data collection and drop the WDSS into the box. All
three accelerometer readings and the net acceleration drop to near zero during the
fall.
Acceleration of the WDSS used as a pendulum bob
33
34
• Experiment with accelerations of skateboarders and dancers by having them
perform with the WDSS in their pocket or mounted in a Vernier Data Vest. The
graph below shows one example. A movie of the skateboarder taking this data is
included in the Sample Movies folder of Logger Pro 3.4.5. It is in the folder
Halfpipe.
The following data were collected using a WDSS at Paramount's Great America
(CA) ride Psycho Mouse by Clarence Bakken. Remote data collection was used.
Acceleration on a halfpipe
Data collected on the Psycho Mouse
Sometimes amusement park data can be collected “live”, that is, with the WDSS
communicating with the computer during the data collection. Here is an example.
The ride Celebration Swings, at the Paramount Great America park in California, is
small enough that during the entire ride the WDSS can be picked up by the
computer. Here is the resulting graph.
One of the great ways to use the WDSS is on amusement park rides. Here are some
examples using just the WDSS accelerometers. Later in this manual, we will have
examples where the altimeter is also used.
Celebration Swings data collected live
The same idea can be used for playground rides, skateboarders, dancers and other
motions that stay within Bluetooth range of the computer.
35
36
Experiments Using the Accelerometers and the Altimeter
The WDSS was specifically designed for remote data collection at amusement parks
and playgrounds. The three accelerometers can record accelerations in all directions
and, if needed, Logger Pro can calculate the net acceleration. The altimeter of the
WDSS can be used to record position on the ride. In general, it does not matter that
the altitude be calibrated well; the altitude data provides a profile of the ride, so you
can know when the high and low points on the ride occurred.
Many amusement park rides do not require more than one accelerometer. Rides
where the motion is in one direction are the easiest for students to understand. Data
from the Drop Zone amusement park ride, in California is shown below. This a ride
in which the passengers are dropped a distance of about 60 meters and then
decelerated by Lenz’s Law magnetic forces on the falling cars. They always move in
the vertical direction. The lower graph below shows the acceleration. The top graph
is an altitude profile of the motion (data taken with an altimeter).
The WDSS can store over 200,000 data points internally. Using a 25 samples per
second collection rate and three accelerometer readings and altitude readings, this
allows for a full forty minutes of data collection. You can do multiple runs before
retrieving the data.
Set up the WDSS for data collection.
1. With the WDSS connected to your computer and running Logger Pro, set up the
experiment length, data collection rate, and active sensors. You may want to open
a file we have prepared for amusement park ride data collection. It is found in the
Experiment Files folder/Probes and Sensors/WDSS, and it is named Amusement
Park. It sets up the WDSS to record three axes of acceleration and altitude, and it
calculates net acceleration. Data collection rate is set for 25 points per second for
120 seconds
2. To prepare the WDSS for remote data collection choose /Setup/Remote Data
Collection from the Experiment menu.
Data from the Drop Zone amusement park ride
3. Select the WDSS. This gives you a dialog box that displays the data collection
parameters so you can confirm that they are set properly.
4. Click OK to set up the WDSS for remote data collection. Note that the Bluetooth
connection LED turns red indicating the WDSS is disconnected and ready to start
remote data collection.
5. At the start of the ride, press the start data collection button on the WDSS. Note
that the Data Collection LED starts blinking green.
6. When the ride ends, press the data collection button again. (If you do not press
this button a second time, data collection will continue until the specified time for
the experiment has expired or the memory of the WDSS is full).
37
38
WDSS Specifications:
Dimensions: 12.1 cm × 5.3 cm × 3.9 cm
Mass: about 200 g, depending on battery type used and attachments
Batteries: 3.7 volts, 1600–1800 mAh, Li-Ion rechargeable with safety circuit.
Lithium ion batteries self-discharge about 5 to 10% of its stored charge each
month until approximately half depleted. This is normal. Disconnecting the
battery will not change this.
Operating Current: 35–50 mA @ DC minimum 3.2V
Nominal Charging Current: @350 mA
DC input, Rating: DC 6V 500mA maximum
(Max. with battery charging with unit operating)
Bluetooth radio frequency: approximately 2.45 GHz (2450 MHz), with frequency
hopping, so the frequency is not fixed
Wireless Range: Up to 10 meters (30 ft) with no obstruction.
Number of WDSS devices that can be connected to one computer: 7
WDSS Parts List
The WDSS package comes with the following accessory parts:
Force Sensor
Range: ±50 N
Frequency Response: 0–100 Hz
Resolution: 0.006 N (< 10 N)
0.03 N (> 10 N)
AC adapter
Accelerometers
(for each of the three accelerometers):
Range: –50 to +50 m/s2
Resolution: 0.04 m/s2
Frequency Response (maximum): 100 Hz
Temperature Range: –40 to +85ºC
Altimeter
Altitude change range: ±200 m (1000 ft)
Sensitivity: 1 meter
Combined linearity and hysteresis: typical ±0.1% full scale, maximum ±0.5% full
scale
Response time: 0.5 second
Bumper with 1/2" aluminum extender
Small eye hook with plastic lock nut
1/4-20 × 3/4" diameter eye w/ plastic lock nutis
3/8" diameter aluminum rod cross drilled 1/4" at one end
1/4-20 thumb screw (for above)
Mounting plate (for Pasco dynamics cart)
(2) 10-32 × 1/2" flat head screws for above
(2) 10-24 × 1" hex head screw
10-24 × 5/8" binding barrel
Manual (this document)
39
40
Troubleshooting:
My WDSS does not show when I use my Windows computer.
No LEDs come on when I turn on the WDSS.
• Make sure you are using Logger Pro 3.4.5 or newer. Older versions will not work
with the WDSS. You can check the version by choosing About Logger Pro from
the Help menu.
• The WDSS rechargeable batteries may be dead. Try charging them.
• The rechargeable battery pack may have been removed from the WDSS. Check
this.
When I try to charge the WDSS, the charging LED does not go on.
• The WDSS battery is already fully charged.
• Power is not getting to the power supply. Test the outlet.
• Battery is defective or of the wrong type or missing.
My Wireless Dynamics System does not show when I choose
Experiment►Connect Interface►Wireless►Scan for Wireless Devices
• Repeat the process of trying to connect several times.
• Make sure you are using Logger Pro 3.4.5 or newer. Older versions will not work
with the WDSS. You can check the version by choosing About Logger Pro from
the Help menu.
• Make sure your WDSS is fully charged or has good batteries in it.
• Make sure the WDSS is in range for the Bluetooth radio communication. There
should not be a metallic barrier between the computer and the WDSS.
• If you computer has built-in Bluetooth, make sure it is turned on.
• If your computer has a removable Bluetooth transceiver, make sure it is plugged
in.
• If your computer has a removable Bluetooth transceiver, try removing it and then
plugging it in again.
• Make sure are using Windows XP, Service Pack 2 or a newer operating system.
If you have an older version of Windows XP, you must upgrade to SP2.
• If your computer has built-in Bluetooth, make sure Bluetooth is turned on by
using the Bluetooth section of the Control Panels.
• Use the Control Panels to try to learn more about your computer’s Bluetooth
radio. Try to find out if your Bluetooth uses Microsoft drivers. If you have
WidCOMM drivers, you need to remove them and install Microsoft Bluetooth
drivers.
• If you continue to have problems, check out www.vernier.com/bthelp
My WDSS does not show when I use my Macintosh computer.
• Make sure you are using Logger Pro 3.4.5 or newer. If you are using an Intel
Macintosh, make sure you are using Logger Pro 3.4.6 or newer. Older versions
will not work with the WDSS. You can check the version by choosing About
Logger Pro from the Logger Pro menu.
• Make sure are using Mac OS 10.3.9 or newer.
• If your Mac has built-in Bluetooth, make sure Bluetooth is turned on by using the
Bluetooth section of the System Preferences.
• If you continue to have problems, check out www.vernier.com/bthelp.
The Data Collection LED turns red when while I am trying to collect remote
data while taking data with Logger Pro:
• Try exiting Logger Pro, restarting it, and then try reconnecting.
• The WDSS internal memory is full. There is not enough room to store the run
you have set up. Reconnect your WDSS to the computer and delete data from the
WDSS memory. You can do this by choosing Experiment►Set Up
Sensors►Wireless and then clicking the Examine Memory button.
• Try quitting Logger Pro and rebooting your computer, then restarting Logger Pro
and trying again.
The Connection LED turns red when I try to start live (connected with the
computer) data collection:
• See the specific notes below for Windows and Macintosh users.
• WDSS failed self test. It may have a serious hardware problem. Try turning it off
and on. If that fails, contact Vernier Software & Technology.
• Try turning the WDSS power switch off and back on and then try reconnecting.
41
42
My acceleration (or force) data seem strange when I am studying a high
frequency signal.
• If the frequency of the changes in the force or acceleration signals is higher than
your sampling rate, you may well be seeing the results of aliasing. The best
example of aliasing is seen in movies or television where a car wheel appears to
be turning backwards. This happens because the camera only looks at the wheel
at certain times and it happens to catch the wheel a bit earlier in its rotation each
time around. Another example would be a pendulum where you "sample" just
slightly faster than one period. You'd keep seeing it a bit earlier in its cycle
making it look like it was moving very slowly in the opposite direction than it is
really moving. If you happened to sample it at an interval exactly the same as its
period, you could even be tricked into thinking the pendulum bob was standing
still. Similar affects can show up when you sample with the WDSS at a rate
which is slower than or only a little faster than the frequency of the force or
acceleration signal, you may get a confusing result. Try increasing the sampling
rate.
There is some strange noise on my acceleration signals.
• Be sure to check to see if the noise is real, perhaps caused by a motor vibration or
the wobble of a wheel on a rolling cart. Toy cars with hard wheels on a rough
surface can generate great amounts of acceleration noise. Sometimes the noise
from surface irregularities is larger than the acceleration being studied. Large,
soft wheels are better than small hard wheels and heavier vehicles will tend run
more smoothly as well. Fans can be another huge source of acceleration noise
(vibration). Sometimes these noise signals can be aliased to show up in
unexpected ways.
Frequently Asked Questions about Accelerometers
Q: Why do to the accelerometer readings change when I rotate the WDSS?
A: Since the accelerometers are sensitive to both acceleration and the Earth’s
gravitational field, interpreting accelerometer measurements is complex. A useful
model for understanding accelerometer measurements is a spring-based scale
with a reference mass (or object) attached to it. If the scale is pointing upward
(the usual orientation for such a device) the weight of the mass causes the spring
to compress, and you get a non-zero reading. If you were to turn the scale upside
down, the spring will be extended, instead of compressed, and we you would get
a reading of the opposite sign. If you turn the scale so it points sideways, and
keep it motionless, then the spring will just be at its relaxed length, and the
reading will be zero. If you accelerated the scale toward the mass, then the spring
would compress. If you accelerated the scale away, and the spring would stretch.
43
In each case the scale is reading a value corresponding to the normal force on the
mass. This reading can be made relative by dividing out the mass, giving units of
N/kg, which is the same as m/s2.
The accelerometer measurements can be interpreted in exactly this way.
Q: What does a WDSS accelerometer really measure?
A: It measures normal force per unit mass. Most people prefer that the measurement
be in m/s2 or g-factor units that are used in this manual.
Note that it’s not the net force per unit mass (which would be acceleration), but it
is the normal force per unit mass, where “normal” is in the direction of that
particular accelerometer. The normal forces in all three directions make up the
sum of all contact forces on the sensor body.
This unusual quantity of normal force per unit mass corresponds with what a
rider on a roller coaster feels during the turns. This interpretation is useful even
for the scalar total acceleration value, which is 9.8 N/kg for a three-axis
accelerometer at rest, zero when in free fall, and greater than 9.8 when making a
corner.
This normal force interpretation works even for a one-axis accelerometer being
accelerated in a horizontal direction. The reading is non-zero as the device is
accelerated, as the test mass inside the device has to have a force applied to
accelerate it. That's just a normal force that happens to be horizontal.
When discussing the accelerometer reading, we can call it the Normal Force per
Unit Mass, with units of N/kg.
There is an interesting article on acceleration and how one perceives acceleration
in the April 2006 The Physics Teacher. The article is “Why Do We Feel
Weightless in Free Fall?” by Pirooz Mohazzabi.
Q: I thought the accelerometer measured acceleration!
A: Here we are being very careful to not call something an acceleration when it is
not a kinematic acceleration. For example, an "acceleration" of 9.8 m/s2 for an
object that remains at rest is clearly a problematic interpretation, yet that’s what
the accelerometer reads.
44
You can correct the accelerometer reading to get a true acceleration by adding the
component of the gravitational acceleration field along the direction of the sensor
arrow. For example, if the axis of the accelerometer is pointing upward, then the
gravitational component is –9.8 m/s2. The Accelerometer reads 9.8 m/s2 when the
arrow is upward and the device is at rest. By adding –9.8 m/s2, we get zero,
which is the correct acceleration. If the arrow is horizontal, then the reading is
zero, but the gravitational component is zero, and we still have zero for the true
acceleration.
Q: What about g-force measurements?
A: We avoid the term g-force because the quantity doesn’t have units of force.
Instead, g-factor can be used as a simplified label for Normal Force per Unit
Mass in axis labels and discussions. The g-factor is dimensionless. The
g-factor is then 1 for an object sitting at rest on a table, zero in free fall, etc.
Proper Use
This product is to be used for educational or personal (e.g., hobbyist) purposes only.
It is not appropriate for industrial, medical, research, or commercial applications.
FCC Statement
This device is tested to comply with part 15 of the FCC rules.
Operation is subject to the following two conditions: (1) this device may not cause
interference, and (2) this device must accept any interference, including interference
that may cause undesired operation of the device.)
Trademarks and Copyrights
Logger Pro, Vernier LabPro, Go! Link and other marks shown are our registered
trademarks in the United States. The Bluetooth word mark and logos are owned by
the Bluetooth SIG, Inc. and any use of such marks by [licensee name] is under
license.
All other marks not owned by us that appear herein are the property of their
respective owners, who may or may not be affiliated with, connected to, or
sponsored by us.
Warranty
Vernier warrants the Wireless Dynamics Sensor System (except the battery) to be
free from defects in materials and workmanship for a period of five years from the
date of shipment to the customer. The lithium-ion battery is guaranteed for a period
of one year. This warranty does not cover damage to the product caused by abuse or
improper use.
45
46
Vernier Software & Technology
13979 S.W. Millikan Way • Beaverton, OR 97005-2886
Toll Free (888) 837-6437 • (503) 277-2299 • FAX (503) 277-2440
[email protected] • www.vernier.com
Rev. 3/30/2011
Printed on recycled paper.
47
48