1
UNIVERSIDAD CARLOS III DE
MADRID
ESCUELA POLITÉCNICA SUPERIOR
APPLICATION DEVELOPMENT FOR
MANAGING AND MONITORING A DATA
CENTRE
Degree in Computer Engineering
Bachelor Thesis
Author: Aitor Pérez Cedrés
Reviewer: Óscar Pérez Alonso.
Date: 15/6/2012
APPLICATION DEVELOPMENT FOR MANAGING AND
MONITORING A DATA CENTRE
Acknowledgements
In first place, I want to thank my family for their support not only during the project
but for my whole life. I would have reached so far without them.
I want to thank my project tutor, Óscar Pérez for his support in this project; I really
have learnt a lot from him and from the people in the Lab; they have made this project
possible.
I have special thanks also for my friend Sergio Casillas; he was my first friend here
in Madrid and I think we will be friends for really long.
I have special thanks also to Adrián Cáceres, the first canary friend I found here in
Madrid. We have learnt many things from each other, and I think we have supported a
lot each other.
Special thanks to Miguel Pagán, one of my first’s friends as well in Madrid; although
he is in the dark path of Telematic Engineering, he is a much appreciated friend.
Aitor Pérez Cedrés
Página 2 de 97
APPLICATION DEVELOPMENT FOR MANAGING AND
MONITORING A DATA CENTRE
Abstract
This document is a Bachelor Thesis report. In this document we can find an analysis
about the problem, a proposed solution and an evaluation about a coded prototype.
The name of the project is Application Development for Managing and Monitoring a
Data Centre. This project is an application for easing a common task in Lab of
Computer Science and Engineering Department.
The main problem of managing the Data Centre is the need of being physically
present there; for instance, to take note of room temperature, a person has to go
physically there to check out a thermometer. Moreover, maintaining an inventory can
become a hard problem because many people, from different departments, have their
machines and equipment there in the centre; there are two options then for maintaining
an inventory:
Ask to every department what machines have them in the centre.
Go inside the centre and count the machines one by one
The usage of a web application can solve those problems. Since web applications are
queried from a web browser; and nowadays everybody has a web browser integrated in
his/her Operating System; we can query the status of the centre from our office, without
having to being physically there.
An important advantage also is the possibility of connecting sensors and other
applications, so we can enhance our application with already implemented features; for
instance, connecting our application to an LDAP login server. Moreover, since this is a
web application, there is no need of a client installation; only a web browser is required.
In our case, it must have support for HTML 5 and CSS 3. In addition, web technologies
nowadays have many libraries for almost any task; for example, to display data in
charts. With this feature, we can visualize historical or statistical data.
Aitor Pérez Cedrés
Página 3 de 97
APPLICATION DEVELOPMENT FOR MANAGING AND
MONITORING A DATA CENTRE
Index
LIST OF FIGURES .........................................................................................................6
LIST OF TABLES ...........................................................................................................7
1
INTRODUCTION ....................................................................................................8
1.1
1.2
1.3
1.4
2
MOTIVATION ............................................................................................................8
OBJECTIVES .............................................................................................................. 9
DEFINITIONS, ACRONYMS AND ABBREVIATIONS ....................................................... 9
OVERVIEW .............................................................................................................. 10
STATE OF THE ART ............................................................................................ 12
2.1 WHAT IS A DATA CENTRE?..................................................................................... 12
2.2 WEB TECHNOLOGIES .............................................................................................. 14
2.2.1 Web Servers ....................................................................................................16
2.2.2 Web Browsers .................................................................................................17
2.2.3 Databases........................................................................................................18
2.2.3.1
2.2.3.2
2.2.4
2.2.4.1
2.2.4.2
2.2.4.3
2.2.4.4
2.2.4.5
2.3
3
Standard SQL .................................................................................................................................... 18
MySQL .............................................................................................................................................. 19
Programming languages................................................................................. 19
JavaScript .......................................................................................................................................... 19
AJAX ................................................................................................................................................. 21
PHP .................................................................................................................................................... 21
XML .................................................................................................................................................. 22
JSON ................................................................................................................................................. 22
ESA STANDARD .....................................................................................................23
PROBLEM STATEMENT .................................................................................... 24
3.1 MAIN CAPABILITIES AND CONSTRAINTS ..................................................................24
3.1 ASSUMPTIONS AND DEPENDENCIES.........................................................................25
3.1.1 User characteristics ........................................................................................ 25
3.1.2 Software development methodology ............................................................... 26
3.2 USER REQUIREMENTS ............................................................................................. 27
3.2.1 Functional requirements ................................................................................. 27
3.2.2 Non-Functional requirements .........................................................................33
3.3 SOFTWARE REQUIREMENTS .................................................................................... 34
3.3.1 Functional requirements ................................................................................. 34
3.3.2 Traceability matrix ......................................................................................... 42
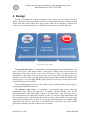
4
DESIGN ................................................................................................................... 43
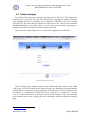
4.1 INITIAL PROTOTYPE ................................................................................................ 45
4.2 ARCHITECTURAL DESIGN ....................................................................................... 52
4.3 DETAILED DESIGN ..................................................................................................54
4.3.1 Presentation layer ........................................................................................... 54
4.3.2 Logic Layer .....................................................................................................59
4.4 DATABASE DESIGN .................................................................................................62
4.4.1 Query example ................................................................................................ 66
5
RESULTS AND EVALUATION ..........................................................................67
Aitor Pérez Cedrés
Página 4 de 97
APPLICATION DEVELOPMENT FOR MANAGING AND
MONITORING A DATA CENTRE
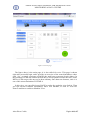
5.1 USER MANUAL .......................................................................................................67
5.1.1 Sections ...........................................................................................................67
5.1.1.1
5.1.1.2
5.1.1.3
5.1.1.4
5.1.1.5
5.1.1.6
5.1.1.7
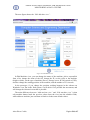
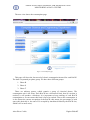
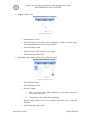
Main Page .......................................................................................................................................... 67
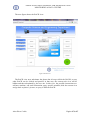
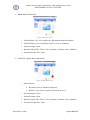
RACK view ....................................................................................................................................... 69
Edit a RACK...................................................................................................................................... 71
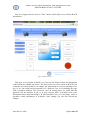
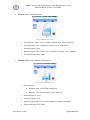
Detailed machine view....................................................................................................................... 72
Edit a machine ................................................................................................................................... 73
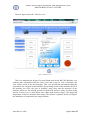
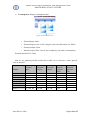
Consumption view ............................................................................................................................. 74
Consumption graphs .......................................................................................................................... 75
5.2 SOFTWARE TRANSFER ............................................................................................ 76
5.3 SOFTWARE PROJECT MANAGEMENT.......................................................................78
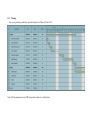
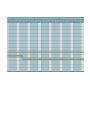
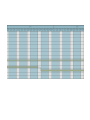
5.3.1 Software estimation......................................................................................... 78
5.3.2 Planning ..........................................................................................................88
5.3.3 Budget ............................................................................................................. 92
6
6.1
6.2
6.3
CONCLUSIONS .....................................................................................................94
TECHNICAL KNOWLEDGE ........................................................................................ 94
PERSONAL CONCLUSIONS ....................................................................................... 95
FUTURE WORK .......................................................................................................96
Aitor Pérez Cedrés
Página 5 de 97
APPLICATION DEVELOPMENT FOR MANAGING AND
MONITORING A DATA CENTRE
List of Figures
Figure 1 Marenostrum datacentre ...................................................................................... 12
Figure 2 Definition of URI ................................................................................................ 15
Figure 3 Apache logo ........................................................................................................ 16
Figure 4 Top Languages in Github projects ...................................................................... 20
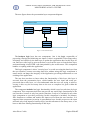
Figure 5 Three layer model ............................................................................................... 43
Figure 6 Initial prototype login .......................................................................................... 45
Figure 7 Overview page .................................................................................................... 46
Figure 8 RACK view ......................................................................................................... 47
Figure 9 Edit RACK view ................................................................................................. 48
Figure 10 Machine view .................................................................................................... 49
Figure 11 Edit Machine View ........................................................................................... 50
Figure 12 Consumption page............................................................................................. 51
Figure 13 Presentation layer .............................................................................................. 53
Figure 14 Business Logic layer ......................................................................................... 54
Figure 15 Detailed Presentation layer ............................................................................... 56
Figure 16 Detailed Business Logic layer ........................................................................... 61
Figure 17 Relational model ............................................................................................... 62
Figure 18 Wardrobe relation ............................................................................................. 63
Figure 19 Phase relation .................................................................................................... 64
Figure 20 Consumption record relation ............................................................................. 65
Figure 21 Machine relation................................................................................................ 65
Figure 22 Overview page as admin ................................................................................... 68
Figure 23 RACK view as admin ....................................................................................... 69
Figure 24 Edit RACK view ............................................................................................... 71
Figure 25 Machine view as admin ..................................................................................... 72
Figure 26 Edit machine view ............................................................................................. 73
Figure 27 Consumption page ............................................................................................. 74
Figure 28 Historical consumption ..................................................................................... 75
Figure 29 Directory tree .................................................................................................... 77
Figure 30 Login screen ...................................................................................................... 79
Figure 31 Overview screen ................................................................................................ 79
Figure 32 Rack view screen............................................................................................... 80
Figure 33 Rack edition screen ........................................................................................... 80
Figure 34 Machine view screen ......................................................................................... 81
Figure 35 Machine edition screen ..................................................................................... 81
Figure 36 Consumption screen .......................................................................................... 82
Figure 37 COCOMO SLOC input ..................................................................................... 83
Figure 38 COCOMO scale factors .................................................................................... 84
Figure 39 COCOMO Schedule ......................................................................................... 84
Figure 40 COCOMO Correction factors ........................................................................... 85
Figure 41 COCOMO Final result ...................................................................................... 86
Aitor Pérez Cedrés
Página 6 de 97
APPLICATION DEVELOPMENT FOR MANAGING AND
MONITORING A DATA CENTRE
List of tables
Table 1 Requirement template........................................................................................... 27
Table 2 FR_1001 Sign Up ................................................................................................. 27
Table 3 FR_1002 Login ..................................................................................................... 28
Table 4 FR_1003 Change password .................................................................................. 28
Table 5 FR_1004 Delete account ...................................................................................... 29
Table 6 FR_1005 Room distribution ................................................................................. 29
Table 7 FR_1006 Room temperature ................................................................................ 30
Table 8 FR_1007 Consumption......................................................................................... 30
Table 9 FR_1008 Query RACK information .................................................................... 31
Table 10 FR_1009 Manage RACK ................................................................................... 31
Table 11 FR_1010 Assign responsible .............................................................................. 32
Table 12 FR_1011 User management ............................................................................... 32
Table 13 FR_1012 Consumption statistics ........................................................................ 33
Table 14 N-FR_0001 Secure connection .......................................................................... 33
Table 15 SR Login form .................................................................................................... 34
Table 16 SR Check if logged ............................................................................................. 34
Table 17 SR User management view ................................................................................ 35
Table 18 SR Overview page .............................................................................................. 35
Table 19 SR Phases distribution ........................................................................................ 36
Table 20 SR Temperature sensor....................................................................................... 36
Table 21 SR Consumption page ........................................................................................ 37
Table 22 SR Add new record ............................................................................................ 37
Table 23 SR RACK view .................................................................................................. 38
Table 24 SR Edit RACK view........................................................................................... 38
Table 25 SR Delete RACK................................................................................................ 39
Table 26 SR Add machine ................................................................................................. 39
Table 27 SR Query machine .............................................................................................. 40
Table 28 SR Consumption statistics .................................................................................. 40
Table 29 SR TLS encryption ............................................................................................. 41
Table 30 Traceability matrix UR-S ................................................................................... 42
Table 31 Summary function points ................................................................................... 82
Table 32 PHP lines of code ............................................................................................... 87
Table 33 JavaScript lines of code ...................................................................................... 87
Table 34 Budget: Human resources .................................................................................. 92
Table 35 Budget: Software costs ....................................................................................... 92
Table 36 Budget: Hardware costs ...................................................................................... 92
Table 37 Budget: Consumables ......................................................................................... 93
Table 38 Budget: Summary ............................................................................................... 93
Table 39 Budget: Final Budget .......................................................................................... 93
Aitor Pérez Cedrés
Página 7 de 97
APPLICATION DEVELOPMENT FOR MANAGING AND
MONITORING A DATA CENTRE
1 Introduction
This document describes the process of analysis, development and evaluation of a
Bachelor Thesis. In this document are included requirements and design of the project,
as well as an evaluation of the solution achieved; before start describing the analysis
process, a brief introduction is provided about the motivation to realize this project, its
main objectives, and the state of art of used technologies.
The next two chapters will describe the motivation of the project and its main
objectives. The next chapters are only a short introduction to the problem; the details
stating the problem itself are located in Section 3.
1.1 Motivation
The project was born from the need of monitoring the data centre; this data center
belongs to Computer Science and Engineering Department of University Carlos III, but
it is managed by the Lab of the Computer Department.
The common tasks related to the centre are, among others, checking the temperature
of the room, consulting historic data about electric consumption and checking the
machines inside a particular arbitrary RACK.
Actually, anyone who wants to carry out these tasks has to be physically present at
the data centre. The application is meant to change this and also to ease the tasks related
to managing and monitoring the data centre.
We want to apply the knowledge acquired from User Interfaces course to design,
implement and evaluate a web application prototype for easing the tasks mentioned
above. A web prototype also implies a client-server architecture, which leads to
communication between computers and the usage of protocols to communicate them.
Almost any application needs a source of data to work; in our case is not different.
We have to store information about the application, about the users, etc; so we will have
to analyze the problem using the knowledge acquired in Files and Databases course to
abstract the problem and design a solution.
The application is aimed to be used by several people, so we need an access control.
We will apply the knowledge from Security Engineering course to analyze the
problem, the environment and the potential users of the application to design a solution
which achieves an acceptable tradeoff between usability and security.
Since this is a Bachelor Thesis, we have to follow some software development
technique to analyze, design, track, develop, evaluate and track the state of the project.
For this purpose, we will apply the learning from Software Development Projects
Management.
Aitor Pérez Cedrés
Página 8 de 97
APPLICATION DEVELOPMENT FOR MANAGING AND
MONITORING A DATA CENTRE
1.2 Objectives
The objectives for this project are to analyze, design and implement a web
application for managing and monitoring the data center of Computer Department. The
application has to ease the frequent tasks, such as query room temperature.
The application has to allow external users, who are (mostly) the owners of the
machines within the center, to check the state of their machines and the temperature of
the room.
We want to apply a software engineering process so we can ensure the quality and
the security of the application. Moreover, we want to build an usable, intuitive and rich
application, easy to use, not only by the people from the department, but by any people
related to the data centre.
The main objective is to build a web application prototype; we want the application
to work via web. The application has to be web based because we noticed about the
recent impact and increase of popularity of web applications; and we want to research a
bit on this area, increasing the knowledge learnt in the Bachelor and, at the same time,
applying what we already know to develop an effective solution to a real problem.
We want also to relate the project with the branch of Computer Engineer; so we want
to interconnect this application with another external system and put them to work
together.
Summarizing; the main objectives of the project are:
Design and build a web application prototype
Apply a software engineering methodology in a real world problem
Connect our prototype with other systems and put them to work together
1.3 Definitions, acronyms and abbreviations
RACK – Metallic support for storing computers. It is used in Data Centers.
RACK Unit (U) – Standardized measure for RACKs. A RACK usually has a
size of 42 U.
JS – JavaScript.
KVM – Keyboard Video Mode switch.
W3C – Word Wide Web Consortium.
HTML – Hyper Text Markup Language.
URI – Uniform Resource Identifier.
SQL – Structured Query Language.
Aitor Pérez Cedrés
Página 9 de 97
APPLICATION DEVELOPMENT FOR MANAGING AND
MONITORING A DATA CENTRE
DML – Data Manipulation Language.
DDL – Data Definition Language.
GitHub – Web portal for storing your repositories using the tool Git.
Git – Control version system created by Linus Torvald.
AJAX – Asynchronous Javascript And XML.
XML – Extensible Markup Language.
SOAP – Simple Object Access Protocol.
HTTP – Hyper Text Transfer Protocol.
XMPP – Extensible Messaging and Presence Protocol.
JSON – JavaScript Object Notation.
ESA – European Space Agency.
CSS – Cascading Style Sheet.
SSL – Secure Socket Layer.
TLS – Transport Layer Security.
XSS – Cross Site Scripting.
RDBMS – Relational Database Management System.
LDAP – Lightweight Directory Access Protocol.
COCOMO – Constructive Const Model.
IIS – Internet Information Services.
PDF – Portable Document Format.
CD – Compact Disc.
XSS: Cross Site Scripting.
1.4 Overview
This document presents the required documentation for developing, understanding
and evaluating the project. It starts introducing the project objectives and motivation,
setting its main objectives. Then we define the state of the art, where it is introduced the
definition of a Data Centre, its main characteristics, its common problems and typical
solutions to solve them; it is also defined some specific language used in Data Centers
(e.g. RACK)
Aitor Pérez Cedrés
Página 10 de 97
APPLICATION DEVELOPMENT FOR MANAGING AND
MONITORING A DATA CENTRE
In the document are defined as well what web technologies are. In some way, it
shows the evolution of technologies involved there; for instance, the first protocol to
share information through Internet, and how an extension of this protocol, adding
security features, was born from the need of protecting information and provide
confidentiality.
The document also introduces what programming languages will be used, its main
characteristics and why have we chosen them. It is also mentioned what software
methodology will be followed to analyze, design and evaluate the project. Then it is
stated the problem; in that section are defined the user characteristics, user and software
requirements, as well as a traceability matrix.
Then it is presented a proposed design for the application; an initial prototype is also
included to provide a preview of how the application will looks like. There is included a
special chapter for database design because the use of that technology is critical for our
application.
After the design, there is an evaluation of a prototype developed during the project.
In that section it is included a user manual, describing the basic functionality of the
prototype as an administrator user; it is also included some chapters to define the
requirements to deploy the application prototype; and a chapter about project
management, where is included an effort estimation and a budget.
Aitor Pérez Cedrés
Página 11 de 97
APPLICATION DEVELOPMENT FOR MANAGING AND
MONITORING A DATA CENTRE
2 State of the art
In the next chapters we will define briefly what is a data center; what are web
technologies and the actual state of this technology. We consider important starting with
those definitions because our application is focused for working for that environment.
Web technologies are important to define since we are building a web prototype.
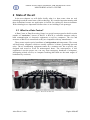
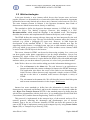
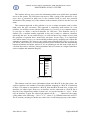
2.1 What is a Data Centre?
A Data Centre or Data Processing Centre is a special room prepared to hold a certain
number of "wardrobes", known as RACK. A RACK is a metallic structure ready to
hold communication or electronic equipment, as well as computers. The size and
measures of RACKs is normalized so they are compatible with any manufacturer.
These rooms require special conditions of refrigeration and temperature. The rooms
will hold many computers which are usually operative 24 hours, generating heat and
noise. The air conditioning equipment cannot be a common one, but a specific one,
designed and tested to work 24 uninterrupted hours. The consequences, if this
equipment is not the proper one, can vary from emergency shutdown of computers,
interrupting critical services, to computer breaking (hard disk are the main targets of
breakdown by overheat).
Figure 1 Marenostrum datacentre
Aitor Pérez Cedrés
Página 12 de 97
APPLICATION DEVELOPMENT FOR MANAGING AND
MONITORING A DATA CENTRE
This kind of centre requires a temperature sensor and monitoring tools to track the
changes of the room. This sensor is required because the equipment in the centre is
sensible to overheat; and it is also a valuable asset to protect. The most common way to
integrate this sensor in the room is by installing it in a machine; a machine the
administrators own and have full access; then automate the machine to send notification
(e.g. send an e-mail) and in case it is desired, take a response to protect the machine
from the overheat.
A Data Centre also requires a data network, because the machines held within are
not supposed to be accessed manually. An essential requirement is to be able to access
the machines remotely. Moreover, this data network is also used to retrieve data from
the machines without being physically present in the room.
The room also needs an electrical network to supply the RACKs, which supply
electrical power to each machine within a RACK. This electrical network is not
unlimited, and it is often to set electric consumption limit to each machine, so it cannot
left the other ones with less power supply, because it would provoke voltage drop,
harming the rest of the equipment.
The machines (in our case, computers) are not the typical desktop/laptop computers,
but special ones with more hardware features. The main difference between traditional
machines and these ones is the form. The machines in a RACK are wider and lower
than traditional. The size measure in these environments is different; it follows a
standard, which sets the RACK unit (U) as 482.6 mm (19 inches) wide and 1.75 inches
of height. The common RACK has around 41U or 42U; however they can have more or
even less Us.
In a few words, these rooms contain a certain number of RACKs, which hold
computers or electric equipment; these machines usually provide services, but they can
also be specific purpose and used in research, taking advantage of their computation
potency. The machines can be freely placed in the RACK as long as it has enough
potency to supply enough power to every machine.
The most common machines that can be placed into a RACK are:
Servers. A specific purpose machine.
Switch KVM. It is a device to control many computers with a single monitor,
keyboard and mouse.
UPS. Uninterrupted Power Supply; it is a device with a battery to provide
power supply in case of voltage drop. It is an emergency device to give some
grace time to the servers to finish their tasks and shutdown cleanly if the
power supply runs out.
Switch. It is a device to interconnect machines, so they can share information
between them.
Aitor Pérez Cedrés
Página 13 de 97
APPLICATION DEVELOPMENT FOR MANAGING AND
MONITORING A DATA CENTRE
2.2 Web technologies
In the past decades, a new element called Internet has become more and more
popular. Internet is a decentralized set of networks which share information, documents
and media (but not only limited only to those ones). Internet is also known as The Web.
The most common element in Internet is the hypertext document; these kinds of
documents are linked between them, directly or indirectly.
The standard to define the hypertext document structure is HTML 4.01; HTML
stands for Hyper Text Markup Language. However, this standard is a W3C
Recommendation; which means the language is not standard at all. This language
describes the structure and complements the content with objects, such as images.
The HTML defines the content with tags, these tags are later interpreted by the web
browser and rendered in a page. The tags can define the structure where the content is
enclosed (e.g. define a paragraph for some text). However, in 2004 began the
development of the standard HTML 5. This new standard includes new tags for
supporting media features; it included some tags just to add semantic meaning (e.g.
footer tag, which is not present in HTML 4.01); it also includes canvas element, which
is used to render 2D/3D objects in the browser.
The canvas element in HTML can be used to draw using scripting. In a canvas you
can draw graphs, make photo composition or just do simple animations. Canvas was
introduced by Apple in Mac OS X Dashboard and later implemented in Safari and
Chrome. This element consists of a region defined in HTML code with width and height
attributes where you can draw whatever you want; it is a low level, procedural model.
In the Web we have two clear entities taking part in the information sharing process:
The web browser in the client side: The web browser is an application to
interpret and render the content exchanged in Internet, the HTML documents.
This application also allows the access of the links to new documents. The
initial versions of these browsers only supported a simple version of HTML,
and due to the lack of a standard, some browser developed a variety of
HTML.
The web server in the server side. We will describe in more detail this point
and its most common alternatives in the chapter Web Servers.
Internet has some standards to define how the information is shared, how the
documents are structured and defined; and how the elements are referenced within the
web. Hyper Text Transfer Protocol (HTTP) is the standard protocol to define how the
web browser communicates with the web server. It is a standard from World Wide Web
Consortium (W3C) and the Internet Engineering Task Force (IETF).
This protocol is implemented in the transport layer of the network and uses IP as
network protocol; inheriting his advantages and disadvantages (use of insecure
channel). Due to the use of insecure channels, HTTPS was born; this protocol is the
same as HTTP but it implements security in the transport layer by using Secure Socket
Layer (SSL) or Transport Layer Security (TLS).
Aitor Pérez Cedrés
Página 14 de 97
APPLICATION DEVELOPMENT FOR MANAGING AND
MONITORING A DATA CENTRE
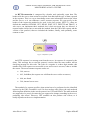
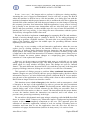
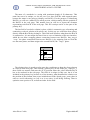
An HTTP transaction is composed by a header and, optionally, some data. The
header tells the server what action his required from him and the type of data expected
in the response. This is a way to interchange some extra information between the client
and the server, so it can elaborate a more accurate response. We can specify in the
header of the request the method to be used; in the last version, HTTP 1.1, there are
defined the methods OPTIONS, GET, HEAD, POST, PUT, DELETE and TRACE. A
web server can implement those methods, but it does not mean they are allowed. A
request header always has to start with the method, then the URI of the request and the
version of the protocol; then are included the headers; finally, and optionally, some
content or data.
Figure 2 Definition of URI
An HTTP response is a message sent from the server, in response of a request by the
client. This message has to start the protocol version, then the state number and an
clarifying message for this code. The code of a response is a three digit number; this
number tells if the request was successful or not, and in case it was not, it has to include
the reason. The most common response codes are:
200, success
403, forbidden (the request was valid but the server refuse to answer)
404, not found
500, internal server error
The method of a request specifies what action has to be performed on the identified
resource by the URI. A method is safe if it does not have side effects; the only methods
following that definition in the current protocol are GET and HEAD. The other methods
are supposed to be unsafe, because they are supposed to change something in the server,
producing side effects. However, GET method can also produce side effects; so it
totally depends on the server implementation.
Aitor Pérez Cedrés
Página 15 de 97
APPLICATION DEVELOPMENT FOR MANAGING AND
MONITORING A DATA CENTRE
The most common request methods in web applications are:
GET method requests information from the resource identified by a URI. If
the URI is a process who created or queries information, then it is sent the
information instead of the process.
POST method is used to make requests to the server that accepts the content
as input parameter. This method was originally created to send data blocks
from forms; and it was designed also to add new records to a data base.
However, in the end, the action of the method depends on server
implementation; it usually depends on the URI.
2.2.1 Web Servers
As part of the client-server architecture, the application will be held in a server; so it
will be accessible by anyone. Moreover, we need something to serve content. Here is
where web servers make their entrance.
The most classical approach to web server is an application listening for requests,
and sending back responses with content. The protocol used for this communication is
HTTP (explained above). Since nowadays, static HTML content is no longer served
because it has a lot of limitations; and probably the requested content is not static; so
serving just HTML files is no longer an option. In order to offer dynamic content, we
need use a server-side programming language able to process incoming requests,
processing them, and responding with proper content.
A very popular open-source web server is Apache HTTP. Apache HTTP Server
Project is a collaborative software development effort aimed at creating a robust,
commercial-grade, and freely-available source code implementation of an HTTP (Web)
server.
Figure 3 Apache logo
This application has become very rich and robust because the amount of modules
developed to add functionality. By using the modules, almost anything can be done with
Apache; from administration modules to integration of new back-end languages (e.g.
PHP). The web server is responsible of compiling the server side code and providing the
result to the client as HTTP response.
Aitor Pérez Cedrés
Página 16 de 97
APPLICATION DEVELOPMENT FOR MANAGING AND
MONITORING A DATA CENTRE
There are other alternatives to Apache; for instance, the Microsoft one: Internet
Information Services (IIS). IIS is a web server, together with a set of services for
Microsoft Windows servers. This web server offers FTP, SMTP, NNTP and HTTP.
This web server also allows modules to extend its functionality. By default it includes
modules for Active Server Pages (ASP), but it can include modules of external
manufacturers, as PHP or Perl. In opposite to Apache, IIS is private software (it belongs
to Microsoft) and it has the added cost of a paid license.
A new paradigm in web technologies is servlet. A servlet is an object running in the
context of a servlet container, extending its functionality. The main difference with
traditional server languages (e.g. PHP) is the persistence of servlets. A servlet do not die
after the request is responded. This fact offers a certain advantages over traditional
languages that just are executed to generate HTML and die; but it is at the cost of
heavier development process, and it is not very common the user of servlets unless the
business logic becomes very complex.
Servlets requires something different than a web server; they require a servletcontainer or an application server. The main difference between container and
application server is that servlet-container supports only Java Server Pages (JSP) and
servlets; by other hand, an application server supports beans as well; I cannot define
every term of this new paradigm because I will go out of topic. An example of servlet
container is Tomcat, a project developed under Apache Foundation.
2.2.2 Web Browsers
A web browser is a client side application to surf over Internet. The main task of this
browser is to render HTML code, with some CSS style rules, into a page readable for
humans. The web browser also includes a JS engine to run scripting code (almost any
browser has JavaScript as supported language).
Web browsers are the responsible of communicating with web servers through HTTP
protocol, and provide a proper response to the user; in the case of success, the HTML
code is rendered; in case of failure, the HTTP error code is often displayed together with
an error message.
The last versions of web browsers includes very robust and potent JS engines,
providing capabilities to render almost anything by using a low level procedural mode;
the canvas of this draws is canvas element, defined in HTML 5 standard by W3C. The
last versions of web browsers use the GPU to render the canvas element, achieving a
great performance, and providing the capability to render almost anything in the
browser. The main browsers nowadays, the most supported and with most number of
user are:
Firefox. Open Source web browser; it was born in Mozilla Foundation.
IE. Commonly known as Internet Explorer. It comes installed by default with
any Microsoft system. Some people defend “IE is useful only for
downloading Firefox”.
Aitor Pérez Cedrés
Página 17 de 97
APPLICATION DEVELOPMENT FOR MANAGING AND
MONITORING A DATA CENTRE
Chrome. This web browser belongs to Google; it is based in Open Source
project Chromium; it offers a lot of features for people who have a Google
account. Chrome made his entrance in the market obtaining 100/100 in Acid3
test.1
2.2.3 Databases
A database is an application that manages data and allows fast storage and retrieval
of that data. There are different types of database but the most popular is a relational
database that stores data in tables where each row in the table holds the same sort of
information. In the early 1970s, Ted Codd, an IBM researcher devised 12 laws of
normalization. These apply to how the data is stored and relations between different
tables.
Databases are manipulated and queried by using a language called SQL, which will
be defined in the next chapter. We also will explain the relational RDBMS MySQL
because we have chosen to work with it.
2.2.3.1 Standard SQL
SQL stands for Structured Query Language. It was one of the first commercial
languages for Edgar F. Codd, the author of the relation model. However, it do not
respect at all the relational model proposed by Codd, it became the most widely used
database language. SQL is specific purpose for relational database management systems
(RDBMS).
SQL is a declarative language to provide access to databases. This language allows
declaring operations over the data, which can modify the state of the data, or just query
and serve it. The language also includes a Data Definition Language (DDL), which is
used to define the relations and the data type of those relations. DDL is also used for
altering or modifying the structure of the database. And it provides a Data Manipulation
Language (DML), which is used to declare the operations over the data in the relations
defined with the DDL.
1
http://acid3.acidtests.org/
Aitor Pérez Cedrés
Página 18 de 97
APPLICATION DEVELOPMENT FOR MANAGING AND
MONITORING A DATA CENTRE
2.2.3.2 MySQL
MySQL is a RDBMS; it was originally created by Sun Microsystems, who later on
was bought by Oracle. MySQL was created as open source and free to use. It also stills
being free, but now its popularity has decreased since Oracle bought it.
However, MySQL has a lot of drivers, libraries and interfaces to ease the access from
almost any language to MySQL database. In our case, we will use PHP Data Object
interface to abstract the use of MySQL driver, easing the interaction with the database
and adding security features by avoiding SQL injection thanks to prepared statements
from this interface.
Prepared statements are SQL queries that are previously negotiated with the
database. For instance, preparing this statement “SELECT name FROM allowed_users
WHERE name = ?”; it will result in the interface telling the RDBMS: “I am going to
execute a select on the table allowed users using a where condition; whatever I input in
where condition is a condition itself; I will not add any other query”. In this way, if we
try to inject SQL code, the database will know that is was not negotiated and it will take
that as condition in where clause.
2.2.4 Programming languages
In order to develop our application, we have to develop our web application by using
some back-end language, which can be integrated with Apache web server. For that
purpose, we have chosen PHP as server languages because we already have experience
from User Interfaces course and it allows us to develop applications in a short time.
Moreover, PHP has a lot of support from the community and it is easy to learn and to
use.
We have chosen to use JavaScript as client side language because it had a lot of
impact and increase of popularity in the last few years, becoming a trending topic. JS
also has a lot of libraries to support and ease the development of client side logic,
allowing us to create dynamic web pages with very little effort.
2.2.4.1 JavaScript
HTML documents can also contain a script (e.g. JavaScript); this script can change
the content of the web page or alter the behavior of the browser. This script allows
making HTML documents “dynamic” in some extent.
The use of JavaScript has become very popular in the last year, especially with the
emergence of Google Chrome browser and the improvements on Mozilla Firefox.
Microsoft Internet Explorer also made his improvements on his JavaScript engine
(Chakra), obtaining more performance than Firefox 4 (who uses SpiderMonkey), but it
stills being slower than Chrome (who uses V8).
Aitor Pérez Cedrés
Página 19 de 97
APPLICATION DEVELOPMENT FOR MANAGING AND
MONITORING A DATA CENTRE
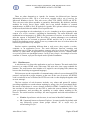
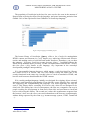
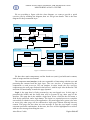
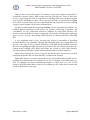
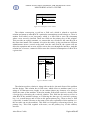
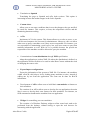
The popularity of JavaScript in the last few years can be also seen in the amount of
libraries that are being developed for the language; and some interesting statistics from
GitHub: 20% of the repositories from GitHub are in JavaScript language.2
Figure 4 Top Languages in Github projects
The known library of JavaScript, jQuery, offers a lot of tools for manipulation
HTML content and elements in a very simple way, achieving efficient and effective
results; and making easier to build rich and usable interfaces. Nowadays, you can hear
the sentence: “Knowing JavaScript means knowing jQuery”. JavaScript follows the
EMACScript standard (more precisely, ECMA-262 specification and ISO/IEC 16262);
this fact gives a big feature to the language, very important in the nowadays
development paradigm: interoperability.
JS is interoperable between browsers, which means, a code developed for Chrome
also works on IE or in Firefox, and vice versa. Maybe exactly the same code is not
exactly functional in the same way, but this is due to a lack of standard in HTML, and
how the web browsers should render the HTML content.
JS is a multi-paradigm language; initially was designed for scripting, object oriented,
imperative and functional programming. From this fact, many libraries have emerged
for supporting and complementing the language. The most impacting one may be
node.js. This library allows executing JS in server side, when JS was designed to be
client side. This library has a lot of consequences; the first one: companies can recycle
people working for development in front-end (client side) and send them to back-end
(server side) using this library. The second one: reduce the asynchronous requests from
the browser, since now the server can send information to the browser asynchronously
without being requested by the client (e.g. instant message system, GTalk, TuentiChat
…).
2
https://github.com/languages
Aitor Pérez Cedrés
Página 20 de 97
APPLICATION DEVELOPMENT FOR MANAGING AND
MONITORING A DATA CENTRE
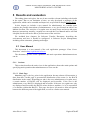
We are providing some statistics features to the application; however, PHP and JS
does not have support for rendering charts by themselves, so in some way, with PHP we
can store the statistic data, but then we have to render it somehow in the web browser.
Here is where Google Charts come in scene. We will use this library, provided and
supported by Google. This library offers a set of tools and a variety of charts to render
statistic data on them. It also has a very well documented API; actually, using this
library is not difficult if you know the basis of JavaScript.
Among the chart types Google provides, we are just using a line chart and a pie
chart. In the line chart we will draw historical data from electrical consumptions,
ordered by insertion date. The pie chart will be used to display the percentage of
occupation of a RACK; the occupation of a RACK is basically the used by space by
current equipment vs. free space, where machine can be placed.
2.2.4.2 AJAX
AJAX stands for Asynchronous Javascript And XML. This web development
technique is very useful to create Rich Internet Applications. This technique consists on
executing asynchronous requests from the web browsers in background; so we can
update the web content without refreshing or loading again the whole page. In this way,
we increase the interactivity, the performance and the usability of web applications.
JavaScript is usually the language where AJAX requests are performed by sending
an XMLHttpRequest; this object is already implemented in modern browsers. If a web
browser does not implement this object, AJAX cannot be used on that browser. Even
the name of the object being XMLHttpRequest, it is not necessary that the content from
AJAX requests/responses is formatted in XML; actually, it can be formatted in JSON,
HTML or even plain text.
2.2.4.3 PHP
PHP is a general-purpose server side scripting language. It was designed for web
development to produce dynamic web pages. It was one of the first languages developed
for server-side, and one of the first able to be embedded into an HTML source code
document.
The code is interpreted by a web server with a PHP processor module. PHP can be
deployed on most Web servers and also as a standalone shell on almost every operating
system. It can be used with many databases (e.g. MySQL).
Vulnerabilities are caused mostly by not following best practice programming rules;
technical security flaws of the language itself or of its core libraries are not frequent.
PHPIDS (PHP Intrusion Detection System) adds security to any PHP application to
defend against intrusions. PHPIDS detects attacks based on cross-site scripting (XSS),
SQL injection, header injection, directory traversal, remote file execution, remote file
inclusion, and denial-of-service (DoS).
Aitor Pérez Cedrés
Página 21 de 97
APPLICATION DEVELOPMENT FOR MANAGING AND
MONITORING A DATA CENTRE
PHP stores whole numbers in a platform-dependent range, either a 64-bit or 32-bit
signed integer equivalent to the C-language long type. PHP also implements objectoriented programming functionality. Some common criticisms of the PHP language
include weak support for Object-oriented programming, thread safety, unit testing,
exception handling, step-through debugging, domain modeling, inconsistent naming and
poor performance when compared to rival frameworks and languages (e.g. JSP and
servlets)
2.2.4.4 XML
XML is stands for Extensible Markup Language. This language defines a set of rules
for encoding information. It is a structured language, using tags to define elements.
Anything can be defined in XML; the advantage of this language is that can be
understood by machines.
This language also allows validation against a schema; being able to check in this
way if a document is well-formed. From this language, many other languages has been
developed; for instance: XHTML and SOAP. Moreover, some office applications, such
as Open Office and Microsoft Office 2007 and higher, have adopted a XML-based
format. It also has taken part in a communication protocol, XMPP; this protocol is used
by Google GTalk chat service.
An XML document is well-formed when it satisfies a set of rules defined in a
schema, as well as a set of syntax rules provided in the language specification. XML
and its extensions have regularly been criticized for verbosity and complexity. Mapping
the basic tree model of XML to type systems of programming languages or databases
can be difficult, especially when XML is used for exchanging highly structured data
between applications, which was not its primary design goal.
2.2.4.5 JSON
JSON stands for JavaScript Object Notation. It is a lightweight text-based open
standard. It was designed for human-readable data exchange. It is derived from the
JavaScript scripting language for representing simple data structures and associative
arrays, called objects. Despite its relationship to JavaScript, it is language-independent,
with parsers available for many languages.
JSON is significantly simpler and more lightweight than XML; it is also easier to
read, making him a more interesting option than XML in many cases. Moreover, it has
libraries for many languages, so it ensures interoperability between languages of
generated strings of JSON. Although not always is needed a library for parsing JSON;
for instance, PHP and JS have native support for parsing JSON strings.
Aitor Pérez Cedrés
Página 22 de 97
APPLICATION DEVELOPMENT FOR MANAGING AND
MONITORING A DATA CENTRE
2.3 ESA Standard
We are applying ESA Standard methodology to analyze, track, develop and evaluate
the project and its status.
ESA Standard methodology is a standard developed by the European Space Agency
(ESA). This methodology has a simplified version, called ESA LITE; this simplified
version is recommended for small projects. We are using this methodology, learnt in
Software Development Projects Management course.
A software project can be considered to be small if one or more of the following
criteria apply:
Less than two man years of development effort is needed.
A single development team of five people or less is required.
The amount of source code is less than 10000 lines, excluding comments.
One or more of the following strategies are often suitable for small projects
producing non-critical software:
Combine the software requirements and architectural design phases.
Simplify documentation and plans
Reduce the reliability requirements
Aitor Pérez Cedrés
Página 23 de 97
APPLICATION DEVELOPMENT FOR MANAGING AND
MONITORING A DATA CENTRE
3 Problem statement
This section describes the features and functionalities the application must include.
User and Software Requirements are included in this section as well, together with a
description of main capabilities. The name of the application, from now on, is Data
Center Guardian.
3.1 Main capabilities and constraints
Data Center Guardian is a software system created to ease one of the main tasks of
the Lab: monitoring and managing the data centre in the Lab. By using this application,
Lab administrators will be able to create new user accounts for regular users of the data
centre (i.e. people who has a machine in the centre) to allow them to use the application
as well.
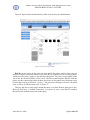
The application will allow storing consumption (i.e. electric consumption) records so
they can be queried and drawn in a chart. However, administrators are the only ones
allowed to perform such operations. The application will present the last inserted record
in a table, together with some important information, such as electrical phase number
connected to RACK, the name of the RACK and the percentage of occupation. The
occupation can also be queried as a pie chart, which will show used and free
percentages.
The system distinguishes between three different types of users, with different
permissions and roles.
Guest: A guest is a non-logged user. This user only must have access to the
login page. Any attempt of going to any other part of the system must be denied
and he should be redirected to login page.
Regular user: A registered and logged user. This user can only see a RACK if
he has a machine inside it. This user cannot query the consumption page, or the
user management section. He can query his machine information and
monitoring statistics. Moreover, even if he can query a RACK, he can only see
the machines within that RACK if they belong to him (i.e. he is the responsible)
Administrator: A system administrator. This user can see every RACK, he can
also query any machine information; add, delete or move any machine within a
RACK; query, add or delete consumption records; and manage the users of the
system.
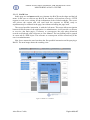
The application allows querying the information of a machine within a RACK,
showing the contact information of the responsible of that machine. The personal
information gathered is the office phone number, the email and the office. The
username is, in many cases, the same as the real name of the user.
Aitor Pérez Cedrés
Página 24 de 97
APPLICATION DEVELOPMENT FOR MANAGING AND
MONITORING A DATA CENTRE
The application also stores details of each machine, for instance, the Operating
System, the IP of the machine, the color of the machine (we only allow the cases
“Bright” and “Dark” machine colors), the kind of machine (it is also a closed field:
UPS, KVM, Switch, Server or Storage Server). We allow as well inserting some notes
about the machine; this notes has no actual limitation but length, which can be, as
maximum, 255 characters. We also store the position of a machine within the RACK
and the number of Us it takes.
3.1 Assumptions and dependencies
In this chapter we are analyzing the kind of user of our application and we will try to
gather as much information as possible we can from them in order to design a proper
interface.
We are also specifying the software development methodology.
3.1.1 User characteristics
It is assumed that the users will access the application with a browser that has a
reasonable support of HTML5. The browsers must also support JavaScript and jQuery
1.7, and must have cookies enabled.
In order to define our interface, we have to consider some important facts listed
below:
Who users are
What activities are being carried out
Where the interaction is taking place
Match activities and needs
The users of our system will be professors and technicians from the University, so
we can assume they will have some technical knowledge. This assumption let us design
an interface with less help message pop-outs and less indications, since users will have
knowledge enough to figure out what an element is just by including a tag or a short
description. This can provide a more lightweight interface because it will have fewer
elements. However, we have to use meaningful tags or descriptions related to our users’
knowledge; in this case, we expect the users to have computer engineering knowledge;
this fact allows us to use technical tags to describe some information (e.g. IP, instead of
Internet Protocol address).
The users of our system will perform three main activities:
1. Authenticate themselves into the system
2. Query RACKs information
3. Query machines information
Aitor Pérez Cedrés
Página 25 de 97
APPLICATION DEVELOPMENT FOR MANAGING AND
MONITORING A DATA CENTRE
By other hand, there is a special kind of user, the administrator, who will perform
some additional activities:
1. Edit RACK information
2. Add new RACK
3. Delete RACK
4. Edit machine information
5. Add new machine
6. Delete a machine
7. Access electrical consumption information
This is a special user with higher privileges, who is allowed to change the
information of the system. These users are people from the department; they have more
knowledge about the application and the elements related than the regular users.
However, we will build the same interface for both kinds of users. Although, the pages
where only an administrator has access will content fewer help tags or help descriptions;
they will have icons for certain actions instead of explicative buttons.
We also assume that users will have a web browser with a reasonable support for
HTML 5, CSS 3 and JavaScript. Actually, the application will be tested under Firefox
11+ and Google Chrome 18+.
3.1.2 Software development methodology
We are using ESA LITE methodology as analysis method. We will gather the
requirements using his recommendations and rules. The next chapters include the
requirements and design steps recommended by ESA LITE.
Aitor Pérez Cedrés
Página 26 de 97
APPLICATION DEVELOPMENT FOR MANAGING AND
MONITORING A DATA CENTRE
3.2 User requirements
Along this section, a numeric scale for priority, stability, necessity and clarity has
been used. This scale ranges from 1 to 5 where 1 stands for very low and 5 stands for
the maximum.
ID
Name
Actors
Description
Source
Verifiability
Stability
Priority
Notes
Numeric id
Type
Functional or nonfunctional
Meaningful name
Who is using affected by this requirement
Brief description of the requisite
From who/what/where we got the requirement
Yes or No
{1,5}
Clarity
{1,5}
Necessity
{1,5}
{1,5}
Some notes to clarify the requirement if is not enough with the
description. Also used to describe ranges or possible values.
Table 1 Requirement template
3.2.1 Functional requirements
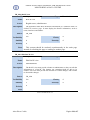
FR_1001 Sign up
FR_1001
ID
Name
Actors
Description
Source
Verifiability
Stability
Priority
Notes
Type
Functional
Sign up
Administrator
Data Center Guardian system shall provide
administrators to register new users in the application.
the means
for
Project tutor
Yes
5
Clarity
5
Necessity
5
5
User names and emails must be unique. The login credentials will
be the same as in LDAP server already set up in the lab.
Table 2 FR_1001 Sign Up
Aitor Pérez Cedrés
Página 27 de 97
APPLICATION DEVELOPMENT FOR MANAGING AND
MONITORING A DATA CENTRE
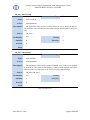
FR_1002 Login
FR_1002
ID
Name
Actors
Description
Source
Verifiability
Type
Functional
Login
Everybody
Data Center Guardian shall provide the means for any user to login
into the system using his username and password.
Project tutor
Yes
Stability
5
Priority
Notes
5
Clarity
5
Necessity
5
Table 3 FR_1002 Login
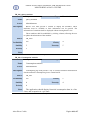
FR_1003 Change password
FR_1002
ID
Name
Actors
Description
Source
Verifiability
Type
Functional
Change password
Administrator
Data Center Guardian shall provide the means for administrators to
change any user password at any time.
Project tutor
Yes
Stability
4
Priority
Notes
4
Clarity
5
Necessity
5
Table 4 FR_1003 Change password
Aitor Pérez Cedrés
Página 28 de 97
APPLICATION DEVELOPMENT FOR MANAGING AND
MONITORING A DATA CENTRE
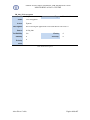
FR_1004 Delete account
ID
FR_1004
Type
Name
Delete account
Actors
Administrator
Description
Source
Verifiability
Functional
Data Center Guardian shall provide the means for administrators to
delete a user account.
Project tutor
Yes
Stability
5
Priority
3
Clarity
5
Necessity
4
Notes
Table 5 FR_1004 Delete account
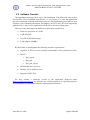
FR_1005 Room distribution
ID
Name
Actors
Description
FR_1005
Type
Functional
Room distribution
Administrator, regular user
Data Center Guardian shall provide the means for administrators to see
the whole distribution of the RACKs inside the room. A regular user can
only see a RACK if he has a machine inside it.
It also has to show the phases which are connected to RACKs and the
connections, which are visible to any user.
This distribution must be dynamic and modifiable only by an
administrator. Administrators must be able to add or delete any RACK of
this scheme.
Source
Verifiability
Project tutor
Yes
Stability
4
Priority
5
Clarity
5
Necessity
5
Notes
Table 6 FR_1005 Room distribution
Aitor Pérez Cedrés
Página 29 de 97
APPLICATION DEVELOPMENT FOR MANAGING AND
MONITORING A DATA CENTRE
FR_1006 Room temperature
ID
Name
Actors
Description
Source
Verifiability
FR_1006
Type
Functional
Room temperature
Administrator, regular user
Data Center Guardian shall show the temperature of the room. The
application will receive the data from a sensor installed in the room.
Project tutor
Yes
Stability
5
Priority
4
Clarity
5
Necessity
5
Notes
Table 7 FR_1006 Room temperature
FR_1007 Consumption
ID
Name
Actors
Description
Source
Verifiability
FR_1007
Type
Functional
Consumption
Administrators
Data Center Guardian shall provide a section to insert consumption
records, query the last one, show historical records, and add/delete records.
Project tutor
Yes
Stability
5
Priority
4
Clarity
5
Necessity
4
Notes
Table 8 FR_1007 Consumption
Aitor Pérez Cedrés
Página 30 de 97
APPLICATION DEVELOPMENT FOR MANAGING AND
MONITORING A DATA CENTRE
FR_1008 Query RACK information
ID
Name
Actors
Description
Source
Verifiability
FR_1008
Type
Functional
Query RACK information
Administrator, regular user
Data Center Guardian shall provide the means for administrator users to
query any RACK information. A regular user can only query a RACK if he
has a machine inside it.
Project tutor
Yes
Stability
5
Priority
4
Clarity
5
Necessity
5
Notes
Table 9 FR_1008 Query RACK information
FR_1009 Manage RACK
ID
FR_1009
Type
Name
Manage RACK
Actors
Administrators
Description
Source
Verifiability
Functional
Data Center Guardian shall provide the means for administrator users to
add, to edit or delete any RACK information. The system shall also provide
a view to add, move, edit, query or delete a machine to a RACK schema.
Project tutor
Yes
Stability
5
Priority
4
Clarity
5
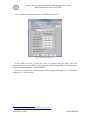
Necessity
5
Notes
Table 10 FR_1009 Manage RACK
Aitor Pérez Cedrés
Página 31 de 97
APPLICATION DEVELOPMENT FOR MANAGING AND
MONITORING A DATA CENTRE
FR_1010 Assign responsible
ID
Name
Actors
Description
Source
Verifiability
FR_1010
Type
Functional
Assign responsible
Administrators
Data Center Guardian shall provide the means for administrator users to
assign a user as responsible of a particular machine, so that user is able to
see the RACK in the room distribution.
Project tutor
Yes
Stability
5
Priority
4
Clarity
5
Necessity
4
Notes
Table 11 FR_1010 Assign responsible
FR_1011 User management
ID
Name
Actors
Description
FR_1011
Type
Functional
User management
Administrators
Data Center Guardian shall provide the means for administrator users to
manage system users. The administrator shall be able to sign up a new user;
delete a user; search a user by name and change the role of a user in the
system (assign him as a machine responsible or demote him from machine
responsible)
A user may be registered in the application, but it does not mean he is
responsible of a machine
Source
Verifiability
Project tutor
Yes
Stability
4
Priority
4
Clarity
5
Necessity
4
Notes
Table 12 FR_1011 User management
Aitor Pérez Cedrés
Página 32 de 97
APPLICATION DEVELOPMENT FOR MANAGING AND
MONITORING A DATA CENTRE
FR_1012 Consumption statistics
ID
FR_1012
Name
Functional
Consumption statistics
Actors
Description
Type
Administrators
Data Center Guardian shall provide the means for administrator users to
query statistics and graphs about historical data of consumption records.
The graphs shall allow filter by date and time
Source
Verifiability
Project tutor
Yes
Stability
4
Priority
4
Clarity
5
Necessity
4
Notes
Table 13 FR_1012 Consumption statistics
3.2.2 Non-Functional requirements
N-FR_0001 Secure connection
N-FR_0001
ID
Name
Non Functional
Secure connection
Actors
Description
Type
N/A
Data Center Guardian requires the identification of every user, so an
authentication procedure needs to be developed. Therefore, this
authentication will be performed via HTTPS in order to prevent any
eavesdropping attacks.
Source
Verifiability
Yes
Stability
4
Priority
3
Clarity
5
Necessity
5
Notes
Table 14 N-FR_0001 Secure connection
Aitor Pérez Cedrés
Página 33 de 97
APPLICATION DEVELOPMENT FOR MANAGING AND
MONITORING A DATA CENTRE
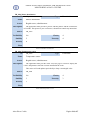
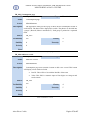
3.3 Software requirements
In this chapter we are describing the software requirements. We are following the
same template we used in User Requirements. At the end of the chapter it is also
included a traceability matrix mapping software requirements with user requirements.
3.3.1 Functional requirements
FR_2001 Login form
FR_2001
ID
Name
Actors
Description
Source
Verifiability
Functional
Login form
Guests
The application must provide a form to input user credentials and a submit
method to send them to the server in order to authenticate themselves
FR_1001, FR_1002
Yes
Stability
5
Priority
5
Notes
Type
Clarity
5
Necessity
5
The password field must not show the password in plain text. A
submit button must be provided.
Table 15 SR Login form
FR_2002 Check if logged
FR_2002
ID
Name
Actors
Description
Source
Verifiability
Functional
Check if logged
Web server
The application must check if the user is logged any time he tries to access a
private page (i.e. any page but login).
FR_1002
Yes
Stability
5
Priority
5
Notes
Type
Clarity
5
Necessity
5
The password field must not show the password in plain text. A
submit button must be provided.
Table 16 SR Check if logged
Aitor Pérez Cedrés
Página 34 de 97
APPLICATION DEVELOPMENT FOR MANAGING AND
MONITORING A DATA CENTRE
FR_2003 User management view
FR_2003
ID
Name
Actors
Description
Source
Verifiability
Functional
User management view
Administrator
The application should provide a view for user management. In this view
the administrators can sign up new users, delete existing ones and change users
password.
FR_1001, FR_1003, FR_1004, FR1011
Yes
Stability
4
Priority
3
Notes
Type
Clarity
5
Necessity
3
There should be a way to manage users; from the application or from
other external application.
Table 17 SR User management view
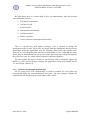
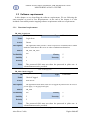
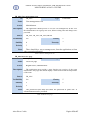
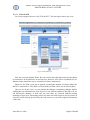
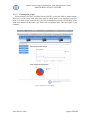
FR_2004 Overview page
FR_2004
ID
Name
Actors
Description
Source
Verifiability
Functional
Overview page
Regular users, administrators
The application must provide a page showing an overview of the room
distribution. This page also should display a small section with the temperature
of the room.
FR_1005
Yes
Stability
5
Priority
5
Notes
Type
Clarity
5
Necessity
5
The password field must not show the password in plain text. A
submit button must be provided.
Table 18 SR Overview page
Aitor Pérez Cedrés
Página 35 de 97
APPLICATION DEVELOPMENT FOR MANAGING AND
MONITORING A DATA CENTRE
FR_2005 Phases distribution
FR_2005
ID
Name
Actors
Description
Source
Verifiability
Type
Functional
Phases distribution
Regular users, administrators
The application must provide a picture with the phases and the connections
to RACKs. This picture is just a reference; it should not contain any interaction.
FR_1005
Yes
Stability
5
Priority
4
Clarity
4
Necessity
4
Notes
Table 19 SR Phases distribution
FR_2006 Temperature sensor
FR_2006
ID
Name
Actors
Description
Type
Functional
Temperature sensor
Regular users, administrators
The application must provide in the overview page a section to display the
room’s temperature sent from a sensor installed in the room.
This sensor will send updates periodically to keep a meaningful value.
Source
Verifiability
FR_1006
Yes
Stability
3
Priority
3
Clarity
4
Necessity
3
Notes
Table 20 SR Temperature sensor
Aitor Pérez Cedrés
Página 36 de 97
APPLICATION DEVELOPMENT FOR MANAGING AND
MONITORING A DATA CENTRE
FR_2007 Consumption page
FR_2007
ID
Name
Actors
Description
Source
Verifiability
Type
Functional
Consumption page
Administrators
The application must provide a page to show the last consumption record of
each RACK. The data will be displayed in a table. The phases are divided into
“groups” (Phase R, Phase S and Phase T). Each group is painted in a separated
table.
FR_1007
Yes
Stability
4
Priority
4
Clarity
4
Necessity
5
Notes
Table 21 SR Consumption page
FR_2008 Add new record
FR_2008
ID
Type
Name
Add new record
Actors
Administrators
Description
Source
Verifiability
Functional
Consumption page must contain a button to add a new record. This button
will display a form with two fields:
RACK: This will be a list with the RACKs of the room
Value: This field is a numeric input of four digits: two integers and
two decimals.
FR_1007
Yes
Stability
5
Priority
4
Clarity
4
Necessity
5
Notes
Table 22 SR Add new record
Aitor Pérez Cedrés
Página 37 de 97
APPLICATION DEVELOPMENT FOR MANAGING AND
MONITORING A DATA CENTRE
FR_2009 RACK view
FR_2009
ID
Name
Actors
Description
Source
Verifiability
Functional
RACK view
Regular users, administrator
The application must show the RACK information of a wardrobe when it is
clicked in overview page. It must display the RACK information, such us
name, interfaces and subnets.
FR_1008
Yes
Stability
4
Priority
4
Notes
Type
Clarity
4
Necessity
4
This content should be rendered asynchronously in the main page
instead of refreshing the page or sending to another page.
Table 23 SR RACK view
FR_2010 Edit RACK view
FR_2010
ID
Name
Actors
Description
Source
Verifiability
Type
Functional
Edit RACK view
Administrators
The RACK view must provide a button to administrator so they can edit the
information of a RACK. The changes not committed shall be able to be
undone. This view must provide also a button to commit changes; and a button
to discard the changes.
FR_1009
Yes
Stability
5
Priority
4
Clarity
4
Necessity
4
Notes
Table 24 SR Edit RACK view
Aitor Pérez Cedrés
Página 38 de 97
APPLICATION DEVELOPMENT FOR MANAGING AND
MONITORING A DATA CENTRE
FR_2011 Delete RACK
FR_2011
ID
Name
Delete RACK
Actors
Administrators
Description
Source
Verifiability
Type
Functional
The application must provide a button in RACK view to delete the RACK.
The machines and consumptions associated to delete RACK shall be deleted as
well.
FR_1009
Yes
Stability
4
Priority
4
Clarity
4
Necessity
4
Notes
Table 25 SR Delete RACK
FR_2012 Add machine
FR_2012
ID
Name
Actors
Description
Source
Verifiability
Type
Functional
Add machine
Administrators
The application must provide a button in RACK view to add a new machine
to the RACK. This button should display a form to fulfill machine data and a
submit button to send the form to the server so it can commit changes.
FR_1009, FR_1010
Yes
Stability
4
Priority
4
Clarity
4
Necessity
5
Notes
Table 26 SR Add machine
Aitor Pérez Cedrés
Página 39 de 97
APPLICATION DEVELOPMENT FOR MANAGING AND
MONITORING A DATA CENTRE
FR_2013 Query machine
FR_2013
ID
Type
Name
Query machine
Actors
Administrators
Description
Functional
RACK view must provide a schema to display the machines. Those
machines must be clickable to their information can be queried. The
information of a machine shall be displayed without closing RACK view.
Those machines shall be modifiable by clicking a button, allowing the user
to update the information of the machine.
Source
Verifiability
FR_1009
Yes
Stability
5
Priority
5
Clarity
4
Necessity
5
Notes
Table 27 SR Query machine
FR_2014 Consumption statistics
FR_2014
ID
Name
Actors
Description
Source
Verifiability
Functional
Consumption statistics
Administrators
Consumption page must provide a way to visualize statistical and historical
data about RACK consumption given a certain RACK.
FR_1012
Yes
Stability
4
Priority
4
Notes
Type
Clarity
5
Necessity
4
The application should display historical consumption data in a line
chart, and occupation in a pie chart.
Table 28 SR Consumption statistics
Aitor Pérez Cedrés
Página 40 de 97
APPLICATION DEVELOPMENT FOR MANAGING AND
MONITORING A DATA CENTRE
FR_2015 TLS encryption
FR_2015
ID
Name
Actors
Description
Source
Verifiability
Type
Functional
TLS encryption
System
We are forcing the application to run under HTTP with TLS 1.0
N-FR_0001
Yes
Stability
4
Priority
4
Clarity
4
Necessity
4
Notes
Table 29 SR TLS encryption
Aitor Pérez Cedrés
Página 41 de 97
3.3.2
Traceability matrix
UR\SR
FR_2001 FR_2002 FR_2003 FR_2004 FR_2005 FR_2006 FR_2007 FR_2008 FR_2009 FR_2010 FR_2011 FR_2012 FR_2013 FR_2014 FR_2015
X
X
FR_1001
X
X
FR_1002
X
FR_1003
X
FR_1004
X
X
FR_1005
X
FR_1006
X
X
FR_1007
X
FR_1008
X
X
X
X
FR_1009
X
FR_1010
X
FR_1011
X
FR_1012
X
N-FR_0001
Table 30 Traceability matrix UR-S
APPLICATION DEVELOPMENT FOR MANAGING AND
MONITORING A DATA CENTRE
4 Design
We have designed the system according a three layer one tier model (See next
figure). We have chosen this model because we already had experience and we worked
before with this model, which have given good results. In our design we include also
client-server architecture because we wanted to make the user interface dynamic.
Figure 5 Three layer model
The presentation layer is responsible of presenting processed information to the
user; it also has to send input events to logic layer, telling if the user requests new
information. This layer can be seen as the web browser, since it is there where the
information is presented. This layer has also some logic below JavaScript, but it is
limited to certain tools for locating, hiding and showing content within the HTML of the
browser page, so we can make HTML page dynamic in some way. In this layer is also
defined the layout of the HTML.
The communication between the presentation layer and the business logic layer is
performed through HTTP protocol.
The business logic layer is responsible of processing the events from the
presentation layer, query the data layer if needed, generate HTML code for the
presentation layer and send update events to the data layer. This layer has also to
prevent attacks over the data layer and has to ensure a safe use of the application from
the presentation layer; which means that it has to process and validate every user input
from the presentation layer, in order to avoid errors and malfunction or crashing of the
application. We can see this layer as the PHP code, executed in the server, which
generates the HTML code the web browser will render.
Aitor Pérez Cedrés
Página 43 de 97
APPLICATION DEVELOPMENT FOR MANAGING AND
MONITORING A DATA CENTRE
The communication between the business logic layer and the data layer is performed
through the PHP Data Object interface, included by default in PHP 5.3.
The data layer is responsible of efficient and effective storage of the information
and data of the application. It also has to allow querying information. This layer holds a
relational schema and a clear definition of the objects stored within. It also holds some
logic to preserve the integrity of the data and to avoid inconsistencies between relations.
This layer can be seen as the relational database used to store the data.
We designed as well a relational database to store our important data for the
application. We chose relational SQL data bases because we worked before with them,
and in the course of Files and Databases we had an assignment where we had to work
with an SQL data base and to build optimized queries.
Since this is a web application, we are using the last innovation technologies, for
instance: HTML 5, CSS 3, and JavaScript with jQuery, jQuery UI and Google Charts
libraries as a requirement to build our application.
We have to find a way to communicate the business layer with the presentation
layer. In a first instance, we decided to use XML because it is a robust markup
language, which allows validation against a schema and it is wildly extended and
supported. However, we found that XML did not fit to our needs at all because we
barely needed most of their futures, and it lacked in a very basic one: easy integration
with JavaScript, the client side language. Therefore, we changed our mind and started to
use JSON (JavaScript Object Notation), which has native conversion between raw data
and JavaScript objects.
We designed, in some measure, the user interface using a technique called
Responsive Web Design. The basis of this technique establishes that the layout and the
images of a web site have to be fluid and flexible. The main objective of this technique
is to build a layout capable of presenting the content in devices and resolutions it was
not primarily designed for; for instance, presenting the application in a mobile device.
Actually it has some problems to work properly on mobile devices, but this is due to
jQuery library for JavaScript; I would have to adapt the application by using jQuery
mobile library instead.
We presented above three roles within the system. We actually simplified the model,
and now instead of having users with roles, we have a specific account for
administrator, and any other registered account is considered a regular user. We
simplified the model of permissions because we noticed that only people belonging to
the department will access as administrator; in other words, we will not have external
administrator, so the capability of granting administrator privileges to specific user
accounts loses priority and necessity, which allows us to simplify the model and set an
administrator account, and suppose that any other account is a regular user one.
Aitor Pérez Cedrés
Página 44 de 97
APPLICATION DEVELOPMENT FOR MANAGING AND
MONITORING A DATA CENTRE
4.1 Initial prototype
We build an initial prototype using the application Axure RP Pro 63. This application
provides tools to develop very fast rich and interactive prototypes without having to
code anything; moreover, it generates your prototypes in HTML, so no need of using
special player. We chose this tool because is really easy to use, it has a lot of examples
and documentation to get started, and in very few time you can build a prototype, so
developer and client can agree on what the product must be.
These are some images about how we expected the application to looks like:
Figure 6 Initial prototype login
This is the login page, which provides a basic header and footer, which set the width
of the page. We can see that from the basic prototype we already have decided that the
content must be centered in the page, and that it must follow the current Lab theme. The
Lab theme is a combination of soft blue colors, which give a sensation of “relaxed
content”; these combination of colors do not borrow the attention of the user from the
main content (in this case, entering the user credentials) while providing an aesthetic
page.
3
http://www.axure.com/
Aitor Pérez Cedrés
Página 45 de 97
APPLICATION DEVELOPMENT FOR MANAGING AND
MONITORING A DATA CENTRE
Figure 7 Overview page
The figure above is the main page; it is also called Overview. This page is shown
right after successful login, and it provides an overview of the room distribution, where
each “big” rectangle represents a RACK; the small ones represent electric phases. In
this prototype we did not connect the RACKs to electric phases because the tool (Axure
RP Pro 6) did not provide any tool to draw arbitrary lines between elements, since it is
one of the current limitations of HTML 4.
In this view, you can click in any RACK to make the wardrobe view fade in. Then
you can edit the wardrobe information, add a new machine, or click in "Jean Luc
Picard" machine to switch to Machine View.
Aitor Pérez Cedrés
Página 46 de 97
APPLICATION DEVELOPMENT FOR MANAGING AND
MONITORING A DATA CENTRE
The next figure shows the RACK view:
Figure 8 RACK view
The RACK view now substitutes the phases but it keeps visible the RACKs, so any
other RACK can be clicked and queried; in that case, the current rack view will be
hidden and then substituted by the new one. In this view, the possible interactions are:
add new machine, edit rack information, query specific machine, hide the current view
and go back to phase’s picture, or query a different RACK.
Aitor Pérez Cedrés
Página 47 de 97
APPLICATION DEVELOPMENT FOR MANAGING AND
MONITORING A DATA CENTRE
Now let’s suppose that we click on “Edit” button, which allows us to edit the RACK
information:
Figure 9 Edit RACK view
This view is very similar to RACK view, but now the fields to show the information
of the RACK are editable text boxes. The idea of this view to be similar to RACK view
is that the user can feel that he can change the information he was just watching a few
ago, so we can avoid having formularies in a different view or overloading the page
with a complete different view. However, later on testing phase, we found that this
approach was not intuitive at all, so in next versions there is included some more
information about what each thing is. In Edit Wardrobe view, you can change: name of
wardrobe or/and information of wardrobe. Once editing, you can also discard the
changes.
Aitor Pérez Cedrés
Página 48 de 97
APPLICATION DEVELOPMENT FOR MANAGING AND
MONITORING A DATA CENTRE
The next figure shows the “Machine view”:
Figure 10 Machine view
This view maintains the design of a small frame between the RACKs. Machine view
contains more information than the other views and it may be a bit overloaded; this
issue will be solved in the next prototype. This view presents the information about the
responsible user assigned to this machine, the operating system of the machine, the IP of
the machine, the color, the type of machine, some notes and the measures of the
machine, which are the starting position in the RACK and how many Us takes going
upward. In this view it is also shown some charts with memory usage, CPU usage and
temperature, which are statistics about usage. This feature is optional, and it will require
the installation of a daemon in the target machine.
Aitor Pérez Cedrés
Página 49 de 97
APPLICATION DEVELOPMENT FOR MANAGING AND
MONITORING A DATA CENTRE
The next figure shows the “Edit Machine view”:
Figure 11 Edit Machine View
In Edit Machine view, you can change the name of the machine, pick a responsible
from a list, change the name of the OS, change the IP, set the color or the machine
(bright or dark), set the type of machine (Server, Storage server, KVM, switch or UPS);
and also change the starting position of the machine, and the number of U's it needs.
In the prototype, if you change the position, nothing happens in the schema on
Wardrobe view, but in the final system, it will check if it's possible the movement, and
will change the schema in case that is possible.
The main difference between “Add machine view” and “Edit machine view” is that
edit machine button loads the previous values from the view into the editable fields,
while add new machine just sets them to blank or loads some default values.
Aitor Pérez Cedrés
Página 50 de 97
APPLICATION DEVELOPMENT FOR MANAGING AND
MONITORING A DATA CENTRE
The next view shows the consumption page:
Figure 12 Consumption page
This page will show the last record of electric consumption inserted for each RACK.
The data is separated per phase group. We have three different groups:
1. Phase R
2. Phase S
3. Phase T
Those are arbitrary names, which contain a group of electrical phases. The
consumption unit is the Watt. Each RACK has a theoretical limit, that in case that is
reached, it will produce a blackout. It is important to keep tracking of each RACK
consumption so we can ensure this limit is far to be reached. Next to the consumption, it
is also shown the current occupation of the RACK; this means, the percentage of used
space (this basically is, the sum of Us occupied by machines divided by the RACK size,
which is 42 in most cases).
Aitor Pérez Cedrés
Página 51 de 97
APPLICATION DEVELOPMENT FOR MANAGING AND
MONITORING A DATA CENTRE
In this page will be also an option to show historical records in a line chart of a
particular RACK, and a pie chart will show the percentage of free and occupied space.
This initial prototype does not include a section for this feature because the tools used to
create the prototype do not support charts or storing persistent data. In this prototype is
also missing a button to insert new records, which will be added for the first version of
the system.
4.2 Architectural Design
As we said above, we are using a three layer design, where the three layers are:
presentation layer, business logic layer and data layer.
The presentation layer has the components User Interface, css, static and
javascript.
The User Interface component is responsible of showing the data received from the
business logic layer in an organized way. It also has to show the information effectively,
which means it has to left clear what each thing means, and the possible interactions
with the application. The User Interface takes advantage of css component for defining
the layout and the presentation rules.
The css component is the Cascade Style Sheets which defines rules for rendering the
data in the HTML, as well as providing layout definition for HTML elements.
The static component holds some static files, which means, they do not change over
the time or by an interaction from user; and it provides static content (e.g. images and
user manual).
The javascript component has classes and some logic to make the content of the
HTML (User Interface) pseudo-dynamic; it is pseudo-dynamic because it is not actually
changing the content of the user interface, but just showing and hiding it. However, this
component can also asynchronously change the content of the web page in response of a
user interaction (e.g. pressing a button); but it respects the design restriction that only
the business logic layer can access the data layer, so this component just sends "input
events" from the user interface to the logic layer, which are processed and sent back;
then the javascript component changes only specific parts of the web page with the new
data received from the logic layer.
Aitor Pérez Cedrés
Página 52 de 97
APPLICATION DEVELOPMENT FOR MANAGING AND
MONITORING A DATA CENTRE
The next figure shows the presentation layer component diagram:
Presentation Layer
Javascript
User Interface
1
1
1
static
+user_manual
+images
1
1
1
css
Figure 13 Presentation layer
The business logic layer has two components. One is the logic, responsible of
processing, filtering and sanitizing user inputs. It also is responsible of accessing safety,
efficiently and effectively the data layer to update the application data. In this layer we
can find server side logic to process the data, even from the user or from the data layer,
and transforming it into HTML code interpretable by the web browser. This component
handles everything within the application.
This logic component is also a "security layer" to avoid accessing the data layer from
the user interface; because accessing data layer without using this logic component is
unsafe and it can danger the integrity of the application, provoking malfunction or even
crashing of the application.
The user does not have to know about the functionality of this layer; this layer is
accessed from the presentation layer, which handles the user input and sends preprocessed data to this layer, so it can understand what the user was trying to achieve;
serving in this way the necessary data to the user to complete his goals within the
application.
The component includes has logic functionality which is used several times by logic
component. This component itself does not provide any useful logic functionality to the
user interface, because it only has generic functions, ready to be included in any other
logic component to ease their processing. In this component is included, for instance,
filter functions to validate and sanitize the input received from the user interface. It is
supposed that component javascript in presentation layer should pre-process the input
and send only clean inputs to business logic, but this statement is not always true, so we
have to add some filtering functionality to this layer.
Aitor Pérez Cedrés
Página 53 de 97
APPLICATION DEVELOPMENT FOR MANAGING AND
MONITORING A DATA CENTRE
This component also has data structure definition for certain abstractions the logic
components uses. For instance, it defines a class for a consumption record. These
definitions ease some processing of the data and the process of converting the raw data
into something the presentation layer can understand.
Business Logic layer
logic
includes
Figure 14 Business Logic layer
The last layer is the data layer. This layer is responsible of storing/querying
efficiently and effectively the data used by the application. It will be explained in detail
in chapter 4.4 Database Design. This layer basically holds a relational model and the
relations between its entities. In its corresponding chapter is included a figure about this
layer.
4.3 Detailed Design
We are now introducing the detailed design. In the next sections we will explain in
detail each component. Moreover, we will explain how works each class and its
responsibility, as well as associating them with the real word (e.g. associate user
interface with web browser).
4.3.1 Presentation layer
In this chapter we are describing in detail each component defined in architectural
design, providing a more accurate description on how each class works. The
components will be described by layer, starting from Presentation layer and finishing
with data layer.
In order to perform any activity the user have to login. A guest user is not allowed to
take any interaction with the system but to authenticate. Certain activities are
sometimes an intermediate activity to guide the user to his real goal; for instance, query
machine activity. For a user to query a machine, first he has to query the RACK where
the machine he wants to query is placed at.
We have designed our interface to take almost all the interaction through overview
page. We think it is more intuitive if the user performs a sequence of activities which
change his main view, so during the sequence he is continuously getting feedback on
how the interaction is going. However, we have to take care that any activity do not take
very long to perform, because in that case, the process will be hard to learn and
remember, making the interface not very intuitive and less usable.
Aitor Pérez Cedrés
Página 54 de 97
APPLICATION DEVELOPMENT FOR MANAGING AND
MONITORING A DATA CENTRE
In our “worst case”, the longest task to perform is editing an existing machine.
Assuming the user is logged as administrator, first he will have to query the RACK
where the machine is; then he has to click the machine, so a dialog pops out with the
machine information and the proper button to edit it; and then the user has to update the
desired fields of the machine, and click the proper button to save the changes. Following
this sequence just takes four interactions with the application; it may seem a bit long,
but it actually is not, because some intermediate steps are also final goals (e.g. query
RACK and query machine), so those middle steps are easy to learn and remember, so
learning this new long activity, is just doing two more interactions with the system.
Each activity is designed to fulfill a user need.
We have decided to implement a main page for managing RACKs and machines.
Instead of moving through pages to visualize a RACK, we are taking advantage of
JavaScript to generate a dynamic interface. The main idea is to put the RACKs in the
edges of the interface, and leave the middle space for presenting different content
depending on user interaction.
In this way, we are creating a rich and interactive application, where the user can
explore just by clicking elements of the interface. However, not every element is
interactive; in order to make distinction between interactive and not-interactive, the
mouse pointer will change when it enters a region of interactive element, giving a hint
of what can be the result of the interaction. For instance, when the mouse enters hover a
RACK element, the mouse pointer changes to a magnifying glass, providing the
sensation of “I can explore this element”.
However, we do not want to overload the main page; to avoid this, we are using
dialogs: pop-out dialogs within the page. This dialog is not a classical pop out spam,
which opens in a new window and takes focus. Our dialogs are open as “internal
frames”. The main difference between RACK view and these pop-outs is the drag-able
property of dialogs; moreover, dialogs are overlaid (i.e. over the rest of elements).
This approach of dialogs presents a problem: dirty terminated interactions. For
instance, imagine we query a RACK, then we query a machine and we decide to edit its
information; however, we miss-clicked and queried a different RACK. Let us analyze
now the state of the application: we have a dialog with a form to edit a machine from a
RACK that no longer exists in our interface context.
This situation creates a lack of integrity in the interface, and as consequence, a lack
of integrity in the logic of the application. In order to prevent this risky inconsistent
state, we are creating our dialogs as modal. This basically means: while there exists an
opened dialog, none of the overlaid elements by the dialog are accessible. Now, to
cancel the flow of the action, we have to “cancel” the interaction with the proper button;
so now, the interface knows the interaction was canceled, and it can returns to a
previous state, preserving consistency in the logic.
We can achieve this dynamic main page using a technology called AJAX (described
above in section AJAX. Almost every interaction implies a background asynchronous
request to the server, completely transparent to the user. This approach gives the
sensation of interactive application, instead of web site surfing, becoming easier to
remember and learn how to use the application; since the user does not have to
remember web pages, but interactions (intuitive in many cases), it is easier to learn.
Aitor Pérez Cedrés
Página 55 de 97
APPLICATION DEVELOPMENT FOR MANAGING AND
MONITORING A DATA CENTRE
We are providing a figure with the class diagram; we want to provide a quick
overview just by watching the diagram; then we will go into details. This is the class
diagram for the presentation layer:
javascript
canvas_boxes
filters
consumption_tools
«uses»
static
machine-tools
show_things
«uses»
rack-tools
«uses»
user manual
1
1
images
1
1
User interface
css
login
1
overview
overview css
loginpage css
header_footer css
main
consumption
jQuery cupertino css
1
consumption
Figure 15 Detailed Presentation layer
We have three main components, and the fourth one (static) just holds static content,
such as images and the user manual.
The component user interface is the one responsible of interacting with the user and
presenting the content from the logic layer. The user interface is composed by the
components css and javascript. We can imagine, in other words, the user interface
component as the web page rendered in the browser, with his style rules defined in CSS
and some JS functionality to make the page dynamic.
Login is the page that is firstly presented to any non-logged user. In this page is
presented the header and the footer that will be present in any other page of the
interface. This page has in the middle a login form. It has a field for the user name, a
field for the password, and a login button. The login is a required process to complete
successfully to obtain access to the application. Any non-logged user (guest) who tries
to access any other page will be redirected to login page without showing him any
content. This page can also show an error message in case the user inputs a wrong
username-password combination. In that case, the error will be highlighted in a red box
with an error message describing the error.
Aitor Pérez Cedrés
Página 56 de 97
APPLICATION DEVELOPMENT FOR MANAGING AND
MONITORING A DATA CENTRE
The user is redirected to overview page once he successfully logins into the server. In
this page takes place almost every possible interaction with the prototype. From this
page we can query RACK’s information, machine’s information and the user manual; in
this page it is also included a left menu to navigate to consumption page.
RACK view will be displayed when any RACK is clicked and the user has enough
privileges to see it; a user has enough privileges to query a RACK if he has one or more
machines in that RACK; having a machine means being the responsible of that machine.
This action requires the logic layer to process the input interaction; in other words,
when a RACK is clicked, the interface asynchronously sends a request to logic layer to
generate the content of the RACK view; then the user interface will update the content
between the RACKs and it will print there the content received from logic layer about
RACK view.
If a RACK is clicked twice, then its RACK view will be hidden and the canvas with
phases will be displayed again. If any other RACK is clicked, that RACK information
will be requested and rendered in place of the old one. If a RACK is hidden, either by
clicking it twice, or by closing the view with the cross button, it is not destroyed, it is
just hidden; in case the RACK view is hidden and requested again, it is just shown,
instead of sending again a request to logic layer. This was an optimization to avoid
flooding the server with asynchronous requests; it has the limitation that if another user
updates that RACK, and our user do not request it again, he will not see the updates;
however, we do not expect to have multiple administrators changing the information of
the same RACK concurrently.
A machine can be queried from a RACK view by clicking on that machine; in that
case, the machine view will be shown in a dialog frame, overlaying the rest of
elements, making them inaccessible until the interaction with the dialog finishes. From
this view, we can edit or delete the machine from the schema. In case we want to edit;
our dialog will be substituted by a new dialog with the fields of machine view, but this
time being editable and holding the last value before the edition. The edition and
deletion of machines is a privileged process; so the only one allowed to perform this
operation is administrator.
Finishing the user interface description, consumption page is the one responsible of
presenting electrical consumption data. In this page, the last inserted record for each
RACK is displayed in a table, tagging each column to avoid confusions in value
meanings. Consumption data is grouped by phase group name; at the moment, there are
three group phases:
Phase R
Phase S
Phase T
Aitor Pérez Cedrés
Página 57 de 97
APPLICATION DEVELOPMENT FOR MANAGING AND
MONITORING A DATA CENTRE
In consumption page, we also allow to visualize historical data in a line chart. In this
chart we can appreciate increase or decrease of RACK consumption. Moreover, a pie
chart displays the occupation percentage; presenting free vs. occupied space. These
charts are also generated dynamically, and the consumption records are ordered by
insertion date, showing first (most to the left) the oldest.
As we can see in the figure above, user interface is composed by components css and
javascript. Those components add client-side logic and interactive tools (JavaScript);
CSS stylize and defines the layout of the interface.
Javascript component has separated class by general functionality. For instance,
machine-tools.js provides supporting tools to handle and process the interaction with
machines. Rack-tools.js provides the same utility, but for RACK elements. Some
example of machine tool is: query_machine(). This function is responsible of handling a
user click on a machine, sending the data pre-processed to logic layer, and render the
response in HTML elements already present in the page.
There are more general purpose scripts; for instance show_things.js; this script
provides tools for showing an element given his id, and optionally, hiding another one
in the same call if a second element id is provided. This script also has a function to
expand or compact a RACK schema. Since the schema (where the machines are placed
in a RACK) is too big (42 positions) and it goes out from the page, we have a compact
view for it; the compact view consists on drawing one “gap” in the schema per each 10
“gaps”. Expanded view of the RACK shows the whole RACK, machines and gaps.
Css component has cascade style sheets which contain rules for defining layout and
style. In this component we define every style detail of the interface. This component,
although it does not contain any logic, it is responsible if making the interface attractive
and intuitive; for instance, we cannot change the cursor pointer when the mouse enters a
RACK without this component. This component also allows us to color in red
“dangerous buttons” (e.g. Delete machine).
Aitor Pérez Cedrés
Página 58 de 97
APPLICATION DEVELOPMENT FOR MANAGING AND
MONITORING A DATA CENTRE
4.3.2 Logic Layer
The Logic Layer is responsible of processing the data send from the interface and
generating a proper response. The response can take several formats, listed below:
XML: canvas-boxes.php sends an XML as response defining the connections
between RACKs and phases.
JSON: query_machine.php sends machines as JSON object. The advantage of
JSON is its native conversion between string and object; an object is much
easier to deal with than a string (XML case, we deal with a string unless we
manually parse it into object)
HTML: when we want to just receive a render into a container; for instance,
wardrobe_view.php
Logic component has all the business logic to process inputs from user interface; and
it also has an interface to work with MySQL driver for PHP. This interface abstracts the
process of connecting, manipulating and querying the database through the driver. This
interface is called PHP Data Object (PDO); and it really simplifies the process of
dealing with the database because using the driver directly can become hard, tedious
and it will slow the development process.
This component also separates its classes depending on their purpose. In addition,
this component separates the classes for querying from the ones for committing. In our
case, the classes for querying are:
Wardrobe_view.php; this one generates the HTML for the requested
RACK, so the interface only has to render the content in the proper place.
Phases-xml.php; this class generates the XML for representing the
connections between RACKs and electrical phases. It will be used by JS to
render the phases and their connection with a RACK in the canvas element.
Consumption_query.php; this class generates a JSON object with an array
of records to populate the line chart of historical records.
Query_machine.php; this class also generates a JSON with the information
of a machine, which can very easily access to retrieve the information from.
This object is destroyed after the content is rendered to avoid unauthorized
access.
We have as well classes for just committing the data from a form; for instance, from
a machine form. We can use this class for adding a machine or editing an existent one,
since the action of gather the data of a machine and commit it into database is abstracted
here.
Aitor Pérez Cedrés
Página 59 de 97
APPLICATION DEVELOPMENT FOR MANAGING AND
MONITORING A DATA CENTRE
Then we have some utility classes, for instance, logout.php, which is responsible of
freeing the resources from a PHP session once the user logs out. Then we also have
check_if_logged.php; this class is responsible of checking if the user is properly logged
in the system. And finally we have check_login.php; this class is responsible of logging
users into the system if they provide a valid username and password; as well as creating
a proper session instance for this user to identify him.
We have by other hand, the component includes, who is responsible of defining very
common general operations in the system; for instance, connecting to database. All
“committers” in logic component connect to database by using PDO interface. We
extracted some steps that are always performed, and instead of writing them again and
again, we just “include” them using a PHP directive to include code from other PHP
files.
A very important class is filter_functions.php, which is responsible of providing
essential functions for validating, filtering and sanitizing all the user inputs from user
interface. This class is also a security measure to avoid XSS attacks and SQL injection.
We have to highlight that SQL injection is prevented in the three layers: JS escapes the
content before sending; PHP filters and escape the content as well; PDO interface
provides prepared statements, which are theoretically immune to SQL injection.
Many classes depends on check_if_logged class because they do not carry out their
requested operation is the user does not have a valid session initiated.
Some other classes in includes component are just some content almost static, but we
included it as PHP because if it changes in one site, it changes in the other places as
well. For instance, the footer: maintaining changes is really easy if we use include
directive of PHP because then we only have to change one file in the whole system, and
it will be different in every page.
Aitor Pérez Cedrés
Página 60 de 97
APPLICATION DEVELOPMENT FOR MANAGING AND
MONITORING A DATA CENTRE
Here we include a figure with the detailed business logic layer:
logic
add_rack
check_if_logged
rack_commit
phases-xml
wardrobe_view
machine_commit
check_login
logout
machine_edition
consumption_query
query_machine
connect_DB
filter_functions
leftmenu
footer
header
machine_class
Includes
ConsumptionRecordClass
Figure 16 Detailed Business Logic layer
The last layer is the data layer, but this layer is just the Database, which will be
explained in detail in chapter Database Design.
Aitor Pérez Cedrés
Página 61 de 97
APPLICATION DEVELOPMENT FOR MANAGING AND
MONITORING A DATA CENTRE
4.4 Database Design
We are using a relational data model to design our database. We have chosen to use
this model because we have worked before with him and it gave good results.
Moreover, we have some experience working with this kind of data bases from an
assignment from Files and Databases course.
A relational model is a data model used to afford problems and state the problem
using predicate logic and set theory. In our model, a relation is a set of data describing
objects (machines) or representing data (electrical consumption record). A relational
schema is a definition of relations and the kind of information they will hold. Every
schema has the name of each relation and the name of its attributes. An instance is a
particular finite set of tuples of a given relation at a time instant. We can see the schema
as the structure definition; and the instances as the data itself in that schema. A set of
schemas is called DataBase.
Relational data bases use a language called Structured Query Language (SQL),
which is a declarative language to provide access to databases. This language allows
declaring operations over the data, which can modify the state of the data, or just query
and serve it. The language also includes a Data Definition Language (DDL), which is
used to define the relations and the data type of those relations. DDL is also used for
altering or modifying the structure of the database.
The next figure shows the relational data model for the data base:
consumption_record
allowed_users
PK
PK,FK1
PK
name
password
email
office
phone
rack
record_timestamp
electric_current
machine
wardrobe
PK
PK,FK1,I2
name
responsible
PK
FK2,I1
wardrobe
os
ip
color
type
notes
starting_pos
num_u
FK1,I1
position
name
phase
iface1
iface2
iface3
ip1
ip2
ip3
phase
PK
PK
pos_x
pos_y
U1
id
group_name
Figure 17 Relational model
Aitor Pérez Cedrés
Página 62 de 97
APPLICATION DEVELOPMENT FOR MANAGING AND
MONITORING A DATA CENTRE
The relation allowed_users stores the information about users which have permitted
access to the system. The field password stores a SHA-1 string of the password, so we
never store a password in plain text. It also contains fields to store user personal
information. The primary key of this relation is the username, which is also the user real
name.
The common approach to this problem is to set a unique username, and by other
hand, store the user real name. This approach is commonly used because in a real
problem, you will have users with the same name (e.g. Javier is a very common name),
so you have to define a univocal identifier for each user. This identifier can be a
numeric ID, a random number appended to the user’s name or whatever identifies
univocally the user. In our problem scope, we will not have a big volume of users, and
this problem of repeated user’s name loses relevance. In our scope, if we found two
users whose name is Javier, we can avoid this problem just by assigning one of them his
surname as username. We know we are losing some semantic here, but it is a lose we
can afford, and in back we avoid dealing with user name modification and mismatching
between username and name; moreover, we are planning to use the name of the user as
a field in the machine relation; joining username and user’s name in a single field makes
easier to update and maintain integrity.
wardrobe
PK
FK1,I1
position
name
phase
iface1
iface2
iface3
ip1
ip2
ip3
Figure 18 Wardrobe relation
The relation wardrobe stores information about each RACK in the data centre. An
explicit requisite is the number of interfaces/subnets assigned to a RACK is limited up
to three. If a subnet is associated to a RACK, then that RACK must have, at least, one
interface per subnet open. However, an interface can be connected to a RACK but it
may have not assigned any subnet; in that case, we say the interface is “open”. In the
case an interface is open, the value of the subnet will be “___”. Otherwise, the syntax
of the subnet is the following: “163.117.C.X”, where C is a number between 0 and 255.
The X remains, meaning it can take any value since it will belong anyway to the subnet.
Aitor Pérez Cedrés
Página 63 de 97
APPLICATION DEVELOPMENT FOR MANAGING AND
MONITORING A DATA CENTRE
The name of a wardrobe is a string with maximum length of 20 characters. This
name has not to be unique; we do not care if we have RACKs with repeated name;
because the name is not going to identify our RACKs. For the purpose of identifying
RACKs, we will use a numeric ID, called position, which actually tells the position of
the RACK in the web page. This number later on will let us layout the elements
representing each RACK in the web page. This ID is unique and it is also part of the
primary key.
The last field of wardrobe relation is phase, which is a numeric type, referencing and
connecting wardrobe relation with phases one. In this way we relate data from phases
directly with the RACK they belong to. This field itself describes what phase the RACK
is connected to. It is not unique because it has to cover a limitation of the user interface,
which do not allow swapping phases connection between two RACKs; they way to
“swap” the phase connection between two RACKs is by assigning first two RACKs
two the same phase, and then assign to the second RACK, the ”empty” phase.
phase
PK
PK
pos_x
pos_y
U1
id
group_name
Figure 19 Phase relation
The relation phase is mostly used to store the coordinates to draw the phase element
in a canvas in the web page. This relation’s primary key are the fields pos_x and pos_y;
those fields are numeric and store the (X,Y) position where the phase identified by id
has to be rendered in the web page. The field id is unique in this case, but it is not
included in the primary key because in a first instance, what identified the relation was
the position of the element; later on we included two fields: id and group_name; then, in
order to avoid refactoring, we left it as it was since it still being working. Then to
optimize some queries to id, we built an index for the field.
Aitor Pérez Cedrés
Página 64 de 97
APPLICATION DEVELOPMENT FOR MANAGING AND
MONITORING A DATA CENTRE
consumption_record
PK,FK1
PK
rack
record_timestamp
electric_current
Figure 20 Consumption record relation
The relation consumption_record has a field rack, which is related to wardrobe
relation and means to what RACK a particular consumption record belongs to. There is
another field called record_timestamp, which is a date field to store the timestamp
where a new record is inserted. Those two fields are the primary key of this relation.
This provides an explicit semantic: we cannot take two records for the same RACK at
the same time instant. This semantic is loyal to the reality; in the case that two different
administrators insert a record at the same, into the same RACK, the system will not
allow the operation and an error will be sent to the user through the interface. And this
relation has, of course, a numeric field to store the electrical consumption of a RACK in
a given time.
machine
PK
PK,FK1,I2
name
responsible
FK2,I1
wardrobe
os
ip
color
type
notes
starting_pos
num_u
Figure 21 Machine relation
The relation machine relation is, along with wardrobe, the main focus of the problem
and the design. This relation has a field name, which refers to machine name; it is a
string of 20 characters max length; it can content almost any character of a string to
define the name of the machine. It has also another field called wardrobe, which is also
a foreign key referencing the wardrobe relation. This field has the mean to tell us to
what RACK the machine belongs to. Following the data type of wardrobe's primary
key, it is a small integer and it refers to his parent primary key. Then we have a field
responsible; it makes reference to the name of the user responsible of this machine (i.e.
the user who can see the machine). This field is a foreign key referencing allowed_user
primary key. This field, together with name, are the primary key of this relation,
machine.
Aitor Pérez Cedrés
Página 65 de 97
APPLICATION DEVELOPMENT FOR MANAGING AND
MONITORING A DATA CENTRE
The relation also has some other non-null fields to gather the information of a
particular machine:
os: Operating System
ip: IP address. It is validated against a regular expression to check that only
valid addresses of IPv4 are stored.
color: the color of the machine. This field is an enumerated type { 'Bright',
'Dark' }
type: this defines the kind of machine. It is also an enumerated type { 'UPS',
'Switch', 'KVM', 'Server', 'Storage Server' }
notes: this field allows to introduce some arbitrary text with a maximum
length of 255 characters.
The last two fields are starting_pos and num_u. These fields mean: at what position
within the RACK does the machine start? And, how many rack units does it take going
upward? For example, a machine of a single U, placed at the top of the RACK, will start
at position 42 and it will take 1U. Those fields are both tiny integers (just use one
unsigned byte to store each of them).
4.4.1 Query example
Now let us put in example some optimized queries taking advantage of this model.
The next query is solving the next statement: Get the position of a RACK and the
coordinates of the electrical phase associated to it.
This query is required to print the lines that join the RACK with each electrical phase
in the overview. First we will present the relation algebra, and then the SQL query:
∏
∏
(
)
)))
SELECT wardrobe, pos_x, pos_y FROM
(SELECT wardrobe, phase FROM machine A
JOIN wardrobe B ON(A.wardrobe = B.position) WHERE responsible=’aitor’) C
JOIN phase D ON(C.phase=D.id);
Aitor Pérez Cedrés
Página 66 de 97
))
APPLICATION DEVELOPMENT FOR MANAGING AND
MONITORING A DATA CENTRE
5 Results and evaluation
The coding phase took place, but we do not consider relevant including code details
in the report. Due to our limitation of time, we only developed a prototype of the
application, which can be extended and improved, as specified in chapter Future Work.
In this chapter we include a user manual for administrator; we consider more
complex the possible interactions of administrators, so we just focused on add a User
Manual for them. The activities of a regular user are much fewer and never take more
than two interactions; actually, a regular user can read the User Manual and he will find
it helpful, but he will not be able to perform most of the activities.
We included here chapters for Software Transfer Document, describing the
environment and how it should be configured. A Software Project Management,
including effort estimation, planning and budget.
5.1 User Manual
This document is a user manual of the web application prototype “Data Center
Guardian” sited in http://cpd.lab.inf.uc3m.es.
The document specifies main capabilities and main operations administrators/users
can do.
5.1.1 Sections
This section describes the main views in the application, shown the main options and
specifying main operations that administrators or users can do.
5.1.1.1 Main Page
Overview page is the key point in the application because almost all interaction is
done from here. In this page is presented the distribution of the room (i.e. the RACK
distribution in the room). Depending on who is the user (administrator or regular user),
a certain number of RACKs will be displayed and accessible. If the user is the
administrator, every RACK is displayed and accessible. If the user is a regular one, only
are displayed and accessible the RACKs where he has a machine (i.e. he is responsible
of a machine within that RACK). This page also has a left menu to allow navigation
between the different parts of the application; as well as a link to user manual.
Aitor Pérez Cedrés
Página 67 de 97
APPLICATION DEVELOPMENT FOR MANAGING AND
MONITORING A DATA CENTRE
The next figure shows the distribution of the room seen by the administrator:
Figure 22 Overview page as admin
RACKs are the boxes at the edge, the ones which has name, and in some cases an
interface with an associated subnet. These RACKs are connected to an electrical phase,
which provides power supply to the machines they hold. The boxes in the middle of the
screen are the electrical phases of the room. The lines connecting the RACKs with the
phases are the connections between them; the boxes of the phases have different colors
because they belong to different “groups”. The grey boxes belong to Phase R; the black
ones, to Phase S; and the white ones, to Phase T.
The grey big boxes in the edges means that there is no RACK there, that spot is free.
However they have a “default connection” to a phase; in case a new RACK is added,
that will be the default connection to the phase.
Aitor Pérez Cedrés
Página 68 de 97
APPLICATION DEVELOPMENT FOR MANAGING AND
MONITORING A DATA CENTRE
5.1.1.2 RACK view
In this page we can interact with two elements: the RACKs on the edges and the left
menu. In the case we click on any RACK, the interface will send an event (i.e. HTTP
request) to web server, asking for the information of the clicked wardrobe. The server
will process the request and will send back the response as HTML ready to
asynchronously be rendered in the page, but without refreshing the page itself.
The second possible interaction is with the left menu. This menu allows navigation
between different parts of the application. As administrator, it will provide a reference
to overview (the main page); a reference to consumption, the page where historical
records are displayed; and a reference to User Manual. The user manual will be opened
in a new tab as a PDF object. The reference to consumption will be offered only if the
user is an administrator.
Now let us assume the user has taken the first possible interaction and he querying a
RACK. The next image shows the resulting view:
Figure 23 RACK view as admin
Aitor Pérez Cedrés
Página 69 de 97
APPLICATION DEVELOPMENT FOR MANAGING AND
MONITORING A DATA CENTRE
Now we have five additional possible interactions:
Add machine: this button opens a dialog with en empty form to fulfill and
create a new machine. Only administrator has rights to perform this
operation. This interaction of showing the dialog to add a new machine does
not require the participation of web server.
Query machine: this interaction triggers when clicking on a machine in the
schema (the table to the left). This interaction produces an event, which send
to the server; then the logic layer process this request and sends back the
information of requested machine; after that, the user interface displays the
new information in a machine dialog.
Edit RACK: This button changes the fields Rack name and network by
editable fields, so the current information can be changed. It is also added a
list with possible connections of this rack to an electric phase.
Delete RACK: This button sends an event to logic layer, telling that a RACK
must be deleted. The logic layer will execute the proper update to data layer
and then it will return the new HTML without the deleted RACK.
Close view: This cross in the top right corner of the view hides the current
RACK view. This action does not require interaction with web server.
Aitor Pérez Cedrés
Página 70 de 97
APPLICATION DEVELOPMENT FOR MANAGING AND
MONITORING A DATA CENTRE
5.1.1.3 Edit a RACK
Let us now suppose the user click "Edit RACK". The next figure shows the view:
Figure 24 Edit RACK view
Now the view has editable fields. We can criticize here that the format for the subnet
is not intuitive at all and there are no help text; however, this will be explained in User
Manual, and it should be easy to remember for future interactions.
Moreover, the field connected to appears, meaning the number of electric phase the
RACK is connected to. This field is a list with the possible values for an electric phase.
Once we are in this view, we can commit the changes; committing changes implies
sending the new information to logic layer so it can send the update to data layer. Or we
can discard the changes; in that case, the old values are restored without sending
anything to logic layer. Discarding in this case does not send request to server because it
uses the session storage provided by the web browser to store the original information
of the rack.
Aitor Pérez Cedrés
Página 71 de 97
APPLICATION DEVELOPMENT FOR MANAGING AND
MONITORING A DATA CENTRE
From this view we still can delete the RACK. It is not very intuitive to have this
option here as well, but we did not find any strong reason to remove from here. And we
can expand the RACK, which will give a detailed view of machines' schema.
5.1.1.4 Detailed machine view
Now let us suppose we are back in RACK view, but now we chose to query a
machine; for instance, let us click on "Database Server". The next figure shows the
result of the interaction:
Figure 25 Machine view as admin
Now a dialog pops out, overlaying the screen (i.e. disabling any other interaction
with the overlaid elements). In this view we can see the information of the machine, and
in the case we are administrator, we will have buttons to edit the machine and to delete
the machine.
Aitor Pérez Cedrés
Página 72 de 97
APPLICATION DEVELOPMENT FOR MANAGING AND
MONITORING A DATA CENTRE
5.1.1.5 Edit a machine
In the case we choose to edit the machine, a new dialog will open with a form to
update the current machine data; the next figure shows an example:
Figure 26 Edit machine view
This view is a form with a field per machine information field. The responsible field
is a list with the users registered in the application. Color and type fields are also a list
because they are enumerated fields and they can only take certain values. Every field in
the form is validated before sending them to the logic layer; the fields are also escaped
to avoid Cross Site Scripting attacks and SQL injections. In this form, the two possible
interactions are Save and Cancel.
The view in the case of adding a new machine is the same as editing a machine, but
in this case, the fields contain some default sampling data. In the case of adding a new
RACK, it follows the same behavior as editing RACK, again with some sample data.
Aitor Pérez Cedrés
Página 73 de 97
APPLICATION DEVELOPMENT FOR MANAGING AND
MONITORING A DATA CENTRE
5.1.1.6 Consumption view
Now let us move to consumption page. This page is accessible only by the
administrator. In this page it is displayed a table with the last stored consumption
records. This page differs from the initial prototype since it did not look well and
intuitive at all, and it lacked on data explanation; it means, there were many data and
nothing explained what each field was.
The new design is presenting each phase (Phase R, S and T) in a separated table,
with tags to explain what each field is. The table also has a button to query historical
data. The next figure shows an example of consumption page:
Figure 27 Consumption page
Aitor Pérez Cedrés
Página 74 de 97
APPLICATION DEVELOPMENT FOR MANAGING AND
MONITORING A DATA CENTRE
5.1.1.7 Consumption graphs
In the prototype we have only data for one RACK, so now the table is almost empty.
However, it was tested with some false data to check that it was displayed properly.
Now if we click in the button at the left of the consumption record, it will display a line
chart with historical data and a pie chart with occupation data. The next figure is an
example:
Figure 28 Historical consumption
Aitor Pérez Cedrés
Página 75 de 97
APPLICATION DEVELOPMENT FOR MANAGING AND
MONITORING A DATA CENTRE
5.2 Software Transfer
Our application prototype has a server side installation. The client side only needs a
web browser. We recommend using Firefox 11+ or Chrome 17+, since the application
has been tested and validated under these browsers. The application also works on Inter
Explorer 9, but with many limitations, for instance, in CSS 3 style; IE9 is not supporting
gradient rule, so most of our application look & feel is just not working there.
The server side must gather the hardware requirements listed below:
Dual-core processor at 1.2GHz
1 GB of RAM
120 GB of hard disk storage
LAN Adapter 100MB/s
By other hand, it should gather the following software requirements:
Apache 2 or IIS web server (Apache recommended. Tests performed on him)
PHP 5.3
o Php_mysql
o Php_pdo
o Php_pdo_mysql
PHP module for web server
MySQL 5.X as database server
Support for SSL/TLS
We have already a prototype version of the application deployed under
https://cpd.lab.inf.uc3m.es/; our machine has a Debian Squeeze as Operating System,
and it fulfills the recommended software requirements listed above.
Aitor Pérez Cedrés
Página 76 de 97
The application has to follow the next directory tree:
Root
Document
static
css
*.pdf
*.css
images
Images-jquery
includes
logic
js
*.php
*.php
*.js
*.png
*.gif
*.jpg
*.png
Figure 29 Directory tree
This tree must be followed because the prototype has relative routes to access images and scripts.
APPLICATION DEVELOPMENT FOR MANAGING AND
MONITORING A DATA CENTRE
5.3 Software Project Management
In this chapter we are making an effort estimation using COCOMO4 and function
points5. COCOMO stands for Constructive Cost Model; it is an algorithmic software
cost estimation model. The model uses a basic regression formula with parameters that
are derived from historical project data and current project characteristics.
We are including here a Gantt chart for planning the development process, based on
the estimation obtained from COCOMO. And we also include a budget of the project.
5.3.1 Software estimation
We have made the estimation from the initial prototype built with Axure RP Pro 6.
For effort estimation, we are using COCOMO; and we are getting function points by
identifying the following elements for each screen:
External Inputs
External Inquiry: External queries to the system
External Output
Internal Logical Files. Files or tables developed and consulted
External Interface File: External files (e.g. LDAP query)
We have identified seven main screens from the initial prototype: Login screen,
overview page, rack view, rack edition view, machine view, machine edition view, and
consumption page. Now let us analyze the screens:
4
http://en.wikipedia.org/wiki/Cocomo
5
http://en.wikipedia.org/wiki/Function_points
Aitor Pérez Cedrés
Página 78 de 97
APPLICATION DEVELOPMENT FOR MANAGING AND
MONITORING A DATA CENTRE
Login: Login screen.
Figure 30 Login screen
o External Inputs: None.
o External Inquiry: One with a low complexity, include two data types
(user and password) and one file (users table)
o External Output: None.
o Internal Logical Files: One low, users table.
o External Interface File None.
Overview: Main page and overview of the datacenter.
Figure 31 Overview screen
o External Input: None
o External Inquiry: None
o External Output:
Map view: One with a high complexity, several data types and
several files involved.
Temperature: One with a low complexity.
o Internal Logical Files: Four of low complex (wardrobe, users, temp and
machine)
o External Interface File: None.
Aitor Pérez Cedrés
Página 79 de 97
APPLICATION DEVELOPMENT FOR MANAGING AND
MONITORING A DATA CENTRE
Rack view: Rack details.
Figure 32 Rack view screen
o External Input: Two, low complexity: add machine and edit machine.
o External Inquiry: One of medium complex (view of wardrobe)
o External Output: None.
o Internal Logical Files: Three of low complex (wardrobe, users, machine)
o External Interface File: None.
Rack edit: Update Rack information.
Figure 33 Rack edition screen
o External Input:
Rack data: One of medium complexity.
Buttons: Two of low complexity (discard an save)
o External Inquiry: None.
o External Output: None.
o Internal Logical Files: Three of low complex (wardrobe, users, machine)
o External Interface File: None.
Aitor Pérez Cedrés
Página 80 de 97
APPLICATION DEVELOPMENT FOR MANAGING AND
MONITORING A DATA CENTRE
Machine view: Machine details.
Figure 34 Machine view screen
o External Input: Three of low complex (Buttons edit, delete and back)
o External Inquiry: One of medium complex (view of Machine)
o External Output: None.
o Internal Logical Files: Three of low complex (wardrobe, users, machine)
o External Interface File: None.
Machine edit: Update Machine information.
Figure 35 Machine edition screen
o External Input:
Machine data: One of high complexity.
Buttons: Two of low complex (Save, discard)
o External Inquiry: None.
o External Output: None.
o Internal Logical Files: Two of low complex (wardrobe, machine)
o External Interface File: None.
Aitor Pérez Cedrés
Página 81 de 97
APPLICATION DEVELOPMENT FOR MANAGING AND
MONITORING A DATA CENTRE
Consumption: Display consumption data.
Figure 36 Consumption screen
o External Input: None.
o External Inquiry: One of low complex (only one table and a few fields)
o External Output: None.
o Internal Logical Files: One of low complexity (one table, consumption)
External Interface File: None.
Now we are gathering all this results into a table, so we can have a more general
view of the data:
Module
External
Input
External
Inquiry
External
Output
0
1L, 1H
0
0
0
0
0
Internal
Logical
Files
1L
4L
3L
3L
3L
2L
1L
External
Interface
File
0
0
0
0
0
0
0
Login
Overview
Rack View
Rack Edit
Machine View
Machine Edit
Consumption
0
0
2L
2L, 1M
3L
2L, 1H
0
1L
0
1M
0
1M
0
1L
Total
9L, 1M, 1H
2L,2M
1L, 1H
17L
0
Table 31 Summary function points
Aitor Pérez Cedrés
Página 82 de 97
APPLICATION DEVELOPMENT FOR MANAGING AND
MONITORING A DATA CENTRE
Now we have to input this data into COCOMO application6
Figure 37 COCOMO SLOC input
In this table we have to input the data we gathered into the table. Since the
application does not have PHP as Language, we are choosing HTML 3.0 because it has
a similar change multiplier with PHP and JS.
We have a total of 181 function points, with a change multiplier of 15; COCOMO
estimates 2715 lines of code.
6
http://sunset.usc.edu/csse/research/COCOMOII/cocomo_main.html
Aitor Pérez Cedrés
Página 83 de 97
APPLICATION DEVELOPMENT FOR MANAGING AND
MONITORING A DATA CENTRE
Now we have to adjust the scale factors:
Figure 38 COCOMO scale factors
Precedents: We consider that we are experienced programming PHP and
JavaScript, also we have experience designing user interfaces and databases.
Development Flexibility: We consider that we have a lot of flexibility in the
project. However, project requirements may change during the development.
Architecture: We do not have to take actions to risk resolution.
Team cohesion: Extra high cohesion because the team has only one member.
Now let us go for the schedule:
Figure 39 COCOMO Schedule
We have a strict deadline for the project, so we consider a very low schedule.
Aitor Pérez Cedrés
Página 84 de 97
APPLICATION DEVELOPMENT FOR MANAGING AND
MONITORING A DATA CENTRE
Now let us move to correction factors:
Figure 40 COCOMO Correction factors
Reuse: We don’t have additional considerations in system reusability (referred to
the code, not the interfaces)
Pdif: We consider that it is easy to program in Javascript and php.
Pers: We think it is very high because we are only the responsible of the project.
Prex: We have experience in this type of software development.
Fcil: We use an IDE and tools to ease the development.
Aitor Pérez Cedrés
Página 85 de 97
APPLICATION DEVELOPMENT FOR MANAGING AND
MONITORING A DATA CENTRE
The final result of the calculation is:
Figure 41 COCOMO Final result
Summarizing the data on this table, the application will take 2715 lines of code; it
actually has 2300 in the prototype, but this mismatch of 400 lines of code is produced
by PHP include statement, which allows to add PHP code defined in other file into the
file where include is called; reducing in this way the number of lines of code.
Remember that we have one component just for this purpose: defining generic functions
to be included many times in many places (e.g. connect_DB.php).
The schedule is estimated to take around 3,9 months. This estimation is also correct
since we have just one semester to work on Bachelor Thesis. This fact implies that no
delays are allowed, because it would provoke a great impact; and we will go out of time.
The estimated staff is 1,2 persons. Since we cannot divide a person, let us conclude
that this project will need more than one person, but less than two; this means that one
person will have to work hard, and probably will go with almost no time to deliver the
project; by other hand, two persons will be too much, and it would be a waste of
resources; however, the project will end earlier, but with a higher cost.
Aitor Pérez Cedrés
Página 86 de 97
APPLICATION DEVELOPMENT FOR MANAGING AND
MONITORING A DATA CENTRE
The next two tables show the lines of code of the prototype:
PHP
./errorPage.php
./includes/connect_DB.php
./includes/consumptionRecordClass.php
./includes/error_frame.php
./includes/filter_functions.php
./includes/machine_class.php
./includes/header.php
./includes/footer.php
./includes/leftmenu.php
./logic/add_rack.php
./logic/check_if_logged.php
./logic/check_login.php
./logic/consumption_query.php
./logic/logout.php
./logic/machine_commit.php
./logic/machine_edition.php
./logic/phases-xml.php
./logic/query_machine.php
./logic/rack_commit.php
./logic/wardrobe_view.php
./index.php
./overview.php
./consumption.php
TOTAL
Lines
23
45
9
4
46
18
4
13
9
55
18
32
42
6
87
65
40
84
95
143
48
204
259
1349
Table 32 PHP lines of code
Javascript
./js/canvas_boxes.js
./js/consumptiontools.js
./js/filters.js
./js/machine-tools.js
./js/rack-tools.js
./js/show_things.js
TOTAL
Lines
134
130
85
309
206
77
941
Table 33 JavaScript lines of code
Aitor Pérez Cedrés
Página 87 de 97
5.3.2 Planning
Now we are presenting a Gant chart, generated using the tool Microsoft Visio 2010:
Note: In CD documentation exists a PDF document for a better view of Gant chart.
APPLICATION DEVELOPMENT FOR MANAGING AND
MONITORING A DATA CENTRE
5.3.3 Budget
Human resources
The total number of hours to spend during the life of the project was estimated using
the tool COCOMO
Category
Project Manager
Analyst
Designer
Developer
TOTAL
Cost/Hour
60,00€
50,00€
40,00€
30,00€
#Hours
16
76
20
304
416
Total €
960€
3.800€
800€
9.120€
14.680€
Table 34 Budget: Human resources
Software costs
This table shows the costs for the software required to generate prototype and the
documentation.
Concept
Microsoft Office 2010
Axure RP Pro 6
TOTAL
Cost
379€
466€
845€
Table 35 Budget: Software costs
Hardware costs
This table shows the server required to deploy our application and the laptop to
develop the project.
Concept
Asus laptop P52JC
Super Micro 2U
TOTAL
Cost
620€
1.900€
2.520€
Table 36 Budget: Hardware costs
Aitor Pérez Cedrés
Página 92 de 97
APPLICATION DEVELOPMENT FOR MANAGING AND
MONITORING A DATA CENTRE
Consumables
This table shows the costs of consumables, for instance, the papers and CDs. It is
also included a printer to print the documentation.
Concept
Other expenses
Printers HP LaserJet 1020
TOTAL
Cost
180€
214€
394€
Table 37 Budget: Consumables
Summary:
Concept
Human resource
Hardware
Software
Consumables
TOTAL
Cost
14.680€
845€
2.520€
394€
18.439€
Table 38 Budget: Summary
Final budget
We consider a 10% risk because the requirements are not fixed and may change,
since they are not strict at all; moreover, the deadline is also fixed and it is a very short
period of time.
Concept
Cost
Indirect cost (5%)
Profit (10%)
Risk (10%)
TOTAL before taxes
Taxes (18%)
TOTAL
Cost
18.439 €
912 €
1.843 €
1.843 €
23.039 €
4.147 €
27.186 €
Table 39 Budget: Final Budget
Aitor Pérez Cedrés
Página 93 de 97
APPLICATION DEVELOPMENT FOR MANAGING AND
MONITORING A DATA CENTRE
6 Conclusions
In the next chapter I am summarizing technical and personal aspects of the project.
For instance in technical knowledge, I quote some of the knowledge and courses where
I learnt important technologies I have applied in the project.
Although there is some knowledge I did not have when I started the project, but I had
to learn in order to complete the project successfully. I would like to point out the strict
deadline for the project is a very serious constraint; which has a negative impact of the
quality of some projects, because it is impossible to solve some problems in just four
months, while at the same time the students has courses and lectures to attend.
6.1 Technical knowledge
For the development of this project I had to use almost everything I learnt during
these four years of Bachelor. By one hand, I had to apply my knowledge of software
engineering to make a shape of the problem. I also had to apply analysis concepts to
realize what the project actually need and what I actually thought.
By other hand, I had to apply my knowledge from Files and Databases because this
project is big enough to discard the option of storing application data in a text file. In
other words, for this application I had to design a database, fitting to problem needs in a
efficient way. However, the project has some constraints, and since the main focus of
the project are not databases, I made some simplifications in the relational model, just to
make my coder life easier.
I also had to apply the knowledge from User Interfaces course, where I learnt web
technologies; like HTML and CSS, JavaScript and PHP. Moreover, I learnt about
evaluating interfaces, and I realized also the importance of a good interface design, the
usability and simplicity of interfaces.
My knowledge in Distributed Systems also helped me to understand how web
technologies works. My courses about Security Engineering also has been a great help
during the whole Bachelor because there I learnt about the importance of protecting
your application; moreover, in that courses I learnt about the importance of
implementing security from the beginning; and how to protect your web application
against the most common attacks: XSS and SQL injection.
In the project I also have learnt about installing and configuring a web server;
moreover, I had to configure the web server to work under SSL, applying concepts from
different courses (SSL from security, web servers from Web Information Technologies)
to solve a problem.
The application should have taken 2715 lines of code; it actually has 2300 in the
prototype, but this mismatch of 400 lines of code is produced by PHP include statement,
which allows to add PHP code defined in other file into the file where include is called;
reducing in this way the number of lines of code. Remember that we have one
component just for this purpose: defining generic functions to be included many times
in many places (e.g. connect_DB.php).
Aitor Pérez Cedrés
Página 94 de 97
APPLICATION DEVELOPMENT FOR MANAGING AND
MONITORING A DATA CENTRE
Related to web technologies, I had to learn some key concepts of JavaScript, for
instance, its native support for JSON. I had to learn JSON as well because I read it had
better performance than XML, moreover if it is using JS. AJAX is an important
technology I had to learn in depth. I knew what AJAX was but I barely worked with it
before; so I had to read some documentation to understand and being able to apply the
technology in the project.
Very important as well is the knowledge about using canvas element from HTML 5
specification. I never have worked before with that element; so I had to read some
examples and look for a good API to use it.
6.2 Personal conclusions
In this project I found very interesting the usage of many different technologies
working together properly; offering a solution to a real problem. It was also an
important change the way of getting into the problem; I mean, in a course assignment,
when you had doubts, you simply go to Problem_Statement.pdf and read it again
looking for your answer. But in this case, this was a real world problem, nobody tells
you how to solve it. This change of environment was really interesting, and I think I
adapted properly.
In this project I also had to make some memories and rescue some knowledge from
past courses of the Bachelor. For instance, I had to remember my knowledge from SQL
and databases in general, because there was a long past year not using that technology,
while at the same time, having to learn new things. However, at its moment I learnt
them well, so it was not very difficult to remember in the end.
I would like to point out the strict deadline for the project is a very serious constraint;
which has a negative impact of the quality of some projects, because it is impossible to
solve some problems in just four months, while at the same time the students has
courses and lectures to attend.
Aitor Pérez Cedrés
Página 95 de 97
APPLICATION DEVELOPMENT FOR MANAGING AND
MONITORING A DATA CENTRE
6.3 Future Work
The application right now is a prototype, but it has the basic functionality for
working properly in the lab as it was intended
The future works are listed below:
Add temperature sensor to the room
A sensor of temperature in the room which sends records about the
temperature of the room; so the application will be able to display the current
temperature at that moment. The application will be also capable of storing those
records, so they can be later on shown in a chart.
Machine monitoring
If the user allows it, we can install a daemon to monitor some basic
parameters of his machine, for instance, CPU usage, percentage of free disk and
RAM usage. The daemon must send to the application periodically these data, so
we can keep an updated tracking of the machine to print a relevant value. We
could also store those records and later on print them in a chart.
User management
In the prototype, the user management is done through the application
phpMyAdmin, installed in the server. We can create a page for administrators to
manage the users registered in the application from the application; that will be
much more comfortable than accessing phpMyAdmin, which is actually a
database management application.
Login through LDAP
Connect the application to log the users through LDAP, so we delegate the
task of authenticating users to a centralized login server. The LDAP server is
already installed and working in the Lab. Making these two platforms work
together is an interesting point for building an application that can be integrated
with other services.
Mobile devices
Creating an application for Android to allow querying information from the
smart phone. It could be included a notification system to alert the user
depending on some parameters (temperature or machine disk usage). This future
work requires first to integrate a temperature sensors and the possibility of
monitoring a machine.
Aitor Pérez Cedrés
Página 96 de 97
APPLICATION DEVELOPMENT FOR MANAGING AND
MONITORING A DATA CENTRE
Translation to Spanish
Translating the page to Spanish and offer both versions. This option is
interesting because the mother tongue in the Lab is Spanish.
Custom alerts
Allow users to set some conditions that in case they happen, they get notified,
by email for instance. This requires, at least, the temperature sensors and the
monitoring daemon working.
ACLs
Implement ACL in the system. This feature allows to set roles to users, so we
will not need anymore the account for administrator. Moreover, this can allow
other users to query a machine even if they are not responsible. For instance, you
are responsible of maintaining a mail server, but your boss wants to query that
machine information as well. With ACLs is possible because the person not
responsible of the machine would be allowed to query the machine.
Customization of room distribution through XML specification
Adapt the application to read an XML file where the distribution is defined, so
the application will be flexible to be used in other Data Centers without the need
of changing the source code.
Export/import configurations
Export the information of the system to XML file. For instance, the machines
within a RACK; this helps a lot for loading many machines at once, instead of
adding one by one from the application. The same can be done for RACK
information.
Development of API to allow users to build their own modules or features to
their machines.
The creation of an API to allow users to develop for our application; the main
idea is users to develop their own features for their machines. For instance, an
SSH command to shutdown the machine from our application.
Widget for controlling your own machines
The creation of a Windows Desktop widget to allow some basic tasks to be
performed from the desktop, without having to open the web browser for
interacting with the application.
Aitor Pérez Cedrés
Página 97 de 97