1
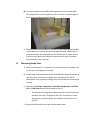
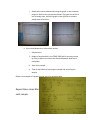
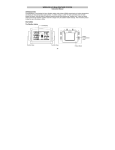
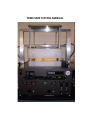
TRMS 5000 TESTING MANUAL
Operator Interface Layout:
I.
Turning the TRMS 5000 on.
a. Make sure that all four of the switches below the displays are in the
down position (shown on right).
b. Flip the power switch to the on position (shown on left).
c. Refer to the TRMS USER’S MANUAL for any other required assistance to
turn on the Machine.
II.
Inserting a sample into the TRMS 5000
a. Pull the air spring pressure adjustment knob (shown on right) out and
turn it clockwise until the pressure gauge (shown on left) reads at least
80 psi. This should lift the hot-plate assembly up, so that it is at the top of
the guide-rods.
b. Insert the sample in the middle of the sample area. If the sample does
not completely cover the sample area, then use foam to protect against
heat loss on the sides (As shown below).
c. Carefully turn the knob counter-clock wise so that the hot-plate assembly
is flush against the sample. Once the hot-plate is secure, release the airpressure and push the knob back into the locked position. Make sure to
press the foam against the sample to remove any air space to prevent
any convection from occurring.
III.
Observing Steady State
a. When recording data, it is important to have the sample in a steady state
so that the flux readings are accurate.
b. Steady state is observed when the hot and cold plate temperatures are at
their set points, and the flux readings are not changing. This will be
observed by using computer readings from the heat sensors connected to
a laptop.
c. Observe the Hot Plate Temperature, Cold Plate Temperature, Hot Plate
Flux, & Cold Plate Flux (As shown below in step D).
i. The red lines on both graphs represent the Hot and the blue lines
represent the Cold. The graph on the top in the picture is of the
Temperature, while the graph in the bottom of the picture is of
the Flux.
d. Record down data after you have reached steady state.
i. Steady state can be observed by using the graph on the computer
program. Observe the two pictures below. The graph on the left is
not at steady state, while the graph on the right has a constant
steady state of heat flux.
e. Also record down other information such as;
i. Sample name.
ii. Height of sample while in the TRMS 5000 (which you may record
by using a caliper to measure the distance between both hot &
cold plates.
iii. Area of the sample.
iv. Time of day & date of inserting the sample and removing the
sample.
Below is an example of a proper journal entry for recording data.
Repeat these steps after
each sample.