1
GIS TOOL - GLOBALISM
_______________
A Thesis
Presented to the
Faculty of
San Diego State University
_______________
In Partial Fulfillment
of the Requirements for the Degree
Master of Science
in
Computer Science
_______________
by
Miteshbharthi B. Gosai
Summer 2011
iii
Copyright © 2011
by
Miteshbharthi B. Gosai
All Rights Reserved
iv
DEDICATION
I dedicate this thesis to my dear parents and sister, for their encouragement and their
unconditional love which they bestowed upon me every time I needed it, and their belief that
one day I could make an achievement & to all my dear friends for their wonderful support
during this entire tenure and for the times to come.
v
ABSTRACT OF THE THESIS
GIS Tool - Globalism
by
Miteshbharthi B. Gosai
Master of Science in Computer Science
San Diego State University, 2011
The education culture is adapting more and more electronic means of information to
teach and learn different area. The inspiration behind the development of this software is to
increase student interest in learning history by developing an interactive GIS application. The
tool is mainly anticipated for the use of students of Helix High School. The tool provides the
functionality to describe data related to “Efforts made towards Globalism” on a map with
several geographical features.
The tool also has external links to the internet for further reading, as well as a visually
pretty GUI to help students to interact with it and learn history easily. Usage of this tool
would help to motivate students to learn history related topic effortlessly, which usually
students find a little bit mind-numbing.
vi
TABLE OF CONTENTS
PAGE
ABSTRACT...............................................................................................................................v
LIST OF TABLES................................................................................................................. viii
LIST OF FIGURES ................................................................................................................. xi
ACKNOWLEDGEMENTS.......................................................................................................x
CHAPTER
1
INTRODUCTION .........................................................................................................1
2
TECHNOLOGY ............................................................................................................3
2.1 Java ....................................................................................................................3
2.2 Map Objects Java Edition ..................................................................................4
3
THE REQUIREMENTS................................................................................................6
3.1 Data Requirements.............................................................................................6
3.2 Platform Requirements ......................................................................................6
3.3 Functional Requirements ...................................................................................7
3.4 Student Centric Requirements ...........................................................................8
4
PROTOTYPING............................................................................................................9
5
SOFTWARE DESIGN ................................................................................................11
5.1 High Level Architecture Diagram ...................................................................11
5.2 Classes and Class Diagram ..............................................................................12
6
MAPOBJECTS’ CONFIGURATION WITH NETBEANS IDE................................15
7
MAPOBJECTS TOOLBARS......................................................................................19
7.1 com.esri.mo2.ui.tb.projecttoolbar ....................................................................19
7.2 Mapobjects Toolbars........................................................................................19
8
CUSTOM TOOLBAR .................................................................................................21
9
PROJECT LAYER ......................................................................................................27
10 ADDITIONAL TOOLS...............................................................................................30
10.1 Co-Ordinates Display.....................................................................................30
10.2 Help Window and Tooltips............................................................................31
vii
10.3 Display Info ...................................................................................................31
10.4 King Toolbar..................................................................................................32
11 SCREENSHOTS..........................................................................................................34
11.1 Login Screen ..................................................................................................34
11.2 Map View.......................................................................................................34
11.3 Add User ........................................................................................................35
11.4 Delete User.....................................................................................................36
11.4 DisplayBattle Name .......................................................................................36
11.5 Wiki Page.......................................................................................................36
12 FUTURE ENHANCEMENT.......................................................................................38
13 CONCLUSION............................................................................................................39
BIBLIOGRAPHY....................................................................................................................40
viii
LIST OF TABLES
PAGE
Table 5.1. Importing Classes and Classes Used for Development ..........................................12
Table 8.1. Legend of Custom Toolbars ...................................................................................21
ix
LIST OF FIGURES
PAGE
Figure 4.1. Project development cycle.......................................................................................9
Figure 4.2. GIS GLOBALISM tool main screen.....................................................................10
Figure 5.1. High level architecture diagram. ...........................................................................11
Figure 5.2. InitMap. .................................................................................................................13
Figure 5.3. Class diagram. .......................................................................................................14
Figure 6.1. NetBeans library manager. ....................................................................................16
Figure 6.2. NetBeans new library. ...........................................................................................16
Figure 6.3. NetBeans library manager selecting class path. ....................................................17
Figure 6.4. NetBeans browse JAR folder. ...............................................................................18
Figure 6.5. NetBeans IDE........................................................................................................18
Figure 7.1. MOJO ProjectToolbar. ..........................................................................................19
Figure 7.2. MOJO ZoomPanToolbar. ......................................................................................19
Figure 8.1. Custom toolbars.....................................................................................................21
Figure 8.2. Print dialog. ...........................................................................................................22
Figure 8.3. Add layer dialog window. .....................................................................................22
Figure 8.4. Hotlink button........................................................................................................25
Figure 9.1. Sample of Alexander.csv file. ...............................................................................27
Figure 10.1. Co-ordinates display............................................................................................30
Figure 10.2. Help window. ......................................................................................................31
Figure 10.3. Display info. ........................................................................................................32
Figure 10.4. King toolbar.........................................................................................................33
Figure 11.1. Login screen. .......................................................................................................34
Figure 11.2. Map view. ............................................................................................................35
Figure 11.3. Add user...............................................................................................................36
Figure 11.4. Delete user. ..........................................................................................................36
Figure 11.4. Map view with battle names................................................................................37
Figure 11.5. Wiki page.............................................................................................................37
x
ACKNOWLEDGEMENTS
I would like to convey my thanks to my advisor Dr. Carl Eckberg for giving me an
opportunity to work on this thesis project and for his constant guidance, support and
motivation throughout this project.
I am obliged to Professor William Root and Dr. Andre Skupin for being on my
committee and for their help and co-operation.
I would also like to express my sincere appreciation to Mr. Richard Sutton from Helix
High school for having faith in me with this project and sparing his valuable time for the
same.
1
CHAPTER 1
INTRODUCTION
Technology is entering every area and it is providing its advantages to represent
things in an easily understandable way. Today in this fast growing era every single object is
surrounded by some means of technology. Teaching is the one of the best example of it.
Teaching should welcome new technology easily as it provides a better way for students to
learn dry subjects interestingly and interactively.
History is the best example of this. Students usually find it hard to read and learn
about history. Many students don’t prefer to read history books. The teaching culture has
been changing over the past decade and use of electronic media is increasing. Electronic
teaching has been one of the most important mediums adapted since the increase in the use of
computers and the internet. Students are more receptive when taught via a visual and
entertaining medium than through the more usual method of book reading. Many students are
more inclined to newer technologies and are have appetite to learn and use them.
GIS Multimedia Tool for Globalism is an interactive tool which allows Helix High
School students to understand and learn about the efforts of ancient kings towards Globalism
in a friendly format using text, pictures and links to learn from the internet. It will help to
create more interest among students to learn about globalism. This tool provides the
geographical location of major battles fought by kings, their causes and consequences and
conclusion in a visual format which should make learning history interesting. The tool
provides very easily understandable interfaces which will easily accepted by students and
help them to gain knowledge about the subject.
This tool has been developed using MapObjects and Java technologies. NetBeans has
been used as IDE (Integrated Development Environment) to design and implement the tool.
MapObjects is a suite of Java-based developer components for creating client or server-side
mapping and GIS applications [1]. The release of MapObjects Java Standard Edition allows a
developer to build custom map applications using the open standard Java programming
2
language. Software developers can customize basic functionality to meet user specific
requirements.
The report has been organized in thirteen chapters. The first two chapters concentrate
on are introduction about the thesis and the technologies that were used in the development
of the tool. Further chapters will discuss more about the thesis in detail in the following
order.
Requirement
Prototyping
Design
Implementation
Tools by MapObjects
Customtoolbar
MapLayers
Screenshot
Conclusion and Future Work
3
CHAPTER 2
TECHNOLOGY
This chapter provides information about the technologies used to accomplish the
thesis project. Technology requirements were supervised and suggested by Dr. Carl Eckberg.
Map Objects Java Edition and Java have been used to develop this software.
2.1 JAVA
Java has noteworthy advantages over other programming languages and it provides
integration with Map Objects Java Edition easily. Java’s platform independence, early
deployment and automatic memory handling was an added advantage in selecting Java as the
development language.
Java is simple.
Java is considered to be an easy to use object-oriented programming language, Java
has replaced the complexity of multiple inheritance in C++ with a simple structure called an
interface, and also has eliminated the use of pointers. Java is considered to be simpler than
some other programming languages because Java uses automatic memory allocation and
garbage collection. The simple syntax makes Java programs easy to write and read [2].
Java is object-oriented.
Java allows you to create modular programs and reusable code. The classes can be
extended and re-used when required to add new features and enhance code in the future. An
object’s properties are described by using data members, and its behaviors are described by
using methods. A class is like a template for objects. The process of creating an object class
is called instantiation. Java consists of one or more classes that are arranged in a hierarchy, so
that a child class is able to inherit properties and behaviors from its parent class [2].
Java is platform independent interpreted.
The significant advantage of Java is its ability to run in different OS (Operating
System). The Java interpreter converts the code into byte code which can be run on any Java
4
Virtual Machine using JRE(Java Runtime Environment) on Windows, Linux etc. Java even
provides multiple deployment options like jar files [3].
Java is secure.
Java is one of the first programming languages to consider security as part of its
design. The Java language, compiler, interpreter, and runtime environment were each
developed with security in mind. [3]
Java is robust.
Robust means reliable and no programming language can really assure reliability.
Java puts a lot of emphasis on early checking for possible errors, as Java compilers are able
to detect many problems that would first show up during execution time in other languages
[3].
Java is multithreaded.
Multithreaded is the capability for a program to perform several tasks simultaneously
within a program. In Java, multithreaded programming has been smoothly integrated into it,
while in other languages, operating system-specific procedures have to be called in order to
enable multithreading. Multithreading is a necessity in visual and network programming [3].
2.2 MAP OBJECTS JAVA EDITION
Map Objects Java Edition (MOJO) is the core Java application programming
interface used for building this GIS application. MOJO is a developer’s tool kit to use to
depict map functionality for users. It includes a set of JAR files containing pure Java
components that can be used to develop a usable stand-alone GIS application or to add maps
to other applications [4]. MOJO is a powerful collection of client and server side components
that developers can use to build custom, cross-platform geographic information science (GIS)
applications. It comes with a suite of high-level visual Java Beans components which can be
integrated with multiple IDE’s, these beans allow drag and drop development.
Dr. Carl Eckberg teaches a GIS class (Geographic Information Science) at San Diego
State University which provides in depth knowledge about Map Objects and the class notes,
a comprehensive guide to using Map Objects, was one of the main criteria for choosing Map
Objects.
5
Development has been done with intregrating MOJO with NetBeans IDE. Details
about how to integrate MOJO with NetBeans have been covered in Chapter 6. MOJO is not
an end user application; it is a developer’s tool kit. It includes a set of JAR files containing
pure Java components that can be used to develop a usable stand-alone GIS application or to
add maps or map functionality to other applications [1].
Key features, as cited from the Map Objects Java Edition brochure, which can be
found at [4] are following:
Wide Range of GIS Capabilities. Applications which are built using Map Objects
Java Edition can support activities such as labeling map features, thematic mapping,
panning and zooming through multiple map layers, specifying projections, querying
spatial and attribute data, performing geometric operations, measuring distances,
displaying real time geographic data, and creating layouts.
Ability to Combine Multiple Distributed Data Sources. By using applications created
with Map Objects Java Edition, end users can combine local data with Internet and
Intranet data to create their own customized maps and easily integrate these with
existing application architectures. Supported data formats include, industry standard
shapefiles, ArcSDE layers, ArcIMS image and feature services, image formats such
as BMP, TIFF, PNG, JPG, GIF, and MrSID, CAD (DGN, DXF, and DWG), military
formats, and much more. You can also use Map Objects Java Edition to access files
from your own custom, industry specific data sources for easy integration.
Ability to deploy ones Applications over the Web. One can easily distribute Map
Objects Java Edition applications over an internet or intranet through browser hosted
applets or simplify web delivery of your application with the use of Sun Java web
start technology, the industry standard launching mechanism for distributing Java
applications over the web.
Helpful Tools for building a user interface. By using the rich Swing components
included with Map Objects Java Edition, you can quickly build applications that
include functional toolbars, dynamic symbol control, query dialogs, overview and
insert maps, and intelligent legends that make your custom applications easy to use
and even easier to develop.
Server side (J2EE) Components. The server side map component in Map Objects
Java Edition allows developers to build map services, Java Server Pages (JSPs) and
servlets, or custom Enterprise JavaBeans (EJB) Web based mapping applications.
Several extensive sample applications based on JSPs and EJBs are provided to
demonstrate how to build robust Web applications with the server side map objects.
In addition MOJO can be used with ArcIms to create dynamic maps on the web.
6
CHAPTER 3
THE REQUIREMENTS
GIS TOOL-GLOBALISM is a tool developed to assist students and teachers of
history at Helix High School. The thesis has been completed under the supervision and
guidance of Dr. Carl Eckberg from the San Diego State University Computer Science
department and Mr. Richard Sutton from the Helix High School history department.
The requirements gathered have been classified into:
Data requirements
Platform requirements
Student centric requirements
Functional requirements
3.1 DATA REQUIREMENTS
The data requirements include the data that should be represented in the tool. The
display of data is covered in the Functional and Student Centric Requirement sections.
The data requirements were gathered from Mr. Richard Sutton. He helped me to
identify Kings which tried to conquer the whole world.
For each king/emperor the thesis would cover: Countries ruled by the King, battle
site, reason for battle, description of battle, result.
3.2 PLATFORM REQUIREMENTS
The platform requirements, including the development language that should be used
and the GIS solution that should be employed to develop the tool, were gathered from
Dr. Carl Eckberg.
The GIS tool shall be developed using:
JAVA
MOJO
7
The reason behind using these technologies is to have uniformity in the projects
developed for Helix High School. The technology requirements have been discussed in detail
in Chapter 2.
3.3 FUNCTIONAL REQUIREMENTS
The functional requirements mainly include the Graphical User Interface (GUI)
requirements which a user would use to interact with the tool. The requirements were
gathered from Mr. Richard Sutton and Dr. Carl Eckberg.
These requirements cover the tools that shall be provided, the behavior of the tool to
different actions, and any other GUI requirements.
The tool should be installed to any drive.
The tool should load with a login screen.
After providing correct credentials the tool should come up with a world map
displaying the main battle fought by respected king.
Map should also display countries ruled by King with different color than other
countries.
A user should be able to select battle event and read more about it from text file or
should be able to go internet to learn more.
The tool shall provide tools to zoom in and zoom out and it should be capable of
adding more layers to the map.
A user should get information about the tool when he rollovers the mouse onto any of
the tools in the toolbar.
The software should provide to add and remove functionality for label to main battle
sites.
A user should be able to go on the internet to read more about a particular battle.
A user should be able to clear and again add the countries.
A user should be able to select an option to view different kings.
Hotlinks: An important requirement in the project – Hotlink, is that after clicking on
the battle sites, it opens a window giving information about the selected battle site.
Hyperlink: This tool should allow the user to go to external links to get more
information about the battle.
An admin (professor) should be able to perform all the functionalities for a normal
user. Also, admin should be able to add and delete users from the system.
8
User should be able to log out from the system with the logout button and login back
into the system
The tool should provide a Help facility.
These requirements were finalized after a series of prototyping meetings with
Mr. Richard Sutton.
3.4 STUDENT CENTRIC REQUIREMENTS
The student centric requirements arise by keeping high school students in mind. The
system was developed keeping them in mind. The student centric requirements were gathered
from Mr. Richard Sutton from Helix High School as follows.
The tool should be easy to use and easy to configure by students.
Tools should have tooltip and help facilities to help students to understand software
easily and without much effort.
The language used to describe battles should not be complex. It should be easily
understandable though descriptive and informative.
Use of images and videos to make learning about the wars more interactive and
informative.
9
CHAPTER 4
PROTOTYPING
Prototyping refers to the activity of creating prototypes of the application, which is an
incomplete version of the software program being developed [5]. Prototyping the
development cycle of your project helps in reducing the risk during implementation and
adaption of the software tool. The project cycle include five important phases as shown in
Figure 4.1, which is discussed in brief.
Figure 4.1. Project development cycle.
Definition: The main task in a software product is digging out the requirements and
understands them. The final output of this phase is a problem set of requirements to
develop in this case of Multimedia GIS tool for Globalism.
Design: This step is mainly to decide the architecture of the system using the
specification, functionalities and GUI the user expects will help in designing the outer
layer of the project. It also includes the implementation and testing of software code
which is ready for deployment. More on this is discussed in Chapter 5.
10
Development: the development cycle consists of successful prototypes where the
actual testing is done from the user perspective. The feedback and suggestion is taken
from the user after each prototype and the design redefined to accomplish the end
result. This process goes on until the project is ready to deliver. I found this process
very helpful to keep track of the requirements and implementation of the project.
Deployment: the actual deployment starts after the code is appropriately tested and all
other aspects of the project, including documentation, have been taken care of. We
have created a user manual for the software.
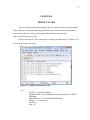
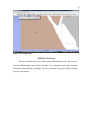
During the development of the GIS Tool for GLOBALISM, a prototype was
developed. The figures below show the screen shots of the prototype. The screen
(Figure 4.2) is the main screen which is launched when the tool is started.
Figure 4.2. GIS GLOBALISM tool main screen.
Initial prototype has been developed and modified according to requirements of
Mr. Richard Sutton. All the features were implemented accordingly and were finished in the
time frame given as per his requirements.
11
CHAPTER 5
SOFTWARE DESIGN
The design phase started after finishing requirement collection for the tool GISGLOBALISM. This chapter mainly focuses on the high level software architecture and class
diagrams. The high level architecture diagram states the relationship between different
entities.
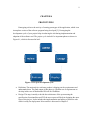
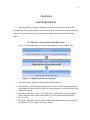
5.1 HIGH LEVEL ARCHITECTURE DIAGRAM
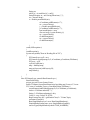
Figure 5.1 depicts the high level architecture diagram for GIS-GLOBALISM.
Figure 5.1. High level architecture diagram.
The architecture is broadly divided into three different levels:
User Interface: It is the end user display which is used to interact with maps and user
functionality which has been developed as per requirements. It will be launched with
application start up.
Map Objects and Java Classes: The functionality, attached with toolbars, buttons,
menus and other items on the main interface, is created and defined in different
JAVA classes.
CSV/SHP: Shape files and CSV files contains geographical attributes which need to
be displayed on UI by MOJO and JAVA classes.
12
5.2 CLASSES AND CLASS DIAGRAM
The class diagram displays the general organization of the system. It helps to
understand how different classes are interacting with each other. A Class Diagram in the
Unified Modeling Language (UML) is a type of static structure diagram that describes the
structure of a system by showing the system's classes, their attributes, and the relationships
between the classes [6]. It also helps to understand the interdependency of classes used for
development.
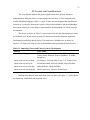
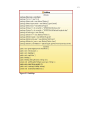
The classes as shown in Table 5.1 have been used to develop functionality provided
by Globalism tool. In this project a couple of classes have been developed to implement
functionality provided by inbuilt classes. The main class is InitMap class as shown in
Figure 5.2. It depicts the name of class, main attributes and operation performed by class.
Table 5.1. Importing Classes and Classes Used for Development
Package
import javax.swing
Class Name
JMenuBar, JMenuItem, AbstractTableModel,
TableColumn, JButtons, JPanel, JSplitPane, JToolBar,
ImageIcon
import com.esri.mo2.ui.bean
TocAdapter, TocEvent, Map, Layer, Toc, Legend, Tool
import com.esri.mo2.ui.tb
ZoomPanToolBar, SelectionToolBar, ProjectToolBar
import com.esri.mo2.file.shp
ShapefileWriter, ShapefileFolder
import com.esri.mo2.map.dpy
BaseFeatureLayer, Layerset, FeatureLayer
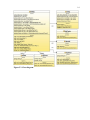
InitMap class interacts with other main classes as shown in Figure 5.3. It also shows
the interaction with hotlink and hyperlink class.
13
Figure 5.2. InitMap.
14
Figure 5.3. Class diagram.
15
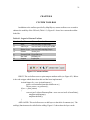
CHAPTER 6
MAPOBJECTS’ CONFIGURATION WITH
NETBEANS IDE
This project was developed with the choice of NetBeans as the IDE as it provides
easy integration with MOJO. It also provides a drag and drop facility for different
components which could be used by users to interact with the system. The same IDE is used
to compile and build code with using JDK 1.6.0_23.A plug-in for UML diagram
development which was used to develop the class diagram is named UML. [1] The steps
below explain how this was achieved.
1. Install JDK 1.6 from the sun java website [7].
2. Install NetBeans IDE from the NetBeans website [4].
3. Installation of MapObjects Java Edition was done with CD provided by Dr. Carl
Eckberg in one class in GIS.
4. Integration of Netbeans and MOJO was done with adding MOJO library to IDE.
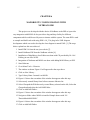
5. Start Netbeans.
6. Go to Menu Tools > Libraries.
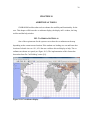
7. The window as shown Figure 6.1will appear after the steps above.
8. Click on New Library…
9. Type Library Name. I named it as MOJO.
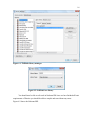
10. Figure 6.2 shows the screenshot of the window that appears after this step.
11. Select newly created library from left tree structure libraries list.
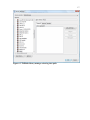
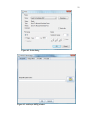
12. Select Classpath tab.With the newly created library selected on the left, Select the
Classpath tab and select the Add JAR/Folder…
13. Click on Add JAR/Folder…
14. Figure 6.3 shows the screenshot of the window that appears after this step.
15. Navigate to folder where MOJO is installed. Sample shown with “H:\
ThesissMitesh\MOJ20\lib”.
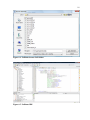
16. Figure 6.4 shows the screenshot of the window that appears after this step.
17. Click on Add JAR/Folder.
16
Figure 6.1. NetBeans library manager.
Figure 6.2. NetBeans new library.
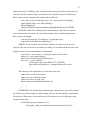
You should now be able to edit code in Netbeans IDE since we have finished all basic
requirements of libraries you should be able to compile and run without any errors.
Figure 6.5 shows the Netbeans IDE.
17
Figure 6.3. NetBeans library manager selecting class path.
18
Figure 6.4. NetBeans browse JAR folder.
Figure 6.5. NetBeans IDE.
19
CHAPTER 7
MAPOBJECTS TOOLBARS
This chapter discuss about basic toolbars of MOJO and their functionality.
7.1 COM.ESRI.MO2.UI.TB.PROJECTTOOLBAR
Figure 7.1 shows project toolbar.This toolbar provides functionality like to open,
close, save a map project and print a map image to a file. The actions supported by this
ToolBar include [8]:
Figure 7.1. MOJO
ProjectToolbar.
OpenProject - Open a previously saved project file.
SaveProject - Save the current map project to a file.
SaveProjectAs - Save current map project to a new file.
CloseProject - Close current map project.
SaveMapImageToFile - Save current map to an image file.
PrintLayer - Print selected layer(s) in the toc.
7.2 MAPOBJECTS TOOLBARS
Figure 7.2 shows the ZoomPanToolBar. It provides functionality to change the map
extent in a variety of ways. The actions supported by the Toolbar include:
Figure 7.2. MOJO ZoomPanToolbar.
Zoom In - Provides a tool for clicking or dragging a rectangle on the map in order to
zoom in. You can also select the tool and click on the area you want to Zoom In.
20
Zoom Out - Provides a tool for clicking or dragging a rectangle on the map in order to
zoom out. You can also select the tool and click on the area you want to Zoom Out.
ZoomToSelected - Zooms the map to the extent of all selected features in the selected
layer.
ZoomToFullExtent - Zooms the map to the extent of all layers within the map.
GoPrevious - Zooms to the previous extent stored in the extent history.
GoNext - Zooms to the next extent stored in the extent history.
Pan - Provides a tool for dragging the map to a new location without altering the
zoom level.
PanOneDirection - Pans the map in one of four directions, north, south, east, or west.
Identify - Performs an Identify on the specified "selected" layers.
21
CHAPTER 8
CUSTOM TOOLBAR
In addition to the toolbars provided by MapObjects, custom toolbars were created to
enhance the usability of the GIS tool (Table 8.1). Figure 8.1 shows how custom the toolbar
looks like.
Table 8.1. Legend of Custom Toolbars
Number
1
2
3
4
6
7
8
Tool Name
Print
Add Layer
Delete Layer
Pointer
External Link
Hot Link
Logout
Class or Function Name
com.esri.mo2.ui.bean.Print
com.esri.mo2.ui.tb.LayerToolBar
com.esri.mo2.map.dpy.Layer
Arrow.java
Hyperlink.java
Hotlink.java
Login.java
Figure 8.1. Custom toolbars.
PRINT: This tool allows users to print map an attribute table (see Figure 8.2). Below
is the code snippet which shows how this tool has been implemented.
ActionListener lis = new ActionListener() {
public void actionPerformed(ActionEvent ae) {
Object source= ae.getSource();
if(src == print_button)
{
com.esri.mo2.ui.bean.Print mapPrint = new com.esri.mo2.ui.bean.Print();
mapPrint.setMap(map);
mapPrint.doPrint();
}
ADD LAYER: This tool allows user to add layers to the table of contents (toc). The
setMap() function must be called before adding. Figure 8.3 shows how the layer can be
22
Figure 8.2. Print dialog.
Figure 8.3. Add layer dialog window.
23
added to the map. For Adding a layer to the map click on the plus symbol on the tool bar; it
will open a browser window; then we can browse to the specific location to add the layer.
Below is the code [9] to integrate the toolbar with the GIS tool.
static com.esri.mo2.ui.bean.Map map = new com.esri.mo2.ui.bean.Map();
AddLyrDialog aldlg = new AddLyrDialog();
aldlg.setMap(map);
aldlg.setVisible(true);getContentPane().add(addlg BorderLayout.NORTH);
DELETE LAYER: This toolbar provides functionality to allow the user to delete
layers from the table of contents. The same functionality is also available through menu.
Below is the code snippet.
com.esri.mo2.map.dpy.Layer dpylayer = legend.getLayer();
map.getLayerset().removeLayer(dpylayer);
ARROW: If some tool has selected before, and the user wants to go to “no tool
selected”, they can use the arrow tool which is actually a no selection tool.Below is the code
snippet to show how this functioanality is implemented.
Arrow arrow = new Arrow(); \\ creating the object of Arrow class
button_lis = new ActionListener() {
public void actionPerformed(ActionEvent ae) {
else if (src == arrow_button) {
setCursor(java.awt.Cursor.DEFAULT_CURSOR);
map.setSelectedTool(arrow); \\ setting the map tool to arrow
}
}
The following code explains how to create the Arrow class:
import com.esri.mo2.ui.bean.Tool;
import java.awt.event.MouseEvent;
public class Arrow extends Tool {
public void mouseClicked(MouseEvent me){
}
}
HYPERLINK: This tool has been implemented to allow the user to go on the internet
by clicking it to read more about a particular king, which is one of the primary requirements
for a this tool. When users, click on this tool it will let the user to read a wiki page for the
current selected king.
if (FileName.equals("Alexander.csv")) {
String king = http://en.wikipedia.org/wiki/Alexander_the_Great";
24
try {
Runtime.getRuntime().exec("rundll32 url.dll,FileProtocolHandler
" + king); }
catch (Exception e) {
catchException();
}
}
HOT LINK: It allows a user to read more detailed information about a particular war
fought by a king. Users have to select a layer first, click on the hotlink button and click on
start on a star on map to read more about it. Figure 8.4 depicts this functionality. The code to
integrate the feature with the system is
public void lighteningBolt(com.esri.mo2.cs.geom.Point worldPoint) {
Double xOriginal = null, yOriginal = null;
String warName = "";
double xMouse = Double.parseDouble(df.format(worldPoint.getX()));
double yMouse = Double.parseDouble(df.format(worldPoint.getY()));
try {
FileReader frd = new FileReader(cd.currentdir + "\\ESRI\\" +
FileName);
BufferedReader br = new BufferedReader(frd);
String s;
while ((s = br.readLine()) != null) {
StringTokenizer st = new StringTokenizer(s, ",");
xOriginal = Double.parseDouble(st.nextToken());
yOriginal = Double.parseDouble(st.nextToken());
if (FileName == "Genghiskhan.csv") {
if (xOriginal - 0.2 < xMouse && xMouse < xOriginal + 0.2
&& yOriginal
- 0.2 < yMouse && yMouse < yOriginal + 0.2) {
warName = st.nextToken();
flgLayerSelected = true;
break;
}
}
25
Figure 8.4. Hotlink button.
frd.close();
} catch (Exception e) {
System.out.println("Exception::1" + e);
}
if (flgLayerSelected == true) {
try {
DispDetail tp = new DispDetail(warName, FileName);
tp.setSize(1280, 765);
tp.show();
flgLayerSelected = false;
} catch (Exception e) {
JOptionPane.showMessageDialog(null, "The System went out of
memory.
Please Login again and Restart the Application", "OOPS",
JOptionPane.OK_CANCEL_OPTION);
}
}
26
LOGOUT: It allows user to logout from the system. It prompts a user for credential to
re login to the system.
ADD USER: This button is only available for admin type user to add new user to the
system.
DELETE USER: It allows admin to delete a user from the system.
27
CHAPTER 9
PROJECT LAYER
A layer in GIS represents the geographic data of a certain area for a particular theme,
and is similar to a legend on a paper map. The following classes are used to implement a
layer shown in the tool: com.esri.mo2.map.dpy.BaseFeatureLayer class and
com.esri.mo2.ui.bean.Layer class.
We can convert a CSV file to shape file by using the ArcMap tool (see Figure 9.1). If
we can do the same by the code:
Figure 9.1. Sample of Alexander.csv file.
try {
File file = jfc.getSelectedFile();
FileReader fred = new FileReader(CurrentDir.currentdir+"\\ESRI\\" +
FileName);
BufferedReader in = new BufferedReader(fred);
String s; // = in.readLine();
double x,y;
int n = 0;
28
String str;
while ((s = in.readLine()) != null) {
StringTokenizer st = new StringTokenizer(s,",");
str = st.nextToken();
x = Double.parseDouble(str);
xCoordinate.addElement(x+"");
str = st.nextToken();
y = Double.parseDouble(str);
yCoordinate.addElement(y+"");
bpa.insertPoint(n++,new
com.esri.mo2.cs.geom.Point(x,y));
str = st.nextToken();
s2.addElement(str);
str = st.nextToken();
s5.addElement(str);
}
}
catch (IOException e)
{
catchException();
System.out.println("Error in Reading file in XY");
}
XYfeatureLayer xyfl = new
XYfeatureLayer(bpa,map,s2,s5,xCoordinate,yCoordinate,FileName);
XYlayer = xyfl;
xyfl.setVisible(true);
map = InitMap.map;
map.getLayerset().addLayer(xyfl);
map.redraw();
}
}
class XYfeatureLayer extends BaseFeatureLayer {
BaseFields fields;
private java.util.Vector featureVector;
public XYfeatureLayer(BasePointsArray bpa,Map map,Vector s2, Vector
s5,Vector xCoordinate,Vector yCoordinate,String FileName) {
createFeaturesAndFields(bpa,map,s2,s5,xCoordinate,yCoordinate);
int dot = FileName.indexOf(".");
String f = FileName.substring(0, dot);
Color c1 =new Color(139,26,26);
BaseFeatureClass bfc = getFeatureClass(f + " Points",bpa);
setFeatureClass(bfc);
BaseSimpleRenderer srd = new BaseSimpleRenderer();
SimpleMarkerSymbol sms= new SimpleMarkerSymbol();
sms.setType(SimpleMarkerSymbol.STAR_MARKER);
29
sms.setSymbolColor(new Color(125,49,38));
sms.setWidth(15);
srd.setSymbol(sms);
setRenderer(srd);
XYLayerCapabilities lc = new XYLayerCapabilities();
setCapabilities(lc);
}
30
CHAPTER 10
ADDITIONAL TOOLS
GLOBALISM tool has other tools to enhance the usability and functionality for the
user. This chapter will discuss the co-ordinates display, the display info’ window, the king
tool bar and the help window.
10.1 CO-ORDINATES DISPLAY
One of the requirements for the system was to show the co-ordinates on the map
depending on the current mouse location. If the student was looking at a war and knew that
location of a battle site was -91.1, 62.8 the user could use this tool display as help. The coordinates are shown on a panel (see Figure 10.1). The implementation of this feature has
been taken from Dr. Carl Eckberg’s notes [10].
Figure 10.1. Co-ordinates display.
31
10.2 HELP WINDOW AND TOOLTIPS
The Help window has been provided as a tool to fall back on, if the user wants to
know the functionality of the each button in the toolbar. To open the help window, click
About Menu and Help Topics item (see Figure 10.2). Tooltips have also been provided to
show brief description of the buttons on the toolbar.
Figure 10.2. Help window.
10.3 DISPLAY INFO
This tool will allow the user to know about battle names after the user clicks on a
“star symbol” on the map. The display window is displayed with the name of the battle and a
Read More button as shown in Figure 10.3. Read More button will allow the user to read
more details about particular a war.
32
Figure 10.3. Display info.
10.4 KING TOOLBAR
This tool will allow the user to switch between different kings easily. The user can
click on a different king name as shown in Figure 10.4 to change the map’s layer to display
information about that king accordingly. The user can drag it to any part of display window
as per his convenience.
33
Figure 10.4. King toolbar.
34
CHAPTER 11
SCREENSHOTS
11.1 LOGIN SCREEN
The login screen will load when the user starts the project. The user should provide
his username and password credentials and click login button. The map screen will be
viewed depending upon user privileges (see Figure 11.1).
Figure 11.1. Login screen.
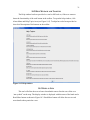
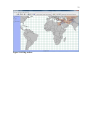
11.2 MAP VIEW
Once the user successfully logs in, he is then transferred to Map View displaying
information about king “Alexander”. The user can change the King from the Menu or the
King Tool bar. The map will display each country ruled by a particular king in a particular
color while other countries are in gray color (see Figure 11.2).
Different tools can be used to manipulate the map view as per requirements.
Important toolbar options:
Zoom to full Extent – View default view of the map. Zoom to full extent button is
mainly used to return to default view from zoom in and zoom out options.
Zoom in: Draw a square on the area or click on the area you want to zoom in. That
area is zoomed in on the map
35
Figure 11.2. Map view.
Zoom out: Zoom out button is used for zooming out from the zoomed area. Draw a
square on the area or click on the area you want to zoom out
Hotlink: Click on one of the layers, click the hotlink button and then click on a battle
site. A window will pop up giving detailed description of the battle
Hyperlink: Clicking on the Hyperlink button opens up a web page giving detailed
description of the war.
Arrow button: Click on the Arrow button to de-select the hotlink option and move
back to normal arrow cursor
Print map: The print map button allows the user to print the map from the system
Pan Button: Select the pan button to drag the area on the map.
Remove layer: Select the layer to be removed from the map and click the Remove
layer button. The layer is removed from the map. The layer can be added to the map
by using the add Layer option. If the war shape file is removed, click on the wars
menu and select one of the wars from the list.
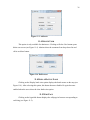
11.3 ADD USER
This option is only available for admin user. Clicking on Add User button opens add
user screen (see Figure 11.3). Admin enters the username and password, selects the user type
and clicks on the save button.
36
Figure 11.3. Add user.
11.4 DELETE USER
This option is only available for admin user. Clicking on Delete User button opens
delete user screen (see Figure 11.4). Admin selects the username from drop down list and
clicks on delete button.
Figure 11.4. Delete user.
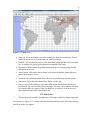
11.4 DISPLAYBATTLE NAME
Clicking on the Display battle sites option displays the battle names on the map (see
Figure 11.4). After selecting this option, this button becomes disabled. It again becomes
enabled when the user selects the clear battle sites option.
11.5 WIKI PAGE
Clicking on the hyperlink button displays the wikipage in browser corresponding to
each king (see Figure 11.5).
37
Figure 11.4. Map view with battle names.
Figure 11.5. Wiki page.
38
CHAPER 12
FUTURE ENHANCEMENT
This tool provides a great framework which can be expanded to add more features
and functionalities. This tool has been developed using object oriented design in java which
will allow reusing classes, and extra features can be added with minimal code changes.
Some of the future enhancements proposed are:
Quiz section could be added with time based functionality.
The project can be localized to include different natural languages.
Web version of project could be developed using, e.g., ArcIMS.
This application could be developed using Client-Server Architecture.
For each king only the major battles have been covered, the application can be
modified to include other battles conquer by each king.
Picture Game has been added to the system. More interactive games and puzzles can
be added to make learning more interactive and enjoyable.
The tool can include other kings too, which tried to win the whole world.
39
CHAPER 13
CONCLUSION
This tool has been developed to motivate students to learn interesting history
information. It will hopefully encourage student not to run away from history and learn it
with curiosity and ease.
During working on this project there were lots of challenges that arouse and were
accomplished successfully. The main challenge was to collect information related to kings
and wars conquered by them. It was the toughest part of the thesis. Another one was to
implement a custom icon for “Hotlink” feature on Map layer. Dr. Carl Eckberg’s explanation
and his class notes helped to accomplish this successfully and in time.
Since this tool was developed with JAVA environment, it supports multiple
Operating Systems (OS). It uses default browser of a system to let students go on the internet,
which could be Internet Explorer, Mozilla Firefox and Safari etc. This is possible because
JAVA developed projects are platform independent.
MOJO provides easy extendibility. It will help to add new features or functionality to
this tool effortlessly. This can be converted to a web based application to provide better
accessibility to students.
40
BIBLIOGRAPHY
[1]
Keshav Pande. Cold War post World War II GIS support for US history. Master’s
thesis, San Diego State University, San Diego, CA, 2009.
[2]
Aditya Padhye. Equal Rights Amendment (ERA) in United States history. Master’s
thesis, San Diego State University, San Diego, CA, 2010.
[3]
Webdotdev. Java Advantages and Disadvantages, 2007.
http://www.webdotdev.com/nvd/articles-reviews/java/java-advantages-anddisadvantages-1042.html, accessed Sept. 2010.
[4]
NetBeans. NetBeans IDE for Java Developers, 2010.
http://www.netbeans.org/downloads/, accessed Sept. 2010.
[5]
Wikipedia.org. Prototyping, 2010. http://en.wikipedia.org/wiki/Prototype, accessed
Sept. 2010.
[6]
Wikipedia.org. Class Diagram, 2011. http://en.wikipedia.org/wiki/Class_diagram
accessed Mar. 2011.
[7]
Oracle. Java SE Downloads, 2010.
http://www.oracle.com/technetwork/java/javase/downloads/index.html, accessed
Sept. 2010.
[8]
Chintan Sheth. GIS multimedia tool for significant wars from 1775 to 1950. Master’s
thesis, San Diego State University, San Diego, CA, 2010.
[9]
ESRI. Map Objects, Java Edition, 2003.
www.usgsquads.com/downloads/factsheets/ESRI_map_objects_java.pdf, accessed
Nov. 2010.
[10]
Carl Eckberg. Notes on MapObjects Java Edition. San Diego State University, San
Diego, CA, 2010.