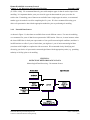
1
Chapter 3
Air Dispersion and Deposition Modeling
What’s Covered in Chapter 3:
3.1
Background on Air Dispersion Models for Risk Assessment
3.2
Partitioning Emissions
3.3
Site-Specific Characteristics Required for Air Modeling
3.4
Meteorological Data Primer
3.5
Meteorological Preprocessor Data Needs
3.6
ISCST3 Model Input Files
3.7
ISCST3 Model Execution
3.8
Using Model Output
3.9
Modeling Fugitive Emissions
3.10
Modeling Acute Risk
The burning of materials produces residual amounts of pollution that could be released to the
environment. Knowledge of atmospheric pollutant concentrations and deposition rates in the areas
around the combustion facility is an integral part of estimating potential human health risks associated
with these releases. Air concentrations and deposition rates are usually estimated using air dispersion
models. Air dispersion models are mathematical constructs that attempt to describe the effects of
physical processes that occur in the atmosphere on rates of dispersion of emissions from a source (such
as the stack of a combustor). These mathematical constructs are coded into computer programs to
facilitate the computational process.
PLEASE NOTE: for the purposes of this guidance, “we” refers to the U.S. EPA OSW.
The “you” to which we speak in this chapter is the air modeler: the person (or persons)
who will actually put the recommended air modeling methods into practice.
U.S. EPA Region 6
Multimedia Planning and Permitting Division
Center for Combustion Science and Engineering
U.S. EPA
Office of Solid Waste
3-1
Human Health Risk Assessment Protocol
Chapter 3: Air Dispersion and Deposition Modeling
September 2005
This chapter provides guidance on criteria to consider when selecting an air model to use to support a
risk assessment. It also describes the development and use of the U.S. EPA air dispersion model—the
Industrial Source Complex Short-Term Model (ISCST3)—which best addresses the selection criteria for
most risk assessments. Although the air dispersion modeling methods presented in the HHRAP focus on
use of ISCST3, other available models may be more appropriate if they better meet the selection criteria
due to study-specific objectives or assessment area characteristics. Of particular interest is the American
Meteorological Society- Environmental Protection Agency Regulatory Model (AERMOD), which has
been proposed by EPA as a replacement for the ISCST3 model for Clean Air Act regulatory purposes.
More details about AERMOD and other alternative models are provided in Section 3.1.1.
The Guideline on Air Quality Models (GAQM) (U.S. EPA 1996k; 1999b; Federal Register 2000) is a
primary reference for all US EPA and state agencies on using air models for regulatory purposes. The
GAQM is Appendix W of 40 CFR Part 51. The Office of Air Quality Planning and Support (OAQPS)
provides the GAQM and extensive information on updates to air dispersion models, meteorological data,
data preprocessors, and user’s guides on the Support Center for Regulatory Air Models (SCRAM) web
site at www.epa.gov/scram001/index.htm. We suggest you review this web site periodically to check for
updates and changes to the recommended model. General questions regarding air modeling, or
information on the web site may be addressed to [email protected]. Specific questions
on the use of this guidance may be addressed to the appropriate permitting authority. Please refer to the
respective models User’s Manual for:
<
a more in-depth discussion on the physical assumptions embodied in the ISCST3 or other
air dispersion model that may be considered; as well as
<
concepts of atmospheric processes that are embodied in dispersion models in general.
Discussions in Section 3.1 focus on a background of available models, and selection criteria to consider
when deciding which air model to use in a risk assessment. The remainder of the chapter provides
information on ISCST3 input data needs, and output file development. Chapter sections include:
•
Partitioning emissions (Section 3.2)
•
Site-specific characteristics needed for air modeling (Section 3.3)
Surrounding terrain (Section 3.3.1)
Surrounding land use (Section 3.3.2)
Facility building characteristics (Section 3.3.4)
Meteorological data (Section 3.5)
•
U.S. EPA Region 6
Multimedia Planning and Permitting Division
Center for Combustion Science and Engineering
U.S. EPA
Office of Solid Waste
3-2
Human Health Risk Assessment Protocol
Chapter 3: Air Dispersion and Deposition Modeling
September 2005
If you aren’t familiar with the types of data used in air concentration and deposition models, Section 3.4
provides a short tutorial on the types of meteorological data needed, and potential data sources. Section
3.5 describes the data needs of the preprocessor computer program we recommend using to prepare,
organize, and format meteorological data for use in the ISCST3 model. Section 3.6 describes the
structure and format of ISCST3 input files. Section 3.7 describes limitations to consider in executing
ISCST3. Section 3.8 describes how model outputs are used in the risk assessment computations. Section
3.9 discusses air modeling of fugitive emissions. Section 3.10 discusses air modeling for acute exposure.
3.1
DESCRIPTION OF AIR MODELS
This section gives a brief background on air dispersion models for risk assessment. This section also
introduces some data preprocessing programs developed to aid in preparing air model input files (these
preprocessing programs are described in more detail in Sections 3.3.3 and 3.5).
3.1.1
Background on Air Dispersion Models for Risk Assessment
Before 1990, the Agency and the regulated community used several air dispersion models. These models
were of limited usefulness in risk assessments because they considered only air concentration, and not
the deposition of contaminants to land. The original Agency guidance on completing risk assessments
(U.S. EPA 1990e) identified two models that were explicitly formulated to account for the effects of
deposition:
•
COMPLEX I, from which a new model—COMPDEP—resulted
•
Rough Terrain Diffusion Model (RTDM), from which a new
model—RTDMDEP—resulted
An updated version of the ISCST model in use at the time, COMPDEP included building wake effects.
Subsequent Agency guidance (U.S. EPA 1993f and 1994g) recommended using COMPDEP for air
deposition modeling. U.S. EPA (1993f) specified COMPDEP Version 93252, and U.S. EPA (1994g)
specified COMPDEP Version 93340. When these recommendations were made, a combined
ISC-COMPDEP model (a merger of the ISCST2 and COMPLEX I model) was still under development.
The merged model became known as ISCSTDFT. U.S. EPA guidance (1994r) recommended using the
ISCSTDFT model. After reviews and adjustments, this model was released as ISCST3. The ISCST3
model contains algorithms for dispersion in simple, intermediate, and complex terrain; dry deposition;
wet deposition; and plume depletion.
U.S. EPA Region 6
Multimedia Planning and Permitting Division
Center for Combustion Science and Engineering
U.S. EPA
Office of Solid Waste
3-3
Human Health Risk Assessment Protocol
Chapter 3: Air Dispersion and Deposition Modeling
September 2005
Operating the COMPDEP, RTDMDEP, and ISCST models is described in more detail in the following
User’s Manuals. Please note, though, that all models except the current version of ISCST3 are
considered obsolete:
•
Environmental Research and Technology (ERT). 1987. User’s Guide to the Rough
Terrain Diffusion Model Revision 3.20. ERT Document P-D535-585. Concord,
Massachusetts.
•
Turner, D.B. 1986. Fortran Computer Code/User’s Guide for COMPLEX I Version
86064: An Air Quality Dispersion Model in Section 4. Additional Models for
Regulatory Use. Source File 31 Contained in UNAMAP (Version 6). National
Technical Information Service (NTIS) PB86-222361/AS.
•
U.S. EPA. 1979. Industrial Source Complex Dispersion Model User’s Guide, Volume I.
Prepared by the H.E. Cramer Company. Salt Lake City, Utah. Prepared for the Office of
Air Quality Planning and Standards. Research Triangle Park, North Carolina. EPA
450/4-79/030. NTIS PB80-133044.
•
U.S. EPA. 1980b. User’s Guide for MPTER: A Multiple Point Gaussian Dispersion
Algorithm with Optional Terrain Adjustment. Environmental Sciences Research
Laboratory. Research Triangle Park, North Carolina. EPA 600/8-80/016. NTIS
PB80-197361.
•
U.S. EPA. 1982a. MPTER-DS: The MPTER Model Including Deposition and
Sedimentation. Prepared by the Atmospheric Turbulence and Diffusion Laboratory
(NOAA). Oak Ridge, Tennessee. Prepared for the Environmental Sciences Research
Laboratory. Research Triangle Park, North Carolina. EPA 600/8-82/024. NTIS
PB83-114207.
•
U.S. EPA. 1987b. On-Site Meteorological Program Guidance for Regulatory Modeling
Applications. Office of Air Quality Planning and Standards. Research Triangle Park,
North Carolina.
•
U.S. EPA. 1995f. User’s Guide for the Industrial Source Complex (ISC3) Dispersion
Models, Volumes I and II. Office of Air Quality Planning and Standards. Emissions,
Monitoring, and Analysis Division. Research Triangle Park, North Carolina. EPA
454/B-95/003a. September.
Four air models in current regulatory use, or proposed by OAQPS, include ISCST3, AERMOD,
CALPUFF and ISC-PRIME. However, we generally recommend using the latest version of ISCST3 in
most situations to conduct air dispersion and deposition modeling for use in a risk assessment.
This recommendation is based on ISCST3's status as the:
•
Model most used by regional, state and local agencies; and
U.S. EPA Region 6
Multimedia Planning and Permitting Division
Center for Combustion Science and Engineering
U.S. EPA
Office of Solid Waste
3-4
Human Health Risk Assessment Protocol
Chapter 3: Air Dispersion and Deposition Modeling
•
September 2005
Model satisfying the most of the following criteria:
<
Has broad regulatory acceptance and experience in evaluating the impacts of air
contaminants emitted from various industrial sources (e.g., short and tall stack
heights, fugitive emissions from process and storage areas);
<
Can evaluate impacts attributable to a single source, with capability to evaluate
multiple sources;
<
Can evaluate compounds emitted as vapor or particulate phase with
consideration of deposition and removal processes based on the physical
characteristics of the compound;
<
Accepts placement of grid nodes at any location within the applicable range of
the air model;
<
Can conduct stepwise evaluation of hourly meteorological conditions for
multiple years of data producing short-term (acute) and long-term (chronic)
averages as outputs; and
<
Can evaluate building downwash effects.
The other three air models are proposed by OAQPS as refined regulatory air models in the revisions to
the Guideline on Air Quality Models (U.S. EPA 1996k; 1999b). Of particular interest is AERMOD.
AERMOD is proposed to replace ISCST3 as the recommended air quality model for most regulatory
applications (Federal Register 2000). AERMOD has been evaluated extensively by the air modeling
community for improvements over the ISCST3 algorithms for vertical contaminant distribution from
sources with tall stacks, terrain effects in areas with terrain elevations above the top of emission source
stacks, and enhanced nighttime dispersion in urban areas. However, AERMOD currently has minimal
regulatory experience. AERMOD would be an important consideration for risk assessments if:
•
it gains broad regulatory acceptance,
•
the assessment area contains significant terrain features (i.e., terrain elevations above
emission source stacks)
OAQPS promulgated the California Puff Model (CALPUFF) model for use on a case-by-case basis, for
long-range transport (greater than 50 kilometers), as well as the special conditions of very light or calm
winds (less than 1 meter per second). CALPUFF may be an important consideration when modeling:
•
chemical transformation of highly reactive contaminants;
•
long residence times during extended periods of light winds or calm conditions;
•
transport over long distances;
•
recirculation of contaminants due to local wind effects; or
•
hilly terrain and river valleys.
U.S. EPA Region 6
Multimedia Planning and Permitting Division
Center for Combustion Science and Engineering
U.S. EPA
Office of Solid Waste
3-5
Human Health Risk Assessment Protocol
Chapter 3: Air Dispersion and Deposition Modeling
September 2005
Also, the proposed OAQPS revisions to the GAQM recommend using the version of ISCST with the new
downwash algorithm, ISC-PRIME, for applications where aerodynamic building downwash is critical
(Federal Register 2000). The necessary information and inputs to evaluate the effects of building
downwash are further discussed in Section 3.2.4. We generally recommend determining the need for the
improved building downwash calculation on a case-by-base basis.
Although air dispersion modeling methods presented in this guidance use ISCST3, you may want to
evaluate other models (such as ISC-PRIME, AERMOD, or CALPUFF, if the revised GAQM adopts
them), to see whether they more substantially meet the selection criteria. Specific to its ability to meet
the selection criteria listed above, the ISCST3 model is technically capable of evaluating:
•
Gaussian dispersion rates in vertical and horizontal plume cross-section;
•
Urban and rural dispersion coefficients;
•
Terrain effects;
•
Source characterization as a discrete point, two-dimensional area, or three-dimensional
volume;
•
Short-term and long-term averages (1-hour and annual);
•
Surface meteorology data includes hourly observations of wind speed (nearest
1/10th mile per second), wind direction (nearest degree), stability class (6 categories),
and temperature (nearest degree);
•
Mixing height data interpolated from twice daily upper air soundings corresponding to
each hour of surface data;
•
Deposition processes for conservation of mass with particle wet and dry deposition and
removal, and vapor wet deposition and removal (dry vapor deposition implemented
within the air modeling; see Section 3.6.1);
•
Hourly precipitation amount and type act on wet deposition and removal; and
•
Single first order exponential decay rate.
In addition, emission sources can be defined in ISCST3 with either stack dimensions at a discrete point,
as a two-dimensional area source, or in three dimensions as a volume source. Therefore, ISCST3 offers
the flexibility to model sources based on source type (i.e., stack or fugitive area).
U.S. EPA Region 6
Multimedia Planning and Permitting Division
Center for Combustion Science and Engineering
U.S. EPA
Office of Solid Waste
3-6
Human Health Risk Assessment Protocol
Chapter 3: Air Dispersion and Deposition Modeling
3.1.2
September 2005
Preprocessing Programs
ISCST3 needs the help of additional computer programs, referred to as “preprocessing” programs. These
programs format available information regarding surrounding buildings and meteorological data into a
format that ISCST3 can read. Currently, these programs include:
•
Building Profile Input Program (BPIP) calculates the maximum crosswind widths of
buildings, which ISCST3 then uses to estimate the effects on air dispersion. These
effects by surrounding buildings are typically referred to as building downwash or wake
effects. The BPIP User’s Guide contains detailed information for preparing the
necessary building dimensions (length, height, and width) and locations for the ISCST3
model (U.S. EPA 1995c).
•
Meteorological Processor for Regulatory Models (MPRM) prepares meteorological data
for ISCST3. MPRM merges hourly measurements of surface parameters (e.g.,
precipitation, wind speed, and wind direction) into rows and columns of information that
ISCST3 can read. The MPRM User’s Guide contains instructions for using on-site
meteorological data to prepare the necessary meteorological input file for ISCST3 (U.S.
EPA 1996j; 1999c). The Addendum to the MPRM User’s Guide describes the additional
data needed in the meteorological input file for ISCST3 to model dry deposition of
vapors (U.S. EPA 1999c).
We generally recommend using MPRM to process the meteorological data, because MPRM provides all
the meteorological parameter values that ISCST3 needs to function. The peer review draft of the
HHRAP described the personal computer version of the meteorological preprocessor for the old RAM
program (PCRAMMET). Unfortunately, PCRAMMET doesn’t provide the parameters needed for
evaluating dry vapor deposition in ISCST3. Therefore, we no longer recommend using PCRAMMET.
When sufficient site-specific data is available on the location, size and shape of structures in the vicinity
of the emissions sources, you can use the BPIP program to prepare the ISCST3 input file to consider the
effects of building downwash on pollutant transport. If sufficient site-specific data is not available to run
BPIP, then you will not be able to address building downwash in air modeling efforts. Prior to
performing the air dispersion modeling, we recommend that you consult with the appropriate parties (e.g.
regulatory authority and facility) on the decision to include or omit nearby structures.
U.S. EPA Region 6
Multimedia Planning and Permitting Division
Center for Combustion Science and Engineering
U.S. EPA
Office of Solid Waste
3-7
Human Health Risk Assessment Protocol
Chapter 3: Air Dispersion and Deposition Modeling
3.2
September 2005
PARTITIONING EMISSIONS
COPC emissions to the environment occur in either vapor or particle phase. In general, you can assume:
•
most metals and organic COPCs with very low volatility (fraction of COPC in vapor
phase [Fv] less than 0.05, see Appendix A-3) occur only in the particle phase;
•
highly volatile organic COPCs occur only in the vapor phase (Fv of 1.0, see Appendix
A-3); and
•
the remaining organic COPCs occur with a portion of the vapor condensed onto the
surface of particulates (i.e. particle-bound).
For modeling COPCs released only as particulates, the mass fractions allocated to each particle size are
different than the mass fractions used for modeling organics released in both the vapor and
particle-bound phases.
Due to model limitations, you need to run ISCST3 multiple times to generate estimates of vapor phase
COPCs, particle phase COPCs, and particle-bound COPCs. An example is the risk assessment for the
WTI incinerator located in East Liverpool, Ohio. The study used three runs; a vapor phase run for
organic COPCs, a particle run with mass weighting of the particle phase metals and organic COPCs with
very low volatility, and a particle run with surface area weighting of the particle-bound organic COPCs.
3.2.1
Vapor Phase Modeling
Vapor phase air modeling runs do not need a particle size distribution in the ISCST3 input file. ISCST3
output for vapor phase runs are vapor phase ambient air concentration, dry vapor deposition, and wet
vapor deposition at receptor grid nodes based on the unit emission rate.
3.2.2
Particle Phase Modeling (Mass Weighting)
ISCST3 uses algorithms to compute the rate at which dry and wet removal processes deposit particle
phase COPCs onto the Earth’s surface. Particle size is the main determinant of the fate of particles in air
flow, whether dry or wet. The key to dry particle deposition rate is the terminal, or falling, velocity of a
particle. Particle terminal velocity is calculated mainly from the particle size and particle density. Large
particles fall more rapidly than small particles, and are deposited closer to the stack. Small particles have
low terminal velocities. Very small particles remain suspended in the air flow. Wet particle deposition
U.S. EPA Region 6
Multimedia Planning and Permitting Division
Center for Combustion Science and Engineering
U.S. EPA
Office of Solid Waste
3-8
Human Health Risk Assessment Protocol
Chapter 3: Air Dispersion and Deposition Modeling
September 2005
also depends on particle size as larger particles are more easily removed, or scavenged, by falling liquid
(rain) or frozen (snow or sleet) precipitation. To estimate particle phase deposition rates, ISCST3 needs
an initial estimate of the particle size distribution, broken out by particle diameter.
The diameters of small particles contained in stack emissions are usually measured in micrometers. The
distribution of particle diameters will differ from one combustion process to another, and is greatly
dependent on the:
1.
Furnace type;
2.
Combustion chamber design;
3.
Feed fuel composition;
4.
Particulate removal efficiency;
5.
APCS design;
6.
Amount of air, in excess of stoichiometric amounts, that is used to sustain combustion;
and
7.
Combustion temperature.
The particle size distribution cannot be calculated, but only directly measured or inferred from prior data.
Unfortunately, few studies have been performed to directly measure particle size distributions from a
variety of stationary combustion sources (U.S. EPA 1986a).
We recommend that existing facilities perform stack tests to identify particle size distribution. We
further recommend that these data represent actual operating conditions for the combustion unit and air
pollution control device (APCD) that remove particulate from the stack gas. A table of particle size
distribution data may be prepared using stack test data in the format similar to the example illustrated in
Table 3-1.
U.S. EPA Region 6
Multimedia Planning and Permitting Division
Center for Combustion Science and Engineering
U.S. EPA
Office of Solid Waste
3-9
Human Health Risk Assessment Protocol
Chapter 3: Air Dispersion and Deposition Modeling
September 2005
TABLE 3-1
HYPOTHETICAL PARTICLE SIZE DISTRIBUTION DATA
TO SUPPORT EXAMPLE CALCULATIONS
1
2
3
4
5
6
Mean Particle
Diameter a
(µm)
Particle
Radius
(µm)
Surface
Area/
Volume
(µm-1)
Fraction of
Total
Massb
Proportion
Available
Surface
Area
Fraction
of Total
Surface
Area
> 15.0
7.50
0.400
0.128
0.0512
0.0149
12.5
6.25
0.480
0.105
0.0504
0.0146
8.1
4.05
0.741
0.104
0.0771
0.0224
5.5
2.75
1.091
0.073
0.0796
0.0231
3.6
1.80
1.667
0.103
0.1717
0.0499
2.0
1.00
3.000
0.105
0.3150
0.0915
1.1
0.55
5.455
0.082
0.4473
0.1290
0.7
0.40
7.500
0.076
0.5700
0.1656
< 0.7
0.40
7.500
0.224
1.6800
0.4880
a Geometric mean diameter in a distribution from U.S. EPA (1980a), as presented in U.S. EPA (1998c)
b The terms mass and weight are used interchangeably when using stack test data
We expect that actual stack test data will be different from the hypothetical values presented in Table 31. This is because actual stack sampling will use particle “cut size” for the different cascade impactor
filters (or Coulter counter-based distributions). The test method will drive the range of particle sizes that
are presented in the results of the stack test. However, ISCST3 needs mean particle diameter for each
particle size distribution, and the stack test data identifies only the mass (“weight”) of particles in a range
bounded by two specific diameters. To address this, we recommend that stack test data be converted into
a mean particle diameter which approximates the diameter of all the particles within a defined range. We
recommend using the following equation to calculate the mean particle diameter:
U.S. EPA Region 6
Multimedia Planning and Permitting Division
Center for Combustion Science and Engineering
U.S. EPA
Office of Solid Waste
3-10
Human Health Risk Assessment Protocol
Chapter 3: Air Dispersion and Deposition Modeling
September 2005
Equation 3-1
where
Dmean
D1
D2
=
=
=
Mean particle diameter for the particle size category (µm)
Lower bound cut of the particle size category (µm)
Upper bound cut of the particle size category (µm)
For example, the mean particle diameter of 5.5 µm in Table 3-1 is calculated from a lower bound cut size
(assuming a cascade impactor is used to collect the sample) of 5.0 µm to an upper bound cut size of
6.15 µm. In this example, the mean particle diameter is calculated as:
From Table 3-1, the mean particle diameter is 5.5 µm. The mass of particulate from the 5.0 µm stack test
data is then assigned to the 5.5 µm mean particle diameter for the purpose of computing the “fraction of
total mass.”
Typically, eight to ten mean particle diameters are available from stack test results. However, as
determined from a sensitivity analysis conducted by The Air Group-Dallas under contract to U.S. EPA
Region 6 (http://www.epa.gov/region06), a minimum of three particle size categories (> 10 microns, 2-10
microns, and < 2 microns) detected during stack testing are generally the most sensitive to air modeling
with ISCST3 (U.S. EPA 1997f). For facilities with stack test results which indicate mass amounts lower
than the detectable limit (or the filter weight is less after sampling than before), a single mean particle
size diameter of 1.0 micron may be used to represent all mass (e.g., particle diameter of 1.0 micron or a
particle mass fraction of 1.0) in the particle and particle-bound model runs. Because rudimentary
methods for stack testing may not detect the very small size or amounts of COPCs in the particle phase,
the use of a 1.0 micron particle size will allow these small particles to be included properly as particles in
the risk assessment exposure pathways while dispersing and depositing in the air model similar in
behavior to a vapor. Consequently, we recommend that a minimum of three particle size categories be
used in the air modeling effort.
After calculating the mean particle diameter (Column 1), you can compute the fraction of total mass per
mean particle size diameter (Column 4) from the stack test results. For each mean particle diameter, the
U.S. EPA Region 6
Multimedia Planning and Permitting Division
Center for Combustion Science and Engineering
U.S. EPA
Office of Solid Waste
3-11
Human Health Risk Assessment Protocol
Chapter 3: Air Dispersion and Deposition Modeling
September 2005
stack test data provides an associated particulate mass. Calculate the fraction of total mass for each mean
particle diameter by dividing the associated particulate mass for that diameter by the total particulate
mass in the sample. In many cases, the fractions of total mass will not sum to 1.0 because of rounding
errors. In these instances, we advocate forcing the total mass to 1.0 by adding the remaining mass
fraction into the largest mean particle diameter mass fraction.
Direct measurements of particle-size distributions may not be available at a proposed new facility. You
will need to supply ISCST3 with an assumed particle distributions. In such instances, you may use a
representative distribution. We recommend that the combustor on which the representative distribution
is based be as similar as practicable to the proposed combustor.
ISCST3 uses the mass-based particle size distribution to apportion the mass of particle phase COPCs
(metals and organics with Fv values less than 0.05) according to particle size. The ISCST3 input file uses
the data in Column 4 of Table 3-1 (as developed from actual stack test data) to perform a particulate run
with the particle phase COPCs apportioned per mass weighting.
3.2.3
Particle-Bound Modeling (Surface Area Weighting)
Use a surface area weighting of particles, instead of mass weighting, in separate particle runs of ISCST3.
Surface area weighting approximates the situation where a portion of a semivolatile organic contaminant,
volatilized in the high temperature environment of a combustion system, condenses to the surface of
particles entrained in the combustion gas after the gas cools in the stack. Apportioning emissions by
particle diameter becomes a function of the surface area of particles available for chemical adsorption
(U.S. EPA 1998c).
The first step in apportioning COPC emissions by surface area is to calculate the proportion of available
surface area of the particles. If particle density is held constant (such as 1 g/cm3 ), the proportion of
available surface area of aerodynamically spherical particles is the ratio of surface area (S) to volume (V),
is estimated as follows:
•
Assume aerodynamically spherical particles.
•
Specific surface area of a spherical particle with a radius, r—S = 4 Br2
•
Volume of a spherical particle with a radius, r—V = 4/3 Br3
U.S. EPA Region 6
Multimedia Planning and Permitting Division
Center for Combustion Science and Engineering
U.S. EPA
Office of Solid Waste
3-12
Human Health Risk Assessment Protocol
Chapter 3: Air Dispersion and Deposition Modeling
•
September 2005
Ratio of S to V—S/V = 4 Br2 / (4/3 Br3 ) = 3/r
The following example uses the hypothetical particle size distribution in Table 3-1 to apportion the
emission rate of the particle-bound portion of the COPC based on surface area. We generally
recommend following this procedure for apportioning actual emissions to the actual particle size
distribution measured at the stack.
In Table 3-1, a spherical particle having a diameter of 15 µm (Column 1) has a radius of 7.5 µm
(Column 2). The proportion of available surface area (assuming particle density is constant) is
S/V = 3/7.5 = 0.4, which is the value in Column 3. Column 4 shows that particles with a mean diameter
of 15 µm constitute 12.8 percent of the total mass. Multiplying Column 3 by Column 4 yields the value
in Column 5 of 0.0512. This value is an approximation of the relative proportion of total surface area,
based on the percent of particles that are 15 µm in diameter. Totaling Column 5 yields the total surface
area of all particles in the particle size distribution. In this example, the sum is 3.4423. Column 6 is the
fraction of total surface area represented by the specific particle diameter in the distribution. Column 6 is
calculated by dividing the relative proportion of surface area (Column 5) for a specific diameter by the
total relative proportion of surface area (3.4423 square micrometers [µm2 ]). In the example of the 15
µm-diameter particle, the fraction of total surface area available for adsorption is 0.0149
(0.0512/3.4423). This procedure is then repeated for all particle sizes in the array.
ISCST3 uses the surface area-based particulate size distribution to apportion mass of particle-bound
COPCs (most organics) according to particle size. The ISCST3 input file uses Column 6 of Table 3-1 (as
developed from actual stack test data) to perform a particulate run for the particle-bound COPCs
apportioned according to surface area weighting.
RECOMMENDED INFORMATION FOR RISK ASSESSMENT REPORT
•
Copies of all stack test data used to determine particle size distribution
•
Copies of all calculations made to determine particle size distribution, fraction of total mass,
and fraction of total surface area
U.S. EPA Region 6
Multimedia Planning and Permitting Division
Center for Combustion Science and Engineering
U.S. EPA
Office of Solid Waste
3-13
Human Health Risk Assessment Protocol
Chapter 3: Air Dispersion and Deposition Modeling
3.3
September 2005
SITE-SPECIFIC INFORMATION NEEDED FOR AIR MODELING
We generally recommend that the site-specific information for the facility and surrounding area used in
air dispersion modeling include:
1.
the elevation of the surrounding land surface or terrain;
2.
surrounding land uses; and
3.
characteristics of on-site buildings that may affect the dispersion of COPCs into the
surrounding environment.
You can often obtain some of the site-specific information needed for air dispersion modeling by
reviewing available maps and other graphical data on the area surrounding the facility. The first step in
the air modeling process is reviewing these resources. Using U.S. Geological Survey (USGS) 7.5-minute
topographic maps (1:24,000) extending to 10 kilometers from the facility, and USGS 1:250,000 maps
extending out to 50 kilometers, you can identify much of the following:
•
site location,
•
nearby terrain features,
•
waterbodies and watersheds,
•
ecosystems,
•
nearby residences, and
•
land use.
Aerial photographs are frequently available to supplement the depiction of the area. An accurate facility
plot plan—showing buildings, stacks, property and fence lines—is also needed. Facility information
including stack and fugitive source locations, building corners, plant property, and fence lines, in
Universal Transverse Mercator (UTM1 ) grid coordinates in meters east and north might be available in
both USGS reference systems. Therefore, knowledge of the horizontal datum of the geographic
coordinates from which the UTM coordinates were projected is required. We generally recommend
consulting with personnel experienced and knowledgeable in the intricacies of these types of coordinate
systems, and the various software programs used to conduct conversions.
1
UTM is a map coordinate projection of geographic coordinates.
U.S. EPA Region 6
Multimedia Planning and Permitting Division
Center for Combustion Science and Engineering
U.S. EPA
Office of Solid Waste
3-14
Human Health Risk Assessment Protocol
Chapter 3: Air Dispersion and Deposition Modeling
September 2005
Most USGS paper 7.5-minute topographic maps are published in the North American Datum system
established in 1927 (NAD 27). However, most digital elevation data (e.g., USGS Digital Elevation
Mapping) is in the 1983 revised system (NAD 83). We recommend taking special care not to mix source
data based on NAD 27 with data based on NAD 83. Also, we recommend obtaining emission source
information in the original units from the facility data, and convert it to metric units for air modeling, if
necessary. You can get digital terrain data from USGS, or another source.
The following subsections describe the specific information we generally recommend collecting.
Entering this information into the ISCST3 input files is described in Section 3.6.
RECOMMENDED INFORMATION FOR RISK ASSESSMENT REPORT
•
All site-specific maps, photographs, or figures used in developing the air modeling approach
•
Mapped identification of facility information including stack and fugitive source locations,
locations of facility buildings surrounding the emission sources, and property boundaries of
the facility
3.3.1
Surrounding Terrain Information
Terrain is important to air modeling because air concentrations and deposition rates are greatly
influenced by the height of the plume above local ground level. Terrain is characterized by elevation
relative to stack height. For air modeling purposes, terrain is referred to as “complex” if the elevation of
the surrounding land within the assessment area—typically defined as anywhere within 50 kilometers of
the stack—is above the top of the stack evaluated in the air modeling analysis. Terrain at or below stack
top is referred to as “simple.” ISCST3 implements U.S. EPA guidance on the proper application of air
modeling methods in all terrain if you include terrain elevation for each receptor grid node and specify
the appropriate control parameters in the input file.
Even small terrain features may have a large impact on the air dispersion and deposition modeling results
and, ultimately, on the risk estimates. We generally recommend that air modeling include terrain
elevations for every receptor grid node. Some exceptions may be those sites characterized by very flat
terrain where the permitting authority has sufficient experience to comfortably defer the use of terrain
data because the terrain’s historical effect on air modeling results have been minimal.
U.S. EPA Region 6
Multimedia Planning and Permitting Division
Center for Combustion Science and Engineering
U.S. EPA
Office of Solid Waste
3-15
Human Health Risk Assessment Protocol
Chapter 3: Air Dispersion and Deposition Modeling
September 2005
We generally recommend including electronic copies of the digital terrain data used to extract receptor
grid node elevations in the risk assessment report. One way to obtain receptor grid node elevations is
using digital terrain data available from the USGS on the Internet at web site
http://edc.usgs.gov/guides/dem.html. For most locations, an acceptable degree of accuracy is provided
by the USGS “One Degree” (e.g., 90 meter data) data available as “DEM 250" 1:250,000 scale for the
entire United States free of charge. For areas requiring more accurate terrain, USGS 30-meter (1:24,000
scale) data might be considered, though it is not universally available. Either 90-meter or 30-meter data
is sufficient for most risk assessments which utilize 100 meter or greater grid spacing. Digital terrain
data is also available for purchase from a variety of commercial vendors, who may require
vendor-provided programs to extract the data. You can also manually extract the elevation of each
receptor grid node from USGS topographic maps.
RECOMMENDED INFORMATION FOR RISK ASSESSMENT REPORT
•
Description of the terrain data used for air dispersion modeling
•
Summary of any assumptions made regarding terrain data
•
Description of the source of any terrain data used, including any procedures used to
manipulate terrain data for use in air dispersion modeling
3.3.2
Surrounding Land Use Information
Land use information is needed in the risk assessment for air dispersion modeling, as well as identifying
and selecting exposure scenario locations (see Chapter 4). Land use analysis for air dispersion modeling
usually occurs out to a radius of 3 kilometers from the centroid of the stacks from which emissions are
being modeled. Certain land uses, as defined by air modeling guidance, affect the selection of air
dispersion modeling variables. These variables are known as dispersion coefficients and surface
roughness. You typically use USGS 7.5-minute topographic maps, aerial photographs, or visual surveys
to define the air dispersion modeling land uses.
Land use information is also important for selecting exposure scenario locations, but at a radius further
(50 kilometers) from the emission source(s), to make sure all receptors that may be impacted are
identified. In most cases, though, air modeling performed out to a radius of 10 kilometers allows
U.S. EPA Region 6
Multimedia Planning and Permitting Division
Center for Combustion Science and Engineering
U.S. EPA
Office of Solid Waste
3-16
Human Health Risk Assessment Protocol
Chapter 3: Air Dispersion and Deposition Modeling
September 2005
adequate characterization for evaluating exposure scenario locations. If you are evaluating a facility with
multiple stacks or emission sources, we generally recommend extending the radius from the centroid of a
polygon drawn connecting the various stack coordinates.
3.3.2.1 Land Use for Dispersion Coefficients
You need to specify the appropriate dispersion coefficients for ISCST3 to run properly. Land uses need
to be defined in order to specify dispersion coefficients. We generally recommend using the Auer
method specified in the Guideline on Air Quality Models (40 CFR Part 51, Appendix W) (U.S. EPA
1996k; 1999b) to define land use. Land use categories of “rural” or “urban” are taken from Auer (1978).
Areas typically defined as rural include residences with grass lawns and trees, large estates, metropolitan
parks and golf courses, agricultural areas, undeveloped land, and water surfaces. Auer typically defines
an area as “urban” if it has less than 35 percent vegetation coverage or the area falls into one of the
following use types:
TABLE 3-2
URBAN LAND USE TYPES
Urban Land Use
Type
Use and Structures
Vegetation
I1
Heavy industrial
Less than 5 percent
I2
Light/moderate industrial
Less than 5 percent
C1
Commercial
Less than 15 percent
R2
Dense single/multi-family
Less than 30 percent
R3
Multi-family, two-story
Less than 35 percent
In general, the Auer method is described as follows:
Step 1 Draw a radius of 3 kilometers from the center of the stack(s) on the site map.
Step 2 Inspect the maps, and define in broad terms whether the area within the radius is rural or
urban, according to Auer’s definitions.
Step 3 Classify smaller areas within the radius as either rural or urban, based on Auer’s
definitions. (It may be prudent to overlay a grid [for example, 100 by 100 meters] and
identify each square as primarily rural or urban)
Step 4 Count the number of rural squares; if more than 50 percent of the total squares are rural,
the area is rural; otherwise, the area is urban.
U.S. EPA Region 6
Multimedia Planning and Permitting Division
Center for Combustion Science and Engineering
U.S. EPA
Office of Solid Waste
3-17
Human Health Risk Assessment Protocol
Chapter 3: Air Dispersion and Deposition Modeling
September 2005
Alternatively, digital land use databases may be used in a computer-aided drafting system to perform this
analysis.
RECOMMENDED INFORMATION FOR RISK ASSESSMENT REPORT
•
Description of the methods used to determine land use surrounding the facility
•
Copies of any maps, photographs, or figures used to determine land use
•
Description of the source of any computer-based maps used to determine land use
3.3.2.2 Land Use for Surface Roughness Height (Length)
Surface roughness height—also referred to as (aerodynamic) surface roughness length—is the height
above the ground at which the wind speed goes to zero. Surface roughness affects the height above local
ground level that a particle moves from the ambient air flow above the ground (for example in the plume)
into a “captured” deposition region near the ground. That is, ISCST3 assumes the particle is deposited to
the ground at some point above the actual land surface, based on surface roughness height. Surface
roughness height is defined by individual elements on the landscape, such as trees and buildings.
There are several methods for computing surface roughness. One uses measurements of hourly surface
roughness based on wind direction (fetch). Another uses the change in wind speed with height in the
surface layer, as measured on an instrumented tower operated at the site. We recommend deciding which
method to use to characterize surface roughness based on the variability of surface features and seasonal
values for the site. In lieu of any other method, the paragraphs below describe our recommendations for
computing surface roughness.
In order to be consistent with the recommended method for determining land use for dispersion
coefficients (Section 3.3.2.1), the land use within 3 kilometers generally is acceptable for determining
surface roughness. Surface roughness height values for various land use types are as follows:
U.S. EPA Region 6
Multimedia Planning and Permitting Division
Center for Combustion Science and Engineering
U.S. EPA
Office of Solid Waste
3-18
Human Health Risk Assessment Protocol
Chapter 3: Air Dispersion and Deposition Modeling
September 2005
TABLE 3-3
SURFACE ROUGHNESS HEIGHTS
Surface Roughness Heights for Land Use Types and Seasons (meters)
Land Use Type
Spring
Summer
Autumn
Winter
0.0001
0.0001
0.0001
0.0001
Deciduous forest
1.00
1.30
0.80
0.50
Coniferous forest
1.30
1.30
1.30
1.30
Swamp
0.20
0.20
0.20
0.05
Cultivated land
0.03
0.20
0.05
0.01
Grassland
0.05
0.10
0.01
0.001
Urban
1.00
1.00
1.00
1.00
0.30
0.30
0.30
0.15
Water surface
Desert shrubland
Source: Sheih, et al. (1979)
If a significant number of buildings are located in the area, higher surface roughness heights (such as
those for trees) may be appropriate (U.S. EPA 1995g). Previous guidance documents do not recommend
a specific method for determining average surface roughness height. If you are using National Weather
Service surface meteorological data, we generally recommend setting the surface roughness height for
the measurement site at 0.10 meters (grassland, summer). If you intend to propose a different value for
the measurement site, we recommend using the following procedure to determine the value:
Step 1 Draw a radius of 3 kilometers from the center of the stack(s) on the site map.
Step 2 Inspect the maps, and use professional judgment to classify the area within the radius
according to land use type (for example water, grassland, cultivated land, and forest); a
site visit may be necessary to verify some classifications.
Step 3 Divide the circular area into 12 angular sectors of 30 degrees.
Step 4 Identify a single representative surface roughness height for each sector, based on an
area-weighted average of the land use types within the sector using the categories
identified above.
Step 5 Input the area-weighted surface roughness height value representative of each of the 12
sectors into MPRM for preprocessing the meteorological data file.
Site-specific conditions might be such that you consider methods other than those described above more
appropriate for determining surface roughness height. In such instances, we recommend clearly
identifying and discussing the alternative methods with the appropriate parties (regulatory authority or
facility) prior to use.
U.S. EPA Region 6
Multimedia Planning and Permitting Division
Center for Combustion Science and Engineering
U.S. EPA
Office of Solid Waste
3-19
Human Health Risk Assessment Protocol
Chapter 3: Air Dispersion and Deposition Modeling
3.3.3
September 2005
Information on Facility Building Characteristics
Building wake effects, also referred to as “building downwash,” have a significant impact on the
concentration and deposition of COPCs near the stack. Building wake effects are flow lines that cause
plumes to be forced down to the ground much sooner than they would if the building was not there. The
ISCST3 model contains algorithms for evaluating this phenomenon. We recommend that the downwash
analysis consider all nearby structures with heights at least 40 percent of the height of the shortest stack
to be modeled. The 40 percent value is based on Good Engineering Practice (GEP) stack height of 2.5
times the height of nearby structures or buildings (stack height divided by 2.5 is equal to 0.40 multiplied
by the stack height [40 CFR Part 51 Appendix W]). BPIP uses Building dimensions and locations, and
stack heights and locations, to identify the potential for building downwash. BPIP and the BPIP User’s
Guide are available for download from the SCRAM web site (http://www.epa.gov/scram001/) to address
specific questions. The BPIP output file is in a format that can be copied and pasted into the source (SO)
pathway of the ISCST3 input file. We generally recommend the following procedure to identify
buildings for input to BPIP:
Step 1 Lay out facility plot plan, with buildings and stack locations clearly identified (building
heights identified for each building); for buildings with more than one height or roof
line, identify each height (BPIP refers to each height as a tier).
Step 2 Identify the buildings to be included in the BPIP analysis by comparing building heights
to stack heights. The building height test specifies that only buildings at least 40 percent
of the height of a potentially affected stack be included in the BPIP input file. For
example, if a combustion unit stack is 50 feet high, only buildings at least 20 feet tall
(0.40 multiplied by 50 feet) will affect air flow at stack top. Any buildings shorter than
20 feet need not be included in the BPIP analysis. The building height test is performed
for each stack and each building.
Step 3 Use the building distance test to check each building to be included in BPIP from the
building height test. For the building distance test, only buildings “nearby” the stack will
affect air flow at stack top. “Nearby” is defined as “five times the lesser of building
height or crosswind width” (U.S. EPA 1995c). A simplified distance test may be used by
considering only the building height rather than the crosswind width. While some
buildings with more height than width will be included unnecessarily using this
simplification, BPIP will identify correctly only the building dimensions required for
ISCST3.
An example, hypothetical plot plan identifies a 25-foot tall building that is 115 feet from
the 50-foot tall combustion unit stack center to the closest building corner. The building
distance test, for this building only, is five times the building height, or 125 feet (five
multiplied by the building height, 25 feet). This building would be included in the BPIP
analysis, because it passes the building height test and building distance test.
U.S. EPA Region 6
Multimedia Planning and Permitting Division
Center for Combustion Science and Engineering
U.S. EPA
Office of Solid Waste
3-20
Human Health Risk Assessment Protocol
Chapter 3: Air Dispersion and Deposition Modeling
September 2005
Step 4 Repeat steps 2 and 3 for each building and each stack, identifying all buildings to be
included in the BPIP. If the number of buildings exceeds the BPIP limit of eight
buildings, consider combining buildings, modifying BPIP code for more buildings, or
using third-party commercial software which implements BPIP. If two buildings are
closer than the height of the taller building, the two buildings may be combined. For
example, two buildings are 40 feet apart at their closest points. One building is 25 feet
high, and the other building is 50 feet high. The buildings could be combined into one
building for input to BPIP. For input to BPIP, the corners of the combined building are
the outer corners of the two buildings. For unusually shaped buildings with more than
the eight corners allowed by BPIP, approximate the building by using the eight corners
that best represent the extreme corners of the building. The BPIP User’s Guide contains
additional description and illustrations on combining buildings, and BPIP model
limitations (U.S. EPA 1995c).
Step 5 Mark off the facility plot plan with UTM grid lines. Extract the UTM coordinates of
each building corner and each stack center to be included in BPIP input file. Although
BPIP allows the use of “plant coordinates,” we recommend that all inputs to the air
model be prepared using UTM coordinates (meters) for consistency. UTM coordinates
are rectilinear, oriented to true north, and needed in metric units for ISCST3 modeling.
Almost all air modeling will need to use USGS topographic data (digital and maps) for
receptor elevations, terrain grid files, locating plant property, and identifying
surrounding site features. Therefore, using an absolute coordinate system will enable
you to check inputs at each step of the analysis. Also, the meteorological data are
oriented to true north. Significant errors will result from ISCST3 if incorrect stack or
building locations are used, plant north is incorrectly rotated to true north, or incorrect
base elevations are used. With computer run times requiring many hours (up to 40 hours
for one deposition run with depletion), verifying locations at each step while preparing
model inputs will prevent the need to remodel.
We recommend observing several precautions and guidelines while preparing input files for BPIP:
•
Graphically confirming the correct locations before BPIP is run. One method is to plot
the buildings and stack locations using graphics software. Several commercial programs
incorporating BPIP provide graphic displays of BPIP inputs.
•
In addition to using UTM coordinates for stack locations and building corners, also use
meters as the units for height.
•
Carefully include the stack base elevation and building base elevations according to
BPIP User’s Guide instructions.
•
Note that the BPIP User’s Guide (revised February 8, 1995) has an error on page 3-5,
Table 3-1, under the “TIER(i,j)” description, which incorrectly identifies tier height as
base elevation.
•
BPIP mixes the use of “real” and “integer” values in the input file. To prevent possible
errors in the input file, note that integers are used where a count is requested (for
example, the number of buildings, number of tiers, number of corners, or number of
stacks).
U.S. EPA Region 6
Multimedia Planning and Permitting Division
Center for Combustion Science and Engineering
U.S. EPA
Office of Solid Waste
3-21
Human Health Risk Assessment Protocol
Chapter 3: Air Dispersion and Deposition Modeling
•
September 2005
Make the stack identifiers (up to eight characters) in BPIP identical to those used in the
ISCST3 input file, or ISCST3 will report errors.
For most sites, BPIP executes in less than 1 minute. The array of 36 building heights and 36 building
widths (one for each of 36 10-degree direction sectors) are input into the ISCST3 input file by cutting
and pasting from the BPIP output file. We recommend deleting the five blank spaces preceding “SO” in
the BPIP output file, so that the “SO” begins in the first column of the ISCST3 input file.
One use of BPIP is to design stack heights for new facilities. Another is to determine what stack height
increases are necessary to avoid building influence on air flow, which may cause high concentrations and
deposition near the facility. The output for BPIP provides the GEP heights for stacks. Significant
decreases in concentrations and deposition rates will begin at stack heights at least 1.2 times the building
height, and further decreases occur at 1.5 times building height, with continual decreases of up to 2.5
times building height (GEP stack height) where the building no longer influences stack gas.
3.4
METEOROLOGICAL DATA PRIMER
Air dispersion and deposition modeling is extremely complicated, and uses data potentially unfamiliar if
your expertise lies outside meteorology and air modeling. Section 3.4 is an introduction to the types of
meteorological data used by air dispersion and deposition models, as well as information on potential
data sources. Section 3.5 continues this introduction into the specific data parameters required by
MPRM, the data preprocessor for the ISCST3 air model.
Generally speaking, air concentration and deposition models attempt to characterize the effects of
atmospheric forces on a mass of COPC found in the air. These forces can be divided between:
•
those which transport the COPC (the dominant factor is wind);
•
those which disturb the straight flow of the COPC away from the source (also known as
mixing, examples include building downwash effects, and atmospheric stability); and
•
those actors which remove, or conditions which encourage the removal of, the COPC
from the atmosphere (An example of a removal actor would be rain, whereas an example
“condition” would be the point above the ground at which windspeed slows to zero).
Air concentration and deposition models need a variety of meteorological information, at different levels
of temporal definition. The ISCST3 model requires the following:
U.S. EPA Region 6
Multimedia Planning and Permitting Division
Center for Combustion Science and Engineering
U.S. EPA
Office of Solid Waste
3-22
Human Health Risk Assessment Protocol
Chapter 3: Air Dispersion and Deposition Modeling
September 2005
•
Hourly values (also know as “surface data, as they describe conditions closer to ground
level)
a.
Wind direction (degrees from true north)
b.
Wind speed (m/s)
c.
Dry bulb (ambient air) temperature (K)
d.
Opaque cloud cover (tenths)
e.
Cloud ceiling height (m)
f.
For dry particle deposition:
i.
surface pressure (millibar)
ii.
solar radiation (watts/m2 )
g.
For wet particle deposition:
i.
Precipitation amount (inches)
ii.
Precipitation type (liquid or frozen)
•
Daily values (also called “upper air data” as they describe conditions higher in the
atmosphere)
a.
Morning mixing height (m)
b.
Afternoon mixing height (m)
The following subsections describe important characteristics of the needed data.
RECOMMENDED INFORMATION FOR RISK ASSESSMENT REPORT
•
3.4.1
Identification of all sources of meteorological data
Wind Direction and Wind Speed
Wind direction and speed are two of the most critical parameters in air modeling. The wind direction
promotes higher concentration and deposition if it persists from one direction for long periods during a
year. For example, a predominantly south wind, such as on the Gulf Coast of Texas, will contribute to
high concentrations and depositions north of the facility. Wind speed is inversely proportional to
concentration predicted using air modeling: The higher the wind speed, the lower the concentration will
be. If wind speed doubles, the concentration and deposition will be reduced by one-half. Air models
need wind speed and wind direction at the stack top. Most air modeling is performed using government
sources of surface data. Wind data are typically measured by National Weather Service (NWS) stations
at a height of 10 meters. However, since some stations have wind speed recorded at a different height,
we recommend always verifying the anemometer height, and that the correct value is input into the
meteorological data preprocessing program. ISCST3 uses a wind speed profile to calculate wind speed at
stack top. This calculation exponentially increases the measured wind speed from the measured height to
U.S. EPA Region 6
Multimedia Planning and Permitting Division
Center for Combustion Science and Engineering
U.S. EPA
Office of Solid Waste
3-23
Human Health Risk Assessment Protocol
Chapter 3: Air Dispersion and Deposition Modeling
September 2005
a calculated wind speed at stack height. ISCST3 assumes that wind direction at stack height is the same
as that measured at the NWS station height (U.S. EPA 1995c).
3.4.2
Dry Bulb Temperature
Dry bulb temperature, or ambient air temperature, is the same temperature reported on the television and
radio stations across the country each day. Dry bulb (ambient) temperature contributes to describing the
surface conditions that vary from hour to hour in the measured meteorological data needed for air
modeling. It therefore has a direct effect on the modeling results, as described below.
Dry bulb temperature is typically measured at 2 meters above ground level. ISCST3 uses air temperature
in the buoyant plume rise equations developed by Briggs (U.S. EPA 1995f). The model results are not
very sensitive to air temperature, except at extremes. However, buoyant plume rise is very sensitive to
the stack gas temperature. Buoyant plume rise is mainly a result of the difference between stack gas
temperature and ambient air temperature. Conceptually, it is similar to a hot air balloon: The higher the
stack gas temperature, and lower the ambient temperature, the higher will be the plume rise. High plume
heights result in low concentrations and depositions as the COPCs travel further and are diluted in a
larger volume of ambient air before reaching the surface. A large variation in ambient temperature will
affect buoyant plume rise, but not as much as variations in stack gas temperature. The fact that the stack
gas temperature is constant (for most modeling analyses) is the very point for noting that it is the changes
in the dry bulb temperature that creates the temperature differential affecting plume rise in the air model
(see also Section 3.6.2.2 regarding selection of stack gas exit temperature). The temperature is measured
in K, so a stack gas temperature of 450°F is equal to 505 K, an ambient temperature of 90°F = 305 K, and
32°F = 273 K.
When determining values for dry bulb temperature (or ambient air temperature), it is important not to
appear to be ‘data shopping’ by artificially selecting a period of meteorological data that has either
average or above-average ambient temperatures that will reduce plume rise. The skewing of results in
one direction or another may over-estimate concentrations near the source, but under-estimate
concentrations and depositions away from the source where more sensitive receptors may be located (see
Chapter 4 for more on Exposure Scenario location) . Attempts to increase protectiveness by applying
such approaches may not achieve the desired result.
U.S. EPA Region 6
Multimedia Planning and Permitting Division
Center for Combustion Science and Engineering
U.S. EPA
Office of Solid Waste
3-24
Human Health Risk Assessment Protocol
Chapter 3: Air Dispersion and Deposition Modeling
September 2005
If the meteorological data sets you use, and your choice of dry bulb temperature are not consistent with
the HHRAP, we recommend clearly identifying and discussing them in the risk plan and/or cost estimate
(as appropriate) to ensure clarity and transparency of the final risk assessment results.
3.4.3
Opaque Cloud Cover
Observations of opaque cloud cover are used to calculate the stability of the atmosphere. Stability
determines the dispersion, or dilution, rate of COPCs in the atmosphere. Rapid dilution occurs in
unstable air conditions, while stable air results in very little mixing, or dilution, of the emitted COPCs.
With clear skies during the day, the sun heats the Earth’s surface, which heats the air immediately above
it. The warm air rises and overturns with the cooler air above it. During this “unstable” condition, while
layers of air are moving through one another, the stack plume mixes as the air mixes.
A cool surface occurs at night because of radiative loss of heat on clear nights. With a cloud cover,
surface heating during the day and heat loss at night are reduced, resulting in moderate mixing rates, or
neutral stability.
Opaque cloud cover is a measure of the transparency of the clouds. For example, a completely overcast
sky with 10/10ths cloud cover may have only 1/10th opaque cloud cover if the clouds are high,
translucent clouds that do not prevent sunlight from reaching the Earth’s surface.
3.4.4
Cloud Ceiling Height
ISCST3 needs cloud ceiling height to calculate stability. Specifically, the height of the cloud cover
affects the heat balance at the Earth’s surface.
3.4.5
Surface Pressure
The MPRM preprocessor for ISCST3 requires station (i.e. surface) pressure. MPRM uses station
pressure to compute Monin-Obukhov Length and Friction Velocity, two boundary layer parameters that
ISCST3 needs to perform dry particle deposition. ISCST3 is not very sensitive to surface pressure.
U.S. EPA Region 6
Multimedia Planning and Permitting Division
Center for Combustion Science and Engineering
U.S. EPA
Office of Solid Waste
3-25
Human Health Risk Assessment Protocol
Chapter 3: Air Dispersion and Deposition Modeling
3.4.6
September 2005
Incoming Short-wave Radiation\Leaf Area Index
Solar radiation affects the respiratory activity of leaf surfaces, which affects the rate of dry vapor
deposition. We recommend using the method described in Section 3.6.1 to address the effects of dry
vapor deposition. Specify a single value in the ISCST3 input file for dry vapor deposition velocity for all
hours. Even though incoming solar radiation and leaf area index are not used when specifying the dry
vapor deposition velocity, the ISCST3 model will not run properly if values for these two data fields
aren’t included in the meteorological input file.
Though we don’t recommend it, ISCST3 is able to compute the hourly dry vapor deposition velocity by
combining hourly incoming short-wave (solar) radiation with the user-specified, site-specific leaf area
index. The default value specified in the Addendum to the MPRM User’s Guide (U.S. EPA 1999c) may
be used for leaf area index when site-specific data is not available.
3.4.7
Precipitation Amount and Type
In order to calculate wet deposition of vapor and particles, ISCST3 requires that MPRM process
precipitation amount and type into the ISCST3 meteorological file. Precipitation is measured at 3 feet
(roughly 1 meter) above ground level. The amount of precipitation will directly influence the amount of
wet deposition at a specific location. Particles and vapor are both captured by falling precipitation,
known as precipitation scavenging.
Scavenging coefficients are needed as inputs to ISCST3 for vapors, with a rate specified each for liquid
and frozen precipitation. The precipitation type in a SAMSON weather report (see Section 3.4.9 for
more information on SAMSON) will identify to ISCST3 which event is occurring for appropriate use of
the scavenging coefficients entered (see Section 3.6.2.6). MPRM can also read supplemental
precipitation files from NCDC, and integrate the data with CD-144 data in the ISCST3 meteorological
file. We discuss the importance of precipitation to ISCST3 results further in Section 3.4.9 ( Potential
Data Sources).
3.4.8
Upper Air Data (Mixing Height)
Upper air data are needed to run the ISCST3 model. MPRM uses measurements of morning and
afternoon (twice daily) upper air data to calculate an hourly mixing height using interpolation methods
U.S. EPA Region 6
Multimedia Planning and Permitting Division
Center for Combustion Science and Engineering
U.S. EPA
Office of Solid Waste
3-26
Human Health Risk Assessment Protocol
Chapter 3: Air Dispersion and Deposition Modeling
September 2005
(U.S. EPA 1996j). We recommend that only years with complete upper air data be used as input for air
modeling. It is important that the years you select for upper air data match the years you select for
surface data. If matching years of data are not available from a single upper air station, we recommend
another upper air station be used for completing the five years. We also recommend discussing your
choice of representative data with the appropriate authorities prior to performing air modeling.
3.4.9
Potential Data Sources
As shown in Figure 3-1, these data are available from several different sources. For most air modeling,
we recommend five years of data from a representative NWS station. However, in some instances where
the closest NWS data is clearly not representative of site-specific meteorological conditions, and there is
insufficient time to collect 5 years of onsite data, you might use 1 year of onsite meteorological data
(consistent with GAQM) to complete the risk assessment. We recommend clearly identifying and
discussing your choice of representative meteorological data with the appropriate parties (e.g. permitting
authority or facility) prior to air modeling.
FIGURE 3-1
SOURCES OF METEOROLOGICAL DATA
Meteorological Data Processing - Government Sources
U.S. EPA Region 6
Multimedia Planning and Permitting Division
Center for Combustion Science and Engineering
U.S. EPA
Office of Solid Waste
3-27
Human Health Risk Assessment Protocol
Chapter 3: Air Dispersion and Deposition Modeling
September 2005
Meteorological Data Processing - Commercial Sources
Surface Data
Upper Air Data
On-Site
Surface
NCDC
Precipitation
Data
MPRM
Required if not
included incommercial
on-site source data
NCDC
Mixing
Height
ISCST3
Meteorological File
Hourly data, also know as “surface data” because it tends to characterize meteorology nearer the surface,
can be obtained from the National Climatic Data Center (NCDC) web site at address
(http://lwf.ncdc.noaa.gov/oa/ncdc.html). We recommend data in the SAMSON format (available on
CD-ROM). SAMSON data are available for 239 airports across the U.S. for the period of 1961 through
1990. SAMSON data contain all of the needed input parameters used by ISCST3 to compute
concentration, dry and wet particle deposition, and dry and wet vapor deposition.
You could also get hourly surface data from NCDC in TD-3280 format, then reformat it to CD-144
format for input to MPRM. Precipitation data in TD-3240 format is also available from NCDC. TD3240 formatted data is processed by MPRM to supplement the hourly surface data.
National Climatic Data Center
Federal Building
37 Battery Park Avenue
Asheville, NC 28801-2733
Customer Service: (704) 271-4871
File type:
File name:
Hourly precipitation amounts
NCDC TC-3240
Hourly surface observations with precipitation type
NCDC TD-3280
Hourly surface observations with precipitation type
NCDC SAMSON CD-ROM (Vol. I , II, and/or III)
Twice daily mixing heights from nearest station
NCDC TD-9689
(also available on SCRAM web site for 1984 through 1991)
U.S. EPA Region 6
Multimedia Planning and Permitting Division
Center for Combustion Science and Engineering
U.S. EPA
Office of Solid Waste
3-28
Human Health Risk Assessment Protocol
Chapter 3: Air Dispersion and Deposition Modeling
September 2005
Currently, MPRM is the most appropriate Agency meteorological preprocessor program for preparing the
surface and upper air data into an ISCST3 meteorological input file. Most air modeling analyses will use
MPRM to process the National Weather Service data.
We recommend using the most recent 5 years of complete meteorological data available on SAMSON (or
more recent sources) for the air modeling. It’s desirable, but not mandatory, that the 5 years be
consecutive.
Each year of the 5 years of data should be complete before being processed by MPRM. If data gaps
exist, we recommend filling in all missing data. The procedures we recommend for filling missing
surface and upper air data are documented on the SCRAM web site under the meteorological data
section. If the missing data are not addressed by the Agency objective procedures, then with the approval
of the permitting authority, you can develop a subjective method for filling in missing data. If conditions
occur such that:
1.
missing values are not able to be replaced; and
2.
the permitting authority approves the use of the meteorological data in that condition
then specify the MSGPRO keyword in the COntrol pathway of the ISCST3 input file. Note that the
DEFAULT keyword can't be used with MSGPRO.
If you wish to use less than 5 years of meteorological data, we recommend clearly identifying and
discussing this with all appropriate parties (e.g. permitting authority, or facility).
To prevent the need to repeat air modeling activities, we recommend that your choices of representative
upper air and surface data be clearly identified and discussed with the appropriate parties (e.g. regulatory
authority, facility) before you begin preprocessing and air modeling. Also, we recommend completely
documenting all processing of meteorological data, including sources of data, selection criteria,
consideration for precipitation amounts, preprocessor options selected, and filled missing data. If your
choices of meteorological data (e.g. selection of upper air data, or determination of dry bulb temperature)
are inconsistent with this guidance, we further recommend clearly identifying and discussing these
choices in the risk plan and/or cost estimate (as appropriate) to ensure clarity and transparency of the
final risk assessment results.
U.S. EPA Region 6
Multimedia Planning and Permitting Division
Center for Combustion Science and Engineering
U.S. EPA
Office of Solid Waste
3-29
Human Health Risk Assessment Protocol
Chapter 3: Air Dispersion and Deposition Modeling
September 2005
RECOMMENDED INFORMATION FOR RISK ASSESSMENT REPORT
•
Electronic copy of the ISCST3 input code used to enter meteorological information
•
Description of the selection criteria and process used to identify representative years used for
meteorological data
•
Identification of the 5 years of meteorological selected
•
Summary of the procedures used to compensate for any missing data
3.5
METEOROLOGICAL PREPROCESSOR DATA NEEDS
After selecting the appropriate surface and upper air data using the procedures outlined in Section 3.4,
you still need to put the data into a form that ISCST3 can use. As stated above, we recommend using the
meteorological preprocessor MPRM to do this. The following Section describes the data MPRM itself
requires in order to perform the preprocessing. Agency approval is recommended in the selection of
MPRM parameter values.
We recommend preparing an ISCST3 meteorological file that can be used to calculate either
concentration or deposition (what MPRM terms an “ISCGASW” file). All necessary parameters will
then be available to ISCST3 for any subsequent concentration or deposition modeling. For example, if
only the concentration option is selected in ISCST3 for a specific run, ISCST3 will ignore the
precipitation values in the meteorological file. For subsequent air deposition modeling, ISCST3 will
access the precipitation data from the same preprocessed meteorological file.
MPRM includes extensive QA/QC to check for values that are out of range. MPRM also checks for
missing data and summarizes values that require editing to fill missing data. After a complete surface file
passes the quality checks, it is processed with NCDC upper air data.
MPRM needs the following input parameters representative of the meteorological measurement site
(typically the nearest representative National Weather Station):
U.S. EPA Region 6
Multimedia Planning and Permitting Division
Center for Combustion Science and Engineering
U.S. EPA
Office of Solid Waste
3-30
Human Health Risk Assessment Protocol
Chapter 3: Air Dispersion and Deposition Modeling
•
Minimum Monin-Obukhov length
•
Anemometer height
•
Surface roughness length (at measurement site)
•
Noon-time albedo
•
Bowen ratio
•
Anthropogenic heat flux
•
Fraction of net radiation absorbed at surface
September 2005
MPRM also needs the following input parameter representative of the application site (e.g., source
location):
•
Surface roughness length (at application site)
The MPRM User’s Guide contains detailed information for preparing the ISCST3 meteorological input
file (U.S. EPA 1996j). The parameters listed are briefly described in the following subsections. These
data are not included in the surface or mixing height data files obtained from the U.S. EPA or NCDC.
We recommend taking special care, while using the tables in the MPRM User’s Guide or reference
literature, to select values representative of the meteorological measurement site and the site to be
modeled. We recommend clearly identifying and discussing the selected values with the appropriate
parties (e.g. permitting authority, or facility) before processing the meteorological data.
3.5.1
Monin-Obukhov Length
The Monin-Obukhov length (L) is a measure of atmospheric stability. It is negative during the day, when
surface heating causes unstable air. It is positive at night, when the surface is cooled and the atmosphere
more stable. In urban areas during stable conditions, the estimated value of L may not adequately reflect
the less stable atmosphere associated with the mechanical mixing generated by buildings or structures.
However, MPRM needs an input for minimum urban Monin-Obukhov length, even if the area to be
analyzed by ISCST3 is rural. A nonzero value for L must be entered to run MPRM. We recommend
using a value of 2.0 meters for L when the land use surrounding the site is rural (see Section 3.3.2.1). For
urban areas, Hanna and Chang (1991) suggest that a minimum value of L be set for stable hours to
U.S. EPA Region 6
Multimedia Planning and Permitting Division
Center for Combustion Science and Engineering
U.S. EPA
Office of Solid Waste
3-31
Human Health Risk Assessment Protocol
Chapter 3: Air Dispersion and Deposition Modeling
September 2005
simulate building-induced instability. The following are general examples of L values for various land
use classifications:
TABLE 3-4
L VALUES FOR VARIOUS LAND USES
Land Use Classification
Minimum L
Agricultural (open)
2 meters
Residential
25 meters
Compact residential/industrial
50 meters
Commercial (19 to 40-story buildings)
100 meters
Commercial (>40-story buildings)
150 meters
MPRM will use the minimum L value in calculating urban stability parameters. These urban values will
be ignored by ISCST3 during the air modeling analyses for rural sites.
3.5.2
Anemometer Height
ISCST3 model results are very sensitive to small variations in wind speed. The height of the wind speed
measurements is needed by ISCST3 to calculate wind speed at stack top. The wind sensor (anemometer)
height for every National Weather Service station is identified in the station history section of the Local
Climatological Data Summary available from NCDC. Since 1980, most National Weather Service
stations measure wind speed at the height of 10 meters. However, some stations operate at other heights
or have data at more than one height. We generally recommend verifying the correct measurement height
for each year of data prior to processing with MPRM and running the ISCST3 model.
3.5.3
Surface Roughness Length at Measurement Site
Surface roughness length (or height) is a measure of the height of obstacles to wind flow. It is important
in ISCST3 because it determines how close a particle must be to the ground before it is “captured” for
deposition on the ground. Slight variations in surface roughness can lead to dramatic differences in
ISCST3 results. For surface meteorological data from a National Weather Station, we typically
recommend using a value of 0.10 meters for the “measurement site.” Surface roughness is proportional,
but not equal, to the physical height of the obstacles. Table 3-3 (in Section 3.3.2.2) lists available
roughness height values. These values are based on the general land use in the vicinity of the
U.S. EPA Region 6
Multimedia Planning and Permitting Division
Center for Combustion Science and Engineering
U.S. EPA
Office of Solid Waste
3-32
Human Health Risk Assessment Protocol
Chapter 3: Air Dispersion and Deposition Modeling
September 2005
measurement site. We recommend considering these values in discussions with the appropriate parties
prior to air modeling.
3.5.4
Surface Roughness Length at Application Site
MPRM also needs the surface roughness length at the facility (application site) in order to prepare the
ISCST3 meteorological file. ISCST3 model results are very sensitive to the value used in MPRM for this
parameter. Table 3-3 in Section 3.3.2.2 is also applicable to the application site. Compute a single
surface roughness value representative of the site by using the method described in Section 3.3.2.2. We
recommend clearly identifying and discussing the computed surface roughness length for the application
site, along with maps or photographs illustrating land use, with the appropriate parties (e.g. permitting
authority or facility) prior to use.
3.5.5
Noon-Time Albedo
“Noon-time albedo” is the fraction of the incoming solar radiation that is reflected from the ground when
the sun is directly overhead. Albedo is used in calculating the hourly net heat balance at the surface. Net
heat balance at the surface is then used in calculating hourly values of Monin-Obukhov length. MPRM
automatically adjusts for the variation in albedo with solar elevation angle. Experience suggests that
ISCST3 modeling results are not sensitive to the value selected for this parameter. Table 3-5 presents
typical albedo values. Albedo values vary from 0.10 to 0.20 on water surfaces from summer to winter.
Cultivated farmland values vary the most, from 0.14 during spring when land is tilled to expose dark
earth, to 0.60 in winter when areas are snow-covered.
U.S. EPA Region 6
Multimedia Planning and Permitting Division
Center for Combustion Science and Engineering
U.S. EPA
Office of Solid Waste
3-33
Human Health Risk Assessment Protocol
Chapter 3: Air Dispersion and Deposition Modeling
September 2005
TABLE 3-5
ALBEDO OF NATURAL GROUND COVERS FOR LAND USE TYPES AND SEASONS
Seasona
Land Use Type
Spring
Summer
Autumn
Winter
Water surface
0.12
0.10
0.14
0.20
Deciduous forest
0.12
0.12
0.12
0.50
Coniferous forest
0.12
0.12
0.12
0.35
Swamp
0.12
0.14
0.16
0.30
Cultivated land
0.14
0.20
0.18
0.60
Grassland
0.18
0.18
0.20
0.60
Urban
0.14
0.16
0.18
0.35
Desert shrubland
0.30
0.28
0.28
0.45
Source—Iqbal (1983)
a
The various seasons are defined by Iqbal (1983) as follows:
Spring:
Periods when vegetation is emerging or partially green; this is a transitional situation that applies for 1 to
2 months after the last killing frost in spring.
Summer:
Periods when vegetation is lush and healthy; this is typical of mid-summer, but also of other seasons in
which frost is less common.
Autumn:
Periods when freezing conditions are common, deciduous trees are leafless, crops are not yet planted or
are already harvested (bare soil exposed), grass surfaces are brown, and no snow is present.
Winter:
Periods when surfaces are covered by snow and temperatures are below freezing. Winter albedo depends
on whether a snow cover is present continuously, intermittently, or seldom. Albedo ranges from about
0.30 for bare snow cover to about 0.65 for continuous cover.
Based on the information in Table 3-5, rural area albedo estimates vary from 0.14 to 0.20 for cultivated
land, and from 0.18 to 0.20 for grassland. For urban areas without snow, values vary from 0.14 to 0.18.
For practical purposes, it is desirable to process a complete year of meteorological data with a single
value for noon-time albedo. For example, the single value of 0.18 may be appropriate to process all
meteorological data for an urban site. For rural sites, a single albedo value of 0.18 for grassland and
cultivated land may be appropriate for areas without significant snow cover during winter months. For
desert shrubland, a single value of 0.28 may be appropriate. A single value of 0.12 could be
representative of forested areas. We recommend discussing the proposed values with the permitting
authority prior to air modeling.
U.S. EPA Region 6
Multimedia Planning and Permitting Division
Center for Combustion Science and Engineering
U.S. EPA
Office of Solid Waste
3-34
Human Health Risk Assessment Protocol
Chapter 3: Air Dispersion and Deposition Modeling
3.5.6
September 2005
Bowen Ratio
The Bowen ratio is the ratio of the sensible heat flux to the evaporative or latent heat flux at the ground
surface. The presence of moisture affects the heat balance through evaporative cooling, which, in turn,
affects the hourly Monin-Obukhov length calculated by MPRM. Surface moisture is highly variable.
Daytime Bowen ratios are presented in Table 3-6.
Bowen ratio values vary throughout the country. For example, in urban areas where annual rainfall is
less than 20 inches, a single Bowen ratio value of 4.0 may be representative. For rural areas, a Bowen
ratio value of 2.0 may be appropriate for grassland and cultivated land. For areas where annual rainfall is
greater than 20 inches, we recommend a single Bowen ratio value of 2.0 for urban areas; and 0.7 for rural
forests, grasslands, and cultivated lands. You can refine the Bowen ratio estimates provided in Table 3-6
by using site-specific precipitation and wind speed data. We recommend clearly identifying and
discussing the proposed values with the appropriate parties (e.g. permitting authority or facility) prior to
use.
TABLE 3-6
DAYTIME BOWEN RATIOS BY LAND USE, SEASON,
AND PRECIPITATION CONDITIONS
Seasona
Land Use
Spring
Summer
Autumn
Winter
Dry Conditions
Water (fresh and salt)
0.1
0.1
0.1
2.0
Deciduous forest
1.5
0.6
2.0
2.0
Coniferous forest
1.5
0.6
1.5
2.0
Swamp
0.2
0.2
0.2
2.0
Cultivated land
1.0
1.5
2.0
2.0
Grassland
1.0
2.0
2.0
2.0
Urban
2.0
4.0
4.0
2.0
Desert shrubland
5.0
6.0
10.0
2.0
Average Conditions
Water (fresh and salt)
0.1
0.1
0.1
1.5
Deciduous forest
0.7
0.3
1.0
1.5
Coniferous forest
0.7
0.3
0.8
1.5
Swamp
0.1
0.1
0.1
1.5
Cultivated land
0.3
0.5
0.7
1.5
U.S. EPA Region 6
Multimedia Planning and Permitting Division
Center for Combustion Science and Engineering
U.S. EPA
Office of Solid Waste
3-35
Human Health Risk Assessment Protocol
Chapter 3: Air Dispersion and Deposition Modeling
September 2005
TABLE 3-6
(contd.)
Seasona
Land Use
Spring
Summer
Autumn
Winter
Grassland
0.4
0.8
1.0
1.5
Urban
1.0
2.0
2.0
1.5
Desert shrubland
3.0
4.0
6.0
6.0
Wet Conditions
Water (fresh and salt)
0.1
0.1
0.1
0.3
Deciduous forest
0.3
0.2
0.4
0.5
Coniferous forest
0.3
0.2
0.3
0.3
Swamp
0.1
0.1
0.1
0.5
Cultivated land
0.2
0.3
0.4
0.5
Grassland
0.3
0.4
0.5
0.5
Urban
0.5
1.0
1.0
0.5
Desert shrubland
1.0
5.0
2.0
2.0
Source—Paine (1987)
a
The various seasons are defined by Iqbal (1983) as follows:
Spring:
Periods when vegetation is emerging or partially green; this is a transitional situation that applies for 1 to
2 months after the last killing frost in spring.
Summer:
Periods when vegetation is lush and healthy; this is typical of mid-summer, but also of other seasons in
which frost is less common.
Autumn:
Periods when freezing conditions are common, deciduous trees are leafless, crops are not yet planted or
are already harvested (bare soil exposed), grass surfaces are brown, and no snow is present.
Winter:
Periods when surfaces are covered by snow and temperatures are below freezing. Winter albedo depends
on whether a snow cover is present continuously, intermittently, or seldom. Albedo ranges from about
0.30 for bare snow cover to about 0.65 for continuous cover.
3.5.7
Anthropogenic Heat Flux
Anthropogenic heat is the surface heating caused by human activity, including automobiles and heating
systems. It is used to calculate hourly L values (Monin-Obukhov lengths). Table 3-7 presents
anthropogenic heat flux (Qf) values for several urban areas around the world (U.S. EPA 1995g). In rural
areas, we recommend using a value 0.0 Watts/m2 for the Qf. A value of 20.0 Watts/m2 is appropriate for
large urban areas, based on the annual value for Los Angeles.
U.S. EPA Region 6
Multimedia Planning and Permitting Division
Center for Combustion Science and Engineering
U.S. EPA
Office of Solid Waste
3-36
Human Health Risk Assessment Protocol
Chapter 3: Air Dispersion and Deposition Modeling
September 2005
TABLE 3-7
ANTHROPOGENIC HEAT FLUX (Qf) AND NET RADIATION (Q* )
FOR SEVERAL URBAN AREAS
Population
(Millions)
Population
Density
(Persons/km2)
Per Capita
Energy Use
(MJ x 103/year)
Manhattan
(40° North)
1.7
28,810
128
117 (Annual)
40 (Summer)
198 (Winter)
93 (Annual)
Montreal
(45° North)
1.1
14,102
221
99 (Annual)
57 (Summer)
153 (Winter)
52 (Annual)
92 (Summer)
13 (Winter)
Budapest
(47° North)
1.3
11,500
118
43 (Annual)
32 (Summer)
51 (Winter)
46 (Annual)
100 (Summer)
-8 (Winter)
Sheffield
(53° North)
0.5
10,420
58
19 (Annual)
56 (Annual)
West Berlin
(52° North)
2.3
9,830
67
21 (Annual)
57 (Annual)
Vancouver
(49° North)
0.6
5,360
112
19 (Annual)
15 (Summer)
23 (Winter)
57 (Annual)
107 (Summer)
6 (Winter)
Hong Kong (22°
North)
3.9
3,730
34
4 (Annual)
110 (Annual)
Singapore
(1° North)
2.1
3,700
25
3 (Annual)
110 (Annual)
Los Angeles (34°
North)
7.0
2,000
331
21 (Annual)
108 (Annual)
Fairbanks
(64° North)
0.03
810
740
19 (Annual)
18 (Annual)
Urban Area
(Latitude)
Qf (Watts/m2)
(Season)
Q*
(Watts/m2)
Source—Oke (1978)
3.5.8
Fraction of Net Radiation Absorbed at the Ground
Also used for calculating hourly values of Monin-Obukhov length, fraction of net radiation absorbed at
the ground is the last component of radiative heat balance. Based on:
U.S. EPA Region 6
Multimedia Planning and Permitting Division
Center for Combustion Science and Engineering
U.S. EPA
Office of Solid Waste
3-37
Human Health Risk Assessment Protocol
Chapter 3: Air Dispersion and Deposition Modeling
•
•
September 2005
the net radiation (Q* ) values presented in Table 3-7, and
recommendations presented in the MPRM User’s Manual, themselves based on Oke
(1982),
we recommend values of 0.15 for rural areas and 0.27 for urban areas (U.S. EPA 1995g).
3.6
ISCST3 MODEL INPUT FILES
The ISC3 User’s Guide, Volume I (U.S. EPA 1995f) offers a thorough instruction on how to prepare the
ISCST3 input files. The User’s Guide is available for downloading from the SCRAM at
http://www.epa.gov/scram001/tt22.htm#isc. We provide an example ISCST3 input file in Figure 3-2.
This example illustrates a single year run (1984), for particle phase COPC emissions from a single stack.
The run is used to compute acute (1-hour average) and chronic (annual average) values. It provides
single year results in a one hour and annual average plot file for post-processing. Specifying a terrain grid
file in the TG pathway is optional. You generally only consider it for modeling dry vapor deposition in
highly variable terrain. Each air modeling analysis has unique issues and concerns that we recommend
you address in the risk assessment report. We recommend using an air modeling methodology
consistently throughout, from data collection and model set-up, to model output. This will assist both
you and the permitting authority in interpreting and communicating model results. A transparent and
scientifically defensible risk assessment report will identify consistent methods while documenting each
section of the ISCST3 input file.
U.S. EPA Region 6
Multimedia Planning and Permitting Division
Center for Combustion Science and Engineering
U.S. EPA
Office of Solid Waste
3-38
Human Health Risk Assessment Protocol
Chapter 3: Air Dispersion and Deposition Modeling
September 2005
FIGURE 3-2
EXAMPLE INPUT FILE FOR “PARTICLE PHASE”
CO
CO
CO
CO
CO
CO
CO
CO
CO
**
**
CO
STARTING
TITLEONE Example input file, particle phase run
TITLETWO 1984 met data, Baton Rouge Surface, Boothville Upper Air
MODELOPT DFAULT CONC DDEP WDEP DEPOS DRYDPLT WETDPLT RURAL
AVERTIME 1 ANNUAL
POLLUTID UNITY
TERRHGTS ELEV
RUNORNOT RUN
SAVEFILE 84SAVE1 5 84SAVE2
Restart incomplete runs with INITFILE, changing '**' to 'CO'
INITFILE 84SAVE1
FINISHED
SO
SO
SO
SO
SO
SO
SO
SO
SO
SO
SO
SO
SO
SO
SO
SO
SO
SO
SO
SO
STARTING
LOCATION
SRCPARAM
BUILDHGT
BUILDHGT
BUILDHGT
BUILDHGT
BUILDHGT
BUILDWID
BUILDWID
BUILDWID
BUILDWID
BUILDWID
PARTDIAM
MASSFRAX
PARTDENS
PARTSLIQ
PARTSICE
SRCGROUP
FINISHED
STACK1
STACK1
STACK1
STACK1
STACK1
STACK1
STACK1
STACK1
STACK1
STACK1
STACK1
STACK1
STACK1
STACK1
STACK1
STACK1
STACK1
ALL
POINT 637524. 567789. 347.
1.0 23.0 447.0 14.7 1.9
18.29 18.29 18.29 18.29 18.29 18.29 18.29 18.29
18.29 18.29 18.29 18.29 18.29 18.29 18.29 18.29
18.29 18.29 18.29 18.29 18.29 18.29 18.29 18.29
18.29 18.29 18.29 18.29 18.29 18.29 18.29 18.29
18.29 18.29 18.29 18.29
14.02 15.51 16.53 17.05 17.05 16.53 15.51 14.03
12.10 14.02 15.51 16.53 17.05 17.05 16.53 15.51
14.02 12.10 14.02 15.51 16.53 17.05 17.05 16.53
15.51 14.02 12.10 14.02 15.51 16.53 17.05 17.05
16.53 15.51 14.02 12.10
0.35 0.70 1.10 2.00 3.60 5.50 8.10 12.5 15.0
0.22 0.08 0.08 0.11 0.10 0.07 0.10 0.11 0.13
1.0 1.0 1.0 1.0 1.0 1.0 1.0 1.0 1.0
7E-5 5E-5 6E-5 1.3E-4 2.6E-4 3.9E-4 5.2E-4 6.7E-4 6.7E-4
2E-5 2E-5 2E-5
4E-5
9E-5 1.3E-4 1.7E-4 2.2E-4 2.2E-4
RE
RE
RE
RE
RE
STARTING
ELEVUNIT METERS
DISCCART 630000. 565000. 352.
DISCCART 630500. 565000. 365.
DISCCART 631000. 565000. 402.
...
(ARRAY OF DISCRETE RECEPTORS)
...
RE DISCCART 635000. 570000. 387.
RE FINISHED
ME
ME
ME
ME
ME
ME
STARTING
INPUTFIL
ANEMHGHT
SURFDATA
UAIRDATA
FINISHED
TG
TG
TG
TG
TG
STARTING
INPUTFIL TERRAIN.TER
LOCATION 0.0 0.0
ELEVUNIT METERS
FINISHED
OU
OU
OU
OU
OU
STARTING
RECTABLE ALLAVE FIRST
PLOTFILE 1 ALL FIRST BTR841.PLT
PLOTFILE ANNUAL ALL BTR84A.PLT
FINISHED
84BTR.WET
10.0
13970 1984 BATON_ROUGE
12884 1984 BOOTHVILLE
U.S. EPA Region 6
Multimedia Planning and Permitting Division
Center for Combustion Science and Engineering
U.S. EPA
Office of Solid Waste
3-39
Human Health Risk Assessment Protocol
Chapter 3: Air Dispersion and Deposition Modeling
September 2005
As discussed in Section 3.2, ISCST3 requires separate runs to model vapor phase COPCs, particle phase
COPCs, and particle-bound phase COPCs, for a total of three runs per COPC source (stack or fugitive).
The ISCST3 “Control Secondary Keywords” used for these three runs are:
Vapor Phase:
CONC
DDEP
WDEP
DEPOS
Particle Phase:
CONC
DDEP
WDEP
DEPOS
Particle-Bound Phase:
CONC
DDEP
WDEP
DEPOS
ISCST3 needs site-specific inputs for source parameters, receptor locations, meteorological data, and
terrain features. Prepare the model for execution by creating an input file. The input file is
structured in five (or six, if a terrain grid file is used) sections, or pathways, designated by two-letter
abbreviations:
TABLE 3-8
ISCST3 INPUT FILE SECTIONS
Section
Abbreviation
Control
CO
Source
SO
Receptor
RE
Meteoro logy
ME
Terra in Grid (Option al)
TG
Output
OU
The following subsections describe how to specify the parameters for each pathway in the ISCST3 input
file.
RECOMMENDED INFORMATION FOR THE RISK ASSESSMENT REPORT
•
Electronic and hard copies of ISCST3 input file for all air modeling runs
U.S. EPA Region 6
Multimedia Planning and Permitting Division
Center for Combustion Science and Engineering
U.S. EPA
Office of Solid Waste
3-40
Human Health Risk Assessment Protocol
Chapter 3: Air Dispersion and Deposition Modeling
3.6.1
September 2005
COntrol Pathway
Your choice of model options (MODELOPT ) in the COntrol pathway will direct ISCST3 in the types of
computations to perform. We generally recommend specifying the DFAULT parameter for particle and
particle-bound phase runs, so that ISCST3 will implement the following regulatory default options:
•
Use stack-tip downwash (except for Schulman-Scire downwash).
•
Use buoyancy-induced dispersion (except for Schulman-Scire downwash).
•
Do not use final plume rise (except for building downwash).
•
Use the calms processing routines.
•
Use upper-bound concentration estimates for sources influenced by building downwash
from super-squat buildings.
•
Use default wind speed profile exponents.
•
Use default vertical potential temperature gradients.
The CONC parameter specifies calculation of air concentrations. The DDEP and WDEP parameters
specify dry and wet deposition. The DEPOS specifies computation of total (wet and dry) deposition flux.
DRYDPLT and WETDPLT are used for plume depletion resulting from dry and wet removal. We
recommend the following command lines for the vapor and two particle runs (these are for rural areas;
substitute URBAN for urban areas):
Vapor:
CO MODELOPT TOXICS CONC DDEP WDEP DEPOS DRYDPLT
WETDPLT RURAL
CO GASDEPVD 0.01
Particle Phase:
CO MODELOPT DFAULT CONC DDEP WDEP DEPOS DRYDPLT
WETDPLT RURAL
Particle-Bound:
CO MODELOPT DFAULT CONC DDEP WDEP DEPOS DRYDPLT
WETDPLT RURAL
Note that for vapor phase model runs, the DFAULT option is replaced by the TOXICS option. This
directs ISCST3 to execute the dry vapor deposition algorithm in addition to the regulatory default
parameters. You need to add an additional COntrol command line for the vapor phase run, to provide the
U.S. EPA Region 6
Multimedia Planning and Permitting Division
Center for Combustion Science and Engineering
U.S. EPA
Office of Solid Waste
3-41
Human Health Risk Assessment Protocol
Chapter 3: Air Dispersion and Deposition Modeling
September 2005
single value of the dry vapor deposition velocity. In order to set a single dry vapor deposition velocity in
ISCST3, use the following options:
•
Remove the DEFAULT keyword from the CO MODELOPT card. (This option is
incompatible with the TOXICS option.)
•
Add the TOXICS keyword on the CO MODELOPT card. (This option is needed when
using dry vapor deposition.)
•
Add the keyword CO GASDEPVD<Uservd>, where Uservd in the dry vapor deposition
velocity (meters/second).
We recommend a dry vapor deposition velocity of 0.5 centimeter per second (cm/s) for organic
contaminants, chlorine, and HCl. We recommend a dry vapor deposition velocity of 2.9 cm/s for divalent
mercury. The recommended dry vapor deposition velocity value of 0.5 cm/s for organic contaminants is
consistent with the range specified for pesticides (0.01 - 1.1 cm/s) and dioxins and furans (0.27 - 0.78
cm/s) (U.S. EPA 2000b). A recent review of dry deposition (Wesely and Hicks 2000) demonstrates
considerable uncertainty about dry deposition even for well-measured species such as ozone and sulfur
dioxide. Uncertainty is greater for organic compounds, with very few measurements available to support
defensible values (see following table).
TABLE 3-9
DRY DEPOSITION VELOCITY ESTIMATES AVAILABLE IN LITERATURE
Chemical
Dry Deposition Velocity (cm/s)
Reference
0.64 - 1.0
Hartmann et al. (1991)1
0.7
Sanheuza et al. (1992)1
Formic acid
1.1
Sanheuza et al. (1992)1
Chlordane
0.01 - 0.04
Bidleman (1988)
Arochlor 1242
0.02 - 0.1
Arochlor 1254
0.08 - 0.2
p,p’-DDT
0.1 - 0.7
TCDD
0.5
Trapp and Matthies (1995)
0.5
McLachlan et al. (1995)
0.27 - 0.78
Smith and Heinhold (1995)
Acetic acid
PCDD/Fs
0.19 (0.06-0.60)
1
As cited in Wesely and Hicks (2000)
U.S. EPA Region 6
Multimedia Planning and Permitting Division
Center for Combustion Science and Engineering
Koester and Hites (1992)
U.S. EPA
Office of Solid Waste
3-42
Human Health Risk Assessment Protocol
Chapter 3: Air Dispersion and Deposition Modeling
September 2005
The modeling reported in the Mercury Study Report to Congress (U.S. EPA 1997c) used a value of
0.3 cm/s for nighttime dry deposition of divalent mercury, but used daytime values ranging from 0.20 to
4.83 cm/s depending upon atmospheric stability and land-use category. The daytime values were based
on data developed from nitric acid data, not from measurements of divalent mercury. U.S. EPA (1997c)
used an average ISC model-calculated dry deposition velocity of 2.9 cm/s for divalent mercury vapor and
0.06 cm/s for elemental mercury. Higher values were expected for chemicals with greater reactivity than
acetic acid or formic acid, but no measured values were identified for any organic compounds higher
than 1.1 cm/s. As a result, we recommend the default of 2.9 for divalent mercury.
U.S. EPA (1997c) also calculates site- or contaminant-specific dry vapor deposition velocities based on
various parameters including molecular diffusivity, a solubility enhancement factor, pollutant reactivity,
mesophyll resistance, and Henry’s law constant. If you are assessing a facility surrounded by land uses
other than pine forest (for instance urban, agricultural lands, or wetlands), you may wish to consider how
a site-specific value for this parameter could be calculated. Two important parameters are the stability
class (from the air modeling) and the land use surrounding the facility. The following information can be
found in Section 5.1.2.3 (Dry Deposition of Vapors), page 5-12, in the technical background document of
the MACT rule: "Human Health and Ecological Risk Assessment Support to the Development of
Technical Standards for Emissions from Combustion Units Burning Hazardous Wastes: Background
Document, Final Report (F-1999-RC2F-S0014)", which explains that:
To calculate the weighted dry deposition velocity, it is recommended that land use be obtained
from 1:250,000 scale quadrangles of land use and GIRAS spatial data obtained from EPA
website and placed in an ARC-INFO format (U.S. EPA, 1994b). Table B-6 of Appendix B of the
MACT rule background document shows the land use data for the sites that were detailed in the
MACT rule. In the MACT rule, the fraction of time in each stability class was based on 5-year
hourly meteorological files used in the ISCST3 modeling. Table B-8 of Appendix B in the
MACT rule background document shows the weighted dry deposition velocity for divalent
mercury vapor at the modeled facilities. Dry deposition of elemental mercury was not included
in the MACT analysis, which is consistent with the 1997 Mercury Report to Congress.
Site-specific dry deposition velocity for divalent mercury vapor can be calculated by weighting
land use and stability class. Values for dry deposition velocity for each land use category and
stability class can be found in the "Mercury Study Report to Congress Volume III: Fate and
Transport of Mercury in the Environment, December 1997, EPA-452/R-97-003" in Table 4-3 and
Table 4-4, respectively. It is recommended that these values be averaged to annualized values.
Generally, night time dry deposition velocities can be treated as constant across all stability.
U.S. EPA Region 6
Multimedia Planning and Permitting Division
Center for Combustion Science and Engineering
U.S. EPA
Office of Solid Waste
3-43
Human Health Risk Assessment Protocol
Chapter 3: Air Dispersion and Deposition Modeling
September 2005
As more research to measure deposition velocities of more organic compounds under a variety of
conditions becomes available, it may be appropriate to develop site- and chemical- specific default dry
deposition of vapor velocities. It is important to note that although we recommend inputting the dry
vapor deposition velocity directly into ISCST3, you might instead elect to execute the dry gas deposition
algorithms within ISCST3 to calculate a deposition velocity. However, we caution you to read
Section 3.1.2 (Preprocessing Programs) and Section 3.4.6 (Solar Radiation), which note additional data
needs and potential limitations to ISCST3 calculating deposition velocities. Having ISCST3 calculate a
deposition velocity may also require that you conduct compound-specific air modeling runs, deviating
from the unit emission rate approach as outlined in this guidance. This may significantly increase the
number of air modeling runs needed.
Note that for each of the three runs for each emission source, 5 complete years of off-site (e.g., National
Weather Service from SAMSON) meteorological data are used. For sites with meteorological data
collected on-site, we recommend that the permitting authority be notified of the data period needed for a
risk assessment. Specify ‘ANNUAL’ for the averaging times (AVERTIME) to compute chronic (annual
average) health risk, and/or ‘1’ to compute acute health risks based on the maximum 1-hour average
concentrations over the 5-year period (see Section 3.10). We generally recommend repeating each phase
run five times (one for each year, or a total of 15 ISCST3 runs) to complete a set of 15 runs for the full
five years of meteorological data.
Alternatively, you can combine the 5 years of meteorological data into a single meteorological data file
and complete only 3 runs for each emission source (one run for each phase). Section 3.5.1.1 of the ISC3
User’s Guide (U.S. EPA 1995f), includes a complete discussion of combining multiple years of
meteorological data into a single file prior to running ISCST3. You may select the ‘ANNUAL’ averaging
time for all risk assessment runs, regardless of the number of years in the meteorological data file. The
incorrect selection of ‘PERIOD’ will not compute the correct deposition rates needed by the risk
assessment equations (refer to Section 3.2.3 of the ISC3 User Guide, Volume I). No additional ISCST3
model execution time is needed to obtain 1-year or 5-year air modeling values.
ISCST3 also allows you to specify COPC half-life and decay coefficients. Unless clearly identified and
discussed with the appropriate parties (regulatory authority or facility), we don’t recommend using these
U.S. EPA Region 6
Multimedia Planning and Permitting Division
Center for Combustion Science and Engineering
U.S. EPA
Office of Solid Waste
3-44
Human Health Risk Assessment Protocol
Chapter 3: Air Dispersion and Deposition Modeling
September 2005
keywords when conducting air modeling for risk assessments. You typically use the TERRHGTS
keyword with the ELEV parameter to model terrain elevations at receptor grid nodes. The FLAGPOLE
keyword specifies receptor grid nodes above local ground level and is not typically used for most air
modeling to perform impacts at ground level.
We also recommend using SAVEFIL to restart ISCST3 in the event of a computer or power failure
during long runs. SAVEFIL is best used by specifying two save files, each with a different name. We
recommend that the save interval not be longer than 5 days for large runs. If two save files are used, and
a failure occurs during writing to the save file, no more than 10 days will be lost. Use the INITFILE
command to restart the runs after the failure, as shown in the following example:
CO SAVEFILE SAVE1 5 SAVE2
** INITFILE SAVE1
ISCST3 will save the results alternately to SAVE1 and SAVE2 every 5 days. If the run fails after
successfully writing to SAVE1, you can restart the ISCST3 run by replacing the two asterisks (*) in the
INITFILE line with CO and running ISCST3 again. The run will begin after the last day in SAVE1.
Note that you don’t use the MULTYEAR keyword for computing long-term averages, and it should not be
specified.
The following is an example of the COntrol pathway computer code for a single-year ISCST3 particle
run:
CO
CO
CO
CO
CO
CO
CO
CO
CO
**
**
CO
STARTING
TITLEONE Example input file, particle phase run, 1 year
TITLETWO 1984 met data, Baton Rouge Surface, Boothville Upper Air
MODELOPT DFAULT CONC DDEP WDEP DEPOS DRYDPLT WETDPLT RURAL
AVERTIME 1 ANNUAL
POLLUTID UNITY
TERRHGTS ELEV
RUNORRUN RUN
SAVEFILE 84SAVE1 5 84SAVE2
Restart incomplete runs with INITFILE, changing ‘**’ to ‘CO’
INITFILE SAVE1
FINISHED
The corresponding COntrol pathway computer code for a single-year ISCST3 vapor run is:
U.S. EPA Region 6
Multimedia Planning and Permitting Division
Center for Combustion Science and Engineering
U.S. EPA
Office of Solid Waste
3-45
Human Health Risk Assessment Protocol
Chapter 3: Air Dispersion and Deposition Modeling
CO
CO
CO
CO
CO
CO
CO
CO
CO
CO
**
**
CO
September 2005
STARTING
TITLEONE Example input file, vapor phase run, 1 year
TITLETWO 1984 met data, Baton Rouge Surface, Boothville Upper Air
MODELOPT TOXICS CONC DDEP WDEP DEPOS DRYDPLT WETDPLT RURAL
GASDEPVD 0.01
AVERTIME 1 ANNUAL
POLLUTID UNITY
TERRHGTS ELEV
RUNORRUN RUN
SAVEFILE 84SAVE1 5 84SAVE2
Restart incomplete runs with INITFILE, changing ‘**’ to ‘CO’
INITFILE SAVE1
FINISHED
Additional runs for the other 4 years are set up with the same COntrol pathway, except for the title
description and SAVEFILE filenames.
3.6.2
SOurce Pathway
As discussed in Section 3.8, ISCST3 normally uses a unit emission rate of 1.0 g/s. Additional source
characteristics the model needs (typically found in the Part B permit application and trial burn report)
include the following:
•
Source type (point source for stack emissions; area or volume for fugitive emissions)
•
Source location (UTM coordinates, m)
•
Source base elevation
•
Emission rate (1.0 g/s)
•
Stack height (m)
•
Stack gas temperature (K)
•
Stack gas exit velocity (m/s)
•
Stack inside diameter (m)
•
Building heights and widths (m)
•
Particle size distribution (percent)
•
Particle density (g/cm3 )
•
Particle and gas scavenging coefficients (unitless)
RECOMMENDED INFORMATION FOR RISK ASSESSMENT REPORT
•
Input values with supporting documentation for each parameter identified in Section 3.7.2
U.S. EPA Region 6
Multimedia Planning and Permitting Division
Center for Combustion Science and Engineering
U.S. EPA
Office of Solid Waste
3-46
Human Health Risk Assessment Protocol
Chapter 3: Air Dispersion and Deposition Modeling
September 2005
3.6.2.1 Source Location
The location keyword of the SOurce pathway (SO LOCATION) identifies the:
•
source type,
•
location, and
•
base elevation.
The source type for any stack is referred to as a “point” source in ISCST3. Fugitive source emissions are
discussed in section 3.9. The source location must be entered into ISCST3. We recommend entering
source locations in UTM coordinates. The easterly and northerly coordinates are entered to the nearest
meter; for example, 637524 meters UTM-E, or 4567789 meters UTM-N (no commas are used). Enter the
base elevation of each stack in meters. Sources for base elevations include USGS topographic maps,
facility plot plans or USGS digital data bases.
An example input for the location keyword on the SOurce pathway includes source type, location, and
base elevation in the following format:
SO LOCATION STACK1 POINT 637524. 4567789. 347.
3.6.2.2 Source Parameters
The source parameters keyword of the SOurce pathway (SO SRCPARAM) identifies the:
•
emission rate,
•
stack height,
•
stack temperature,
•
stack velocity, and
•
stack diameter.
Enter the unit emission rate as 1.0 g/s. Stack height is the height above plant base elevation on the SO
LOCATION keyword. Stack gas exit temperature is the most critical stack parameter for influencing
concentration and deposition. High stack gas temperatures result in high buoyant plume rise, which, in
turn, lowers concentration and deposition rates. We recommend basing stack gas temperatures on stack
U.S. EPA Region 6
Multimedia Planning and Permitting Division
Center for Combustion Science and Engineering
U.S. EPA
Office of Solid Waste
3-47
Human Health Risk Assessment Protocol
Chapter 3: Air Dispersion and Deposition Modeling
September 2005
sampling tests for existing stacks. For new or undefined stacks, you might use manufacturer’s data for
similar equipment. Calculate stack gas exit velocity from actual stack gas flow rates and stack diameter.
Actual stack gas flow rates can be measured during existing stacks during stack sampling. You can get
representative values for new or undefined sources from manufacturer’s data on similar equipment.
Stack diameter is the inside diameter of the stack at exit.
We highly recommend using a site- or unit-specific stack temperature (low, average, high). Similar to the
Chapter 2 discussion on emissions testing, we recommend choosing the stack gas temperature based on
the objectives of the risk assessment. For example, if permitting is the objective, ‘typical’ operating
temperatures with all control devices operating might be a possible testing condition to select. On the
other hand, you might select low or high operating temperatures because of the potential for emitting
certain COPCs, or the production of specific PICs, regardless of plume rise considerations. We
recommend avoiding the practice of always choosing the lowest stack temperature, in order to decrease
buoyancy and thereby increase concentration and deposition near the source. This is a gross oversimplification of conditions. Increases in concentration and deposition near the source may
underestimate concentrations and deposition rates away from the source where more critical receptors
may be located (see Chapter 4).
Following is an example of the source parameter input in the SOurce pathway for emission rate (grams
per second), stack height (meters), stack temperature (K), stack velocity (meters per second), and stack
diameter (meters):
SO SRCPARAM STACK1 1.0 23.0 447.0 14.7 1.9
3.6.2.3 Building Parameters
The building height and width keywords of the SOurce pathway (SO BUILDHGT; SO BUILDWID )
identify the building dimensions that most influence the air flow for each of the 36 10-degree directions
surrounding a stack. Calculate the dimensions using BPIP software, as described in Section 3.2.4.
U.S. EPA Region 6
Multimedia Planning and Permitting Division
Center for Combustion Science and Engineering
U.S. EPA
Office of Solid Waste
3-48
Human Health Risk Assessment Protocol
Chapter 3: Air Dispersion and Deposition Modeling
September 2005
The BPIP output file is transferred into the ISCST3 SOurce pathway as follows:
SO
SO
SO
SO
SO
BUILDHGT
BUILDHGT
BUILDHGT
BUILDHGT
BUILDHGT
STACK1
STACK1
STACK1
STACK1
STACK1
18.29
18.29
18.29
18.29
18.29
18.29
18.29
18.29
18.29
18.29
18.29
18.29
18.29
18.29
18.29
18.29
18.29
18.29
18.29
18.29
18.29
18.29
18.29
18.29
18.29
18.29
18.29
18.29
18.29
18.29
18.29
18.29
18.29
18.29
18.29
18.29
SO
SO
SO
SO
SO
BUILDWID
BUILDWID
BUILDWID
BUILDWID
BUILDWID
STACK1
STACK1
STACK1
STACK1
STACK1
14.02
12.10
14.02
15.51
16.53
15.51
14.02
12.10
14.02
15.51
16.53
15.51
14.02
12.10
14.02
17.05
16.53
15.51
14.02
12.10
17.05
17.05
16.53
15.51
16.53
17.05
17.05
16.53
15.51
16.53
17.05
17.05
14.03
15.51
16.53
17.05
3.6.2.4 Particle Size Distribution
ISCST3 needs a particle size distribution for determining deposition velocities. We recommend using
site-specific stack test data for existing sources.
The following example is an ISCST3 input for a particle phase run. From Table 3-1, the distribution for
9 mean diameter sizes includes the data needed for the keywords of the SOurce pathway
(SO PARTDIAM; SO MASSFRAX) .
The PARTDIAM is taken from Column 1 (Mean Particle Diameter).
The MASSFRAX is taken from Column 4 (Fraction of Total Mass).
SO PARTDIAM STACK1 0.35 0.70 1.10 2.00 3.60 5.50 8.10 12.5 15.0
SO MASSFRAX STACK1 0.22 0.08 0.08 0.11 0.10 0.07 0.10 0.11 0.13
The example for the ISCST3 input for the particle-bound run is described below. From Table 3-1, the
PARTDIAM
is the same. The MASSFRAX is taken from Column 6 (Fraction of Total Surface Area).
SO PARTDIAM STACK1 0.35 0.70 1.10 2.00 3.60 5.50 8.10 12.5 15.0
SO MASSFRAX STACK1 0.49 0.17 0.13 0.09 0.05 0.02 0.02 0.01 0.02
3.6.2.5 Particle Density
ISCST3 also needs particle density in order to model the air concentration and deposition rates of
particles. We recommend determining site-specific measured data on particle density for all modeled
sources when possible. For new or undefined sources requiring air modeling, we recommend using a
default particle density of 1.0 g/cm3 . Particles from combustion sources, however, may have densities
that are less than 1.0 g/cm3 (U.S. EPA 1994d), which would reduce the modeled deposition flux.
U.S. EPA Region 6
Multimedia Planning and Permitting Division
Center for Combustion Science and Engineering
U.S. EPA
Office of Solid Waste
3-49
Human Health Risk Assessment Protocol
Chapter 3: Air Dispersion and Deposition Modeling
September 2005
Following is an example of the particle density portion of the SOurce pathway (SO PARTDENS) for the
9 mean particle size diameters of the previous example:
SO PARTDENS STACK1 1.0 1.0 1.0 1.0 1.0 1.0 1.0 1.0 1.0
3.6.2.6 Scavenging Coefficients
ISCST3 calculates wet deposition flux by multiplying a scavenging ratio times the vertically integrated
concentration. The scavenging ratio is the product of a scavenging coefficient and a precipitation rate.
Studies show that best fit values for the scavenging coefficients vary with particle size. For vapors, wet
scavenging depends on the properties of the COPCs involved. However, not enough data are now
available to adequately develop COPC-specific scavenging coefficients. Therefore, assume that vapors
are scavenged at the rate of the smallest particles, with behavior in the atmosphere that is influenced
more by the molecular processes that affect vapors than by the physical processes that may dominate the
behavior of larger particles (U.S. EPA 1995f).
Wet deposition only occurs during precipitation. To use the wet deposition option in ISCST3, input
scavenging coefficients for each particle size and a file that has hourly precipitation data. For wet
deposition of vapors, we suggest using a scavenging coefficient for a 0.1-µm particle, to simulate wet
scavenging of very small (molecular) particles. ISCST3 will also accept site-specific measured washout
data, or a value calculated based on Henry’s Law constant. If you choose an option other than the
coefficient for a 0.1-µm particle, we recommend clearly identifying and discussing it with the appropriate
parties (e.g. permitting authority, or facility) prior to analysis. You can establish scavenging coefficients
for each particle size from the best fit of the curves presented in the ISC3 User’s Guide (U.S. EPA
1995f). The curves are based on the work of Jindal and Heinhold (1991). The curves are limited to a
maximum particle size of 10-µm. Assume that all scavenging coefficients for particle sizes greater than
or equal to 10-µm are equal. This assumption follows research on wet scavenging of particles (Jindal
and Heinhold 1991).
The ISCST3 model differentiates between frozen and liquid scavenging coefficients. Research on sulfate
and nitrate data shows that frozen precipitation scavenging coefficients are about one-third of the values
of liquid precipitation (Scire et al. 1990; Witby 1978). It is protective to assume that the frozen
scavenging coefficients are equal to the liquid scavenging coefficients (Pei and Cramer 1986). If desired,
you may input separate scavenging coefficients for frozen precipitation.
U.S. EPA Region 6
Multimedia Planning and Permitting Division
Center for Combustion Science and Engineering
U.S. EPA
Office of Solid Waste
3-50
Human Health Risk Assessment Protocol
Chapter 3: Air Dispersion and Deposition Modeling
September 2005
The following is an example of the particle liquid (rain) and frozen (sleet or snow) scavenging
coefficients input in the SOurce pathway for 9 mean particle size diameters, assuming particles are
scavenged by frozen precipitation at 1/3 the rate of liquid precipitation:
SO PARTSLIQ STACK1 7E-5 5E-5 6E-5 1.3E-4 2.6E-4 3.9E-4 5.2E-4 6.7E-4 6.7E-4
SO PARTSICE STACK1 2E-5 2E-5 2E-5
4E-5
9E-5 1.3E-4 1.7E-4 2.2E-4 2.2E-4
The complete SOurce pathway for the example particle phase input file is as follows:
SO
SO
SO
SO
SO
SO
SO
SO
SO
SO
SO
SO
SO
SO
SO
SO
SO
SO
SO
SO
STARTING
LOCATION
SRCPARAM
BUILDHGT
BUILDHGT
BUILDHGT
BUILDHGT
BUILDHGT
BUILDWID
BUILDWID
BUILDWID
BUILDWID
BUILDWID
PARTDIAM
MASSFRAX
PARTDENS
PARTSLIQ
PARTSICE
SRCGROUP
FINISHED
STACK1
STACK1
STACK1
STACK1
STACK1
STACK1
STACK1
STACK1
STACK1
STACK1
STACK1
STACK1
STACK1
STACK1
STACK1
STACK1
STACK1
ALL
POINT 637524. 4567789. 347.
1.0 23.0 447.0 14.7 1.9
18.29 18.29 18.29 18.29 18.29 18.29 18.29 18.29
18.29 18.29 18.29 18.29 18.29 18.29 18.29 18.29
18.29 18.29 18.29 18.29 18.29 18.29 18.29 18.29
18.29 18.29 18.29 18.29 18.29 18.29 18.29 18.29
18.29 18.29 18.29 18.29
14.02 15.51 16.53 17.05 17.05 16.53 15.51 14.03
12.10 14.02 15.51 16.53 17.05 17.05 16.53 15.51
14.02 12.10 14.02 15.51 16.53 17.05 17.05 16.53
15.51 14.02 12.10 14.02 15.51 16.53 17.05 17.05
16.53 15.51 14.02 12.10
0.35 0.70 1.10 2.00 3.60 5.50 8.10 12.5 15.0
0.22 0.08 0.08 0.11 0.10 0.07 0.10 0.11 0.13
1.0 1.0 1.0 1.0 1.0 1.0 1.0 1.0 1.0
7E-5 5E-5 6E-5 1.3E-4 2.6E-4 3.9E-4 5.2E-4 6.7E-4 6.7E-4
2E-5 2E-5 2E-5
4E-5
9E-5 1.3E-4 1.7E-4 2.2E-4 2.2E-4
When modeling air vapors using ISCST3, the following is an example of the SOurce pathway input for
wet vapor scavenging coefficients that replaces the PARTDIAM, MASSFRAX, PARTDENS,
PARTSLIQ and PARTSICE lines in the above example:
SO GAS-SCAV STACK1 LIQ 1.7E-4
SO GAS-SCAV STACK1 ICE 0.6E-4
3.6.3
REceptor Pathway
The REceptor pathway identifies sets or arrays of receptor grid nodes (identified by UTM coordinates)
for which ISCST3 generates estimates of air parameters including:
•
air concentration,
•
dry and wet deposition, and
•
total deposition.
U.S. EPA Region 6
Multimedia Planning and Permitting Division
Center for Combustion Science and Engineering
U.S. EPA
Office of Solid Waste
3-51
Human Health Risk Assessment Protocol
Chapter 3: Air Dispersion and Deposition Modeling
September 2005
Previous U.S. EPA guidance (1994l) recommended using a polar receptor grid to identify maximum
values. Polar grids provide coverage over large areas with fewer receptor grid nodes than other grid
types, thereby reducing computer run times. However, U.S. EPA Region 6 experience indicates that,
although polar grids may reduce computer run times, air modelers typically choose a different option.
The benefit of reduced run time is offset by difficulties in identifying polar grid locations in absolute
UTM coordinates for (1) extracting terrain values from digital terrain files, and (2) selecting exposure
scenario locations (see Chapter 4). Using a Cartesian grid is an alternative to a polar grid.
One method of obtaining a Cartesian grid with terrain elevations is to open both the grid array and the
USGS DEM file in a graphics program (e.g., SURFER® ). The software samples the DEM file at the
user-specified locations (i.e. the grid nodes), each defined as the intersection of east (x) and north (y)
values. The software extracts terrain elevation (z) from the DEM file associated with the desired
location. These x, y, and z values are saved as a text file with one receptor grid node per line. Use a text
editor to prefix each line with “RE DISCCART,” to specify a discrete receptor grid node in ISCST3
format. Commercial software is available that generates the recommended receptor grid node array and
extracts terrain elevations from the USGS DEM downloaded files, or any terrain file in x-y-z format.
The following is an example of the REceptor pathway for discrete receptor grid nodes at 500-meter
spacing that includes terrain elevations (in meters):
RE
RE
RE
RE
RE
STARTING
ELEVUNIT
DISCCART
DISCCART
DISCCART
METERS
630000. 3565000. 352.
630500. 3565000. 365.
631000. 3565000. 402.
9
RE DISCCART 635000. 3570000. 387.
RE FINISHED
We recommend that air modeling for each risk assessment include, at a minimum, an array of receptor
grid nodes covering the area within 10 kilometers of the facility. Locate the origin of the grid at the
centroid of a polygon formed by the locations of the stack emission sources. This receptor grid node
array may consist of a Cartesian grid with grid nodes spaced 100 meters apart extending from the
centroid out to 3 kilometers. For the distances from 3 kilometers out to 10 kilometers, the receptor grid
node spacing can be increased to 500 meters. The single grid node array contains both grid node
U.S. EPA Region 6
Multimedia Planning and Permitting Division
Center for Combustion Science and Engineering
U.S. EPA
Office of Solid Waste
3-52
Human Health Risk Assessment Protocol
Chapter 3: Air Dispersion and Deposition Modeling
September 2005
spacings. Include the same receptor grid node array in the REceptor pathway for all ISCST3 runs for all
years of meteorological data and for all emission sources.
We recommend specifying individual terrain elevations for all receptor grid nodes. Several methods are
available for assigning terrain elevations to grid nodes using digital terrain data. The 1:250,000 scale
DEM digital data are available for download at the USGS Internet site
(http://edc.usgs.gov/guides/dem.html). This data has horizontal spacing between digital terrain values of
approximately 90 meters, which provides sufficient accuracy for air modeling.
During the risk assessment, select air parameter (concentration and deposition) values for a single
receptor grid node to evaluate a specific exposure scenario location. You can also compute an area
average of air parameter values across multiple receptor grid nodes, to represent the average
concentration or deposition over a watershed or water body (see Chapter 4). However, depending on
site-specific considerations, a different receptor grid node array may be more appropriate.
In addition to the receptor grid node array evaluated out to 10 kilometers, you might consider additional
grid node arrays for evaluating water bodies and their watersheds located beyond 10 kilometers. We
recommend a grid node spacing of 500 meters between nodes for arrays that are more than 10 kilometers
from the emission source. An equally spaced grid node array facilitates subsequent computation of area
averages for deposition rates onto waterbodies and their associated watersheds.
RECOMMENDED INFORMATION FOR RISK ASSESSMENT REPORT
•
Summary of all information regarding the coordinates and placement of the receptor grid node
array used in air modeling
•
Copies of any maps, figures, or aerial photographs used to develop the receptor grid node
array
•
Map presenting UTM locations of receptor grid nodes, along with other facility information.
U.S. EPA Region 6
Multimedia Planning and Permitting Division
Center for Combustion Science and Engineering
U.S. EPA
Office of Solid Waste
3-53
Human Health Risk Assessment Protocol
Chapter 3: Air Dispersion and Deposition Modeling
3.6.4
September 2005
MEteorological Pathway
The file containing meteorological data is specified in the MEteorological pathway. MPRM creates
individual files for each of the 5 years as ASCII files. ISCST3 uses them to compute hourly
concentrations and deposition rates. You can either specify a single year of meteorological data in each
ISCST3 run, or combine the total period of meteorological data into a single meteorological file, which
ISCST3 will process in a single 5-year run. When combining meteorological files, we caution you to
consider the following:
•
Preprocess each year separately using MPRM into an ASCII format
•
Combine the years into a single file (using a text editor or DOS COPY command)
•
ISCST3 compares the first line (header) of the combined file to the Surface and Upper
Air Station ID numbers specified in the input file ME pathway
•
ISCST3 reads the headers of subsequent years unless they’re deleted in the combined
file. If subsequent year headers are included in the combined file, ISCST3 will compare
the station IDs to the input file station ID.
Your analysis might use meteorological data from more than one surface station or upper
air station (e.g., the upper air station is moved after the third year of the period and
assigned a new station ID by the National Weather Service). If this is the case, delete the
headers for subsequent years in the combined file.
•
For sites where the anemometer height is changed during the 5 year period (e.g., during
the period 1984-1988, the anemometer was relocated on December 15, 1985, changing
the height from 20 feet to 10 meters), we recommend running each year separately. Use
the anemometer height in the ISCST3 input file ME pathway which corresponds to that
year’s meteorological data.
We recommend completing each year in the file with a full year of data (365 days, or 366 days for leap
years). Verify the anemometer height for the surface station from Local Climate Data Summary records,
or other sources, such as the state climatologist office. We recommend identifying the correct
anemometer height ANEMHGHT for the wind speed measurements at the surface station before air
modeling. Details of specifying the meteorological data file are in the ISC3 User’s Guide, Section
3.5.1.1.
U.S. EPA Region 6
Multimedia Planning and Permitting Division
Center for Combustion Science and Engineering
U.S. EPA
Office of Solid Waste
3-54
Human Health Risk Assessment Protocol
Chapter 3: Air Dispersion and Deposition Modeling
September 2005
The following is an example input section for the MEteorological pathway, using the 1984 Baton Rouge
file, with an anemometer height of 10 meters and station identification numbers:
ME
ME
ME
ME
ME
ME
3.6.5
STARTING
INPUTFIL
ANEMHGHT
SURFDATA
UAIRDATA
FINISHED
84BR.WET
10.0
13970 1984 BATON_ROUGE
12884 1984 BOOTHVILLE
Terrain Grid (TG) Pathway
Computing dry plume depletion is sensitive to terrain elevation. In the absence of a terrain grid file,
ISCST3 automatically assumes that the terrain slope between the stack base and the receptor grid node
elevation is linear. In concept, this assumption may underestimate plume deposition. However, based on
experience, the magnitude of the differences in computed concentrations and deposition rates is nominal.
Since including a terrain grid file in the TG pathway significantly increases model execution time, we
suggest that a terrain grid file may not be necessary for all sites. If a terrain grid file is desired for a
specific site based on highly variable terrain over short distances, the format of the TG file is available in
the ISC3 User's Guide.
The location keyword of the TG pathway ( TG LOCATION ) identifies the x and y values to be added to the
source and receptor grid to align with the terrain file coordinates. If the source and receptor grid nodes
are in relative units such that the source is at location 0,0, the location keywords in the TG pathway
would be the UTM coordinates of the source. We recommend specifying all emission sources and
receptor grid nodes in UTM coordinates (note NAD27 or NAD83 format), and that the TG file, if used,
be in UTM coordinates. Therefore, the location of the origin of the TG file relative to the source location
will be 0,0. Also, we recommend presenting the terrain elevations in the TG file in meters. Following is
an example of the TG pathway:
TG
TG
TG
TG
TG
STARTING
INPUTFIL TERRAIN.TER
LOCATION 0.0 0.0
ELEVUNIT METERS
FINISHED
U.S. EPA Region 6
Multimedia Planning and Permitting Division
Center for Combustion Science and Engineering
U.S. EPA
Office of Solid Waste
3-55
Human Health Risk Assessment Protocol
Chapter 3: Air Dispersion and Deposition Modeling
3.6.6
September 2005
OUtput Pathway
ISCST3 output comes in two basic file types: the mandatory “output summary file” type (mandatory
because ISCST3 automatically creates the file), and numerous optional file formats. As part of its input
file structure, ISCST3 requires the name of the output summary file (See Section 3.8.2). Using text and
tables, this file summarizes the ISCST3 run results, including repeating back all input data (e.g., sources
with parameters, control pathways, grid node list, model options selected), and results summaries for
each annual and 1-hour averaging period. It also states if the run finished successfully. The summary
file also alerts you to special meteorological conditions that were found during runtime (e.g. number of
calm hours, and relationships between source base elevation and grid node elevations). It provides
impacts for the highest grid node values, not the results at every grid node required to perform the
methods found in the remainder of the HHRAP. We recommend using the output summary file for
quality checking, to make sure the run executed successfully and correctly.
ISCST3 provides numerous optional output file formats in addition to the results in the output summary
file, as specified in receptor tables (RECTABLE). The “plot files” format is the most useful option for
facilitating post-processing of the air parameter values in the model output. For this reason, though “plot
files” are optional in executing ISCST3, they are necessary for HHRAP methods. There are two plot
files for each ISCST3 run on a single source – the ‘annual’ and ‘1-hour’ plot files. The 'annual' plot file
contains all air modeling results at each grid node, for the annual average of five years of met data. The
'1-hour' plot file contains the air modeling results at each grid node for the 'highest 1-hour' impact for all
five years. The file presents data in tabular form, with impacts at every grid node.
The plot file lists the x and y coordinates, and the concentration or deposition rate values for each
averaging period. Data are listed in a format that can easily be pulled into a post-processing program
(e.g. spreadsheet). Note that the ISCST3-generated plot file is not the same format as the ISCST3generated post file. We recommend using the plot file, not the post file.
Following is an example OUtput file specification for single-year run of 1-hour and annual average plot
files:
OU
OU
OU
OU
OU
STARTING
RECTABLE ALLAVE FIRST
PLOTFILE 1 ALL FIRST BTR841.PLT
PLOTFILE ANNUAL ALL BTR84A.PLT
FINISHED
U.S. EPA Region 6
Multimedia Planning and Permitting Division
Center for Combustion Science and Engineering
U.S. EPA
Office of Solid Waste
3-56
Human Health Risk Assessment Protocol
Chapter 3: Air Dispersion and Deposition Modeling
September 2005
The second line directs ISCST3 to create a table of values for each receptor grid node for all averaging
periods in the model run (1-hour and annual). The third line directs ISCST3 to create a separate plot file
(named BTTR841.PLT) of the 1-hour average results for all emission sources in the run using the first
highest (e.g., maximum) value for all hours of results during the year for each receptor grid node. The
fourth line directs ISCST3 to create another separate plot file (named BTR84A.PLT) of the annual
average results for all sources in the run for each receptor grid node.
3.7
ISCST3 MODEL EXECUTION
Consider model execution time needs for each analysis. A complete air modeling run—including air
concentration, wet and dry deposition, and plume depletion—may require 10 times the run time for the
same source and receptor grid nodes for air concentration only. You can avoid wasted modeling effort
and analysis time by verifying input parameters and conducting test runs prior to executing ISCST3.
Long run times result mainly from two algorithms—plume depletion and terrain grid file. ISCST3 run
times increase as much as tenfold for runs applying plume depletion. We believe that constituent mass is
conserved between suspended concentration and deposition rate by allowing for depletion of deposited
mass from the plume concentration in ISCST3. The overestimate of plume concentration, and the
subsequent overestimate of deposition which results when plume depletion is not allowed, is too
protective. At the same time, we don’t believe the nominal benefits of including a terrain grid file justify
the added run times. Therefore, we recommend that plume depletion always be included. We don’t
recommend terrain grid files.
3.8
USING MODEL OUTPUT
ISCST3 output (air concentrations and deposition rates) are usually provided on a unit emission rate
(1.0 g/s) basis from the combustor or emission source, and aren’t COPC-specific. This is to preclude
having to run the model for each individual COPC. Use the COPC-specific emission rates from the trial
burn (see Chapter 2) to adjust the unitized concentration and deposition output from ISCST3. The
resulting COPC-specific air concentrations and deposition rates will be used in the estimating media
concentration equations (see Chapter 5). Concentration and deposition are directly proportional to the
unit emission rate used in the ISCST3 modeling. However, there might be some instances where the risk
U.S. EPA Region 6
Multimedia Planning and Permitting Division
Center for Combustion Science and Engineering
U.S. EPA
Office of Solid Waste
3-57
Human Health Risk Assessment Protocol
Chapter 3: Air Dispersion and Deposition Modeling
September 2005
assessor will need to convert modeled output to COPC-specific output for the risk assessment. For
example, the risk assessor may want to compare modeled COPC concentrations in ambient media to
concentrations actually measured in the field.
For facilities with multiple stacks or other emission sources, we recommend that each source be modeled
separately. This is because modeling multiple sources at one time results in an inability to estimate
source-specific risks. This limits the ability of a permitting agency to evaluate which source is
responsible for the resulting risks. Such ambiguity makes it impossible for the agency to specify
protective, combustion unit-specific permit limits. If a facility has two or more sources with identical
characteristics (emissions, stack parameters, and nearby locations), it may be appropriate to model them
with a single set of runs. We recommend getting the approval of the permitting authority prior to such
multi-source modeling.
TABLE 3-10
ISCST3 AIR PARAMETER OUTPUT
Air Parameter
Description
Units
(Used for most soil-based exposure pathways)
Cyv
Unitized yearly average air concentration from vapor phase
µg-s/g-m3
Cyp
Unitized yearly average air concentration from particle phase
µg-s/g-m3
Dydv
Unitized yearly average dry deposition from vapor phase
s/m2-yr
Dywv
Unitized yearly average wet deposition from vapor phase
s/m2-yr
Dydp
Unitized yearly average dry deposition from particle phase
s/m2-yr
Dywp
Unitized yearly average wet deposition from particle phase
s/m2-yr
(Used for fish and drinking water ingestion exposure pathways)
Cywv
Unitized yearly (water body or watershed) average air concentration
from vapor phase
µg-s/g-m3
Dytwv
Unitized yearly (water body or watershed) average total (wet and dry)
deposition from vapor phase
s/m2-yr
Dytwp
Unitized yearly (water body or watershed) average total (wet and dry)
deposition from particle phase
s/m2-yr
(Used for evaluation of acute risk via direct inhalation exposure pathway)
Chv
Unitized hourly air concentration from vapor phase
µg-s/g-m3
Chp
Unitized hourly air concentration from particle phase
µg-s/g-m3
Chpb
Unitized hourly air concentration from particle-bound phase
µg-s/g-m3
U.S. EPA Region 6
Multimedia Planning and Permitting Division
Center for Combustion Science and Engineering
U.S. EPA
Office of Solid Waste
3-58
Human Health Risk Assessment Protocol
Chapter 3: Air Dispersion and Deposition Modeling
3.8.1
September 2005
Unit Rate Output vs. COPC-Specific Output
The relationship between the unit emission rate and the unit air parameter values (air concentrations and
deposition rates) is linear. Similarly, the relationship between the COPC-specific emission rate (Q) and
the COPC-specific air parameter values (air concentrations and deposition rates) is also linear if the
COPC-specific emission rate is used in the air model.
In this Section we discuss using the unit emission rate. We also advance the rationale that you should
use a unit emission rate instead of the COPC-specific emission rate. Using a unit emission rate
precludes having to run ISCST3 separately for each individual COPC. We advocate using a unit
emission rate in the air modeling because you can develop a common ratio relationship between the unit
emission rate and the COPC-specific emission rate. The ratio is based on the fact that both individual
relationships are linear in the air model. This ratio relationship is expressed by the following equation:
Equation 3-2
To use this equation, you must know three of the variables. ISCST3 provides the modeled output air
concentration (or deposition rate). The unit emission is 1.0 g/s. You can get the COPC-specific emission
rate directly from stack or source test data.
3.8.1.1 Determining the COPC-Specific Emission Rate (Q)
The COPC-specific emission rate from the stack, prior to any applicable adjustments (e.g., upset
emissions scaling, revisions based on hours of operation, feed rate adjustments, etc.) is a function of the
stack gas flow rate and the stack gas concentration of each COPC. It can be calculated from the
following equation:
Equation 3-3
where
Q
SGF
=
=
COPC-specific emission rate (g/s)
Stack gas flow rate at dry standard conditions (dscm/s)
U.S. EPA Region 6
Multimedia Planning and Permitting Division
Center for Combustion Science and Engineering
U.S. EPA
Office of Solid Waste
3-59
Human Health Risk Assessment Protocol
Chapter 3: Air Dispersion and Deposition Modeling
SGC
=
CFO2 =
1 x 106 =
September 2005
COPC stack gas concentration at 7 percent O2 as measured in the trial burn
(:g/dscm)
Correction factor for conversion to actual stack gas concentration O2 (unitless)
Unit conversion factor (:g/g)
Guidance for adjusting COPC-specific emission rates, as well as determining emission rates for fugitive
emission sources, is available in Chapter 2. Also, it is sometimes necessary to derive the COPC-specific
emission rate from surrogate data, such as for a new facility that has not yet been constructed and trial
burned (see Chapter 2).
3.8.1.2 Converting Unit Output to COPC-Specific Output
Once three of the four variables in Equation 3-1 are known, you can derive the COPC-specific air
concentrations and deposition rates by multiplying as follows:
Equation 3-4
For example, if COPC A is emitted at a rate of 0.25 g/s, and the ISCST3 modeled concentration at a
specific receptor grid node is 0.2 µg/m3 per the 1.0 g/s unit emission rate, the concentration of COPC A
at that receptor grid node is 0.05 µg/m3 (0.25 multiplied by 0.2). Calculating deposition is similarly
proportional to the emission rate of each COPC. You are reminded once again that the process of
converting modeled unitized output into COPC-specific output is taken directly into account in the
estimating media concentration equations in Chapter 5 and Appendix E.
3.8.2
ISCST3 Model Output
It is important that the risk assessor understand how to read the ISCST3 output structure, in order to
ensure accurate use of modeled output in the risk assessment. The output from each ISCST3 model run
is written to two separate file formats. The ‘output summary file’ is specified by name at run time in the
execution command. Typical command line nomenclature is:
ISCST3 inputfile.INP outputfile.OUT
U.S. EPA Region 6
Multimedia Planning and Permitting Division
Center for Combustion Science and Engineering
U.S. EPA
Office of Solid Waste
3-60
Human Health Risk Assessment Protocol
Chapter 3: Air Dispersion and Deposition Modeling
September 2005
where
ISCST3 :
inputfile.INP :
outputfile.OUT :
specifies executing the ISCST3 model
is the input file name you (the modeler) select
is the output summary file name you select, typically the same as the
input file name (but with a different suffix)
For example, the following ISCST3 input line would run the input file (PART84R.INP) created by the
modeler for particulate emissions using 1984 meteorological data on the receptor grid. ISCST3 will
automatically write the output summary file (PART84R.OUT) during execution.
ISCST3 PART84R.INP PART84R.OUT
You specify the second file format, the output ‘plot file,’ in the ISCST3 input file OUtput pathway.
ISCST3 creates it during the run (see Section 3.6.6). The “plot file” is typically then imported into a
post-processing program (e.g. a spreadsheet) before entry into the risk assessment computations.
Vapor phase and Particle-bound phase runs produce similar plot files. The plot files for the vapor phase
runs will include average concentrations and wet deposition rates. The plot files for the particle and
particle-bound phase runs will include average concentrations, dry depositions, wet depositions and total
depositions. You can average the 1-year values at each receptor grid node for a 5-year value at each
node, unless a single five-year ISCST3 run using a combined meteorological file is used. If you use the
5-year combined file, the risk assessor can use the results from the ISCST3 plot file directly in the risk
assessment without averaging over the five years. All values are used in the estimating media
concentration equations (see Chapter 5).
3.8.3
Using Model Output to Estimate Media Concentrations
Section 3.2 discussed how partitioning of the COPCs affects the development of ISCST3 modeling runs.
The choices of which modeled air parameter values (air concentrations and deposition rates) to use in the
estimating media concentration equations is based on this same partitioning theory.
3.8.3.1 Vapor Phase COPCs
ISCST3 generates the following output for vapor phase air modeling runs:
U.S. EPA Region 6
Multimedia Planning and Permitting Division
Center for Combustion Science and Engineering
U.S. EPA
Office of Solid Waste
3-61
Human Health Risk Assessment Protocol
Chapter 3: Air Dispersion and Deposition Modeling
•
vapor phase air concentrations (unitized Cyv and unitized Cywv),
•
dry vapor deposition (unitized Dydv), and
•
wet vapor depositions (unitized Dywv and unitized Dywwv)
September 2005
for organic COPCs at receptor grid nodes based on the unit emission rate. These values are used in the
estimating media concentration equations for all COPC organics except the polycyclic aromatic
hydrocarbons (PAHs) dibenzo(a,h)anthracene and indeno(1,2,3-cd)pyrene2 . The air concentration
(unitized Cyv), dry vapor deposition (unitized Dydv), and wet vapor deposition (unitized Dywv) from the
vapor phase run is also used in the estimating media concentration equations for mercury. You select
values for these COPCs from the vapor phase run because the mass of the COPC emitted by the
combustor is assumed to have either all or a portion of its mass in the vapor phase (see Appendix A-3).
3.8.3.2 Particle Phase COPCs
ISCST3 generates the following output for particle phase air modeling runs:
•
air concentration (unitized Cyp),
•
dry deposition (unitized Dydp),
•
wet deposition (unitized Dywp), and
•
combined deposition (unitized Dytwp)
for inorganics and relatively non-volatile organic COPCs at receptor grid nodes based on the unit
emission rate. These values are used in the estimating media concentration equations for all COPC
inorganics (except mercury, see Chapter 2 and Appendix A-3) and polycyclic aromatic hydrocarbons
with fraction of vapor phase, Fv , less than 0.05 (e.g., dibenzo(a,h)anthracene and
indeno(1,2,3-cd)pyrene). You choose values for inorganic and relatively non-volatile COPCs from the
particle phase run because the all the mass of the COPC is assumed to be in the particulate phase (see
Appendix A-3). The mass is apportioned across the particle size distribution based on mass weighting.
2
These two PA Hs have vapor pha se fractions, Fv, less than five percent .
U.S. EPA Region 6
Multimedia Planning and Permitting Division
Center for Combustion Science and Engineering
U.S. EPA
Office of Solid Waste
3-62
Human Health Risk Assessment Protocol
Chapter 3: Air Dispersion and Deposition Modeling
September 2005
3.8.3.3 Particle-Bound COPCs
ISCST3 particle-bound runs generate the following output:
•
air concentration (unitized Cyp),
•
dry deposition (unitized Dydp),
•
wet deposition (unitized Dywp), and
•
combined deposition (unitized Dytwp)
for organic COPCs and mercury (see Chapter 2 and Appendix A-3) at each receptor grid node. Use these
values in the “estimating media concentration” equations to account for the portion of the vapor
condensed onto particulate surfaces. Select values for these COPCs from the particle-bound run because
the mass of the COPC emitted by the combustor is assumed to have a portion of its mass condensed on
particulates (see Appendix A-3). ISCST3 uses surface area weighting to apportion the particle-bound
mass across the particle size distribution.
3.9
MODELING FUGITIVE EMISSIONS
The procedures presented in this chapter for modeling stack source emissions are also effective for
modeling fugitive source emissions, as defined in Chapter 2. However, you can represent fugitive
emissions in the ISCST3 input file SOurce pathway as either “area” or “volume” source types. Model
fugitive emissions of volatile organics only in the vapor phase. Model fugitive emissions of ash only in
the particle and particle-bound phases, not vapor phase.
As discussed in Chapter 2, fugitive emissions of volatile organic vapors are associated with combustors
that include storage vessels, pipes, valves, seals and flanges. Enter the horizontal area of the fugitive
source into the ISCST3 input file according to the instructions found in the ISC3 User’s Guide, Volume I
(U.S. EPA 1995f). You can get the horizontal area from the facility plot plan. The height of the fugitive
source is defined as the top of the vertical extent of the equipment. If the vertical extent isn’t known, you
can use a default height of ground level (release height of zero). This provides a protective estimate of
potential impacts. The ISCST3 model run time is faster for volume source types than for area source
types. We generally recommend considering the volume source type for most applications. We
U.S. EPA Region 6
Multimedia Planning and Permitting Division
Center for Combustion Science and Engineering
U.S. EPA
Office of Solid Waste
3-63
Human Health Risk Assessment Protocol
Chapter 3: Air Dispersion and Deposition Modeling
September 2005
recommend following the methods in the ISCST3 User’s Guide to define the input parameters
representing the fugitive source.
The following example is for organic fugitive emissions only (modeling only vapor phase emissions)
modeled as a volume source type. The example includes a facility with two stack emission sources (B1,
B2) and two fugitive emission sources (areas F1, F2). A total of four runs for each year (or 5-year
combined file) of meteorological data is needed.
Plot Plan
B1
B2
ISC3 Volume
F1A F1B
F1
F1C
F1D
F2
Perform one run for each of the two stacks as point sources. Perform one run for each of the two fugitive
areas as volume sources (Note: or you could model as area sources). Since the emissions are fugitive
volatile organics, model only the vapor phase. The vertical extent of the pipes, valves, tanks and flanges
associated with each fugitive emission area is 15 feet (about 5 meters) above plant elevation. To define
the sources for input to ISCST3, specify the release height as 2.5 meters (½ of vertical extent of fugitive
emissions). Specify the initial vertical dimension as 1.16 meters (vertical extent of 5 meters divided by
4.3, as described in the ISC3 User’s Guide).
The initial horizontal dimension is the side length of the square fugitive area (footprint) divided by 4.3. If
fugitive area F2 has a measured side of 30 meters, the initial horizontal dimension is 6.98 (30 meters
divided by 4.3). For fugitive area F1, subdivide the area on the plot plan (ISC3 Volume) to create square
areas for input to ISCST3. The four areas depicted represent subdivision into square areas. Fugitive
source F1 is input into a single ISCST3 run as four separate volume sources (F1A, F1B, F1C, F1D). The
initial horizontal dimension for each volume source is the side of the square divided by 4.3.
It is very important to allocate the unit emission rate (1.0 gram per second) proportionately among the
subdivided areas. For example, if the areas of the subdivided squares in the ISC3 Volume figure results
in F1A equal to F1B each with 1/8th the total area, the proportion of the unit emissions allocated to each
U.S. EPA Region 6
Multimedia Planning and Permitting Division
Center for Combustion Science and Engineering
U.S. EPA
Office of Solid Waste
3-64
Human Health Risk Assessment Protocol
Chapter 3: Air Dispersion and Deposition Modeling
September 2005
of these volume sources is 0.125 grams per second. The remaining two areas are each 3/8ths of the total
area of fugitive F1, so that 0.375 grams per second is specified for the emission rate from each source.
The total emissions for the four volume sources sum to the unit emission rate for the F1 fugitive source
(0.125 + 0.125 + 0.375 + 0.375 = 1.0 g/s).
If you tell ISCST3 to include all sources in the model results (SO SRCGROUP ALL), the model will
appropriately combine all four volume source subdivisions into combined impact results for fugitive
source F1. You can use the resulting air parameter values in the plot files directly in the risk assessment
equations, the same as if the emissions were modeled as a single point source. The initial vertical
dimension is defined the same as F2, using the vertical extent of 5 meters divided by 4.3 and a release
height of 2.5 meters (½ vertical extent). For volume sources, the location is specified by the x and y
coordinates of the center of each square area.
The COntrol parameters can follow the recommendations for setting up a vapor phase computation.
CO CONC WDEP
Fugitive emissions of ash particles are from the storage piles associated with combustion units. Enter the
horizontal area of the storage pile into the ISCST3 input file according to the ISCST3 User’s Guide,
Volume I (U.S. EPA 1995f). The height of emissions is the top of the pile. If you don’t know the
vertical extent, you could use ground level (or zero height). You’ll typically model fugitive ash as area
source type. However, the permitting authority might consider volume source type prior to air modeling.
We generally recommend following the methods in the ISCST3 User’s Guide when defining the input
parameters to represent the ash release as an area source.
We recommend the COntrol parameters follow the recommendations for setting up a particulate phase
computation.
CO CONC DDEP WDEP DEPOS
We recommend documenting the emissions characterization and source type.
U.S. EPA Region 6
Multimedia Planning and Permitting Division
Center for Combustion Science and Engineering
U.S. EPA
Office of Solid Waste
3-65
Human Health Risk Assessment Protocol
Chapter 3: Air Dispersion and Deposition Modeling
3.10
September 2005
MODELING ACUTE RISK
It might be important for you to evaluate the acute, or short-term, effects due to the direct inhalation of
vapor phase, particle phase and particle-bound phase COPCs in the risk assessment. We recommend
considering site- or unit-specific factors such as unit operating conditions during emissions testing,
emission rates to be used in the acute screen, exposure scenario locations, etc. (see Sections 2.2.1, 4.2,
4.3, and 7.5) prior to conducting air modeling for an acute evaluation.
Since only ambient air concentrations are included in the direct inhalation pathway, You can compute the
air parameters needed for a screening acute assessment in the same ISCST3 runs (i.e., same input values
for meteorological data, stack gas exit temperature and velocity, etc.) that compute the air parameters for
the long-term chronic effects. However, as with chronic modeling, a non-steady state dispersion model
(e.g., CALPUFF) might provide a more representative estimate of concentration and deposition. This is
because of differences in methodology for modeling time-varying emissions and time- and space-varying
meteorological fields.
Methods outlined in this section focus on supporting a screening type acute assessment using the existing
air modeling runs executed for the chronic risk assessment. However, it is important to note that while
this approach provides some obvious efficiencies with regard to air modeling, you might need to execute
separate air modeling runs. For example, you might consider site- or unit-specific characteristics
(i.e., conditions of most concern for a short term or acute release scenario) in order to provide the most
protective or appropriate acute assessment. As discussed in Section 3.1, site-specific conditions and
assessment objectives might result in your choosing a different air model for the acute portion than for
the chronic assessment.
In air modeling for an acute type assessment, the goal is typically to compute the highest 1-hour average
air concentration for each phase (particle-bound, etc) for each source, for the entire period of analysis. In
most cases, this period is the five years of meteorological data. For ISCST3 to identify the highest
one-hour average concentration at each grid node, we recommend making two specifications in the
ISCST3 input files.
U.S. EPA Region 6
Multimedia Planning and Permitting Division
Center for Combustion Science and Engineering
U.S. EPA
Office of Solid Waste
3-66
Human Health Risk Assessment Protocol
Chapter 3: Air Dispersion and Deposition Modeling
September 2005
First, you must specify the 1-hour average as one of the averaging times in the COntrol pathway. The
example of this specification is included in Section 3.6.1. The ISCST3 input file includes:
CO AVERTIME 1 ANNUAL
where “1" specifies the 1-hour averaging time ISCST3 computes for each hour of meteorological data.
Remember that the ‘ANNUAL’ is specified for the chronic effects.
Second, we recommend that the OUtput pathway include the specification of a 1-hour average plot file
which contains the highest 1-hour concentration at each receptor grid node for all the hours evaluated in
the ISCST3 run. For a single year run, the 1-hour concentration reported in the plot file is the highest
value computed at each x, y grid node location for the total hours in the year (8760, or 8784 for leap
years). The acute risk assessment needs the highest 1-hour concentration for the 5-year period. We
recommend reviewing each of the five single year values to identify the highest for all five years at each
receptor grid node. However, if you run a combined 5-year meteorological input file, the resulting plot
file will already identify the highest value for the 5-year period at each grid node with no additional
processing needed. The OUtput pathway instructions to create the plot file for one-hour average
concentrations are:
OU PLOTFILE 1 ALL FIRST BTR841.PLT
where
1:
ALL:
FIRST:
specifies the 1-hour averaging period,
instructs ISCST3 to include all sources in the run,
instructs the model to include only the first highest value at each
receptor grid node, and
BTR841.PLT: is the name for the plot file.
The plot file name is unique for the run and the one-hour averaging period results.
The highest air concentration for the 1-hour averaging period is input as the air parameters, Chv, Chp,
and Chpb in the acute risk assessment equations (see Section 7.5 and Appendix B, Table B-6-1).
U.S. EPA Region 6
Multimedia Planning and Permitting Division
Center for Combustion Science and Engineering
U.S. EPA
Office of Solid Waste
3-67